CalGIS 2012 Conference Proceedings
582
18 th ANNUAL GIS CALIFORNIA CONFERENCE PROCEEDINGS The following abstracts/presentations were presented during the conference and were submitted by the presenters for inclusion in this PROCEEDINGS publication. Click on the title you wish to view to go to the presentation Overcoming Obstacles with Free Web Mapping Tools Michelle Bilodeau, REHS, San Mateo County Environmental Health, San Mateo, CA Low Cost GIS with Open Source Software and Mobile Data Collection Landon Blake, Redefined Horizons, Stockton, CA Bicycle Network Design Maaza Mekuria, Ph.D., PE, PTOE, ADEC, San Jose, CA Update of the US Census Bureau Geographic Support System Linda Akers Smith, US Census Bureau, Northridge, CA NGS Publishes New Geodetic Coordinates: Are They Still in NAD83? Past, Present, Future Marti Ikehara, National Geodetic Survey/NOAA, Sacramento, CA Parcel Data in California: Where are we? Karen Beardsley, Ph.D, Information Center for the Environment (ICE), Davis, CA Crop Classifications in Stanislaus County Using GIS and Remote Sensing Ramesh Gautam, California Department of Water Resources, Sacramento, CA Providing Refined Crop Coefficients to Improve Water Resource Planning Online Kris Lynn-Patterson, University of California- Kearney Agricultural Research & Extension, Parlier, CA Byron Clark, Davids Engineering, Inc/SEBAL N. AM., Inc, Davis, CA BAT files...Applying the Ancient/Lost Art of BAT files to Manage Modern GIS Issues Michael Hickey, Tulare County Resource Management Agency/GIS, Visalia, CA Philanthropic Grantmaking and Versatility of GIS Technology Juhyun Yoo, MPA, Advancement Project, Los Angeles, CA Space/Time Analysis in the Presence of ZIP Code Misalignment Research for and preparation of this presentation was supported by NIDA Grant R21 DA024341 and NIAAA Center Grant P60 AA 006282 to Dr. Gruenewald Lillian Remer, MA, GISP, Prevention Research Center, Berkeley, CA An Alternative Model for GIS Supporting Data Driven Decision Making Across Agencies Steve Spiker, GISP, Urban Strategies Council, Oakland CA A Geospatial Suitability Model for Second Generation Biofuels Sarah Lewis, Ph.D. Candidate, University of California Berkeley, Berkeley, CA Screening Potential Renewable Energy Sites Using GIS Mark McGinnis, GISP, DUDEK, Encinitas, CA Modifying Hazus for Tribal/Local/Rural Use Rachel Rodriguez, B.S. in NRPI-GIS, Hazus-MH Practitioner, Yurok Tribe, Hoopa, CA Mapping of Streams and Passage Barriers for Ocean to Headwaters Salmon Migration Martina Koller, GISP, Pacific States Marine Fisheries Commission, Sacramento, CA Case Study of Web-based Collaboration Tools in Natural Resource Management Lisa Lubeley, GISP, DUDEK, Encinitas, CA GIS Integration with Document Management Keith Russell, Ramona Municipal Water District, Ramona, CA
-
Upload
urisa-the-association-for-gis-professionals -
Category
Documents
-
view
439 -
download
20
Transcript of CalGIS 2012 Conference Proceedings

18th ANNUAL GIS CALIFORNIA CONFERENCE PROCEEDINGS
The following abstracts/presentations were presented during the conference and were submitted by the presenters for inclusion in this PROCEEDINGS
publication. Click on the title you wish to view to go to the presentation
Overcoming Obstacles with Free Web Mapping Tools Michelle Bilodeau, REHS, San Mateo County Environmental Health, San Mateo, CA Low Cost GIS with Open Source Software and Mobile Data Collection Landon Blake, Redefined Horizons, Stockton, CA Bicycle Network Design Maaza Mekuria, Ph.D., PE, PTOE, ADEC, San Jose, CA Update of the US Census Bureau Geographic Support System Linda Akers Smith, US Census Bureau, Northridge, CA NGS Publishes New Geodetic Coordinates: Are They Still in NAD83? Past, Present, Future Marti Ikehara, National Geodetic Survey/NOAA, Sacramento, CA Parcel Data in California: Where are we? Karen Beardsley, Ph.D, Information Center for the Environment (ICE), Davis, CA Crop Classifications in Stanislaus County Using GIS and Remote Sensing Ramesh Gautam, California Department of Water Resources, Sacramento, CA Providing Refined Crop Coefficients to Improve Water Resource Planning Online Kris Lynn-Patterson, University of California- Kearney Agricultural Research & Extension, Parlier, CA Byron Clark, Davids Engineering, Inc/SEBAL N. AM., Inc, Davis, CA BAT files...Applying the Ancient/Lost Art of BAT files to Manage Modern GIS Issues Michael Hickey, Tulare County Resource Management Agency/GIS, Visalia, CA Philanthropic Grantmaking and Versatility of GIS Technology Juhyun Yoo, MPA, Advancement Project, Los Angeles, CA Space/Time Analysis in the Presence of ZIP Code Misalignment Research for and preparation of this presentation was supported by NIDA Grant R21 DA024341 and NIAAA Center Grant P60 AA 006282 to Dr. Gruenewald Lillian Remer, MA, GISP, Prevention Research Center, Berkeley, CA An Alternative Model for GIS Supporting Data Driven Decision Making Across Agencies Steve Spiker, GISP, Urban Strategies Council, Oakland CA A Geospatial Suitability Model for Second Generation Biofuels Sarah Lewis, Ph.D. Candidate, University of California Berkeley, Berkeley, CA Screening Potential Renewable Energy Sites Using GIS Mark McGinnis, GISP, DUDEK, Encinitas, CA Modifying Hazus for Tribal/Local/Rural Use Rachel Rodriguez, B.S. in NRPI-GIS, Hazus-MH Practitioner, Yurok Tribe, Hoopa, CA Mapping of Streams and Passage Barriers for Ocean to Headwaters Salmon Migration Martina Koller, GISP, Pacific States Marine Fisheries Commission, Sacramento, CA Case Study of Web-based Collaboration Tools in Natural Resource Management Lisa Lubeley, GISP, DUDEK, Encinitas, CA GIS Integration with Document Management Keith Russell, Ramona Municipal Water District, Ramona, CA

Utilizing GIS for CEQA, Aesthetics and Visual Simulations Dave Krolick, MA, ECORP Consulting, Inc., Rocklin, CA City of Merced Weed Abatement Program 2011 RuthAnne Harbison, CNE, GISP, City of Merced, Merced, CA The Good and Bad Aspects of Using Tablets for Field Data Viewing and Capture Colin Hobson, Munsys, Rocklin, CA Census 2010 data Highlight Changing Demographics Chris Ringewald, BA, Msc, Advancement Project, Los Angeles, CA GIS Support of Growing Strong Neighborhoods Initiative Mark Dumford, City of Rancho Cordova, Rancho Cordova, CA HealthyCity.org: Web GIS for Social Change Chris Rengewald, BA, Msc, Advancement Project, Los Angeles, CA Federal Overview of Geospatial Programs for Homeland Security Terrence Newsome, HIFLD to the Regions, Sacramento, CA GIS Activities USFS Region 5 Fire & Aviation Management 2012 Lorri Peltz-Lewis, GISP, ASPRS GIS/LIS, U.S. Forest Service, Pacific Southwest Region, McClellan, CA Deep Dive into GeoDataSpace and its Potential Use in Interagency Data Access Tom Heinzer, GISP, USBR, Sacramento, CA Diane Williams, USBR, Sacramento, CA Web Enabling Local Government GIS Projects - A No-Nonsense Guide Steve Bein, GISP, PE, RBF Consulting, Irvine, CA Rick Hendrickson, GISP, RBF Consulting, Irvine, CA Streamlining Landbase: A City’s Evolving Design Marc Ball, City of Roseville, Roseville, CA Baydeltalive.com: A Collaborative Approach to Managing Our Data and Natural Resources Amye Osti, MBA, 34 North, San Luis Obispo, CA Public Access to County GIS Basemap Data: The Supreme Decision Bruce Joffe, GISP, GIS Consultants, Piedmont, CA Turning BeachWatch Data into Information Larry Cooper, Msc, Southern California Coastal Water Research Project, Costa Mesa, CA Geospatial Field Data Collection in the World of "Apps" Adam Lodge, Farallon Geographics, San Francisco, CA Jeff Smith, Farallon Geographics, San Francisco, CA Is Mobile the Future of GIS? Matt Sheehan, WebMapSolutions, Salt Lake City, UT LiDAR 101: Utility Corridor Compliance and Vegetation Clearance Methods Carrie Munill, GIS Analyst, Tetra Tech, Lafayette, CA When the floodwaters are rising, who’ll do the maps? Christina Boggs, California Department of Water Resources, Sacramento, CA Cartograph.com: Cloud-GIS for “Everyone Else” Timothy Tierney, Cartograph, Inc., Santa Barbara, CA Information Rules: Communicating with Residents in the Google Era Benjamin Webb, Digital Map Products, Irvine, CA Closing Keynote Address Presentation Dr. Dawn Wright, Chief Scientist at Esri, Redlands, CA

Overcoming ObstaclesOvercoming Obstacles with Free Web Mapping Toolswith Free Web Mapping Tools
Michelle Bilodeau, MA, REHSEnvironmental Health Services Division
San Mateo County Health System

Navigation
About:
Environmental Health
Beach Monitoring Program
Business Needs & Challenges
GIS Solutions – ArcGIS Online
Lessons Learned
Presenter
Presentation Notes
Where are we going in this presentation: A little bit about San Mateo County Environmental Health And then about a subset of what we do – the Beach and Creek Monitoring Program Business Needs pertaining to GIS Challenges to Implementing an integral GIS GIS Solutions using ArcGIS Online Lessons learned and next steps for organization

SMCo Environmental Health
Handle a variety of services to ensure a safe, healthy environment
Regulate facilities and features such as:
Retail and mobile restaurant facilities
Public housing (apartments, hotels, farm labor)
Body art and massage facilities
Public swimming pools
Recreational waters
Presenter
Presentation Notes
-- San Mateo County is located between San Francisco and Santa Clara Counties in the Bay Area -- In all we have about 80 staff members When you hear Health Department, think of Health Inspectors at restaurants But we regulate many other types of industry, such as: Housing Massage and tattoo parlors Underground Storage Tanks And Recreational Waters

Beach and Creek MonitoringBeach and Creek Monitoring
37 monitoring locations
Sites monitored weekly
Indicator organisms
Total Coliform,
E. coli
Enterococci
Largely volunteer based
Presenter
Presentation Notes
San Mateo County has two coastlines – pacific and bayside Sample select group of natural recreational waters in county on a weekly basis Total of 37 sites Site selection largely based on the estimated population that annually visits beach Monitor beaches and creek mouths at beaches – WHY (calmer, warmer waters) – increased exposure Monitor the sample for three indicator bacteria – Total Coliform, E. coli, and Enterococci. Limited funding comes from Federal grants passed down to State Collected by Volunteers; minimal EH staff Analyzed by County Health Lab

Advisory WarningsAdvisory Warnings
Presenter
Presentation Notes
If concentrations of indicator bacteria exceed State or County standards, the area is posted to warn users that they may become ill if they engage in water contact activities in the posted area. There are times in which a beach or other water body may be posted as Closed such as in the event of a sanitary sewer overflow. Threshold levels – 10,000 mpn/100 ml Total Coliform 400 mpn/100 ml for E. coli 105 mpn/100 ml for Enterococci Also geometric mean threshold levels

Locating Monitoring SitesLocating Monitoring Sites
Where is Pillar Point #7?
Where is Calera Creek?
Do you have a map??
Presenter
Presentation Notes
Currently EH sends out results by: Listing sites that are posted on our website and on hotline E-mail is sent out with posted sites and monitoring result data The way that we were communicating results to the public and other agencies were problematic: -- no map illustrating location of monitoring sites -- unless familiar with site locations, public unaware of where monitoring conducted - If you are not sure where a site is located, how can you avoid it? -- only data for monitoring sites with an advisory warning available -- people are interested in all of our data – not just which sites are posted with an advisory sign. Usually every week we get phone calls or e-mails from people wanting to know where these sites are and if we have a map.

Failed Attempts
Institutional attitudes
Overlooked potential of a GIS
Allocation of resources
Integration with DBMS
Presenter
Presentation Notes
Digress for a second before getting into project Previous attempts to implement a GIS in our organization have failed for various reasons. �Main reasons include: Institutional attitudes Lack of buy-in from management (too expensive and time intensive) Overlooked potential of GIS: -- “Why do we need a GIS? We can survive without it” Allocation of resources -- main issues are funding and devoted staff time Integration with our Database Management System -- GIS efforts have not been integrated with database (side project) -- data quickly becomes inaccurate, dated and not reflective of current situation

Business NeedsBusiness Needs
Use a GIS to:
Spatially display beach and creek monitoring locations to inform public
Demonstrate value of GIS
Presenter
Presentation Notes
Background to project: Tie beach and creek monitoring data with spatial location on a map Make data and location available to the public for monitoring sites Let’s public know which beaches are unsafe for recreational uses (e.g. swimming, surfing) Most importantly, wanted a good example of how GIS can be used in Environmental Health Spark ideas of other ways GIS can be used with public health data Increase buy-in from managers and staff

Two GIS SolutionsTwo GIS Solutions
Short-term:Use of ArcGIS Online’s web mapping tools to display weekly monitoring results
Long-term:Producing an application that automates weeklyresults and displays in a GIS
Presenter
Presentation Notes
Worked with County GIS and an excellent intern to come up with two solutions. County uses both ArcGIS and GeoMedia but because of red-tape in putting a dataset into production, we saw ArcGIS Online as a quick and easy solution to publicly publish a small dataset. First short term project is to get the data out to the public using ArcGIS Online to display beach monitoring results -- Talk about this today -- Long-term approach is more sophisticated and will automate lab results

Short-term Solution: ArcGIS Online (AGO)
“Cloud-based, collaborative management system for maps, apps, data and other geographic information”
Utilize free AGO web maps to publish data
Mashup with other data available
Attributes enhanced by pop-up windows
Share maps with others through web, social media
Supports open standards (.shp, .kml)
Data is secure
Presenter
Presentation Notes
About ArcGIS On-line: -- is a cloud-based, collaborative content management system for maps, apps, data, and other geographic information -- free user account (for additional services there is a subscription – see below – up to 2 GB of space) -- web map contains a base map – add your data to it -- basemap contains extent, legend, navigation tools -- basemap gallery to switch between maps like imagery and streets -- can utilize pop-up windows to display attributes about a specific feature -- also has feature to play data over time. How it works: -- Web maps constructed using data layers from services and files to communicate a specific message or provide specific map-based capabilities. -- is open and supports multiple open standards, including shapefiles (see below) -- multiple clients – mobile, desktop, web applications Security: -- the map service remains on a secure server, and the data is secure (on your GIS server) -- the map application that frames the data may comes from anywhere Additional services: ArcGIS Online is expanding into an additional subscription-based service that is currently in beta-testing. Other formats: Open Geospatial Consortium, Inc., Web Map Service (WMS); KML; and the native map services from ArcGIS Server. Maps and geoprocessing services can be accessed using the open REST protocol. Performance: -- recommended that you use Mozilla Firefox 2 and higher, Google Chrome, or Internet Explorer 9 or higher. -- Internet Explorer 7 and 8 are supported but have performance limitations when working with web maps. -- If you need to use IE 7 or 8, installing Google Chrome Frame may improve your experience. -- The free Chrome plug-in allows your older browser to take advantage of newer web technologies in applications such as the map viewer. -- Projection in ArcGIS Online is WGS84

Creating the Dataset
Presenter
Presentation Notes
Creating a dataset to use in ArcGIS Online can be very easy. We have used an Excel sheet to enter in the weekly monitoring data. Each monitoring site is a record and Each of the three tests is represented as a separate field This way the site is represented as a point with three fields for the monitoring results The sites are represented as points through geographic coordinates

Adding Data to ArcGIS Online
1. Choose area by zooming to it
2. Choose what to show
• Choose basemap
• Add layers
3. Create an editable layer to draw features on map
4. Save and share map
Resources:
ArcGIS Online:
http://www.arcgis.com/home/webmap/viewer.html
Using Google Documents: http://bit.ly/Ih3tj7
Presenter
Presentation Notes
Adding Data to ArcGIS Online is pretty straightforward and doesn’t require ArcGIS software Simple steps: Go to ArcGIS Online and create new web map – will require you to create free account 2. Choose area you want to show by zooming in -- choose basemap (satellite imagery, street maps, topography) -- add layers (either by finding layers already created or adding yours) 3. Create an editable layer to draw features on the map or alter symbology, text through pop-up windows 4. Save an share your map Your data remains secure Web map has a unique map key Share web map through HTML code

Presenter
Presentation Notes
By going to ArcGIS Online, you can find our beach and creek water quality monitoring map by searching for tags “mateo” and “beach” A user can add tags when creating a map. Tags are important for people to find your maps and work like HTML tags. The web map is pretty easy to use. There are tools such as pan, zoom to navigate around the map. Choose symbology – we used flags For our beach and creek monitoring sites we have flags to represent whether the sites are posted with advisory warning signs -- Red means posted -- Green means safe to use Easily done by inputting data into an Excel worksheet and connecting to monitoring locations using ArcGIS software. Use basemaps in ArcGIS Online to display data

Presenter
Presentation Notes
Can have legend that is docked or hidden

Presenter
Presentation Notes
By clicking on a feature, in this case one of the flags, a pop-up window appears providing more information about the monitoring location. In this case, the beach is posted with a warning sign because bacteria levels are elevated. Point out the Site Description -- added url as a column in Excel sheet that points to Picasa Web Album

Presenter
Presentation Notes
By clicking on a link within the pop-up box, users can see pictures of the site and obtain more information. We created a Picasa web album (which is also free) and embedded the link to the web album in our Excel data sheet They can also see what the area looks like by changing the imagery to satellite in ArcGIS Online

Presenter
Presentation Notes
ArcGIS Online also allows for creating editable layers Here I have drawn attention to where I want a volunteer that is unfamiliar with location to collect a sample. This way I don’t have to train him in the field AGO also has themes of layers that you can use such as parks, oil and gas infrastructure You can also create your own (points, lines polygons) and add text ArcGIS Online Explorer now allows you to perform selections and run simple queries

Sharing Web Maps
Presenter
Presentation Notes
AGO allows users to share maps with others. Click Share button Can decide to use who you want to share map with – public, only other users

The GIS “Spark”
• Restaurants with an excellent health status
• Locating neighborhoods with lead paint
• Proximity of septic systems to drinking water wells
• Facility storage locations of hazardous materials
• Identifying hotspots for illegally disposed chemicals
• Equitable distribution of inspector inventory
• Storm drain locations near food facilities
Presenter
Presentation Notes
Not here to sell ArcGIS Online. -- Some kinks in such as browser issues and rendering problems BUT, this project has been good for us because: -- allowed us to pilot a project -- satisfy a business need in the short-term -- increased buy-in from management and staff -- people beginning to see value of GIS and think of other applications -- started to think about other applications such as locating restaurants in a one mile area with an excellent health status

Questions?
Michelle Bilodeau, REHSSan Mateo County Health System
Environmental Health(650) 372-6204

4/19/2012
1

4/19/2012
2

4/19/2012
3

4/19/2012
4

4/19/2012
5

4/19/2012
6

4/19/2012
7

4/19/2012
8

4/19/2012
9

4/19/2012
10

4/19/2012
11

4/19/2012
12

4/19/2012
13

4/19/2012
14

5/8/2012
1
Bicycle Network Modeling
Maaza Mekuria, PhD, PE, PTOEPeter G. Furth, PhDHil Ni PhD
CalGIS 2012 1
Hilary Nixon, PhDCalGIS 2012
Sacramento, CA
Objectives of Research
• Classify Streets using Design Metrics • Examine Network Connectivity• Compute Trip characteristics• Evaluate Alternatives
CalGIS 2012 2

5/8/2012
2
Data Used
• Metro San Jose Street Network • San Jose Parcel Data• Census TAZ Polygons • Census Block Data• TAZ Trip Data
CalGIS 2012 3
GIS Analysis Tools
• Quantum GIS (QGIS) • SQLite and Spatialite• Custom QGIS Plugin Software in C++ • External Processing Tools in C++
CalGIS 2012 4

5/8/2012
3
Block Centroid Street Network Connectivity
CalGIS 2012 5
San Jose Street Network Stress Classification
CalGIS 2012 6

5/8/2012
4
San Jose Street Network Stress Level 1
CalGIS 2012 7
San Jose Street Network Stress Level 2
CalGIS 2012 8

5/8/2012
5
San Jose Street Network Stress Level 3
CalGIS 2012 9
San Jose Street Network Stress Level 4
CalGIS 2012 10

5/8/2012
6
SJ Street Network No Intersection Effect
CalGIS 2012 11
SJ Street Network With Intersection Effect
CalGIS 2012 12

5/8/2012
7
Level of Traffic Stress 1 (LTS 1) Islands
CalGIS 2012 13
Level of Traffic Stress 2 (LTS 2) Islands
CalGIS 2012 14

5/8/2012
8
SJSU Rooted Tree LTS 2
CalGIS 2012 15
SJCC Rooted Tree LTS 2
CalGIS 2012 16

5/8/2012
9
Proposed Improvements
CalGIS 2012 17
Improved Network LTS 2
CalGIS 2012 18

5/8/2012
10
Unimproved Network LTS 2 Circuitous Paths
CalGIS 2012 19
Unimproved Network LTS 2 Circuitous Paths
CalGIS 2012 20

5/8/2012
11
Improved Network Paths LTS 2 to 4
CalGIS 2012 21
Acknowledgement
• This research was supported by the Mi t T t ti I tit tMineta Transportation Institute at San Jose State University
CalGIS 2012 22

The Geographic Support System Initiative
Linda Akers SmithU.S. Census Bureau
[email protected](818) 267-1724
CALGIS ConferenceApril 12, 2012

For the 2020 Census – The GSS Initiative
For the 2010 Census – conducted the MAF/TIGER Enhancement Program
For the 2000 Census – Introduced the MAF (Master Address File)
Census Geographic Support –Major Initiatives Over Time
For the 1990 Census – Introduced TIGER (Topologically Integrated Geographic Encoding and Referencing system)

‘Why’ the GSS Initiative?
• Stakeholder and oversight recommendations:– The General Accountability Office, the Office of the Inspector General, and the National Academies of Science identified as issues:
• The lack of a comprehensive geographic update program between censuses
• Associated negative impact on ongoing programs such as the American Community Survey, other current surveys, and small areas estimates programs

Why the GSS Initiative?• A logical next step, building upon:
Accomplishments of the MAF/TIGER Enhancement Program (MTEP)MAF/TIGER Accuracy Improvement Project (MTAIP) Improved positional accuracy of TIGER
Contributions of our partners GIS files & imagery between 2003 to 2008 for MTAIP 2010 Local Update of Census Addresses (LUCA) Program
The recommendations of our stakeholder and oversight communities
• Supports a targeted Address Canvassing in preparation for the 2020 Census

What is the GSS Initiative?
Quality MeasurementStreet/Feature
UpdatesAddress Updates
123 Testdata RoadAnytown, CA 94939
Lat 37 degrees, 9.6 minutes NLon 119 degrees, 45.1 minutes W
• An integrated program consisting of: Improved address coverage Ongoing address and spatial database updates Enhanced quality assessment and measurement

Major Components of 2010 Census Address List Development

2010 Address Canvassing Facts
• Number of housing unit addresses that needed verification: 145 million
• Number of census workers hired for Address Canvassing: 140,000
• Number of hand-held computers used: 151,000
• Number of local census offices that managed operations: 151
• Dates of operation: March 30 - Mid-July 2009

Goal: A Shift in Focus for the 2020 Census
• From a complete Address Canvassing to a targeted Address Canvassing– Hinges on establishing an acceptable address list for
each level of government
8

Why a “Targeted” Address Canvassing?
• $$$! It is VERY expensive – Field an ARMY of address canvassers– “Walk” EVERY street in the nation…
• Goal: developing on-going update and change detection processes
• Result: “Target” only areas with uncertainty– Quality of Addresses– Currency of Addresses

Address improvement: explore methodologies to achieve complete coverage and a current address list
Feature improvement: ongoing update of the street network and attributes to improve the matching of addresses to their correct geography
Quality improvement: broaden quality assessments and provide quantitative measures
Improved Partnerships: strengthen existing and develop new partnerships
Goals of the GSS Initiative

Address Improvement Goals• Complete and current address coverage
• Additional emphasis on change detection
• Expanded address sources for MAF update, especially in areas without city-style addresses
• American Community Survey (ACS) and current surveys need current and complete coverage

Feature Improvement Goals
• Ongoing street network and attribute updates
• Best available data from partners and commercial files
• Imagery for change detection and source evaluation

Quality Assurance Goals
3: Monitor and Improve the quality of the:
Existing MAF/TIGER
Data
IT processes for updating the MTDB
Geographic products
output from the MTDB
1: Establish quantitative measures of
address and spatial data quality
2: Assign Quality Indicators to
MAF/TIGER data

New Tools Partners
Enhanced Feedback
New and Enhanced Programs
Volunteered Geographic Information (VGI)
Web‐based Address Management Tools
Data upload systems
TIGERweb
Enhanced collaboration
Expand ExistingPartnerships
Engage NewPartners
Utilize new toolsand programs to acquire address and spatial data in the most efficient and least intrusive ways
Build on and Expand MTAIP Feedback
for Spatial Features
Address Feedback TBD, but adhering to
Title 13 confidentiality laws
Improved Partnerships

Who are the stakeholders?
• U.S. Census Bureau • Other federal agencies (U.S. Postal Service,
U.S. Geological Survey, Environmental Protection Agency)
• Tribal, State, County, and Local governments• Commercial data providers• National Advocacy Groups, such as NSGIC,
URISA, NENA, and NAPSG

Partnerships are Key!
• You are the authoritative sources for address and spatial data!
• Expanding our Partnerships is Critical– Key step towards establishing an accurate
and up-to-date address list

What’s in it for you?• Improved address and feature coverage
– support current survey samples, including the American Community Survey.
• More current data and improved process flows– should minimize the impact of programs like LUCA
• Taxpayer savings • A more accurate 2020 Census
– with all the benefits therein (increased funding, etc.)• Our evaluations & feedback may help you improve
your data.

Using your Data• Fiscal Year 2012
– Process Development• 2013-2020:
– Change detection– Completeness/coverage testing– Updates to the MAF/TIGER System

Minimum Address Assumptions• Sample rules for acceptable addresses:
• All required fields must have data• Address Number, Street Name, and ZIP Code OR
Tract/Block OR City/State
• Must meet predefined business rules• For example, ZIP Code is numeric, five digits
• Unit designations
• Minimum Address/Feature guidelines will be issued soon

Address Metadata• In addition to the Federal Geographic Data Committee
(FGDC) Address Standard metadata, we would like to collect:– What is the source of the address (assessor, utility, emergency
management)?
– Is the address used for mailing and/or locating the structure?
– Is the address for a Group Quarters (prison, college dorm)?
– What type of structure does the address represent (single-family home, trailer, multi-unit apartment building)?
– Is it a commercial, residential, or other type of address?
– When was the house built and/or addressed?

Summary• Goals of the GSS initiative
– Ongoing update of the MAF/TIGER database – Improve address coverage, feature coverage,
and quality in the MAF/TIGER database– Facilitate a targeted Address Canvassing
operation for the 2020 Census • Aligns with our commitment to provide
high quality products and data

Current Census Regional Office Structure

Future Regional Office Structure

Questions?
Linda Akers SmithU.S. Census Bureau
[email protected](818)267-1724April 12, 2012
http://www.census.gov/geo/www/gss/index.html

4/25/2012
1
NGS Produces New Coordinates: Is itNGS Produces New Coordinates: Is it still NAD83?
Past, Present, FutureMarti Ikehara
California Geodetic [email protected]
Sacramento, CAwww.ngs.noaa.gov
Order of Topics
• Terms: datum, realization,
ellipsoid, epoch, projection
• The many flavors of NAD83
• Future datums WILL be different
• Changes to datasheets, shapefiles
• Geodetic advisor program changes

4/25/2012
2
Changing the Datum
1927
The Grid shifts Uniformly (mathematically) in any one region
Everything gets a
1983
Everything gets aNew coordinate!
1927-1983: up to 100’s of meters
1983-2022: 1-2 meters
Adjusting Coordinates within the Datum is a new Realization
1 cm
Modifying each point for its ”issues”: change is not uniform/constant everywhere
1) Actual Motion/Velocity
1983
1) Actual Motion/Velocity2) Error correction/Old data3) New Information/Obs
On the order of centimetersDone regularly: Next 2012

4/25/2012
3
A rose by any other name is still a roseW.S.
Same NAD83 DATUM, different Realizations:1. (86) –original, pre‐GPS data
2. (92) for California; for other states (9#)
3. (CORS96)
4. (98) in CA
5. (NSRS2007) or (2007)
6 (2011)6. (2011)
7. Future: ~2022 and
maybe in‐between
What’s the same, what’s different?
• Same reference ellipsoid: GRS80 for each datum NAD83, WGS84, and ITRF## or IGS##
• Difference in datums is location of origin (center)
• NAD83(#) is the datum tag, represents an adjustment, either national or by state
• Difference is the dataset of which geodetic control points used as constraintscontrol points used as constraints
• Difference could be epoch date of coordinates
NAD83(2007) 2007.00 or NAD83(2007) 2008.00

4/25/2012
4
Projections
• Tool to ‘translate’ geodetic locations—those th t t k i t t th th’ tthat take into account the earth’s curvature‐‐to ‘show’ them on a flat, 2‐dimensional plane
• Independent of datum
• On NGS main page, select Geodetic TOOLKIT
• State Plane Coordinates• State Plane Coordinates
http://www.ngs.noaa.gov/TOOLS/spc.shtml

4/25/2012
5
NAD83 Present Past…
and
Future
Evolution of Geodetic Datums: from NAD27/NGVD29 to NAD83/NAVD88 to ?/ ?
H + V2 + 1
H + V2 + 1
H + VE + VO
2 + 1 + 1GPS
27, 29 83(86),88 83(92), 88
+VELOCITIES (time)H + Ht + VE + VO2 + 2 + 1+ 1 H + Ht +VE+ VEtH + Ht +VE+ VEt2 + 2 + 1+ 1ITRF08 (2010.00)2 + 2 + 1+ 183(11)+HTDP, 88
+ GRAVITY(geoid model)
t E Et2 + 2 + 1+ 1GEOMETRICVE + Gt1 + 1GEOPOTENTIAL

4/25/2012
6
New geometric datum minus NAD 83 (horizontal)
New geometric datum minus NAD 83 (ellipsoid height)

4/25/2012
7
How to Plan for the Future• Utilize newest realization, i.e. NAD 83(2011) epoch 2010.00
– NAD 83(HARN) <‐> NAD 83(NSRS2007) &
NAD 83(NSRS2007) <‐> NAD 83(2011) tools under development
• Move from NGVD 29 to NAVD 88– Understand the accuracy of VERTCON in your area
• Move away from passive marks to CGPS– Especially move off of classical (non GPS) passive geodetic control
• Require/provide complete metadata for all mapping contracts– What realization? Just “NAD83” is not enough What EPOCH?– What realization? Just NAD83 is not enough. What EPOCH?
– How did they (you) get the positions/heights? DOCUMENT!!

4/25/2012
8
OPUS Reference Frame Choices
NEED for a new national adjustment, NA2011 project, for passive geodetic stations
• Optimally align passive control with CORS
• >1000 projects submitted since 2007 NatlReadj– Number of stations increased by 1/3 in just 5 years!– Plus Observations for Hawaii & other Pacific islands
• Database pull as of 3/28/12; includes some critical leveling (& GPS obs) in Gulf Statescritical leveling (& GPS obs) in Gulf States
• More consistent results in tectonically active areas:– Longer time series for CORS, as well as
– More current data for passive, and better tectonic modeling for applying HTDP to obs back 20+ years

4/25/2012
9
NA2011 CONUS 1983‐2011 (29 yrs): 426,977 vectors

4/25/2012
10
DATASHEET Change highlights• Better grouping of geometric elements, eg,
ellipsoid height and epoch date
• CLARITY about geoid model usage, including for superceded ortho height data
• Note: last year, NGS started publishing superceded GPS‐derived ortho heights
I l i (h li k) t L l Ti & A i• Inclusion (hyperlink) to Local Ties & Accuracies
• Shapefile content changing—adding field to identify/distinguish Ht Mod (GPS OBS) vertical
Datasheet Format/Content Changes
Move ell ht and epoch info into top box
Note when GPS Ortho Ht computed with pprevious geoid model, and provide that model ht
Better way to quantify accuracies

4/25/2012
11
Local Accuracies
NGS Geodetic Advisors in the WestSW Region
(AZ,NM,NV,UT)William Stone
OregonMark L. Armstrong
ColoradoPam Fromhertz
Idaho/MontanaCurt Smith
State Advisor Branch Chief: [email protected]
Curt Smith
WyomingMike Londe (BLM)

4/25/2012
12
The Changing Face of the Geodetic Advisor Program
• 1. What are we not?
GEODENTIST
• 2. What/who are we?
• 3. How is it changing?
The Changing Face of the Geodetic Advisor Program
• 1. What are we not?
2 Wh t ?• 2. What are we?
We provide the link between
Geodesy and other customers, typically surveyors but also anyone wanting to connect to the NSRS
• Who are we?Who are we?
20 advisors; 3 are PLS, 2 of those also PE, 2 are PhD
1/3 transitioned from NGS field assignments; others came fr other gov, 2 came fr the cooperator

4/25/2012
13
The Changing Face of the Geodetic Advisor Program
Provide equal service to non‐coop states
REGIONALIZATION15 advisors total for 50 states, PR, Pacific islands
Regions being discussed in NGS Advisory Group
[email protected] is Chair (SAB Chief)
l i l d “S C di ” OCProposal includes “State Coordinator” as POC
Transition in next 4 years, with attrition due to retirements

4/19/2012
1
Karen Beardsley, PhD, GISPInformation Center for the Environment
(ICE)UC Davis
Also: James Quinn, Nathaniel Roth, Christy Cox
CalGIS Conference, April 12, 2012
California Strategic Growth Council (SGC)California Strategic Growth Council (SGC)
California Technology Agency
California Board of Equalization (BOE)q ( )

4/19/2012
2
BackgroundSGC l j t l SGC parcel project goals Current StatusDigital Land Records Information (DLRI)Standardized attributesExamples of parcel data requestorsp p qWorking groupsIssues
DLRI report by Psomasby Psomasin 2004
http://www.cio.ca.gov/wiki/GetFile.aspx?File=GIS%2FCaGISC%2FDocuments%2FDLRI_Report_Final.pdf

4/19/2012
3
Example of State-wide DLRI Vision from 2004 report
Funding historyo OCIO/CDPH/BOE leveraged small amount of funding from Dept.
f H l d S it t hi t d t t ll t l d t t of Homeland Security to hire student to collect parcel data at BOE for geocoding process
o OCIO fundingo SGC funding
BOE has authority to request parcel data from county assessorsProcess includes:Process includes:o Collecting parcel data from all 58 counties (if provided at small
or no cost)o Crosswalking attributes contained in each county’s parcel layer
to a set of standardize NSDI core attributeso Providing county parcel data layers with standardized attributes
for government-to-government use

4/19/2012
4
Prop 84 Funds through the Strategic Growth CouncilCouncil• Funding 2011-2013• Improve the development and sharing of parcel data
in California• Propose recommendations to develop consistent
land use code classifications across California
• Consistent parcel data will reduce transaction costs (time and labor) and improve accessibility to the parcel data by cities, other counties, regional and state entities.
Streamline data flowsP id t t d di ti f l d d Provide greater standardization of land use codes, easier data exchange with national efforts, and easier access to information critical to public policy.Parcel data uses includeo Helping local and county planners project land use and
economic impacts of alternative growth options;economic impacts of alternative growth options;o Helping locals implement SGC cooperative-planning
objectives, especially under SB 375 (transportation/land use planning) and AB 32 (regional greenhouse gas targets);
o Allowing for better regional planning across jurisdictions

4/19/2012
5
California Technology AgencyB d f E li ti Board of Equalization Information Center for the Environment (ICE), University of California, Davis California Resources AgencyFranchise Tax BoardBureau of Land Management Cal FireStrategic Growth Council Office of Planning and Research
2010-2011 data collected for 54 of 58 counties (missing Orange, Mariposa, San Luis Obispo, and Sierra Counties)Orange, Mariposa, San Luis Obispo, and Sierra Counties)Crosswalking to standardize attributes underway for last 14 countiesPosting this set to Cal Atlas for government-to-government useDeveloping method for collecting parcel data from counties and crosswalking in automated processand crosswalking in automated processIdentifying a suitable land use code classification systems for use as standards for integrating data among California’s counties

4/19/2012
6
State government spends over $750,000 on parcel data every year every year o Based on survey of 10 State agencieso One example of the State paying multiple times for same data
Data sharing agreemento Due to county restrictions, data is currently for government-to-
government sharing onlyo Possibly this will expand to include business and public sectors
Data available for download from Cal Atlas for government users
National Spatial Data Infrastructure Parcel Attribute Standard. Standard. o NSDI Core Parcel Feature Class Standard
http://www.nationalcad.org/showdoclist.asp?doctype=1&navsrc=Report

4/19/2012
7

4/19/2012
8

4/19/2012
9
Department of Conservation Department of Public HealthD t t f H lth d H S iDepartment of Health and Human ServicesDepartment Fish and GameAir Resources BoardCalifornia Public Utilities Commission U.S. Forest ServiceU.S. Fish and Wildlife ServiceUS Census Bureau Parks and RecreationParks and RecreationState Water Resources Control Board Department of Toxic SubstancesCalifornia Energy CommissionSierra Nevada Conservancy Department of Forestry and Fire Protection

4/19/2012
10
Analysis Decision Making Decision Making Economic Emergency Response GeocodingPlanning Managing ProjectsManaging ProjectsMapping Revenue and Taxation
DLRI Technical Advisory Working Group (TAWG) meetings are held DLRI Technical Advisory Working Group (TAWG) meetings are held the second Tuesday of every month from 11:00 am– 12:30 pm.The Land Use Codes Working Group meetings are also on second Tuesday of the month, from 2-3:30 pm.Next set of meetings will be held Tuesday May 1st.Call-in and web access available for all meetings.Meetings held at SACOG offices at 14th and L in Sacramento.Meetings held at SACOG offices at 14 and L in Sacramento.
Please join us for one or both of these working groups!Send email to [email protected] to get on our mailing list.

4/19/2012
11
Recommend strategies for streamlining the process of th i l d t f l l tgathering parcel data from local governments
Develop and test recommendations for automated crosswalking of parcel attributesIdentify and summarize California’s parcel attribute requirementsDevelop and implement outreach plans for informing and educating policymakers, planners and the public about the g p y , p pavailability and potential uses of parcel data in CaliforniaDevelop recommendations to the SGC and BOE to improve sharing of parcel data among local, state and federal governments and agencies.
Identify key interested parties for parcel land use codesDecide what types of land use codes are important to Decide what types of land use codes are important to stakeholdersDetermine the level of granularity that is needed to meet stakeholders’ business needsIdentify a suitable land use code classification systems for use as standards for integrating data systems for use as standards for integrating data among California’s countiesDevelop sustainable tools for crosswalking locally-based classification systems to the selected system

4/19/2012
12
What does “government-to-government” include?What does government to government include?What is “correct” parcel data if discrepancies exist between different sources?Private businesses selling parcel dataOrange County/Sierra Club CPRA lawsuit to be heard by the California Supreme Court (see Bruce Joffepresentation on Friday afternoon in Beavis room at 2:30 presentation on Friday afternoon in Beavis room at 2:30 pm)California Technology Agency plans for Geoportalimplementation
Karen Beardsley Nathaniel Roth James QuinnKaren Beardsley, Nathaniel Roth, James QuinnInformation Center for the Environment (ICE)Department of Environmental Science and Policy, UC [email protected]; [email protected]:
Christy CoxUC Davis and Board of [email protected]

4/24/2012
1
Ramesh Gautam, PhD, PERamesh Gautam, PhD, PE
Division of Statewide Integrated Water ManagementDivision of Statewide Integrated Water Management
Water Use and Efficiency Branch, Land Use UnitWater Use and Efficiency Branch, Land Use Unit
California Department of Water ResourcesCalifornia Department of Water Resources
Quantify crop acreages Quantify crop acreages
Estimate crop water useEstimate crop water use
Determine urban landscape and urban growth patternsDetermine urban landscape and urban growth patternsDetermine urban landscape and urban growth patternsDetermine urban landscape and urban growth patterns
Input data for groundwater and surface water modelsInput data for groundwater and surface water models
Estimate economic impacts of floodingEstimate economic impacts of flooding

4/24/2012
2
ArcInfoArcInfo : : delineate field boundaries, join ground truth data delineate field boundaries, join ground truth data to polygons, review imagery and field borders, calculate to polygons, review imagery and field borders, calculate normalized difference vegetation index (NDVI), calculate normalized difference vegetation index (NDVI), calculate the accuracy of resultsthe accuracy of results
ERDAS Imagine ERDAS Imagine : prepare imagery, calculate NDVI, create : prepare imagery, calculate NDVI, create spectral signatures, run multispectral classificationsspectral signatures, run multispectral classifications
eCognitioneCognition Developer Developer : image segmentation, object: image segmentation, object--based based classification, classification and regression tree (CART)classification, classification and regression tree (CART)
ExcelExcel : accuracy assessment review: accuracy assessment review
Stanislaus CountyArea: 1,515 sq mileArea: 1,515 sq milePopulation: 515,000

4/24/2012
3
C Mi dC Mi d
Decision Tree Decision Tree Based Based
ClassificationClassificationOrchards Orchards
Time series Time series
Corn, Mixed Corn, Mixed Pasture, Fallow, Pasture, Fallow,
Dry Beans, Dry Beans, Tomato, MelonsTomato, Melons
NonNon--Orchards Orchards LCRAS* LCRAS* Based Based
ClassificationClassification
based based Vegetation Index Vegetation Index
AnalysisAnalysis
AlfalfaAlfalfa* LCRAS: Lower Colorado River Accounting System* LCRAS: Lower Colorado River Accounting System
Classify orchards from nonClassify orchards from non orchard cropsorchard cropsClassify orchards from nonClassify orchards from non--orchard crops.orchard crops.
Coarse and fine textural patterns observed in Coarse and fine textural patterns observed in images were used to distinguish orchards from images were used to distinguish orchards from other crops.other crops.
eCognition Developer software was used to eCognition Developer software was used to develop the classification algorithm.develop the classification algorithm.

4/24/2012
4
Textural parameters were analyzed to evaluate fields having coarse Textural parameters were analyzed to evaluate fields having coarse texture versus fine texturetexture versus fine texture
Other cropsOther crops
OrchardsOrchards
Poultry farmPoultry farm
LEGENDLEGEND
FarmsteadsFarmsteads
Urban areaUrban area
DairiesDairies
Highways/RoadsHighways/Roads
Bare landBare land

4/24/2012
5
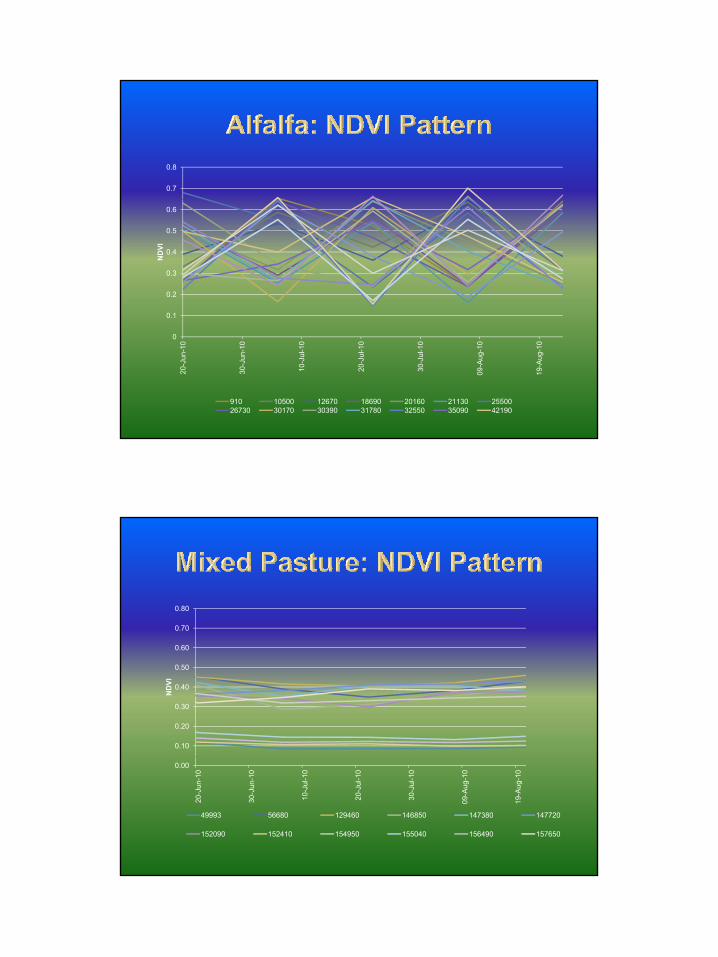
Time series variation in normalized differenceTime series variation in normalized differenceTime series variation in normalized difference Time series variation in normalized difference vegetation index (NDVI) was captured. vegetation index (NDVI) was captured.
Eleven LANDSAT 5 satellite images were Eleven LANDSAT 5 satellite images were processed to obtain vegetation indices.processed to obtain vegetation indices.p gp g
Classification and regression tree (CART) was Classification and regression tree (CART) was used to classify alfalfa from other crops.used to classify alfalfa from other crops.
4/24/2012
6
0.7
0.8
0.1
0.2
0.3
0.4
0.5
0.6
ND
VI
0
20-J
un-1
0
30-J
un-1
0
10-J
ul-1
0
20-J
ul-1
0
30-J
ul-1
0
09-A
ug-1
0
19-A
ug-1
0
910 10500 12670 18690 20160 21130 2550026730 30170 30390 31780 32550 35090 42190
0.70
0.80
0.10
0.20
0.30
0.40
0.50
0.60
ND
VI
0.00
20-J
un-1
0
30-J
un-1
0
10-J
ul-1
0
20-J
ul-1
0
30-J
ul-1
0
09-A
ug-1
0
19-A
ug-1
0
49993 56680 129460 146850 147380 147720
152090 152410 154950 155040 156490 157650

4/24/2012
7
Extract NDVI, Extract NDVI, dNDVIdNDVI, , MaxNDVIMaxNDVI, , MinNDVIMinNDVI, Max & Min , Max & Min dNDVIdNDVI
from LANDSAT Imagesfrom LANDSAT ImagesExport Classified Results in Export Classified Results in ArcGISArcGIS
from LANDSAT Imagesfrom LANDSAT Images
Export NDVI Indices intoExport NDVI Indices intoeCognitioneCognition Developer softwareDeveloper software
Develop Indices Optimization Develop Indices Optimization Rules in Rules in eCognitioneCognition
Compare Classified Alfalfa Fields Compare Classified Alfalfa Fields with Ground truth Datawith Ground truth Data
Produce Classified Alfalfa Produce Classified Alfalfa Map inMap in ArcGISArcGIS
Apply the Rules for Classification Apply the Rules for Classification and Regression Tree (CART)and Regression Tree (CART)
Map in Map in ArcGISArcGIS
Alfalfa (Acres)Alfalfa (Acres) Other CropsOther Crops(Acres)(Acres)
Grand TotalGrand Total(Acres)(Acres)
Alfalfa (Acres)Alfalfa (Acres) 18,17218,172 2,6742,674 20,84620,846 87%87%
Other CropsOther Crops(Acres)(Acres) 580580 2,0682,068 2,6482,648 78%78%
Grand Total Grand Total (Acres)(Acres) 18,75218,752 4,7424,742 23,49423,494
97%97% 44%44% 86%86%
4/24/2012
8
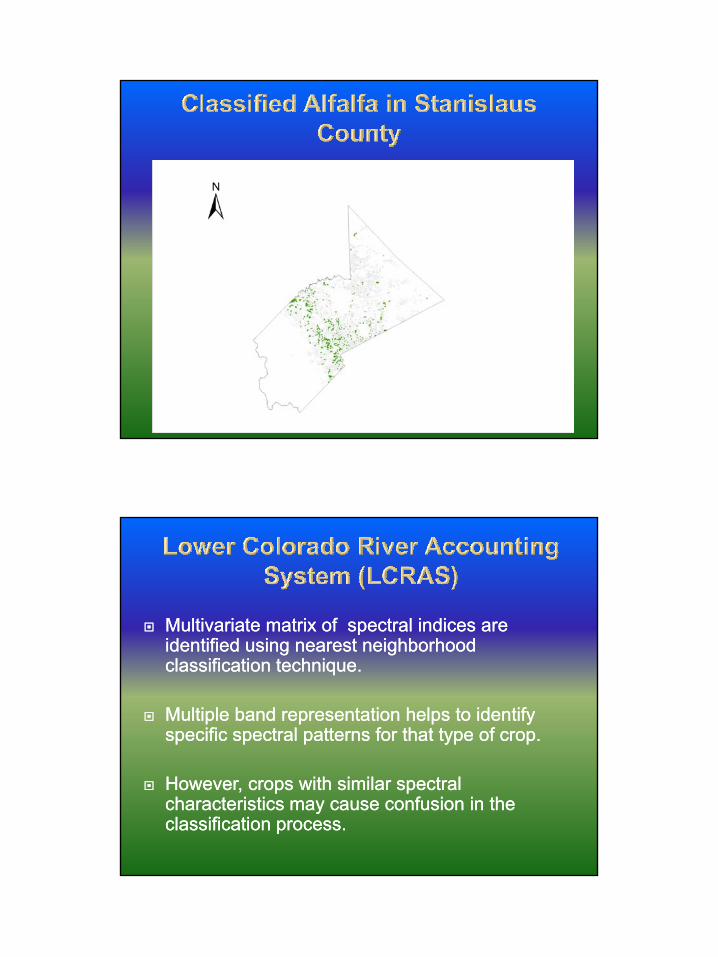
Multivariate matrix of spectral indices are Multivariate matrix of spectral indices are identified using nearest neighborhood identified using nearest neighborhood classification technique.classification technique.
Multiple band representation helps to identify Multiple band representation helps to identify specific spectral patterns for that type of crop.specific spectral patterns for that type of crop.
However, crops with similar spectral However, crops with similar spectral characteristics may cause confusion in the characteristics may cause confusion in the classification process.classification process.

4/24/2012
9
CornCorn AlfalfaAlfalfa
Overlap Overlap
Mixed PastureMixed PastureFallowFallow
between between Mixed Mixed
Pasture and Pasture and CornCorn
Scatter Plot of three crops, mixed pasture, corn, and alfalfa with Red & NIR BandScatter Plot of three crops, mixed pasture, corn, and alfalfa with Red & NIR Band
Field borders Field borders –– Digital borders must accurately represent Digital borders must accurately represent field conditions on the date of the analyzed field conditions on the date of the analyzed imagery.imagery.
Ground truth data Ground truth data –– crop name, % cover, height, stage of crop name, % cover, height, stage of growth, soil growth, soil moisturemoisture
LANDSAT LANDSAT imagery imagery –– The dates selected for analysis should The dates selected for analysis should represent good canopy cover for the crops to be represent good canopy cover for the crops to be identified.identified.

4/24/2012
10
Snapshot of Field Border overlay on LANDSAT Satellite ImageSnapshot of Field Border overlay on LANDSAT Satellite Image
GroundGround Truth SurveyTruth Survey Develop Personal GeoDevelop Personal Geo--database of database of G dG d t th d t i A GISt th d t i A GISGround Ground Truth SurveyTruth Survey
Collect Crop AttributesCollect Crop Attributes(12% of Total Fields)(12% of Total Fields)
QA/QC Ground Truth DataQA/QC Ground Truth Data
GroundGround--truth data in ArcGIStruth data in ArcGIS
Randomly Select Randomly Select Training Data (60%)Training Data (60%)
Perform Image Segmentation inPerform Image Segmentation inQA/QC Ground Truth DataQA/QC Ground Truth Data
Update Field Border Update Field Border DatabaseDatabase
g gg geCognition DevelopereCognition Developer
for Training Datafor Training Data
Create SignaturesCreate Signaturesin Erdas Imaginein Erdas Imagine

4/24/2012
11
LANDSATLANDSAT--5 Image5 ImageBands 1Bands 1--5 and 75 and 7
Perform Accuracy AssessmentPerform Accuracy Assessment
Perform Supervised Perform Supervised Classification of Spectral Classification of Spectral
CharacteristicsCharacteristics
Overall Overall Classification Classification
OK ?OK ?YesYes
EndEndNoNo
Identify Crops at the Field LevelIdentify Crops at the Field LevelBased on ClassificationBased on Classification
ReRe--evaluateevaluatesignature setssignature sets
Identify Mislabeled Identify Mislabeled Fields Based on Fields Based on
Ground TruthGround Truth
Grain(Acres)
Lettuce(Acres)
Mixed Pasture(Acres)
Fallow/Idle (Acres)
Vineyards(Acres)
GrandTotal(Acres)
Grain (Acres) 2,570 261 106 69 3,006 86%
Lettuce(Acres) 81 81 100%
Mixed Pasture(Acres) 323 2,011 123 2,456 82%
Fallow/Idle (Acres) 177 30 1,336 236 1,779 75%
Vineyards(Acres) 14 431 445
GrandTotal(Acres) 3,070 81 2,302 1,579 735 7,767
84% 100% 87% 85% 83%

4/24/2012
12
Grain (Acres)
Corn (Acres)
Melon(Acres)
Pasture(Acres)
Tomato(Acres)
Sudan Grass (Acres)
Bean(Acres)
Fallow/Idle(Acres)
Vineyards (Acres)
Total(Acres)
Grain 0 11 11(Acres) 0 11 11
Corn (Acres) 2,285 36 45 2,366 97%
Melon(Acres) 0 0
Pasture(Acres) 30 2,115 54 42 114 2,355 90%
Tomato(Acres) 625 625 100%
Sudan Grass (Acres)
0 0
BeanBean(Acres) 99 48 38 17 484 199 885
Fallow/Idle(Acres) 14 627 81 2,032 2,760 74%
Vineyards (Acres) 11 710 721 99%
Total(Acres) 19 2,425 49 2,778 663 71 607 2,402 710 9,724
94% 76% 94% 80% 85% 100% 85%

4/24/2012
13
Collect more ground truth data for minor cropsCollect more ground truth data for minor cropsCollect more ground truth data for minor crops Collect more ground truth data for minor crops to improve accuracy.to improve accuracy.
Perform additional analysis of multi temporal Perform additional analysis of multi temporal images (May, June, August, and September).images (May, June, August, and September).
Test this method in other counties.Test this method in other counties.

4/24/2012
14
Improvement in Technology:Improvement in Technology:
Apply other classification techniques e. g., Support Apply other classification techniques e. g., Support Vector Machine, Neural networks, KVector Machine, Neural networks, K--Nearest Nearest Neighborhood, Bayesian, Genetic Algorithm based Neighborhood, Bayesian, Genetic Algorithm based classification techniques (future work).classification techniques (future work).
If higher resolution satellite images are available, If higher resolution satellite images are available, check the method to observe the relative check the method to observe the relative performance.performance.
With the help of decision tree based, time With the help of decision tree based, time series based and LCRAS based classificationseries based and LCRAS based classificationseries based, and LCRAS based classification series based, and LCRAS based classification techniques, major crops were classified with techniques, major crops were classified with more than 85% accuracy.more than 85% accuracy.
For minor crops, additional ground truth data For minor crops, additional ground truth data and other LANDSAT image analysis is needed.and other LANDSAT image analysis is needed.
Future work includes validation and Future work includes validation and improvement of this method based on other improvement of this method based on other counties/areas.counties/areas.

4/24/2012
15

PROVIDING REFINED CROP PROVIDING REFINED CROP COEFFICIENTS TO IMPROVE COEFFICIENTS TO IMPROVE WATER RESOURCES PLANNINGWATER RESOURCES PLANNINGKris LynnKris Lynn--Patterson Patterson –– University of California University of California Kearney Agricultural Research and Extension Kearney Agricultural Research and Extension Center, Parlier, CACenter, Parlier, CAByron Clark Byron Clark –– SEBAL North America, Davis, CASEBAL North America, Davis, CA
Funded by the California Funded by the California Department of Water Department of Water Resources as part of a Resources as part of a Proposition 50 Water Use Proposition 50 Water Use Efficiency Research GrantEfficiency Research Grant
CalGIS 2012 – Capitalizing on Spatial TechnologyApril 12, 2012

Overview
Background and Objectives
2
Background and Objectives Project Summary Remote Sensing Analysis Remote Sensing Analysis Crop Water Use Coefficient Analysis
D l f W b B d M I f Development of Web-Based Map Interface Potential Uses and Future Updates

Backgroundg
Approximately 70% of water applied for irrigation is consumed as i i i d l h h
3
evaporation or transpiration and lost to the atmosphere The remaining 30% leaves the field as surface runoff or deep
percolationR d i f i i i b h h d Reduction of irrigation to better match the consumed water amount can result in: Increased water supply Better control of available supply Better control of available supply Improved water quality in downstream surface or groundwater systems Energy conservation
The purpose and objective of this project is to improve The purpose and objective of this project is to improve understanding of the amount of water consumed by crops for individual fields and to make the information available to irrigators and water planners

Project Summaryj y
To satisfy the project objective, a remote sensing
4
To satisfy the project objective, a remote sensing analysis of crop consumption of water (i.e., “evapotranspiration” or ET) was conducted for the p p )southern San Joaquin Valley in 2008
ET values for individual fields were converted to crop coefficients, which normalize for weather differences from year to year
These data are being provided to irrigators and water planners through a web-based map interface under development (webgis.uckac.edu/prop50)

Illustration of Crop Water Use (ET)p ( )
Crop water use or 5
p“evapotranspiration” (ET) is the combined
f process of evaporation and transpirationtranspiration
ET is typically expressed as a depth of water over a given area for a specified time specified time period salinitymanagement.org

Surface Energy Balance Algorithm for Land (SEBAL)Land (SEBAL)
Applied using Landsat imagery
6
Applied using Landsat imagery and gridded weather data
Solves surface energy balance gyfor latent heat transfer (e.g., evapotranspiration)
Primary output is actual Primary output is actual evapotranspiration (ETa) at the pixel scale
ET is calculated as a “residual” of the ET is calculated as a “residual” of the
Fourteen Landsat images spanning February – November 2008 selected
energy balance:energy balance:
ET = ET = ((RRnn –– G G –– H)H)
The balance includes all major sources (The balance includes all major sources (RR ) ) w
1
2008 selectedwww.sebal.us for more info
The balance includes all major sources (The balance includes all major sources (RRnn) ) and sinks (LE, G, H) of energy.and sinks (LE, G, H) of energy.

SEBAL Input Databare
7
Multispectral Satellite Imagery vines
(visible, near-infrared, and thermal bands)Di it l El ti M d l
water
bare
Digital Elevation ModelSurface Roughness (land use
map)map)Gridded Weather Data water
vines
bbare
watervines

bare
Energy Balance Components8
Net Radiation (Rn) vinesn
Solved from balance of incoming short wave and long wave radiation
water
bare
radiationSoil Heat Flux (G)
Estimated as a function of Rn, ,Surface Temperature (Ts ), NDVI, and Albedo (α)
Sensible Heat Flux (H)
watervines
bSensible Heat Flux (H)Solved for each image by selecting
anchor pixels
bare
“Hot” Pixel: H = Rn – G “Cold” Pixel: H = 0 water
vines

Energy Balance Calculationgy
R G H = ET9
bare bare bare
Rn – G – H = ET
R G Hwater
vines
water
vineswater
vines
– – =Rn G H
bare
ETET is calculated as a “residual” of the
water
vinesenergy balance:
ET = (Rn – G – H)
The balance includes all major sources (Rn) and sinks (LE, G, H) of energy.
w1

SEBAL Validation
SEBAL lt
10
SEBAL results were validated using reliable ground
y = 0.7259x + 1.4686R² = 0.7163
8.0
9.0
10.0
m)
reliable, ground-based ET estimates for an almond 5 0
6.0
7.0
Daily ETa (m
o a a o d orchard near Bakersfield
2 0
3.0
4.0
5.0SEBA
L
Ground data collected by Blake 0.0
1.0
2.0
Sanden, UCCE 0.0 2.0 4.0 6.0 8.0 10.0Eddy Covariance Daily ETa, mm

Crop Coefficients
A ffi i t i
11
p
A crop coefficient is the ratio of crop water use (ET ) for a water use (ETc) for a given crop to crop water use for a grass reference crop (ETo)
ETo is calculated based on weather d tdata (FAO Irr. & Drain. Paper 56)

Crop Coefficients (continued)
C ffi i t
12
p ( )
Crop coefficients vary over time depending on:depending on: Evaporation Soil wetted area Wetting frequency
Transpiration Crop growth stage Water stress and
other factors(FAO Irr. & Drain. Paper 56)

Reference Evapotranspiration (ETo)
Provided by DWR
13
p p ( o)
Provided by DWR through network of over 100 agri-cultural weather stations
A new product, Spatial CIMIS, is also available, providing gridded ETo data f C lif ifor California

Reference Evapotranspiration (ET )
Example: July 25, 2008
Evapotranspiration (ETo)14
Daily weather station ETo more yreliable than Spatial CIMIS
Adjust Spatial CIMIS grids to match weather stations for each match weather stations for each satellite image date
Analysis process Quality control 8 selected CIMIS
weather stations Calculate differences between daily y
grid ETo and weather station ETo Interpolate differences using IDW Subtract “difference grid” from Subtract difference grid from
Spatial CIMIS grid to obtain adjusted ETo grid

Calculation of Crop CoefficientsMarch 19 2008 May 22 2008 July 25 2008 September 27 2008March 19, 2008
ActualEvapo‐
May 22, 2008 July 25, 2008 September 27, 2008
Transpiration(Crop WaterUse, ETc)
÷ReferenceEvapo‐
Transpiration
÷
(Grass WaterUse, ETo)
=Crop
Coefficients(Water Use R l tiRelative To Grass Reference)

Crop Coefficient Variabilityp y
Analyzed variability
16
Analyzed variability in crop coefficients for 15 major crops j pbased on USDA NASS Cropland Data Layer for 2008

Crop Coefficient Variability: Alfalfap y
(7,138 fields – 395,616 acres)17
1.0
1.210th and 90th percentile Median
0.8
ficient
0.4
0.6
Crop
Coe
ff
0.2
C
0.02/1 4/1 6/1 8/1 10/1 12/1
Satellite Image Date

Crop Coefficient Variability: Almondsp y
(10,709 fields – 435,457 acres)18
1.0
1.210th and 90th percentile Median
0.8
ficient
0.4
0.6
Crop
Coe
ff
0.2
C
0.02/1 4/1 6/1 8/1 10/1 12/1
Satellite Image Date

Crop Coefficient Variability: Cornp y(2,546 fields – 138,870 acres)
19
1.0
1.210th and 90th percentile Median
0.8
ficient
0.4
0.6
Crop
Coe
ff
0.2
C
0.02/1 4/1 6/1 8/1 10/1 12/1
Satellite Image Date

Crop Coefficient Variability: Cottonp y
(2,381 fields – 216,893 acres)20
1.0
1.210th and 90th percentile Median
0.8
ficient
0.4
0.6
Crop
Coe
ff
0.2
C
0.02/1 4/1 6/1 8/1 10/1 12/1
Satellite Image Date

Development of Web-Based Map InterfaceInterface
Web-based interface
21
Web based interface allows for review of water use for 59,400 ,individual fields (3 million acres)
Charts and summary statistics of both ET and crop coefficients to be provided
(webgis.uckac.edu/prop50)

Potential Uses
Compare field water use to fields of same crop,
22
Compare field water use to fields of same crop, valley-wide
Compare field water use among individual fields Compare field water use among individual fields Refine estimates of crop coefficients for irrigation
schedulingscheduling Project water demands for planned cropping

Potential Future Updatesp
Development work is almost done. Now we need
23
Development work is almost done. Now we need more data!
Could be updated to include the following: Could be updated to include the following: Crop coefficient and ET statistics for additional crops Additional, more recent years Additional, more recent years Tool to estimate irrigation requirements based on
rainfall, past irrigation events, projected ET, irrigation system configuration, etc.

1
BAT FilesBAT Files.BAT Files ….BAT Files …Applying the Ancient (LOST) Art of BAT filesApplying the Ancient (LOST) Art of BAT filesto Manage Modern GIS Issuesto Manage Modern GIS Issues
4/30/2012 1
Michael HickeyTulare County RMA/[email protected]
What is a .BAT File?What is a .BAT File?(and WHY should I care?)(and WHY should I care?)
QuizQuiz
Brief History of pre-Windows PCs– AutoEXEC.BAT
– Config SYS
4/30/2012 2
Config.SYS

2
Problems .BAT File can solveProblems .BAT File can solve
Make dissimilar computers seem theMake dissimilar computers seem the ‘SAME’ to ArcViewEncapsulate maintenance tasksEncapsulate tedious tasksChain tasks together
4/30/2012 3
Chain tasks together
How do you move ‘SHARE’ ArcView projects?
An ArcView Project is a collection of pointersAn ArcView Project is a collection of pointers … … Make dissimilar computers seem the ‘SAME’ to ArcViewMake dissimilar computers seem the ‘SAME’ to ArcView
How do you move SHARE ArcView projects? (Move project from one to another non-identical computer?)
An ArcView Project is a collection of pointers … If every pointer connects to data on both computers, the project will ‘work’ If some pointer fails, the project will fail
The DOS ‘subst’ command can make computers with differences appear to be the same
4/30/2012 4
appear to be the sameThis requires that ‘conventions’ and ‘parallel structure’ be followed religiously.

3
DOS ‘subst’ commandDOS ‘subst’ command
Map network drive to LETTERsubst x: /D # disable previous substitutionsubst x: \\tlc\gis\shared_projects\drive_x_tcag_agtrack
Overwrite ‘Network Mapping’ to Localsubst x: /D # disable previous substitution
4/30/2012 5
net use /delete x: # disable previous network mappingsubst x: c:\~X_LUCC
Encapsulate maintenance tasksEncapsulate maintenance tasksIn Tulare County the network is SLOWIn Tulare County the network is SLOW ((for GIS) … just fine for everybody else)To speed up GIS, large data files are copied to local computers.If the Master DATA (on the GIS Server) is updated, how is the updated data pushed to individual users?
4/30/2012 6
HINT… BAT FILE!

4
Make a routine run on BOOTMake a routine run on BOOT--UPUP(python script keeps LOCAL files in sync with files on Server)(python script keeps LOCAL files in sync with files on Server)
STARTUP BAT (t Li )STARTUP.BAT (two Lines)
net use p: \\csmas39\pmplm\plm /user:mhickey HuHaC:\Python25\python.exe "C:\BAT\UpdateDaily_GIS_TimeTest.py"s
The first line connects the user to the AirPhoto License Manager(and provides UserName and PASSWORD to allow connection)
4/30/2012 7
The second line executes a python script
WHERE DO I PLACE THIS SCRIPT SO IT WILL RUN ON BOOT-UP?
Make a routine run on BOOTMake a routine run on BOOT--upup(python script keeps LOCAL files in sync with files on Server)(python script keeps LOCAL files in sync with files on Server)
In Windows XP,
insert STARTUP BAT
4/30/2012 8
insert STARTUP.BAT
in \Start Menu\Programs\StartUp

5
Encapsulate tedious tasksEncapsulate tedious tasks
Some Tasks have LOTS ofSome Tasks have LOTS of parametersEncapsulate these parameters in a .BAT file
4/30/2012 9
4/30/2012 10

6
4/30/2012 11
Need ‘WAIT’ if calling BATfileNeed ‘WAIT’ if calling BATfilefrom python (allow routine to complete)from python (allow routine to complete)BATfile:"C:\Program Files\MapInfo\MapMarker_USA_v14\desktop\mapmarkr.exe“/TABLE=O:\_AddressPoints\Data\pnts_MasterList\addrpnts.TAB/LOG=O:\_AddressPoints\Data\pnts_MasterList\addrpnts.log /ALL /PREFER_UD=N /MIXED_CASE=Y /STREET /EXACT_HOUSE=N /EXACT_STREET=Y /EXACT_CITY=Y /EXACT_ZIP=Y /STREET_ONLY=N /STREET_PTZIP_ONLY=N /FALLBACK=ZIP4 /MULTI=STREET /XSECT=Y
4/30/2012 12
A LOT of PARAMETERS!

7
Search for Specific File(s)Search for Specific File(s)!@# LOCK FILES #@!!@# LOCK FILES #@!
At DOS Command Prompt…
C:cd \
4/30/2012 13
dir *.LOCK /s>listLOCKfiles.txt
Process CHAIN of ProceduresProcess CHAIN of Procedures(glue different programs together)(glue different programs together)
Python (and other ‘new’ tools)Python (and other new tools) defaults to PARALLEL (simultaneous) execution.BAT files default to SERIAL (sequential) execution
4/30/2012 14

8
ArcView 3.x ArcView 3.x –– Avenue scriptsAvenue scripts
Scripts than execute on ‘START’ and
4/30/2012 15
‘START’ and ‘STOP’ built into ArcView 3.x
Chaining procedures:Chaining procedures:ArcGIS 10 & VB.netArcGIS 10 & VB.net
Non trivial programmingNon-trivial programming– Need to understand .NET & ArcObjects– Need to ‘catch signals’
Result will be portable
4/30/2012 16

9
Chaining procedures:Chaining procedures:ArcGIS 10 & VB.netArcGIS 10 & VB.net
C:\Python26\ArcGIS10.0\python.exe "C \AV P j t \A C 2011\P j t \ A MAP ""C:\AV_Projects\AgComsn_2011\Projects\preArcMAP.py"
cd \Program Files\ArcGIS\Desktop10.0\BinArcMAP "C:\AV_Projects\AgComsn_2011\Projects\TagAgPermits.mxd"C:\Python26\ArcGIS10.0\python.exe
"C:\AV_Projects\AgComsn_2011\Projects\postArcMAP.py"shutdown -f –s
Line 1 will execute ‘preArcMAP.py’ … upon completionLine 2 will change to directory where ArcMAP.exe is located
4/30/2012 17
g yLine 3 will use ArcMAP to open a specific MXD…Line 4 will execute ‘postArcMAP.py’ … AFTER ArcMAP is exitedLine 5 will shut the computer down … no need for user to hang around
waiting for the (slow) ‘postArcMAP.py’ routine to finish
SUMMARY:SUMMARY:
ADVANTAGESADVANTAGES– You can easily do things with BAT files that are difficult
to do otherwise– Un-compiled TEXT files … easy to edit
DISADVANTAGES– OBSCURE (few users (post Windows 95) know anything
4/30/2012 18
OBSCURE (few users (post Windows 95) know anything about them)
– Un-compiled TEXT files … easy to edit – BRITTLE (if .BAT file gets deleted (or a key file moved)
the whole process will fall apart)

10
Bat helpBat help
4/30/2012 19
Programming / GP models
Looking for CollaboratorsLooking for Collaboratorsg g
are ’crystallized’ intelligence (or lack thereof)
How can I share my stuff with you?
How can I get your stuff?
4/30/2012 20
How can I get your stuff?
FOR MORE INFO...


6/4/2012
1
Space/Time Analysisin the Presence of in the Presence of
ZIP Code Misalignment
18th Annual CalGIS ConferenceApril 12, 2012
Lillian G. RemerWilliam R. PonickiChristina F. Mair
Paul J. Gruenewald
Why Use ZIP Codes?
• Conveniently available geographyR l ti l h• Relatively anonymous geography
• Somewhat “community” sized• Inverse relationship between size and
population

6/4/2012
2
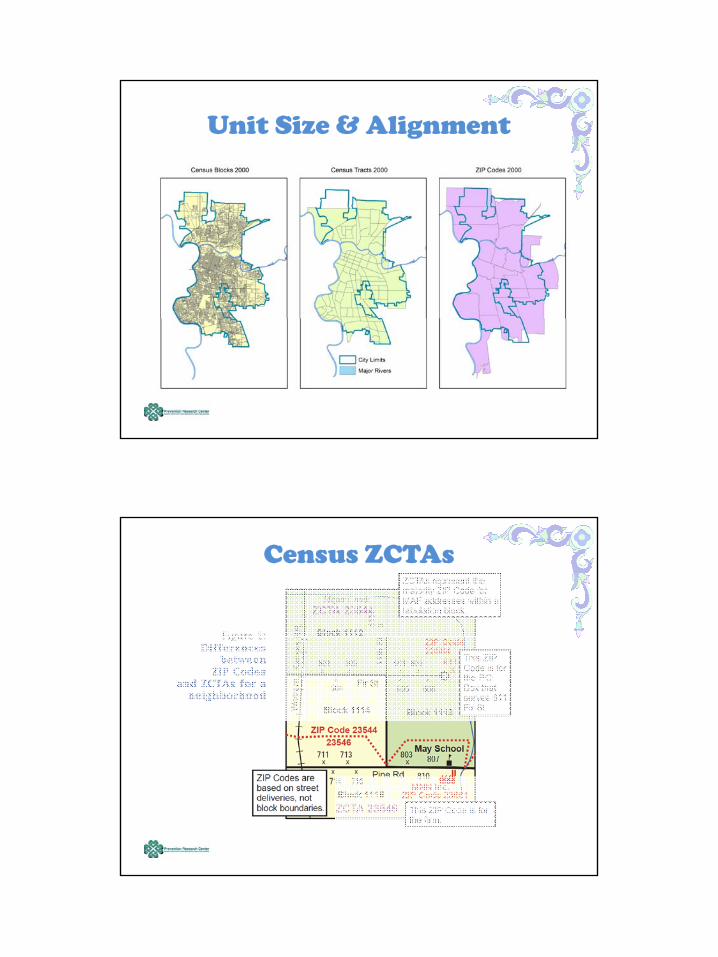
Area (sq. miles) Census Population 2000
Unit Type N Mean Median Range Mean Median Range
Census Blocks 533,163 0.1962 0.0076 0.000 to 857 0 63.5 19 0 to
11 471
Comparison of Areal Units of Geography in California
, 857.0 11,471
Block Groups 22,133 7.05 0.20 0.00 to 4713 1,530 1,283 0 to
36,146
Census Tracts 7,049 22.1 0.77 .02 to 7988 4,805 3,568 0 to
36,146
Zip codes 1,646 95.6 17.3 0.1 to 3806 21,155 14,009 0 to
100,417
Census Places *# 1,081 10.9 4.8 0.07 to 469 28,835 6,357 0 to
3,694,820
* Not 100% coverage of the state; # Places include cities, towns and Census Defined Places (CDP)
Cities * 452 16.0 7.7 0.33 to 469 60,152 26,865 91 to
3,694,820
Counties 58 2,689 1,494 46.69 to 20,052 583,994 156,299 1,208 to
9,519,338
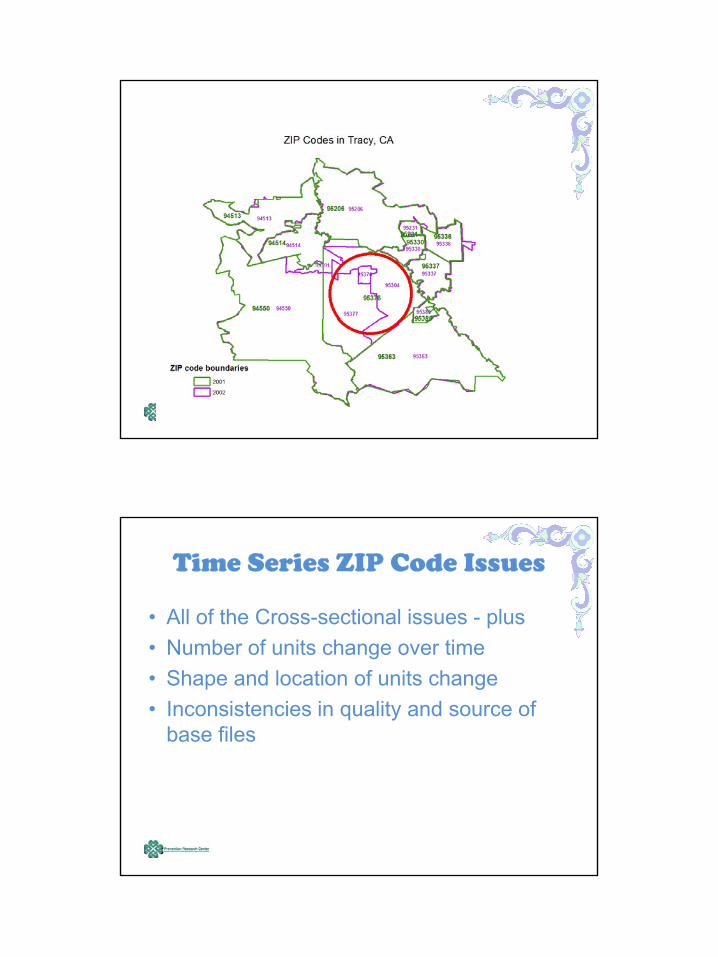
What’s Wrong with ZIP codes?
• ZIP codes are routes, not polygons• They do not align with other geographic
units• Number of ZIP codes varies over time• Shape and location of ZIP codes change• Historical changes are not documented
6/4/2012
3
Unit Size & Alignment
Census ZCTAs

6/4/2012
4
How do ZIP Codes Change?
• Some areas do not have ZIP code service• New ZIP codes added• Routes moved to different ZIP code• ZIP codes renumbered
Matching vintage of maps & data is critical!
6/4/2012
5
Time Series ZIP Code Issues
• All of the Cross-sectional issues - plus• Number of units change over time• Shape and location of units change• Inconsistencies in quality and source of
base files

6/4/2012
6
An Early Work-Around
• Use only “Stable” ZIP codesA ?- Area?
- Population?- Location?
• Introduced bias- Unstable ZIP codes are not randomly distributed
• Are “stable” ZIP codes interesting?
The CA Index Locations Database

6/4/2012
7
An Alternative Approach
• Uses all ZIP codes in all yearsC t l f ti l i li t• Controls for spatial misalignment(year specific ZIP code boundary maps)
• Allows spatial “borrowing of strength”
Zhu, L, Waller, L.A., and Ma, J (in press, 2012) Spatial‐temporal disease mapping of illicit drug abuse or dependence in the presence of misaligned ZIP codes. GeoJournal {DOI: 10.1007/s10708‐11‐9429‐3}
Injury Traffic Crashes

6/4/2012
8
Hospital Discharge Assault
Alcohol Outlets & Assaults

6/4/2012
9
Methamphetamine Abuse & Dependence
Methamphetamine Abuse & DependenceSpatial Random Effect PLUS Year Effects
6/4/2012
10
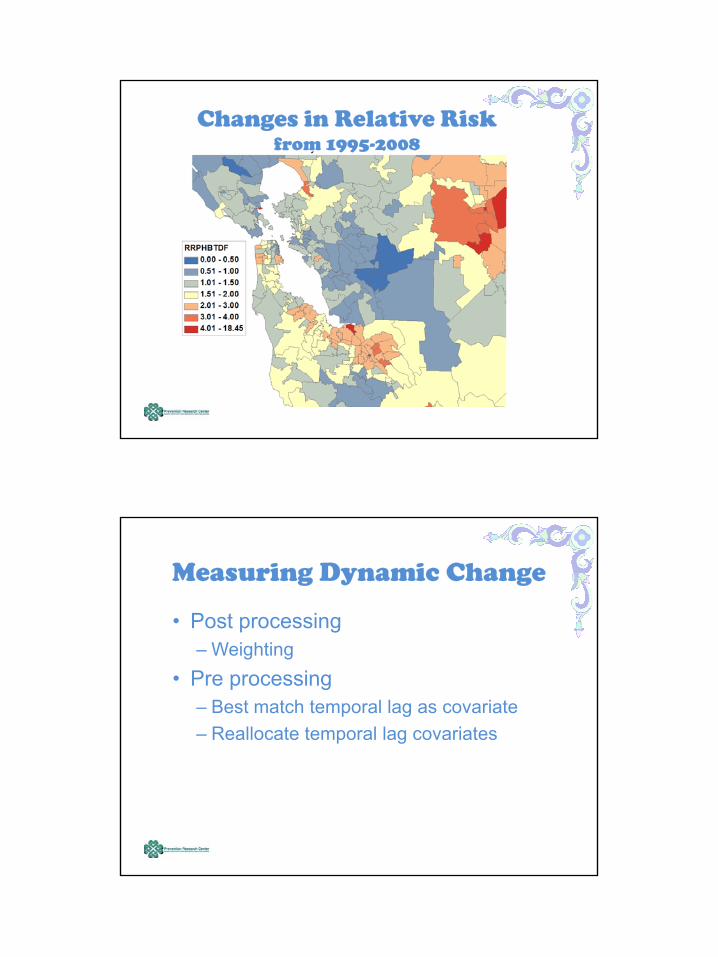
Changes in Relative Risk from 1995-2008
Measuring Dynamic Change
• Post processing– Weighting
• Pre processing– Best match temporal lag as covariate– Reallocate temporal lag covariates

6/4/2012
11
Conclusions
ZIP codes can be a useful geography if we• Match vintage of data and geography• Match vintage of data and geography• Disentangle changes in place from changes in
data over time• Create dynamic models of changey g
References• Gotway, C.A., and Young, L.J. (2002) combining Incompatible Spatial Data.
Journal of the American Statistical Association 97(458):632-648.• Gruenewald, P.G., Johnson, F.W., Ponicki, W.R., Remer, L.G., and
LaScala, E. A. (2010) Assessing correlates of the growth and extent of th h t i b d d d i C lif i S b t U dmethamphetamine abuse and dependence in California Substance Use and
Misuse 45(12): 1948-1970.• Gruenewald, P.J., Ponicki, W.R., Remer, L.G., Waller, L.A., Zhu, L., and
Gorman, D.M. (in press, 2012) Mapping the spread of methamphetamine abuse in California from 1995 to 2008. American Journal of Public Health.
• Mair, C.F., Gruenewald, P.J., Ponicki, W.R., and Remer, L.G. (in review). Varying impacts on alcohol outlet densities on Violent Assaults: Explaining differences across neighborhoods.
• Ponicki, W.R., Gruenewald, P.J., Remer, L.G. (in preparation). Spatial , , , , , ( p p ) pPanel Analyses of Alcohol Outlets and Motor Vehicle Crashes in California: 1999 – 2008
• Zhu, L, Waller, L.A., and Ma, J (in press, 2011) Spatial-temporal disease mapping of illicit drug abuse or dependence in the presence of misaligned ZIP codes. GeoJournal (on line August 26, 2011).

An Alternative Model for GIS Supporting Data Driven Decision Making Across Agencies Abstract text: Many local government agencies face technical, jurisdictional and operational barriers to data sharing across and within agencies and between government levels. Across the US, many local nonprofits and university think tanks are stepping up to provide effective platforms for data sharing, analysis and distribution within and between their local agencies. The benefit of various agencies having open access to data from multiple jurisdictions is of enormous value. School district analysts can consider the local health issues faced by troubled students, probation agents can track levels of violence in their community, policy analysts can compile comprehensive community needs data from multiple domains to secure grant funding and residents can use these resources. Click on link to access presentation. If you are having trouble accessing the presentation, please contact the presenter directly. http://prezi.com/sjoefwf4mjqx/how‐gis‐supports‐data‐driven‐decision‐making‐across‐agencies/ Presenter Contact Information: Steve Spiker, GISP U R B A N S T R A T E G I E S C O U N C I L Oakland, CA [email protected]

A Geospatial Suitability Model for Second Generation Biofuels A perennial grass native to the North America, switchgrass (Panicum virgatum) has been targeted by the USDA as a model mass bioenergy crop to replace petroleum energy products and meet policy demands. Although highly water use efficient, as a warm‐season crop, switchgrass requires a significant amount of water during the growing season (April –September). However, locations that have highly reliable water availability are also ideal for profitable food crops (e.g. corn and soy growing regions) and food competition is a significant concern in regards to biofuel crops being grown on productive agricultural lands. Drier, marginal lands (lands on which normal agricultural crops are difficult to cultivate) are therefore potentially ideal locations to grow biofuel crops to ensure that food competition is not an issue. Genetics scientists at UC Davis are in the process of developing a modified variety of switchgrass that can withstand extended periods of drought while not substantially affecting overall yield. As this product is being developed, it is important to identify the potential geographical niche for this new drought‐tolerant variety of switchgrass. This project introduces a geospatial approach that utilizes both physical and economic variables to identify ideal geographic locations for this innovative crop.
Presenter: Sarah Lewis, Ph.D Candidate University of California Berkeley Berkeley, CA [email protected]

4/20/2012
1
S i P i l R blScreening Potential RenewableEnergy Sites Using GIS
Prepared by:Mark McGinnisDudekCalifornia GIS Conference April 2012
Energy

4/20/2012
2
California Renewable Energy Programs
2002 California Renewables Portfolio Standard (RPS) Program• 20% of energy use from renewable sources by 201720% of energy use from renewable sources by 2017• Executive order increasing renewable energy use to 33% by
2020• In 2009, 11.6% of all electricity came from renewable energy
sourcesCEC Emerging Renewables Program• Market based incentives• Funding for and incentives for renewable energy projects
California solar initiative
California Solar Initiative
Migrate program from CEC to Utility CompaniesSan Diego Gas & Electric (SDG&E) Solar Power InitiativeInitiative• Goal to produce 3,000 megawatts of solar-generated
electricity by 2017• Residential, Commercial, Industrial and Agriculture
properties
SDG&E Initiative for 100 megawatts of photovoltaic g p(PV) solar energy by 2011
74 megawatts will be purchased from independent power producers

4/20/2012
3
Solar Energy Siting
Determine Site Parameters
Project Team• Developer• Environmental expertsEnvironmental experts• Electrical engineers• Real estate brokers
Parameter Types• Parcels• Proximity to Transmission Lines• Proximity to Transmission Lines• Biological layers• NREL irradiation values

4/20/2012
4
Parcels
Ownership

4/20/2012
5
Slope
Biological Values

4/20/2012
6
Transmission and Irradiation
GIS Model
Data layer compilation
Run queriesRun queries

4/20/2012
7
Improvements
Additional parameters• Shape
Weight parameters
Computing power
Revise approachpp
Questions

4/23/2012
1
1
2
The Hazards U.S. Multi-Hazard (Hazus-MH) is a nationally applicable standardized methodology that estimates potential losses from earthquakes,
hurricane winds, and floods.
• Hazus-MH:
– Standardized risk assessment methodology
– Internationally accepted risk methodology
– Imports risk identification products easily
– Includes National inventory data
– Campus and online training
BASICS OF HAZUS
3
HAZUS-MH ALLOWS USER TO:
• IDENTIFY vulnerable areas that may require planning considerations
• ASSESS level of readiness and preparedness to deal with a disaster before disaster occurs
• ESTIMATE potential losses from specific hazard events (before or after a disaster hits)
• DECIDE on how to allocate resources for most effective and efficient response and recovery
• PRIORITIZE mitigation measures that need to be implemented to reduce future losses (what if)
4
It is an estimation tool, IT IS A MODEL
It is a planning tool, don’t forget…IT IS A MODEL
• It also assesses population needs related to emergency management
• It also allows users to compare results from different study case scenarios, including mitigation actions
HAZUS-MH is a planning tool that estimates damage and losses resulting from natural hazards.
HAZUS-MH is an empirical MODEL based on observation and experiment.
MODELS CAN BE MODIFIED!
WHAT IS HAZUS-MH
5
6

4/23/2012
2
HAUZS INVENTORY DATA
Risk Assessment / Damage Assessment
Aggregate Data Aggregated Data
Hazard Specific Data
Site Specific Data
7
HAUZS DEFAULT DATA
8
Contents and Building $ Values
9
School Information
Phone Numbers Generalized 1st Floor Elev.
Number of Pupils Limited Flood Protection info 10
Transportation Information
Use Description Replacement Cost
Variable of Traffic Capacity
11
12

4/23/2012
3
• General Building Stock –
– U.S. Census Bureau
– Dunn & Bradstreet
• Essential Facilities –
– Medical Care: American Hospital Association (2000);
– Emergency Response: InfoUSA, Inc. (2001);
– Schools: National Center for Education Statistics, & U.S. Department of Education (2003);
– Police and Fire Stations: InfoUSA, Inc.
• High Potential Loss Facilities –
– Hazardous materials: Toxic Release Inventory Database, U.S. Environmental Protection Agency (1999);
– Dams: National Inventory of Dams, United States Army Corps of Engineers (2003);
– Nuclear Power Facilities: U.S. Nuclear Regulatory Commission (2003)
WHERE DID THE DEFAULT HAZUS DATA ORIGINATE?
13
Tabular Data
CAD Information
Community Knowledge
Field Collection
Existing GIS Data
Forms/Permits
Coworker Knowledge
HAZUS LEVELS BASED ON DATA INPUTS & MODIFICATIONS
14
UPDATING HAZUS INVENTORY
1. Identify your most needed inventory categories and/or the HAZUS inventory deficiencies
• correct errors (i.e. buildings w/ incorrect location or attributes) • update incomplete data (i.e. add missing buildings, missing values) • fill empty categories (i.e. High Potential Loss Facilities)
2. Identify the analyses and associated input data you need • ex. economic loss analysis requires dollar valuations
__________________________________________________________________________________________________________________
3. Determine sources and approach for collecting the data • ex. existing databases, maps/aerial photos, field collection/GPS, etc. • may require research and contact
4. Determine approach for entering the data into HAZUS
15
• Comprehensive Data Management System (CDMS) Tool
– As a complementary tool to HAZUS-MH, the CDMS provides users with the capability to update and manage statewide datasets.
• Inventory Collection Survey Tool (InCAST)
– InCAST is a software application to facilitate the collection of building-specific data for HAZUS.
• Flood Information Tool (FIT)
– The Flood Information Tool (FIT), released in 2002, was designed to process and convert locally available flood information to data that can be used by the HAZUS Flood Module.
HAZUS PROVIDES USEFUL TOOLS FOR
DATA UPDATE AND MODIFICATION
16
DATA AGGREGATION
Census Block
17
Census Block
AGGREGATED DATA
18

4/23/2012
4
Census Block
19
Census Block
20
HAZUS’ AGGREGATED DATA
IS THIS THE BEST DATA TO USE FOR A CITY/TRIBE/UNINCOPERATED AREA?
21
AGGREGATION OF DATA
Information in these categories are aggregated.
Data is grouped by census geography –
Tract : Hurricane
Earthquake models
Block : Flood model. This generalizes the data, it has advantages in that data can often times be easier to understand when it is presented by "area", especially in the form of a map where visual patterns can often be more distinctive. What occurs when this aggregation assumes the overly generalized parameters?
22
HOW DO THESE WORK FOR MY COMMUNITY?
23
IS THIS APPROPRIATE FOR MY COMMUNITY ?
24

4/23/2012
5
MOST PARAMETERS CAN BE CHANGED AT THE USERS DISCRETION/INPUT
25
HOW ABOUT CENSUS DEMOGRAPHICS?
26
DATA UPDATE AND INTEGRATION IS THE JOURNEY TO HAZUS SUCCESS.
27
YUROK TRIBE
28
29
30

4/23/2012
6
31
32
33
34
35
CHANGING UNEXPECTED PARAMETER TO FIT THE NEEDS OF
TRIBAL/LOCAL/RURAL COMMUNITIES
MODIFICATIONS 36

4/23/2012
7
WHAT GEOGRAPHY IS BEST FOR YOUR JURISDICTION?
• State
• County
• City
• Watershed
• Census Tract
• Reservation
• A MIXTURE of all
DOES THE CENSUS HAVE THE CORRECT GEOGRAPHY?
37
CENSUS TRACT BOUNDARIES
38
CENSUS BOUNDARIES FOR RESERVATIONS
Misaligned Boundary
39
THE METHOD OF MODIFYING CENSUS TRACT
40
CENSUS BLOCK BOUNDARIES
41
Housing Developments are built in groups around linking streets BUT some Census Blocks cut these
Similar (if not identical) homes into separate Blocks. Therefore it skews the aggregation within HAZUS
CENSUS BLOCK BOUNDARIES
42

4/23/2012
8
INTERGRATING COMMUNITY GROUPS AND CENSUS TRACTS/BLOCKS
43
REMINDER Hazus-MH Data
The Hazus software includes data for every census block in the United States.
•Demographic data from the U.S. Census Bureau provide estimates of income, population, demographics, occupancies, and housing unit development.
•U.S. Census Bureau and Dun & Bradstreet data provide information about the general building stock inventory.
•Department of Energy (DOE) data define regional variations in characteristics such as number and size of garages, types of building foundations, and number of stories within a building.
In addition to aggregate data, Hazus contains site-specific data for essential and high-profile facilities.
44
DATA COLLECTION & UPDATE OF NEEDED PARAMETERS
Tabular Data
CAD Information
Community Knowledge
Field Collection
Existing GIS Data
Forms/Permits
Coworker Knowledge
45
46
47
48

4/23/2012
9
Data is grouped and totaled by census geography Census may not be reliable
Data aggregation
Skews damage estimation Ex: within a Census Block it assumes homes equally
spaced, not clumped in housing developments.
National Data from 2000 Growing communities, changing communities
REASONING
49
Rachel R. Rodriguez [email protected]
(530) 625-4130 Ext:1632
50
51

Mapping of Streams and Passage Barriers for Ocean to Headwater Salmon Migration
2012 CalGIS Conference
Martina Koller, Delta Stewardship Council Brett Holycross, Pacific States Marine Fisheries Commission
Tom Christy, California Department of Fish and Game
Finding a Way Home Without Hitting a Road Barrier
Photo by Mike Love

OUTLINEProject background
Hypothesis
Objectives
Data sources
Analysis
Results
Conclusion
Data delivery
Data visualization
Contributions

STREAM HABITAT FRAGMENTATION
Salmon are born in freshwater, migrate to ocean where they mature, return as adults to native stream to reproduce.
Almost every stream has been fragmented with barriers.
Barriers block or delay salmon movement.
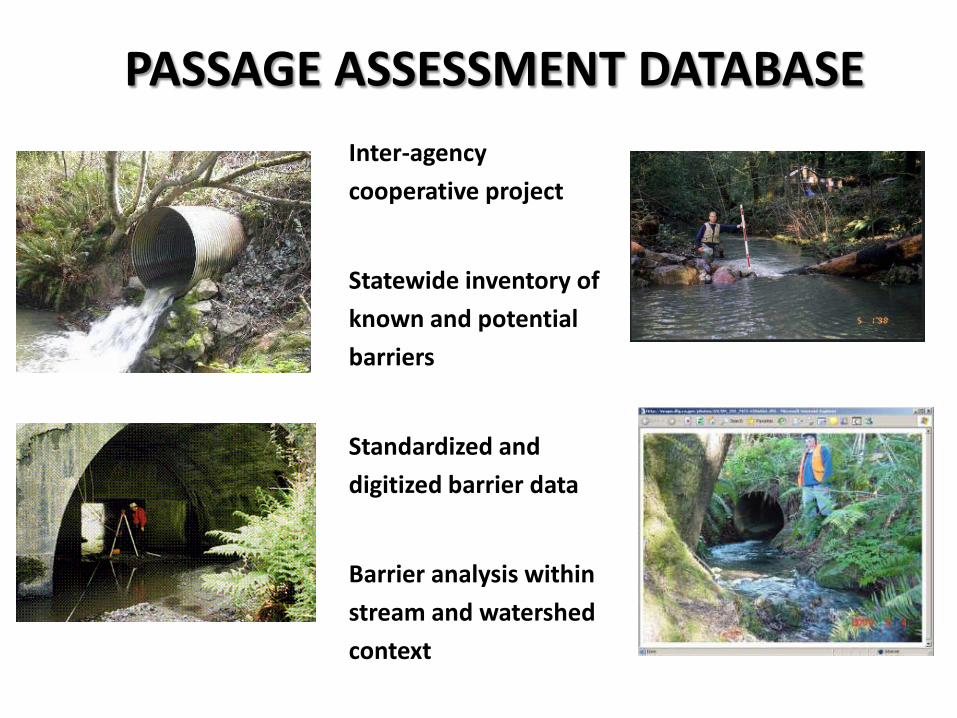
PASSAGE ASSESSMENT DATABASE Inter-agency cooperative project
Statewide inventory of known and potential barriers
Standardized and digitized barrier data
Barrier analysis within stream and watershed context

PASSAGE ASSESSMENT DATABASE

PROJECT HYPOTHESISThe Passage Assessment Database (PAD) describes the state of fish passage and salmon habitat fragmentation in California, and allows identification of opportunities for stream connectivity restoration and implementation fish passage improvement projects.


PROJECT GOALS AND OBJECTIVES
Perform stream network analysis of PAD barriers to provide input for restoration project prioritization.
Assign barrier order within the stream network
Identify upstream and downstream closest neighbor
Calculate minimum stream miles to the next barrier
Summarize barriers upstream and downstream
Provide input for advanced optimization

DATA SOURCES
Fish data: distribution, abundance, migration routes, rearing and spawning habitat
(point, linear, polygon features, raster images)
Stream data: hydrography(linear)
Fish passage: attributed barriers (point)
Supporting datasets: watershed (polygon)

GIS TOOLSNETWORK ANALYST
dynamic modeling
routing
flow direction
closest facility
service area
TRANSPORTATION NETWORK
UTILITY NETWORK

GEOMETRIC NETWORKNATIONAL HYDROGRAPHY DATASET (NHD)
Klamath Basin
BUILD GEOMETRIC NETWORK WIZARD
NHD flowlines

HYDROGRAPHY NETWORKCONNECTIVITY
check for loops
disable looping reaches
FLOW DIRECTION
set stream flow direction
NETWORK ATTRIBUTES
linear referencing
dynamic segmentation
locate features
snap barriers

NETWORK ANALYSIS PROCESS
PROCESS
1. Create junctions flags from points
2. Select barriers as the point layer
3. Run tracing tools
4. Return results as selections
5. Add new fields: order and stream length
6. Export selected results to feature class
7. Build custom queries

STREAM BARRIER ORDER

UPSTREAM TRACING

DIVERSIFY ANALYSIS ON BARRIER ATTRIBUTES

ANALYSIS ISSUES
Disabling loops and checking for connectivity is time consuming
Setting flow directions in flat areas or in canals problematic
Input of accurate barrier locations is critical for a reliable network analysis results
Results of the linear referencing of barriers need quality control

ANALYSIS SUMMARY
Dam (1,693)Stream Crossing (5,425)Other Type (405)Water Diversion (7,780)Fish Passage Facility (56)Non-structural (1,874)Log Jam (1,673)Unknown Type (188)

DATA DELIVERY ON CALFISH WEBSITE

CALFISH ONLINE DATA ACCESS


Special thanks to:
Department of Fish and Game US Fish and Wildlife Service
Coastal ConservancyNOAA Fisheries
Department of Water ResourcesCalifornia Department of Transportation
California Fish Passage Forum
and many others who contributed their data, knowledge and expertise
Photo by Ross Taylor
Coho salmon, chinook salmon, steelhead and coastal cutthroat are now found spawning upstream of a
former barrier on Lindsay Creek, tributary to Mad River, following
a 50-year of absence
FISH PASSAGE SUCCESS STORY
Special Thanks:

4/19/2012
1
Web-based Collaboration Tools in Natural Resourcein Natural Resource Management
Prepared for:CalGIS 2012Sacramento, CAApril 12, 1:30-3:00, Beavis Rm
Discussion Topics
Dudek backgroundProject background and playersCollaboration ToolsCollaboration Tools• Project Web Portal
– Documents– Species Models Authoring/Documentation/Static Results
• FTP Site for GIS Data Download• Enterprise GIS Database• Internet Mapping Applicationste et app g pp cat o s
– Interactive results
Lessons Learned

4/19/2012
2
Dudek Background
Dudek is 250-person engineering & environmental consulting firm founded in 1980
We creatively solve regulatory and technical challenges for municipal agencies and major landowners throughout Southern California
We specialize in the following sectors:• Water/wastewater
D l t• Development• Energy• Education • Transportation
Dudek Background – Natural Resources
Biological Monitoring & PermittingFire Protection PlanningNative Habitat Design and RestorationNative Habitat Design and RestorationRegional and Large-Scale Habitat Conservation PlanningUrban Forestry & Oak ManagementWetlands Restoration & Delineation

4/19/2012
3
Project Background – CA Renewable Energy• Renewable Energy in CA – Governor’s
Renewable Energy Executive Order (November 17, 2009)
• Established in policy a new 33%Established in policy a new 33% renewable energy portfolio standard for CA
• Directed state Departments to collaborate to streamline renewable energy project permitting and review:
– Established Renewable Energy Action Team (REAT)Action Team (REAT)
– Required development of a Desert Renewable Energy Conservation Plan (DRECP)
Project Background - REAT Team
Provide protection and conservation of CA desert ecosystems while proving streamlining of permitting for appropriate renewable energy developmentfor appropriate renewable energy development projects

4/19/2012
4
Project Background - Conceptual Organization
Project Background - DRECP Project Team
CEC – Client
Dudek – Lead Consultant
ICF – Partner ConsultantICF Partner Consultant

4/19/2012
5
Project Tasks
Planning GoalsRegulatory ContextEnvironmental SettingEnvironmental SettingConservation Planning ProcessConservation StrategyMonitoring & Adaptive Management PlanCovered Renewable Activities (Solar, Wind, Geothermal, Bioenergy), gy)Conservation Analysis – Covered SpeciesPlan Implementation
Technology Tools Needs
Manage and Publish DocumentsManage and Publish Spatial DataAuthor Species Models & Post ResultsAuthor Species Models & Post ResultsInteractive Mapping Results

4/19/2012
6
Technology Solutions
MS SharePoint for Web Portal• Document Publishing/Sharing• Spatial Data Inventory List (~500+)Spatial Data Inventory List ( 500 )• Species Model Authoring
FTP Site for Spatial Data SharingESRI ArcSDE for Enterprise GeodatabaseESRI ArcGIS Server for Web mapping Applications
CollaborationInternet Portal for CollaborationMultiple Consulting Firms
Client VisibilityPublic Agency Visibility

4/19/2012
7
Document Publishing/Sharing
Data for DRECP – Over 500 layersClimateTopography/Geology and SoilsGroundwaterHydrology and GeomorphologyEcological ProcessesNatural Communities and Land Cover TypesBiological DiversitySpeciesExisting Land Use and Ownership Planned Land Uses Scenic ResourcesCultural Resources Renewable Infrastructure

4/19/2012
8
Spatial Data Inventory
Data Sharing – FTP Site
Established FTP Site with secure login rightsPublish Data Packages by Themes• Biology• Biology• Political• Renewables
Publish to Specific Groups• Consultant Team• Project Team• REAT Review Team• REAT Review Team

4/19/2012
9
Species Habitat Suitability ModelsWhere do species use habitat?
Types of Habitat Suitability Models:G l• General
• Breeding/Nesting/Roosting• Foraging• Wintering • Aquatic
GIS Data Inputs:• Vegetation
Soils• Soils• Hydrology• Terrain• Others
Species Habitat Suitability Models
Map Algebra - Geoprocessing
Results of Model
Validate Model

4/19/2012
10
Species Model Page – Process Overview
Visible DocumentationGIS Datasets for Input ParametersBiologists AuthorGIS run Analysis & Post ResultsBiologists Approve or Rerun with new input values
Species Model Page - continued
Input by BiologistGIS Datasets for Input ParametersParametersBiologists AuthorGIS lock record, Run Analysis & Post ResultsBiologists Approve or Rerun with new input values

4/19/2012
11
Species Model Page - continued
Species Model Page - continued

4/19/2012
12
View Summary Record
Enterprise ArcSDE GeodatabaseImproved Performance for large data analysis (102 GB)Multi-User work
DRECPSpecies Models

4/19/2012
13
Final Documentation Report
ArcGIS Server Web App

4/19/2012
14
Lessons Learned
Transparency is key to building trustFor large project efficiencies with multiple agency/company participants – collaboration toolsagency/company participants – collaboration tools are a mustIf you force model choices based on GIS data classifications, much easier to run models cleanly and efficientlyInteraction with GIS data in mapping environment is criticalcritical
Questions…
Lisa Lubeley, [email protected]


•Documentum • Application Extender
•Data Stream • Customer Service • Job Costs • Service Orders • Meter Accounts
•Granite XP •IWater •SCADA •ArcGIS
•ArcGIS •RasterX •Access Databases •Excel Spread Sheets
•Excel Spread Sheet Apps •Data Stream
• Meter Accounts
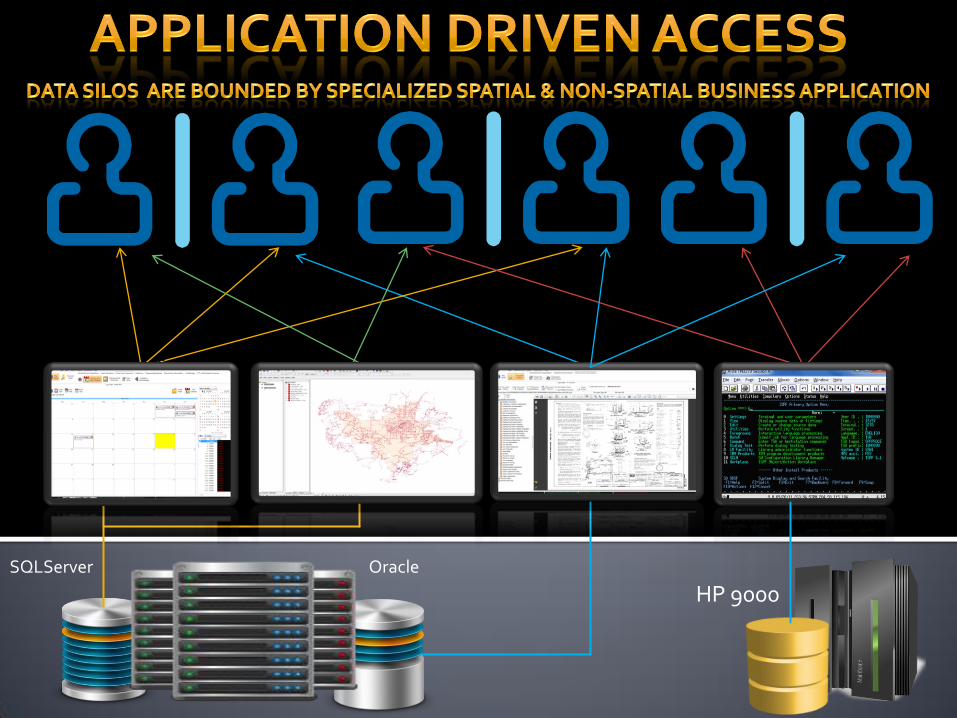
SQLServer
HP 9000 Oracle
•ArcGIS •RasterX •Access Databases •Excel Spread Sheets

1. Application Driven access requires staff to use multiple applications to gather data from different functional groups.
2. Spatial data integration usually requires more than one vendor and or application. 3. Data is usually not transparent , (proprietary data stores, data obfuscation and
middleware) are very common. 4. Licensing can be an impediment to giving all agency staff access.


1. Data Organization and Transparency is the Focus. 2. A data model based on spatial attributes rather than spatial objects. 3. The definition of data is not driven by software. 4. Data is Data : There is No Special Data

SQLServer Database
HP Unix Eloquence Database Oracle Database
•ArcGIS •RasterX •Access Databases •Excel Spread Sheets

Access to Data & Information Access to Spatial Functionality & Performance Access to Business Applications & Customization Easy Deployment & Administration

1. Performance metrics are based on 1,000,000 parcels 1,200,000 Addresses and 50,000 Streets.
2. Spatial performance should not degrade with increase in concurrent use.
3. A caching solution requires hands free updates to the client.
4. Document Manager & GIS functionality must be self contained within the framework and not rely on any third party applications or runtimes.
5. Supported GIS Vector File Formats R/W to Include: • DXF-ASCII, GML, JSON , MIF, TAB, ESRI
Personal Geodatabase, Shapefile, Geomedia Access Warehouse, Geomedia SQL Server Access Warehouse, OpenGIS, TatukGIS SQL Layers, SQLite Spatial, KML.

6. Supported GIS Enterprise Database Formats R/W to Include: • ESRI ArcSDE Spatial (write attributes only) • MapInfo SpatialWare • Microsoft MSSQL Spatial Server (Katmai) • PostGIS Spatial • Oracle Spatial / Locator
7. Primary Storage for Map Layers is inside the Database.
8. Ability to convert shapefiles into database or SQL Layers and visa versa without middleware.
9. Ability to edit database layers without the need for middleware or expensive editors.
10. Support most major image formats.

1. Briefcase deployment for maximum performance. 2. Server deployment (just drop a short cut onto the
client desktop). 3. Field deployment is used for mobile off-line laptops.
1. Register Data Window computers. 2. Manage application access and
permissions form the Data Window.
3. Manage Data Window Users. 4. Field Laptop Administration from
the Data Window.
Map and applications are accessed off the client.
Map and applications are accessed off the server.
Both deployments use identical access to the office database.
Map and applications and database are all on the field laptop.
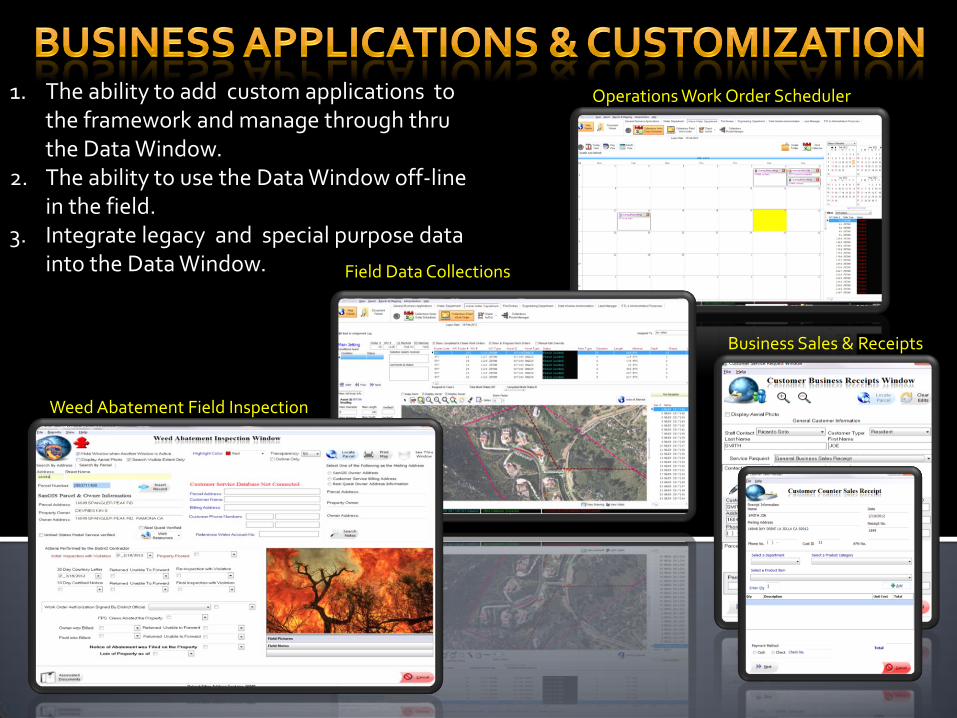
1. The ability to add custom applications to the framework and manage through thru the Data Window.
2. The ability to use the Data Window off-line in the field.
3. Integrate legacy and special purpose data into the Data Window.
Operations Work Order Scheduler
Field Data Collections
Weed Abatement Field Inspection
Business Sales & Receipts


Resources Digital Artifacts optimized to convey stories

Resources Digital Artifacts optimized to convey stories


Resources Digital Artifacts optimized to convey stories

Resources Digital Artifacts optimized to convey stories

4/19/2012
1
Utilizing GIS for CEQA, Aesthetics and Visual Simulations
C A L G I S 2 0 1 2
Outline
Background – Aesthetics, Visual Resources and CEQACEQA
Why use GIS for Aesthetics, Visual Resources and CEQA
Project ExampleWind Turbine - magnitude of visibility analysis

4/19/2012
2
Background
Aesthetics, as addressed in the California Environmental Quality Act (CEQA) refers to visual Environmental Quality Act (CEQA), refers to visual considerations, including scenic resources, scenic vistas, changes in visual character, and lighting or glare
Process to assess logically visible changes and any anticipated viewer response to that changep p g
Tool used by agency and local/regional government staff to review and assess proposed projects
Background
Adverse visual effects can include the loss of natural features or areas, the removal of urban features with features or areas, the removal of urban features with aesthetic value, or the introduction of contrasting urban features into natural areas or urban settings
Used to evaluate key visual resources in the project area, and to determine the degree of visual impact that would be attributable to a proposed project

4/19/2012
3
Background
ComponentsBased on a policy evaluation Based on a policy evaluation
Description of the site selection and design review process
A site inspection of key viewsheds and visual resources
Photo reconnaissance to document key resources
May include visual simulations and/or photo simulations
GIS for Aesthetics, Visual Resources and CEQA
GIS can be used to support spatial and visual components of analysiscomponents of analysis
Regional Context (surrounding land use, scenic resources, other locations of interest)
Photo reconnaissance document/map(s)
Viewshed Analysis (what can be seen from a location)
Observer Analysis (what locations can see an observer/object)
Pre design site selection evaluationPre-design site selection evaluation

4/19/2012
4
Challenges with using GIS for Visual Resources
Base data scale/accuracy
Interpretation of analysis resultsInterpretation of analysis results
Available information
Example Project
Installation of single 100m (330’) wind turbine on existing industrial use site in Ventura Countyexisting industrial use site in Ventura County
County planning staff conducted viewshed analysis on project and expressed concerns with overall site visibility
ECORP retained to review analysis, conduct photo simulations and make recommendations on project p jand/or analysis methods

4/19/2012
5
Project Location
Initial Turbine Viewshed

4/19/2012
6
Issues with Initial Viewshed Analysis
Assumes equal viewshed impacts regardless of how much of the turbine in visiblemuch of the turbine in visible
Does not take distance from turbine into account
Does not take local topography and man-made features into account
Addressing Amount of Turbine Visible
Wanted to assess percent of turbine that can be seen from various locationsfrom various locations
Assumption that seeing small portion of blades = less impact than full turbine and tower
Generated iterative model for calculating percent of turbine at all locations
Assessed magnitude of turbine visibility at variety of distances

4/19/2012
7
Turbine Visibility Model
Begin with understanding of Observer Analysis tool in ArcGISin ArcGIS
Required DataElevation Raster
Turbine Location (point feature class)
Turbine Height (attribute information)
Turbine Visibility Model

4/19/2012
8
Turbine Visibility Model
Turbine Visibility Analysis
Additionally Conducted
Turbine Distance Visibility Analysis Turbine Distance Visibility Analysis
X-section generation
Photo Simulations

4/19/2012
9
Visibility/Distance Analysis
Used ArcScene to simulate turbine size at specific distances from viewerdistances from viewer
Utilized Camera Controls and 3D model of similar turbine
Visibility/Distance Analysis
100m Turbine @ 0.5 mi 100m Turbine @ 1 mi 100m Turbine @ 2 mi
100m Turbine @ 3 mi 100m Turbine @ 4 mi 100m Turbine @ 5 mi3 4 @ 5

4/19/2012
10
X-section Generation
Many decision makers are accustomed to interpreting cross sectional graphicsinterpreting cross sectional graphics
Decided to utilize GIS tools to generate visibility cross sections graphics from DEM and model results
Call out geographic features as well as model resultsRoads/rivers/geologic features
Example Cross Section

4/19/2012
11
Photo Simulations
Collect photos at specific locations of interest
Superimpose post project condition onto existing Superimpose post-project condition onto existing image
Evaluate post-project site condition for degree of visual impact that would be attributable to a proposed project
Photo Simulation

4/19/2012
12
Results
County Planning Staff Accept Alternative Analysis MethodMethod
Cross Sections Approved
Project Pending
Main Issues with Analysis
USGS 10m DEM not at scale necessary for fully accurate model resultsaccurate model results
Does not take vegetation/structures into account
ArcScene does not allow for complex camera environment
Now use AutoCAD Civil 3D

4/19/2012
13
Visual Resources and LIDAR
LIDAR data addresses the two main concerns mentioned abovementioned above
High to very high resolution
Includes structures, vegetation, other potential impediments
Additionally can be used for surrounding land use, scenic resources, and locations of interest
Becoming publicly available through governmental g p y g gand private web-portals
Custom data collection offers maximum control
Modeling With LIDAR Data

4/19/2012
14
Modeling With LIDAR Data
Modeling With LIDAR Data

4/19/2012
15
Modeling With LIDAR Data
Modeling With LIDAR Data
Preliminary review suggests LIDAR data provide large benefit for Visual Analysislarge benefit for Visual Analysis
High computational cost for high resolution data
Challenges with ‘open structures’ like high voltage power line towers
Not consistently available in all areas
1st returns not always available1st returns not always available

4/19/2012
16
Questions
C O N T A C T I N F O R M A T I O N :
D A V E K R O L I C K
D K R O L I C K @ E C O R P C O N S U L T I N G . C O M
E C O R P C O N S U L T I N G B O O T H 3 0 5

1
Weed Abatement
GIS i th Cit fGIS in the City of Merced
Merced Fire DepartmentWeed Abatement Program
2011
RuthAnne Harbison, GISPRuthAnne Harbison, GISPGIS CoordinatorGIS Coordinator
2011Inspection, Compliance, Cleanup

2
Weed abatement inspections take place every spring in several California cities and counties where for many data gathering is still paper based and cumbersome. Searching for a way to use technology for this task, the City of Merced created a GIS web service using current ArcGIS Server technology that provides a more efficient and accurate way to gather and share the data. The web service, which includes imagery for reference and
t f l thi fi tmeasurement, was very successful this first year.
Program DescriptionThe Nuisance Abatement Program is designed toThe Nuisance Abatement Program is designed to eliminate fire and health hazards associated with seasonal growths of weeds and other hazards such as the accumulation of litter, brush, rubbish, scrap wood and similar materials.

3
Regulatory AuthorityThe California Government Code allows theThe California Government Code allows the local legislative body (City of Merced) to declare by resolution an Abatement Program.
Merced Municipal Code Title 8, Section 8.40.270 contains the Special Nuisance pAbatement Proceedings for Weeds and Rubbish adopted by the City.
Annual SurveysT h i i d i h S i hTwo to three inspection surveys done in the Spring, the first one is scheduled for three weeks.
City is divided by Parcel Books within the City Limits
Fire survey crews are divided by station/shift and given parcel book(s) for their areasparcel book(s) for their areas.
Crews begin the inspection surveys at the start of the program and turn in the books as they are completed.

4
Current ProcessEach crew drives down the streets in their inspectionEach crew drives down the streets in their inspection areas with the Assessor Parcel Books.
When a crew member notes that a particular parcel has a hazard (weeds, debris pile, mattresses, and other assorted potential hazards), the associated parcel is coded (shaded in) with a predetermined color pencil.coded (shaded in) with a predetermined color pencil.
After all the parcels in the book have been inspected and coded, the crew members would enter the parcel numbers into an Excel spreadsheet.
The Excel spreadsheet was turned into support staff for entry of the parcel numbers into a DOS print batch program.
Using the parcel numbers the print batch program pulled the parcel owner’s information from the City database.
Then the support staff would run the print batch program to print the Weed Abatement notices and mail them outto print the Weed Abatement notices and mail them out.
A copy of the Excel spreadsheet was then placed in the Parcel Books for the next survey for the fire inspection crews.

5
GIS Web ServicesI 2011 d i GIS h l i hIn 2011, suggested using GIS technology to improve the current system.
Using ArcGIS desktop and server, developed a web service with field editing capabilities.
Tested on Toughbook laptop.
Used a combination of old and new for 2011.

6
Initial IssuesAi d d b l d i d h bAircard proved to be too slow. It was determined that best practice this year would be to use the books in the field and transfer information in the office with a computer on the network
Short time for training.
Workflows had to be written for both the field inspection and post inspection data processing.
How it Works• Using ArcGIS Desktop, an mxd was created to include all g p,
the data layers the inspection crews would need.• This mxd was published to ArcGIS Server.• A web service was created in ArcGIS Server with one
editable data layer – parcels. Functionality was built into this layer as requested by the inspection crews.
• All that is needed to use this service is a web browser on• All that is needed to use this service is a web browser on any City computer.
• Field crews , with an air card can connect to the City network and use the service as well.

7
Inspection Workflowi d i h h h i h l b k• Fire crews drive through the areas in the parcel books
assigned to them looking for hazards that would pose a fire risk.
• When a parcel is determined to be a hazard, it is color coded in the parcel book.
• Once crews return to station, using the web service on the city intranet, the data is entered into the SDE parcel layer.
• When data entry was completed, the books were turned into support staff for processing the weed abatement notices for mailing.
Post Inspection WorkflowP i i kfl i i f fi ff• Post inspection workflow training for fire support staff included a streamlined course in GIS, working with the mxd, extracting the data, converting to Excel, and importing into the print batch program.
• Developed workflow during the training to best fit using old and new practices.
• Created First Survey shapefile to be used in Second Survey for reference.
• Met all deadlines of the program, notices sent out.

8
Suggestions from staff…ik d i h l• Liked using technology more
• Would like to see parcels change as edited• Would like to have an auto date• Would like to be able to enter same information once for
multiple selections the same time• Would like to be able to use the Toughbooks in the fieldWould like to be able to use the Toughbooks in the field• Make some fields mandatory• Turn off unnecessary fields.
Let’s take a look…

9

10

11
First Survey2599 Parcels3774.6 Acres

12
Second Survey:597 Parcels1656.5 Acres
2012Still on version 9.3.1Simplified editing table for staffUsing simple one page letter
Looking at changing other inspections to the “GIS” format.

13

14
R hA H bi GISP
Thank you….RuthAnne Harbison, GISP
GIS Coordinator
City of Merced
678 W 18th St
Merced California 95340Merced, California 95340
(209) 384-5789

4/19/2012
1
The good and bad aspects of using tablets for field data viewing and capture
CalGIS 2012 Sacramento
Open Spatial Innovative Risk Averse Geospatial Solutions
CalGIS 2012 Sacramento
Colin HobsonOpen Spatial Corporation
Rocklin, [email protected]
Solution areas
Open Spatial Innovative Risk Averse Geospatial Solutions

4/19/2012
2
Solution components
Munsys AppsMunsys Apps(AutoCAD)(AutoCAD)
Munsys AppsMunsys Apps(AutoCAD)(AutoCAD)
Munsys AppsMunsys Apps(AutoCAD)(AutoCAD) Web AppsWeb AppsWeb AppsWeb Apps
Mobile
Mobile
Open Spatial Innovative Risk Averse Geospatial Solutions
Data StoreData Store(Oracle)(Oracle)
Other dataOther datastoresstores
Mobile
Field Intelligence
Open Spatial Innovative Risk Averse Geospatial Solutions

4/19/2012
3
GPS on a tablet
Open Spatial Innovative Risk Averse Geospatial Solutions
The promise
• See all your data in the field or wherever on a mobile device
• Capture and update data as desired• Take photo's and more• Capture reports/work orders• Improved connectivity
Open Spatial Innovative Risk Averse Geospatial Solutions

4/19/2012
4
Case study
• MS4 reporting and field data capture tool• Hands on demo
Open Spatial Innovative Risk Averse Geospatial Solutions
Field Intelligence
Open Spatial Innovative Risk Averse Geospatial Solutions

4/19/2012
5
Field Intelligence
Open Spatial Innovative Risk Averse Geospatial Solutions
Photos
Open Spatial Innovative Risk Averse Geospatial Solutions

4/19/2012
6
Photos
Open Spatial Innovative Risk Averse Geospatial Solutions
Photos
Open Spatial Innovative Risk Averse Geospatial Solutions

4/19/2012
7
Field changes recorded
Open Spatial Innovative Risk Averse Geospatial Solutions
Field Intelligence
Open Spatial Innovative Risk Averse Geospatial Solutions

4/19/2012
8
The technology stack
• Yet another OS and application• Connected or disconnected• Mobile application can become complex• Rapidly changing device and technical
environment
Open Spatial Innovative Risk Averse Geospatial Solutions
User experience
• Outdoor screen visibility• Battery life• Selection on map• Data entry• Device size• Connection speed• GPS accuracy
Open Spatial Innovative Risk Averse Geospatial Solutions
• GPS accuracy• Need appropriate maps setup

4/19/2012
9
Data capture challenges
• Data update workflows – Live update or
Ch h ( h d h – Change request approach (who can update the data)
Open Spatial Innovative Risk Averse Geospatial Solutions
The reality
• Good– Does provide a very useful field tool– GPS, photo, data entry and map all together in one is great– Devices not too expensive– Devices not too expensive– Huge benefit to be able to see what data one has while at the actual
asset– Apps can be made available to the public
• Bad– Fairly complex technology stack - not that cheap to develop, maintain
and support– Data usage costs can become a problem– Not survey grade
Open Spatial Innovative Risk Averse Geospatial Solutions
Not survey grade– Yet another application for personnel to learn and use– Public reporting apps may create pressure not wanted by the
organization

4/19/2012
10
Contact us at
ti l
Open Spatial Innovative Risk Averse Geospatial Solutions
www.openspatial.com

4/19/2012
1
Census 2010 Data Highlight Census 2010 Data Highlight Changing DemographicsChanging Demographics
Information + action for social change
Changing DemographicsChanging Demographics
CalGIS 2012
Dr. Ali Modarres Professor and Chair of the Department of Geosciences & EnvironmentCalifornia State University, Los Angeles

4/19/2012
2
The ACS asks different questions.

4/19/2012
3
The Geographies are also different.
TIGER/Line files mapped with ArcMap 10.0 and Bing basemap

4/19/2012
4
Creating the 2000‐2010 Comparable Geography
2010 Blocks
2010 Data
Join2010 Blocks contained
Export2000 Tracts
Spatial Joincontained in Census 2000 Tracts
Merge
2000‐2010 Comparison Geography
Check Data
Not all 2010 Blocks were completely contained in 2000 Tracts. For those
2010 Blocks with majority of area in a 2000 Tract
IntersectAgainst2010 Data
that weren’t:

4/19/2012
5

4/19/2012
6

4/19/2012
7

4/19/2012
8

4/19/2012
9

4/19/2012
10
Compare on HealthyCity.org
Draw Neighborhoods and Measure Change; create tables and charts for reports.

4/19/2012
11
Major Findings
1. Diverse population increases in Lancaster/Palmdale require different service planning strategies than in established p g gneighborhoods.
2. Changes reflect developments in Lancaster/Palmdale, and thedowntown/metro area.
3. The population is aging, with a larger workforce‐aged population. Education and job training to take a more important role.
Next Steps
1. Create statewide analysis by Public Use Microdata Areas (PUMAs).( )
2. Research policy and funding strategies to adjust resources to meet changing demographics and support the growing workforce.

4/19/2012
12
Thank YouThank You
Information + action for social change
Contact Chris Ringewald, [email protected] for more information

4/27/2012
1
City of Rancho CordovaCity of Rancho CordovaGrowing Strong NeighborhoodsGrowing Strong Neighborhoods
GIS SupportGIS Support
GIS ManagerCity of Rancho Cordova
Mark [email protected]
Growing Strong NeighborhoodsGrowing Strong Neighborhoods
R f d ff f h Ci d i R f d ff f h Ci d i Refocused efforts of the City and its Refocused efforts of the City and its residents to establish pride, sense of residents to establish pride, sense of
ownership, and investment at the ownership, and investment at the locallocal community level.community level.

4/27/2012
2
Growing Strong NeighborhoodsGrowing Strong Neighborhoods
Expected ResultsExpected Results
•• Residents feel connected to each other Residents feel connected to each other and part of a common cause.and part of a common cause.
•• Increased communication opportunities Increased communication opportunities between the community and City.between the community and City.
•• Residents feel safe in their environment.Residents feel safe in their environment.
•• Thriving business climate.Thriving business climate.
Growing Strong NeighborhoodsGrowing Strong Neighborhoods
The City is following TWO paths:The City is following TWO paths:
FirstFirst, specific City services are being focused on , specific City services are being focused on "hot spots" within the community."hot spots" within the community.

4/27/2012
3
Growing Strong NeighborhoodsGrowing Strong Neighborhoods
The City is following TWO paths:The City is following TWO paths:
SecondSecond, the city is attempting to create an , the city is attempting to create an atmosphere in which an increasing number of atmosphere in which an increasing number of people in the community take an active role in people in the community take an active role in the future of their respective neighborhoods. the future of their respective neighborhoods.
GIS Support SummaryGIS Support Summary
•• Defining and publishing Defining and publishing i hb h d/ it b d ii hb h d/ it b d ineighborhood/community boundaries.neighborhood/community boundaries.
•• Data analysis of community metrics as a Data analysis of community metrics as a baseline and understanding of problemsbaseline and understanding of problems
•• Analysis and mapping of “Hot Spots”Analysis and mapping of “Hot Spots”
S t f f d Cit i S t f f d Cit i P li P li •• Support of focused City services Support of focused City services –– Police, Police, Probation, and Code EnforcementProbation, and Code Enforcement
•• Spatial view of activity Spatial view of activity –– before vs. afterbefore vs. after

4/27/2012
4
NeighborhoodsNeighborhoodsChallengesChallenges
•• Process and AcceptanceProcess and AcceptanceP bli i l tP bli i l t–– Public involvementPublic involvement
–– Council Office / Supervisor OfficeCouncil Office / Supervisor Office
•• Variety of DefinitionsVariety of Definitions–– City definedCity defined–– Neighborhood associationsNeighborhood associations–– Watch areasWatch areas
•• Publishing TechniquesPublishing Techniques•• HardcopyHardcopy•• WebWeb•• Social MediaSocial Media
NeighborhoodsNeighborhoodsInternal UseInternal Use

4/27/2012
5
NeighborhoodsNeighborhoodsPublic Web GIS ViewerPublic Web GIS Viewer
Neighborhood Watch AreasNeighborhood Watch AreasPublic Web GIS ViewerPublic Web GIS Viewer

4/27/2012
6
NeighborhoodsNeighborhoodsNextdoorNextdoor Web SiteWeb Site
Data Analysis of Community Data Analysis of Community Metrics as a BaselineMetrics as a Baseline
•• Crime RatesCrime Rates•• Number of ProbationersNumber of Probationers•• Number of ProbationersNumber of Probationers•• Code Case LoadCode Case Load•• Occurrences of PanhandlingOccurrences of Panhandling•• Occurrences of GraffitiOccurrences of Graffiti•• Rental Property RatesRental Property Rates•• Truancy RatesTruancy Rates•• Truancy RatesTruancy Rates•• Student Turnover RatesStudent Turnover Rates•• Property ValuesProperty Values

4/27/2012
7
Data analysis of Community Data analysis of Community Metrics Metrics -- ChallengesChallenges
•• GeocodingGeocoding techniquestechniques–– Parcels and StreetsParcels and StreetsParcels and StreetsParcels and Streets–– Summarize by jurisdiction and Neighborhoods Summarize by jurisdiction and Neighborhoods
levelslevels•• Summarize by neighborhoodsSummarize by neighborhoods–– Raw number or ratesRaw number or rates
•• Many variables drive the statisticsMany variables drive the statistics–– Economy / jobsEconomy / jobsy jy j–– Housing MarketHousing Market
•• Detecting changeDetecting change–– Appropriate timeframesAppropriate timeframes
Hot Spots - Input Data

4/27/2012
8
Hot Spot - Analysis
Hot Spots Hot Spots -- Focus Areas and Target Focus Areas and Target PropertiesProperties

4/27/2012
9
Hot SpotsHot SpotsChallengesChallenges
•• Actual properties versus target areasActual properties versus target areas
•• Initial selection of focused workInitial selection of focused work
•• Field staff understand what needs to be Field staff understand what needs to be done in the target areas.done in the target areas.
•• Moving on to the next “Hot Spots”Moving on to the next “Hot Spots”
Support of GSN City servicesSupport of GSN City services

4/27/2012
10
Getting the Word OutGetting the Word Out
Support of GSN City ServicesSupport of GSN City ServicesChallengesChallenges
•• Communication of what GIS can offerCommunication of what GIS can offer–– Data, data, data Data, data, data (Example (Example --School district data)School district data)
–– Products Products –– maps, interactive viewers, statsmaps, interactive viewers, stats
–– Live map viewer during meetingsLive map viewer during meetings
•• Imbedding yourself into the processImbedding yourself into the processB k lB k l–– Become a key playerBecome a key player
–– Be proactiveBe proactive

4/27/2012
11
Growing Strong Growing Strong NeighbordsNeighbordsGIS SupportGIS Support
QUESTIONSQUESTIONS

4/19/2012
1
A Resource for all of California A Resource for all of California
Information + action for social change
CalGIS 2012

4/19/2012
2
…is an information + action resource that unites rigorous research, community voices and innovative technologies
to solve the root causes of social inequity
DIRECT TECHNICAL SUPPORT DIRECT TECHNICAL SUPPORT :
Work ON‐THE‐GROUND to develop targeted research/policy strategies
and web tools
COMMUNITY RESEARCH LABCOMMUNITY RESEARCH LAB
ONLINE MAPPING TECHNOLOGYONLINE MAPPING TECHNOLOGYwww.HealthyCity.orgwww.HealthyCity.org
COMMUNITY RESEARCH LABCOMMUNITY RESEARCH LAB
Training community groups to lead and sustain action‐oriented research &
technology projects

4/19/2012
3

4/19/2012
4

4/19/2012
5

4/19/2012
6

4/19/2012
7
byThe Guts of
FEATURESFEATURES
Basemap using NAVTEQ 2011 shapefilesCharts use fusion charts or Google chart
WEBSITE ENDWEBSITE ENDLinuxLinux
ApacheApachePHPPHP
MapServerMapServer
DATABASE ENDDATABASE ENDLinuxLinux
PostgreSQLPostgreSQLPostGISPostGIS
Geocoder developed in house (C++)Servers on Amazon EC2 Cloud
byThe Design of
Non‐GIS people don’t intuitively understand the best ways to analyze geographic data for their needs.
We need to balance creating distinct tasks with the ability to combine them in the propercombine them in the proper sequence.

4/19/2012
8
Mapping applications should
byThe Direction of
Mapping applications should connect to the user based on how they would use them.
People should experience websites based on the issue area or discipline they care about.
A few HealthyCity.org Advanced Features
• Save searches, maps & charts
• Upload your own Point & Thematic Datasets
• Filter school data by test scores, student pop., etc.
• Tell your Story (with Pictures, Video & Audio)
h l d h h• Search Stories, live maps, and more in the Share & Connect room

4/19/2012
9
Create Live Mapping Sessions
(with Pictures, Video & Audio)
A Live Map enables multiple people to :
• Draw and drop points, lines, and shapes on a shared map• Attach photos & video
Thank YouThank You
Information + action for social change
Contact Chris Ringewald, [email protected] for more information

Federal Overview of Geospatial Programs
Overviews of the U.S. Department of Homeland Security (U.S. DHS), the National Geospatial Intelligence Agency (NGA), and the Homeland Infrastructure Foundation Level Data (HIFLD) Working Group geospatial capabilities will be given. Topics covered include geospatial viewers, such as OneView and DHS Earth (based on the Google Earth platform), along with the Homeland Security Infrastructure Program (HSIP) Gold and Freedom datasets. Collaboration efforts by the HIFLD to the Regions (HTTR) team will also be discussed. Terrence Newsome Information Exchange Broker‐Southwest Region Cell/Text: (202) 480‐6037 Email: [email protected]

4/13/2012
1
Region 5 Fire & Aviation ManagementGIS Lab
Lorri Peltz-LewisApril 2012
Cal GIS
FAM GIS Lab History:
3 Managers since 1995 (CA�R5�Fire�GIS�Lab�was�the�first,�and�still�only,�GIS�Fire�Lab)
Initial Activities:•Preparedness – direct incident support•Training – now GIS-S (NWCG)•GIS/GPS Technology on Incidents•Started with Fire, now All Risks•Operations Support – GISS Hard Drives, Operations Support•Data Development

4/13/2012
2
FAM GIS Lab History (cont.):Continuing Activities:
•Support Fire Management Plan, Fire Program Analysis, and Fire Planning, Wildland Fire Decision Support System (WFDSS), •Hazardous Fuels Prioritization Allocation System (HFPAS)•Resource Efficiency Analysis – Air Base Locations, Helibase & Rappel capabilities, •Remote Automated Weather Stations (RAWS), •Support USFS, State, Federal, Interagency, County, City & Public
FAM GIS Lab Collaboration – Reaching In & Out:
Internal USFS Outreach:
•Regional Support – RSL Lab Coordination, Planning, Fire Modeling support, Resource analysis, GACC support, Fire Ecology support
•Forest support – preparedness, incidents Type 3-1, operational support
•USFS Data Resources – USFS Data, INFRA, FACTS, Geospatial Interface integration, & Data Beyond the Forests….
•But fire doesn’t respect boundaries…

4/13/2012
3
FAM GIS Lab Collaboration – Reaching In & Out (cont.):
External Outreach:• Other Federal Agencies (BLM, BIA, NPS, FWS, DHS, FEMA, etc.)
• California State Agencies (CAL FIRE, CAL EMA, CA Resources, etc.)
• Local Agencies (County, City, etc.)
• Partnerships and Collaboration Groups (Fire Councils, Western Governors Association, Western Regional Partnership, etc.)
•But fire doesn’t respect boundaries…
FAM GIS Lab Collaboration – Reaching In & Out:External Outreach:
•Fire MOU (USFS, DOI, CAL FIRE) – 5 year MOU about to be signed – MOU dates back to 1998. Pointing to collaboration & coordination on:
•2009 Guidance for Implementation of Federal Wildland Mgmt Policy•2010 Strategic Fire Plan for California
•NIFC – all Fire Agencies•NWCG GTG – invited as a technical advisor•CWCG – supporting DPA data•FIRESCOPE GIS Specialist Group Chair -

4/13/2012
4
FAM GIS Lab Collaboration – Reaching In & Out (cont.):External Outreach:
•CA Resources – California Atlas•CAL FIRE – Fire History, Protection Areas, GISS Hard Drive distribution, •CALEMA– All Risk responses•DHS, HIFLD, FEMA – HSIP Gold/Freedom, SW Data Wranglers•FGC3/CMC2 – Statewide GIS Coordination•FGDC – Geospatial Pillars •Western Governors Association – West Wide Risk Assessment•Western Regional Partnership•Public…….
FAM GIS Lab Data – Fire Data Stewardship & Support:
•Fire�uses�&�consumes�all�imagery,�all�roads,�parcels,�ownership,�etc.
•Fire�Perimeters�&�History�(Standards�– USFS�&�NIFC)
•Fire�Occurrence�(FIRESTAT)�– Point�of�Origin�(Standards�– USFS,�NIFC,�CAL�FIRE)
•Fire�Management�Units�(FMU)�(Standards�– USFS�&�NIFC)
•Fire�Base�Stations

4/13/2012
5
FAM GIS Lab Data – Fire Data Stewardship & Support (cont.):•Direct�Protection�Areas�(DPA)�– All�federal�agency�protection�areas
•Aviation�Hazards�(Standards�– USFS�&�NIFC)
•Wildland�Urban�Interface�(WUI)�(Standards�– USFS�&�NIFC)
•Fire�Engine�Water�Sources�(Standards�– USFS�&�NIFC)
•Fire�Retardant�Avoidance�(More�later…)
FAM GIS Lab Data – Fire Data Stewardship & Support (cont.):
•Fire�Barriers
•Burned�Area�Emergency�Response/Rehabilitation
•Fire�Ecology�with�Neil�Sugihara�&�RSL
•Fire�Severity�Atlas�with�Jay�Miller�&�RSL
•RAVG/Burn�Severity�with�Jay�Miller�&�RSAC
•Landscape�data�&�Fuels�– Strategic�Decision�Support�
•And�more�to�come…..

4/13/2012
6
FAM GIS Lab Data – Projects & Analysis:• Direct�Incident�Support�– technology,�equipment,�applications�(FIMT,�Imagery,�InfraRed,�etc.),�modeling�(FSPro,�WFDSS),�etc.
• Facility�Locations�&�Strategic�Support�– Air�Tanker�Bases,�Rappelling�Operations,�etc.
• Fire�Planning�&�Analysis�– HFPAS,�Cross�Border�Fires,�Suppression�Costs,�Aerial�Retardant�Avoidance�(T&E&S�species)�etc.
• Fire�Behavior�Modeling�Support�– WFDSS,�Fuels,�RAWS,�etc.
C
Incident Support – the equipment & pre-staging:

4/13/2012
7
Incident Support – the tools, operating procedures, products:
UPDATE�Due�April�2012!!
Incident Support – the tools, operating procedures, products:
UPDATE�Due�April�2012!!

4/13/2012
8
Incident Support – the tools, operating procedures, products:
UPDATE�Due�April�2012!!
Incident Support – models, models, models:
• Calculating Fuels or Loading – BIOPAK, ArcFuels, FUELCALC, etc.• Data Classification, Storage or Loading –LANDFIRE, WIMMS, WFAS, etc.• Emission/Smoke Mgmt/Air Quality –CALPUFF, FEPS, FOFEM, RAINS, etc.• Predicting Fire Effects – FEPS, FOFUM, etc.• Prescribed Fire Planning – BehavePlus,FARSITE, FETM, FBAT, etc.• Projecting Growth & Fire Behavior –FSPro, FARSITE, FlamMap , ROMAN, etc.• Vegetation Growth/Dynamics – FBS, FFE, etc.•Fuel Management Erosion Analysis –WHRM, FUELSOLVE, WEPP, etc.

4/13/2012
9
Fire Retardant Avoidance• July 2010 – US District Court invalidated USFS 2008 decision to continue using 2000 Guidelines
• August 2010 USFS announces EIS scoping
•Sources – Forests, NRIS, CNDDB, FWS Critical Habitat
• Final EIS out Oct 2011
•Since 2008 only 5 misapplications have happened across R5 = OUTSTANDING EFFORT
Fire Retardant Avoidance• Other products & coordinating efforts?
• Examples of WO Maps –

4/13/2012
10
Fire Retardant Avoidance• What about mobile technology?
• Requirements? What’s being used? Security?
• iPad testing
Fire Retardant Avoidance
• Continuing�work:• Distribution of data• Utilization of mobile technology• Data Updates and Maintenance
•2012 updates: • Database Template proposed for future updates• Reviews started, not completed, participation welcome!• 2012 update deadlines TBD

4/13/2012
11
Fire History – Data Call
• Annual update of statewide
• DID YOU KNOW –• Has fires back to 1800’s!• Older data not so good…• Data back to 70’s pretty good• Annual updates corrections allowed• All fire agencies collaborate!• NIFC/NWCG adopting nation wide
• Call out in November
• Release by CAL FIRE – this week?
Facilities - Rappelling Operations: Need for Initial Attack, including Large Fire support

4/13/2012
12
Facilities - Rappelling Operations: Risk Analysis
Facilities - Rappelling Operations: Alternatives & Gap Analysis

4/13/2012
13
IDOPP – Interagency Dispatch Optimization Priority Project
• Dispatch Optimization
• Fire, Law Enforcement, & other field staff
• 2 project areas:• California•Arizona/New Mexico
IDOPP – Complexity analysis, alternative development, & report

4/13/2012
14
IDOPP – Complexity analysis, alternative development, & report
IDOPP – Complexity analysis, alternative development, & report

4/13/2012
15
Common Operating Picture (COP)• Fire Situational Awareness Portal –http://geodiscovery.ntconcepts.com/firesap/Default.aspx• Access Possible – contact Lorri
Common Operating Picture (COP)
• Fire Situational Awareness Portal – Fire Globe http://geodiscovery.ntconcepts.com/firesap/Default.aspx

4/13/2012
16
Common Operating Picture (COP)
• Wildland Fire Geoportal – Wallow Fire Pilot (Future NIFC FTP???) http://usfsportal-ms.esri.com/home/
Common Operating Picture (COP)
• CAL EMA – Hazard Mitigation Portal & MyPlan

4/13/2012
17
Common Operating Picture (COP)
• CAL EMA – Hazard Mitigation Portal & MyPlan
Common Operating Picture (COP)
• CAL EMA – Hazard Mitigation Portal & MyPlan

4/13/2012
18
GPS for Fire Management
• GPS for Fire Management – 2 day class & 1 day class – class available
• 2- 1 day class @ Sequoia NF• 2 day class at McClellan• 2- 1 day classes @ Cleveland NF• 2- 1 day classes @ Eldorado NF
• Focus – hands on use of Garmin GPS with Trimble demos & discussions
• 50% field work
• DNR Garmin downloads (ArcGIS 9.3.1 and 10)
• Data Management
And what I didn’t get a chance to talk about…..
• DPA Population Analysis – who protects what where?• DPA Cost Analysis – protecting what where costs how much?
• GISS Hard Drives – updates for 2012• GSTOP updates – draft document out in April 2012, final in Dec 2012
• Automated Lightning Mapping – not updated for 10, still working at 9.3.x
• Fire Density – generating common density grids for fire analysis• Fire Occurrence – FIRESTAT issues with updating, accuracy, etc.
• Base Stations – issues with data structure, updating, etc.
• WildCAD Support – support issues, system update, etc.
• RAWS location analysis and improvement

4/13/2012
19
FAM GIS Lab How It All Fits??
CA�StateCAL�FIRECALEMACA�ResourcesPublic
NWCGNIFCDOI�(BLM,�BIA,�FWS,�NPS)
USFSFEMA,�DHS�(HSIP�Gold),�DOD,
FIRESCOPE�– County,�City,�Local,�Public

4/13/2012
20

4/19/2012
1
The Journey Toward Data Virtualization in ArcGIS in Government Agencies
Tom HeinzerManager, MPGIS, USBRSA, Agency GIS Tech. Team Chemical Engineer, GISP
Diane WilliamsPrincipal EngineerGIS/RS/ModelingAgency GIS Tech. Team
Chuck JohnsonRegional GIS Program ManagerRegional Lands ManagerRegional Fire Manager
MPGIS Service Center

4/19/2012
2
Struggled with agency level data management issues for almost 30 years
What’s this talk about?
New theoretical approach to enterprise data management
We think the Federal, State, and Local agencies may be interested
Originally designed for personal useOriginally designed for personal use,but evolved into an enterprise data management system
Systems were designed for ArcGIS
The unThe un‐‐learninglearning
8 years ago a small technical team at USBRstarted a theoretical research projectto re‐assess our fundamental notions about GIS data management

4/19/2012
3
In a nutshell:
We needed to UN‐LEARN one key notion:
That the physical organization of data is somehow fundamental to “organizing data”
What we really needed was a way to ‘virtually’ organize data
Wikipedia
Data Virtualization:
the presentation of data as an abstract layer, independent of y , punderlying database systems, structures and storage.

4/19/2012
4
DataSpace is a data virtualizer for ArcGIS
Required middleware in ArcGIS
And large amounts of alcohol
Nutshell: Layerfile attached to object
100’s of people have contributed
Mother

4/19/2012
5
ArcGISOnline
Enterprise File SharesEnterprise
SDE
ProjectAreas
GIS data are not going to be in one placefor a lot of reasonsfor a long time….yet we need to organize it for access
AgencyCloud
ServersLocal Data
ProgramSilos
ArcGISOnline
AgencyCloud
Servers
ProjectAreas
Enterprise File Shares
Local Data
ArcMap
EnterpriseSDE
ProgramSilos

4/19/2012
6
ArcGISOnline
AgencyCloud
Servers
ProjectAreas
Enterprise File Shares
Local Data
ArcMap Data SpaceMiddleware
EnterpriseSDE
ProgramSilos
ArcGISOnline
ProjectAreas Agency
Cloud Servers
Enterprise File Shares
Local Data
EnterpriseSDE
ProgramSilos
Note the name

4/19/2012
7
Windows folders
Virtualdata objects
Object haslayer file attached to it

4/19/2012
8

4/19/2012
9
Agency leveldata management
BureauTier
Data Stewards Only
Regional Tier
OfficeTier
No Restrictions
Con
trol
USBR Spatial Library
PersonalTier

4/19/2012
10
Searchable
Double Click to add to ArcMap

4/19/2012
11
Regional Data Tier Physical Data Storage
EDM

4/19/2012
12
Research
Couple notes…
Data virtualization and ‘tiering’ solved many of our data management problems
On all GIS desktops in agency enables non professionalsOn all GIS desktops in agency‐ enables non professionals
Significantly reduced time spent on data management
Non‐invasive
Potentially useful to the greater GIS community
Software is freely available if you want to try itSoftware is freely available if you want to try it
Fun to use

4/19/2012
1
Creating Value …
… Delivering Solutions
Web Enabled Mapping: Yin & Yang
Steve Bein & Rick HendricksonSteve Bein & Rick Hendrickson
Web Enabled MappingYin & Yang
Not opposing forces
Complementary opposites
Within a greater whole
Part of a dynamic system

4/19/2012
2
Web Enabling Local Government
Good for Staff
Good for Decision Makers
Good for the Public
Web Enabling Local Government
IT Infrastructure
Security
Design

4/19/2012
3
Many Choices
In‐House
Private Cloud
Public Cloud
Many Choices
In‐House Maintenance and Operations
Private CloudWorking with Contractors
Public CloudIssues

4/19/2012
4
Types of Sites
Planning Applications
Utility Applications
Enterprise Applications
Types of Sites
Planning ApplicationsData Maintenance
Utility ApplicationsData Volume
Enterprise ApplicationsLinking Legacy Databases

4/19/2012
5
Choosing a Technology
So many great choices….
ArcGIS ServerSilverlight
Flex
Javascript
Google Earth
O SOpen Source
Choosing a Technology
ArcGIS ServerSilverlight
Flex
Google Earth
Open Source

4/19/2012
6
Designing Your Site
I want the site to do everything!
I want it to work for all the departments!
…and be Easy
Designing Your Site
Simple DesignsGetting the User to Go Along
Many Sites with a Single PurposeMore programming

4/19/2012
7
Project Example
San Bernardino Co. Stormwater
Project Example
City of Avalon Planning

4/19/2012
8
Project Example
Rancho California Water District
Summarize
Choices are Many
Plan Ahead
Technology Relatively Straight Forward
Can do Great Things

Streamlining Landbase
City of Roseville’s Evolving Design
CalGIS 2012April 13, 2012

2
Streamlining Landbase
Today’s Topics: Roseville overview Project and Drivers Project Scope and Planning Database Design Data Clean up and Migration effort Lessons Learned Benefits Roadmap

City of Roseville
City Information• Approximately 20 miles northeast of
Sacramento• Population of 118,788 (2010 US Census)
GIS Team• Hybrid Model
Esri shop• ArcGIS Desktop 10 – approx. 85 local installs• ArcSDE and ArcGIS Server 9.3.1
3

Landbase Project
Database consolidation project• Two databases maintaining the same data
One spatial database and one non-spatial (legacy)
Project Drivers:• Reduce maintenance• Create a design that met the City’s business
needs Integration with enterprise systems
4

Project Scope
What did we set out to do?
Eliminate the non-spatial database and make the GIS the system of record for landbase data
Create an Address Point feature class
Develop a more robust Landbase dataset• Relationship classes, tables, subtypes, domains
and more5
DB
GDB

Project Team
The most CRITICAL component of the project!
Multi-Departmental Team• Five Departments in active roles• Three in supplemental roles
Approx. 12 personnel involved Hundreds of staff hours
Buy-in to the big picture Commitment to the project
6

Project Planning
Time spent planning is time saved in rewrites, redesigns, and long term issues
Develop Project Plan and Timeline Evaluate existing data and database design City of Calgary case study - addressing Understand enterprise touch points and data
flow
7

Data Flow Diagram
8

Database Design(Rubber meets Road)
Basic Methodology of Database Design• Conceptual > Logical > Physical
Design goals• Retain required tables and fields• Meet business needs• Lock down database security• Standardize database naming convention
9

Helpful Design Tools…
Great tools available for database design
Geodatabase Diagrammer GDB XRay Tool Geodatabase Designer 2 ArcGIS Diagrammer Microsoft Visio and Esri Case Tools (UML)
Timesavers!
10

Data Clean-up
Data clean-up was our Achilles heel!
Address clean-up accounted for nearly 40% of our project hours• Small number of errors – 5.5% of the data• Identifying the error was complex, reconciling even
harder! Multiple sources of addressing data
Multi-family residential units accounted for majority of errors
11

Data Clean-up Discrepancy Model
12
Hot Mess!

Data Clean-up Map
80% of address data errors in 20% of the City
Focus on older neighborhoods first
13

Creating Address Points
Address Models ran immediately after data clean-up
Every round of discrepancy clean up we re-ran the address models
Data errors dropped from 5.5% to 1.2%
14

Why Address Points?
Granular searches, met immediate business need for field crews and first responders• Increased positional accuracy• Flexible – addresses not required to be tied to
parcels Develop GIS as system of record for
addressing• Roseville has struggled with address
maintenance and standards Enterprise alignment and maturity
15

New Address Point…
16

Migration and Go-Live
Performed an informal Gate Review• We accomplished what we set out to do!
Staged the migration• Took approximately five business days• Open communication with GIS users was
critical
Go-Live went smoothly but stressful
17

Lessons Learned
Find friends that know the business and the data! Project Management
• Need a method to track project hours• Balance workload between team• Underestimated hour projections
Data• Quality Control checks needed – Esri Data
Reviewer extension• Complex system requires good documentation
18

Benefits
Data Maintenance• Eliminated complex nightly maintenance• Eliminated dual data entry
Meeting business need• Easily locate assets with Address Points• Enterprise projects requesting Address Points
Enterprise Asset Management (EAM) Permit System Computer-Aided Dispatch/Record Management
System (CAD/RMS)19

Roadmap
Continuous Improvement• Add residential suites and condominiums• Build on Quality Control checks• Leverage geodatabase versioning workflows
Automate maintenance tasks• Models and script tools
Develop Service Level Agreements (SLA) and Operational Level Agreements (OLA)
20

Final Thoughts…Q & A
Questions?
21
Dorothee Moss, Scott Adrian, Brian Johnson, Tracy Ternes, Rodney Funke, Joe Allen, Roy VanNess, Joey McKinney, Neil Blomquist, Rjahja Canlas, and many more
Many Thanks To The Project Team!!!


WHO ARE WE?
WEB DEVELOPMENT WEB AND PRINT MAPS DATA VISUALIZATIONS & ANIMATIONS WEB AND MOBILE APPLICATIONS CARTOGRAPHY
OPENNRM PLATFORM & OPEN SOURCE SOFTWARE PROJECT

Maps/GIS
Mobile
Data Visualization
Engine
Knowledge
Wiki
Project Management
Document Management
Real Time Data Tools
CMS
WHAT IS OPENNRM?

HOW DID WE BUILD IT?

HOW DO WE MAKE $$?
HOSTED AT OPENNRM.ORG 5/12
ENTERPRISE
SUPPORT FOR OPEN SOURCE PROJECT

OPENNRM IN ACTION: The California Delta
Video available at http://youtu.be/xyy/E6v1dsk4

WHO’S INVOLVED?

WHAT IS AT STAKE?
1. West Coast's largest Estuary
2. Hub of California State's water system and carries 1/2 of the
state's annual runoff
3. 57 leveed islands and tracts, 700 miles of sloughs
4. Home to the nation's largest agricultural industry ($27b)
5. Water Supply for 25 million people and supports the 8th
largest economy in the world
6. Home to more than 500 species of wildlife, 20 endangered
7. Breeding ground for major anadromous Fish

WHAT’S THE PROBLEM
Information is Fragmented Many Stakeholders/Various Interests Significant Learning Curve for Stakeholder and the Public Need for Transparent Real Time Management Need to Visualize Information and Understand Connections Need to Move Quickly Need to See Science and real Time Monitoring


CDEC Turbidity Visualization
http://youtu.be/-VTLdx8dD70

MAPS/GIS -MANAGE/UPLOAD LAYERS AND WEB SERVICES -DRAW, MEASURE, QUERY -SAVE AND SHARE -ASSOCIATE TO PROJECTS, DOCUMENTS, WIKI, ANYTHING -BUILD A STORY -OVERLAY WITH DATASETS

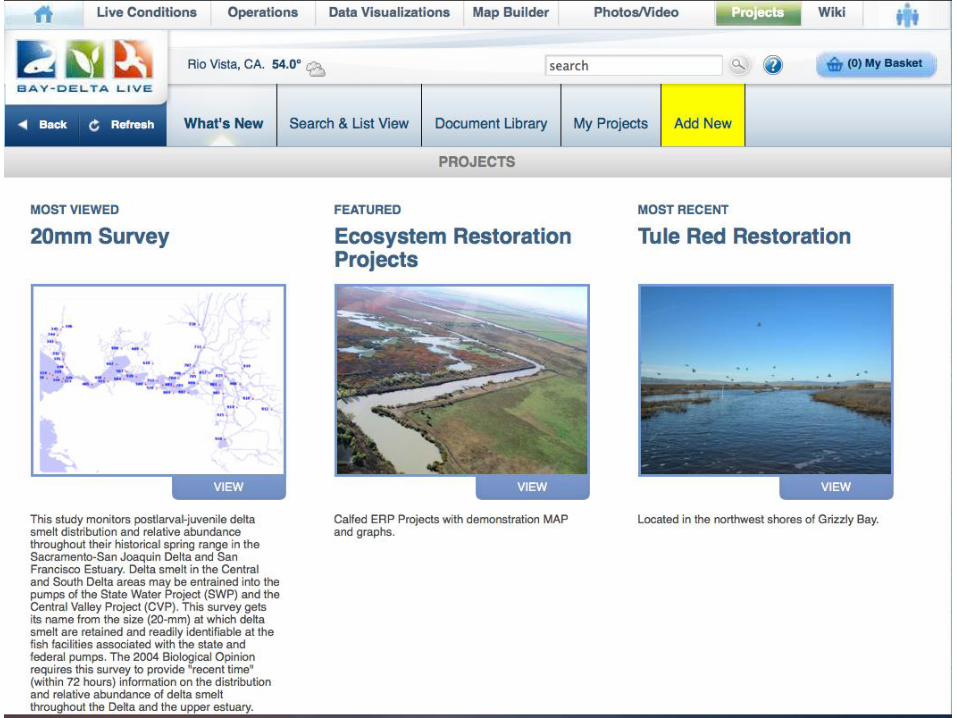
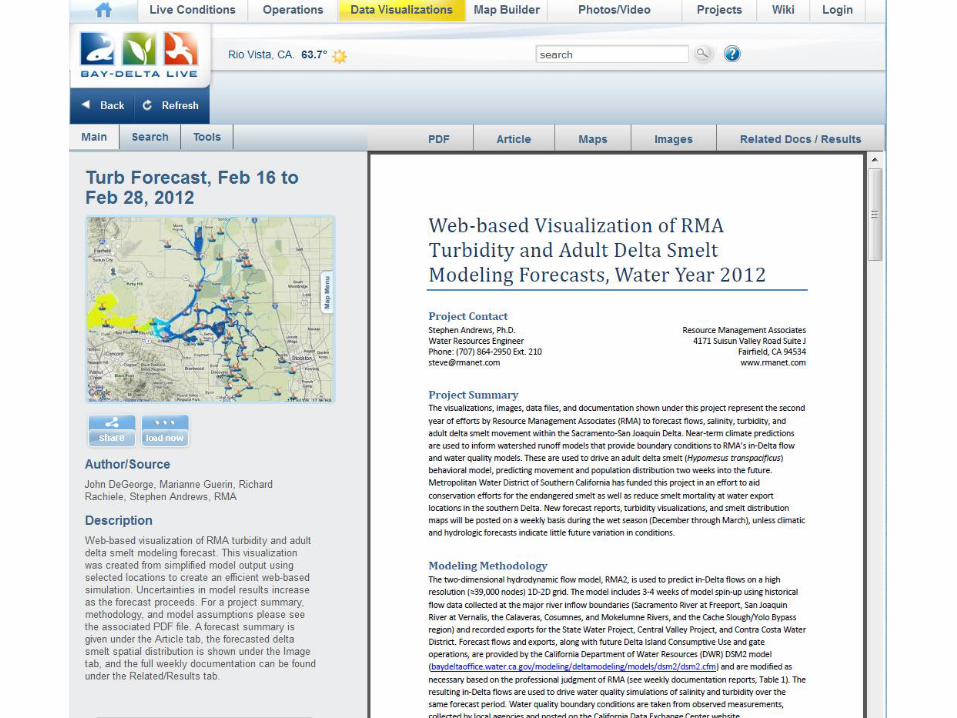


1. Fish are dying, water becomes more polluted, ecosystems collapsing,
climate change, our children…
2. Stalemate, inaction, infighting, slow moving
3. Everyone’s broke! $ for the fish not for software!
4. Improvements in transparency = accountability (we hope)
5. Improve access to information = good decision making
6. Interoperability = open architecture= better tools
7. Open source community is excited about serving the planet!
Why Open Source?


Thousands of Stakeholders Participating: Agencies, Organizations, Consulting Groups, Farmers, Counties etc.
Over 200,000 Unique Visitors
2-Gate Project Workspace: 7,000 document downloads this month.
BDL will be used for 2-Gate Operations and Real Time Science Modeling and Visualization.
2 Universities preparing science content for project center, wiki, science center for publishing by year end.
CALFED outreach arm
Real time fish tracking with USGS
Impact on the Bay Delta Community Measuring Success

Public Access to County GIS Basemap DataPublic Access to County GIS Basemap Data March 20, 2012 March 20, 2012
GIS Consultants, Piedmont, CA
1
Defending Public Access to Defending Public Access to our Governments' GeoDataour Governments' GeoData
The Supreme Decision
Bruce Joffe, GISP, AICPOrganizer, Open Data Consortium
Principal, GIS ConsultantsPi d t CA
GIS GIS GIS Open Data Consortium projectOpen Data Consortium projectOpen Data Consortium project
Piedmont, CA
What Basic Resource Is Needed To Start A Geoanalysis Project?
GIS GIS GIS Open Data Consortium projectOpen Data Consortium projectOpen Data Consortium project

Public Access to County GIS Basemap DataPublic Access to County GIS Basemap Data March 20, 2012 March 20, 2012
GIS Consultants, Piedmont, CA
2
Notification of Parcels Within 300 Ft.
GIS GIS GIS Open Data Consortium projectOpen Data Consortium projectOpen Data Consortium project
Geographic Parcel Data in California's 58 Counties
• 49 Provide Parcel Data at No Cost or Cost of Reprod ction ($5 to $300)or Cost of Reproduction ($5 to $300)o 20 Revised their distribution policy since 2004
• 8 Sell Parcel Data for More Than the Cost of Reproduction (over $500)o 5 Use private data provider for their basemap
GIS GIS GIS Open Data Consortium projectOpen Data Consortium projectOpen Data Consortium project
• 1 Is Not Releasing Parcel Data (says it is not available in digital form)

Public Access to County GIS Basemap DataPublic Access to County GIS Basemap Data March 20, 2012 March 20, 2012
GIS Consultants, Piedmont, CA
3
County Parcel Data Distribution Policy – 2006, 2011
GIS GIS GIS Open Data Consortium projectOpen Data Consortium projectOpen Data Consortium project
Which Counties Impede Access to Parcel Data?
More Than Cost of Reproductiono Orange $ 375,000o Orange $ 375,000 o Santa Clara $ 158,000 $3.14 after lawsuito Merced $ 1,000 Free! as of March 15, 2011o Sierra $ 1,000 o Alpine $ 650
More Than Cost of Reproduction - Privateo Solano $ 13,400
$
GIS GIS GIS Open Data Consortium projectOpen Data Consortium projectOpen Data Consortium project
o San Luis Obispo $ 12,000 o Madera $ 3,123 o Lassen $ 2,500 o Del Norte $ 1,500
Data Not Availableo Colusa

Public Access to County GIS Basemap DataPublic Access to County GIS Basemap Data March 20, 2012 March 20, 2012
GIS Consultants, Piedmont, CA
4
Access to Public Information
Data Distribution Core Issue: Public's Right to Public Data
Access to Public InformationInsures Government Accountability
" ... the Legislature, mindful of the right of individuals to privacy, finds and declares that access to information concerning the conduct of the people's business is a fundamental and necessary rightfundamental and necessary right of every person in this state " CPRACPRA §§ 62506250
GIS GIS GIS Open Data Consortium projectOpen Data Consortium projectOpen Data Consortium project
every person in this state.. CPRA CPRA §§ 62506250
Taxable Valuation less than half of mine < $ 30,000
Who Owns TheseWho Owns These Properties?
GIS GIS GIS Open Data Consortium projectOpen Data Consortium projectOpen Data Consortium project

Public Access to County GIS Basemap DataPublic Access to County GIS Basemap Data March 20, 2012 March 20, 2012
GIS Consultants, Piedmont, CA
5
CA Attorney General's OpinionOctober 3, 2005October 3, 2005
1. Parcel boundary map dataParcel boundary map data maintained by a county Assessor in an electronic format is subject to public inspection and is subject to public inspection and j p pj p pcopyingcopying under provisions of the California Public Record Act.
2.2. A copy of parcel boundary map data maintained in an A copy of parcel boundary map data maintained in an electronic formatelectronic format by a county assessor must be furnished must be furnished promptlypromptly upon request of a member of the public.
3. The fee that may be chargedThe fee that may be charged by a county for furnishing a copy of parcel boundary map data maintained in an electronic format by a county assessor is generally limited to the amountis generally limited to the amount
GIS GIS GIS Open Data Consortium projectOpen Data Consortium projectOpen Data Consortium project
format by a county assessor is generally limited to the amount is generally limited to the amount that covers the direct cost of producing the copythat covers the direct cost of producing the copy, but may include certain other costs depending upon the particular circumstances as specified in the California Public Records Act.
20 Counties Have Changed Policy to Low or No Cost20 Counties Have Changed Policy to Low or No Cost
What about the counties that are What about the counties that are notnotin compliance with the in compliance with the
California Public Records Act?California Public Records Act?
The A.G's opinion is notThe A.G's opinion is not a legal interpretation of the law; git is not the basis for enforcement.not the basis for enforcement.
A judicial determinationjudicial determination must be made in context of a lawsuitlawsuit.
October 11, 2006October 11, 2006CFACCFAC filed a petition with Superior Court to enforce the CPRAo As a citizen, CFAC has the right to viewview and copycopy the County's
data, for no more than the cost of duplicationcost of duplicationo Citizen's right includes not having to state how the data will be
GIS GIS GIS Open Data Consortium projectOpen Data Consortium projectOpen Data Consortium project
o Citizen s right includes not having to state how the data will be used (therefore, not bound to sign a nonnot bound to sign a non--disclosure agreementdisclosure agreement).
oo GIS basemap data is necessaryGIS basemap data is necessary, when used with other public information, to monitor and inspect the decisions of public agencies; for example, Property Tax Assessment, Zoning Property Tax Assessment, Zoning Variance Approval, PermitsVariance Approval, Permits

Public Access to County GIS Basemap DataPublic Access to County GIS Basemap Data March 20, 2012 March 20, 2012
GIS Consultants, Piedmont, CA
6
• Santa Clara County asserted that the GIS basemap constitutes 'computer software'
Is the GIS Basemap Software?
constitutes computer software "... 'applications software' is understood to include the instructions that manipulate data and the databases on which those instructions and the databases on which those instructions operateoperate."
• County GIS Managers' sworn statements:oo ""the entirety of the records in .shp format constitute softwarethe entirety of the records in .shp format constitute software""
and, "the entirety of the records in geodatabase format constitute
GIS GIS GIS Open Data Consortium projectOpen Data Consortium projectOpen Data Consortium project
t e e t ety o t e eco ds geodatabase o at co st tutesoftware"
• CFAC obtained statement from ESRI's Director of Software Products: ".shp file format and the geodatabase formats are designed to enable the transfer of geospatial dataformats are designed to enable the transfer of geospatial data; they are not software."
-- Clint Brown
Superior Court Decision:VICTORY !
May 18, 2007 May 18, 2007 (7 months after petition filed)Superior CourtSuperior Court directed Santa Clara County to:Superior Court Superior Court directed Santa Clara County to:1. Provide CFAC with an electronic copy of the GIS basemap, and2. Charge CFAC the direct cost for the copy provided.Citing the state constitution, "a statue shall be broadly
GIS GIS GIS Open Data Consortium projectOpen Data Consortium projectOpen Data Consortium project
construed if it furthers the people's right of access, and narrowly construed if it limits the right of access"
If there's any doubt, data must be given to the requester

Public Access to County GIS Basemap DataPublic Access to County GIS Basemap Data March 20, 2012 March 20, 2012
GIS Consultants, Piedmont, CA
7
Orange County's Compliance with the Public Records Act
June 21, 2007Sierra Club Sierra Club (Los Angeles chapter) sent a Letter of Request for Data
d CPRA 6250 t O C tO C t (A )under CPRA 6250 to Orange County Orange County (Assessor)July 2, 2007
Request REFUSED, County says:o AG Opinion in not bindingoo GIS data is exempt as computer mapping software GIS data is exempt as computer mapping software ---- "Software Exemption""Software Exemption"
February 9, 2009Sierra Club cites Santa Clara County decision requiring PRA compliance
March 5 2009
GIS GIS GIS Open Data Consortium projectOpen Data Consortium projectOpen Data Consortium project
March 5, 2009County refuses again
April 21, 2009Sierra Club sues Orange CountySierra Club sues Orange County with "Petition for Writ of Mandate to Enforce Public Records Act"o Unless Sierra Club obtains the requested public records, the public will
be denied information prepared at public expense pertaining to the prepared at public expense pertaining to the conduct of the public's business essential to monitor its governmentconduct of the public's business essential to monitor its government
What is the Software Exemption?§6254.9 (a) Computer software developed by a state or local agency is Computer software developed by a state or local agency is
not itself a public recordnot itself a public record under this chapter. The agency may sell, lease or license the software for commercial or noncommercial uselease, or license the software for commercial or noncommercial use.(b) As used in this section, "computer software" "computer software" includesincludes computer computer mapping systems, computer programs, and computer graphics mapping systems, computer programs, and computer graphics systemssystems.(c) This section shall not be construed to create an implied warranty on the part of the State of California or any local agency for errors, omissions, or other defects in any computer software as provided pursuant to this section.(d) N thi i thi ti i i t d d t ff t th bli dN thi i thi ti i i t d d t ff t th bli d
GIS GIS GIS Open Data Consortium projectOpen Data Consortium projectOpen Data Consortium project
(d) Nothing in this section is intended to affect the public record Nothing in this section is intended to affect the public record status of information merely because it is stored in a computer.status of information merely because it is stored in a computer.Public records stored in a computer shall be disclosed as required by this chapter.(e) Nothing in this section is intended to limit any copyright protections.

Public Access to County GIS Basemap DataPublic Access to County GIS Basemap Data March 20, 2012 March 20, 2012
GIS Consultants, Piedmont, CA
8
Definition of TermsWhat is a Computer Mapping System?
What is a GIS?What does "includes" mean?What does includes mean?
GIS GIS GIS Open Data Consortium projectOpen Data Consortium projectOpen Data Consortium project
What is a Computer Mapping System?
• Orange County says Computer Mapping System is an earlier ersion of GISan earlier version of GIS
• Sierra Club says CMS is a different type of mapping software; it is not GISo Computer Graphicso CAD
A t t d M i S t AMS
GIS GIS GIS Open Data Consortium projectOpen Data Consortium projectOpen Data Consortium project
o Automated Mapping System - AMS (Computer Mapping System - CMS)
o AM/FMo GIS

Public Access to County GIS Basemap DataPublic Access to County GIS Basemap Data March 20, 2012 March 20, 2012
GIS Consultants, Piedmont, CA
9
What is GIS?• County cites ESRI definition, and others:
"An integrated collection of computer software and datacollection of computer software and data used to i d i f ti b t hi l lview and manage information about geographic places, analyze
spatial relationships, and model spatial processes.A GIS provides a framework for gathering and organizing spatial data and related information so that it can be displayed and analyzed." -- GIS From A to Z
• County's Argument:o GIS includes software and datao County's O.C. Landbase is a GIS
GIS GIS GIS Open Data Consortium projectOpen Data Consortium projectOpen Data Consortium project
yo GIS is a type of CMSo CMS is excluded by §6254.9oo Therefore, O.C.'s GIS Landbase data is excludedTherefore, O.C.'s GIS Landbase data is excluded
• ESRI definition should have said:"A collection of computer software used to integrate dataused to integrate data to view ..."
What is GIS?• County cites ESRI definition, and others:
"An integrated collection of computer software and datacollection of computer software and data used to i d i f ti b t hi l lview and manage information about geographic places, analyze
spatial relationships, and model spatial processes.A GIS provides a framework for gathering and organizing spatial data and related information so that it can be displayed and analyzed." -- GIS From A to Z
• County's Argument:o GIS includes software and datao County's O.C. Landbase is a GIS
GIS GIS GIS Open Data Consortium projectOpen Data Consortium projectOpen Data Consortium project
yo GIS is a type of CMSo CMS is exempt by §6254.9 ("software exemption")oo Therefore, O.C.'s GIS Landbase data is exempt from PRATherefore, O.C.'s GIS Landbase data is exempt from PRA
• ESRI definition should have said:"A collection of computer software used to integrate dataused to integrate data to view ..."

Public Access to County GIS Basemap DataPublic Access to County GIS Basemap Data March 20, 2012 March 20, 2012
GIS Consultants, Piedmont, CA
10
System or Software?GIS is Composed of . . . . .
Software StaffingGISGIS
T i i
GIS GIS GIS Open Data Consortium projectOpen Data Consortium projectOpen Data Consortium project
Data
HardwareApplications
Training
Judicial Decision: Landbase database is exempt under software exemption
• May 21, 2010Court decided in favor of Orange Countyin favor of Orange CountyCourt decided in favor of Orange Countyin favor of Orange Countyo "This Court credits the County's evidence ... that the OC
Landbase in a GIS file format is part of a computer mapping GIS file format is part of a computer mapping system. To that end, the OC Landbase is not a public record.system. To that end, the OC Landbase is not a public record."
o "Section 6254.9 creates an exemption for GIS file formatted data, but it nevertheless guarantees the public access to nonguarantees the public access to non--GIS GIS formatted records formatted records containing information stored in a GIS ..."
GIS GIS GIS Open Data Consortium projectOpen Data Consortium projectOpen Data Consortium project
• Aug 9, 2010Court issued final Statement of Decision for Orange County

Public Access to County GIS Basemap DataPublic Access to County GIS Basemap Data March 20, 2012 March 20, 2012
GIS Consultants, Piedmont, CA
11
Sierra Club Appeals toCalifornia Supreme Court
• July 11, 2011 – Sierra Club files CSC appeal.• Sept 10 2011 GIS Amicus letter asking to hear the case• Sept 10, 2011 – GIS Amicus letter asking to hear the case
o 11 GIS Organizationso 72 Individual GIS Professionals
• Sept 14, 2011 – CA Supreme Court agrees to hear the case• Nov 14, 2011 – Sierra Club's brief filed• Dec 15, 2011 – Orange County's answer brief filed
GIS GIS GIS Open Data Consortium projectOpen Data Consortium projectOpen Data Consortium project
• Feb 6, 2012 – Sierra Club's rebuttal brief filed• March 5, 2012 – 9 Amicus Briefs filed on Merits of the case,
including one from Community of GIS Professionalso 23 GIS Organizationso 212 Individual GIS Professionals
GIS Community Amicus Brief• 212 Individual GIS Professionals• 23 GIS Professionals' Organizationsg
Latitude Geographics Group Ltd.
NACISNACIS - North American Cartographic Information Society
NSGICNSGIC - National States Geographic Information Council
Oregon Natural Desert AssociationOSGeoOSGeo - Open Source Geospatial
Foundation
AAGAAG - Association of American GeographersAdvancement Project, Healthy CityBAAMA BAAMA -- Bay Area Automated Mapping AssociationBay Area Automated Mapping Association,
Board of DirectorsCaGISCaGIS - Cartography and Geographic Information
SocietyCALI - California Association of Licensed
InvestigatorsCalifornians AwareCalifornians Aware
GIS GIS GIS Open Data Consortium projectOpen Data Consortium projectOpen Data Consortium project
Pacific InstitutePacific Institute for Research & EvaluationSouthern California Chapter of URISASouthern California Chapter of URISAUrban Strategies CouncilVector1MediaVector1MediaWIGICCWIGICC - Wisconsin Geographic Information
Coordination Council
CUGOS - Cascadia Users of Geospatial Open SourceDavis Demographics & Planning, Inc.DMTI SpatialGeoTec MediaGeoTec MediaGITAGITA - Geospatial Information Technology AssociationGreenInfo NetworkGreenInfo Network

Public Access to County GIS Basemap DataPublic Access to County GIS Basemap Data March 20, 2012 March 20, 2012
GIS Consultants, Piedmont, CA
12
What Can You Do To Preserve Access To GIS Data?What Can You Do To Preserve Access To GIS Data?
GIS GIS GIS Open Data Consortium projectOpen Data Consortium projectOpen Data Consortium project
GIS Community Amicus BriefA. “Computer Mapping System” refers to software and only software“Computer Mapping System” refers to software and only software; it does
not include data. GIS d t h ld t b id d diff t f th bli dGIS d t h ld t b id d diff t f th bli dGIS data should not be considered different from any other public record GIS data should not be considered different from any other public record data that government agencies use in conducting the people's businessdata that government agencies use in conducting the people's business.
B. GIS-compatible database structure is an intrinsic and necessary part of Orange County’s OC Landbase. .PDF files do not substitute.PDF files do not substitute.
C. The consequences of removing GIS-readable parcel data from the public domain threatens citizens, other counties and citiesother counties and cities in many ways.
D. Removing GIS-readable parcel data from the public domain counters explicit national and Federal data policiesnational and Federal data policies.
GIS GIS GIS Open Data Consortium projectOpen Data Consortium projectOpen Data Consortium project
E. Some counties’ policy of excluding GIS data from the public domain is currently causing expensive, negative impacts on CA state governmentexpensive, negative impacts on CA state government.
F. The 4th District Court, and Orange County, may have misunderstood the concept of “system”concept of “system” in the context of section 6254.9(b).
G. Excel analogyExcel analogy to better understand the relationship between software and data.

Public Access to County GIS Basemap DataPublic Access to County GIS Basemap Data March 20, 2012 March 20, 2012
GIS Consultants, Piedmont, CA
13
My Opinion• 49 other California counties have developed and are
maintaining similarly expensive GIS databases without a ta g s a y e pe s e G S databases t outselling their data. "Poor fiscal management should not be an exemption for "Poor fiscal management should not be an exemption for access to public records." access to public records."
• Government agencies decided to expend the cost of building a GIS database because of the benefits that GIS would provide them in fulfilling their mandated tasks. "These benefits are return enough on their investment and"These benefits are return enough on their investment and
GIS GIS GIS Open Data Consortium projectOpen Data Consortium projectOpen Data Consortium project
These benefits are return enough on their investment and These benefits are return enough on their investment and do not justify additional revenue from data sales." do not justify additional revenue from data sales."
Your Opinion?
Defending Public Access to Defending Public Access to our Governments' GeoDataour Governments' GeoData
The Supreme Decision
Bruce Joffe, GISP, AICPOrganizer, Open Data Consortium
Principal, GIS ConsultantsPi d t CA
GIS GIS GIS Open Data Consortium projectOpen Data Consortium projectOpen Data Consortium project
Piedmont, CA

1
Mr. Larry Cooper Information Technology Supervisor Information Management and Analysis Southern California Coastal Water Research Project Costa Mesa, CA 92626-1437 (Ph) 714-755- 3229, (Fax) 714-755-3299, [email protected] Dr. Steven J. Steinberg, GISP Principal Scientist Information Management and Analysis Southern California Coastal Water Research Project Costa Mesa, CA 92626-1437 (Ph) 714-755-3260, (Fax) 714-755-3299, [email protected]
TURNING BEACHWATCH DATA INTO INFORMATION
Abstract: Seventeen California counties conduct regular bacteria monitoring of their ocean beaches to protect the public’s health. Monitoring occurs weekly between April 1 and October 31, with some counties monitoring year-round. These data are stored within each county's database and submitted monthly to the State Water Quality Control Board and U.S. Environmental Protection Agency. San Luis Obispo County desired an Internet accessible, map-based interface to provide informative visualizations of local beach status to the public. We developed tools that dynamically translate recent monitoring data into maps, graphs, and tables that communicate real-time beach status. We developed these tools using free and open-source software, including: Openlayers, jQuery, and Flot. The tool displays a map of the San Luis Obispo County coastline with color-coded dots indicating beach status at monitoring locations: red for closed; yellow for posted advisories; and green for open. When the user clicks on a location, a pop-up window displays beach status in both text and visual formats; display information includes beach name and photo, geographic coordinates, and a table showing the last four weekly measurements for each indicator bacteria type.
INTRODUCTION
California beaches are a significant recreation source for residents and tourists, providing over 150 million person-days of water-based recreational activities annually (SWRCB 2011a). To minimize risk to human health, California maintains a program of routine beach water quality sampling occurring on a weekly basis throughout the recreational use season (April 1 through October 31). Several counties conduct sampling year-round. Samples are analyzed for three indicator bacteria, which at elevated concentrations may pose a risk to human health. When bacteria levels exceed State standards, beach advisories are posted until subsequent sampling demonstrates a return to safe bacteria levels. In extreme cases, such as a sewage spill that may result in untreated waste contamination, a beach may be closed to all human water contact (SLO 2012). Three types of indicator bacteria are measured: enterococcus, total coliform (TC), and fecal coliform (FC) (SWRCB 2011b). Typically, individual County Environmental Health Departments conduct monitoring activities on beaches within respective jurisdictions; if bacteria counts exceed accepted thresholds, County Health Officers post beach advisories or closure notices.
Traditionally, beach status has been communicated to the public through one or more of the following methods: signage posted at the affected beach, telephone hotlines, and/or websites maintained by individual counties. In addition to collecting and

2
communicating information locally, counties are required to submit these data to the State on a monthly basis.
In 1997, the State initiated a beach program (AB411) that specifies sampling and reporting requirements for all local beach water quality control agencies (SWRCB 2011b). Soon after AB411 was established, the Southern California Coastal Water Research Project (SCCWRP) was approached to assist in the design and implementation of a database system to facilitate data transfer from individual jurisdictions to the State Water Resources Control Board (SWRCB). Between 1999 and 2001, SCCWRP developed and installed a Microsoft Access application at each participating jurisdiction, thereby facilitating data management and water quality analysis related to established bacteria thresholds and timely management decisions by local County Health Officers. During the intervening years, technological advances and public expectations for access to information increased, i.e., interactive web tools, smart phones, and an array of portable data devices. This placed new demands on individual jurisdictions to deliver information in ways not considered when the original beach status system was created. In the summer of 2011, public interest led the San Luis Obispo County Environmental Health Department to approach SCCWRP for assistance in updating its beach monitoring system.
Design objectives for the updated system included the addition of a map-based, interactive website to be built using open source (cost free) tools that could be implemented within the County's existing computer infrastructure. The system needed to be simple to maintain; to interact effectively with the County's existing data management system; and where possible, to reduce manual steps in data flow optimization (Figure 1).
Figure 1: San Luis Obispo County Environmental Health Services beach data management flow prior to the project.
San Luis Obispo County's existing system required manual updates at several stages of the process, each with a potential for error; status of individual beaches was made available via an HTML table posted on the County Environmental Health website. As a component of the status table, beach locations were described in text form relative to street names or distance, in yards, from local landmarks such as piers. While these descriptions were helpful for local residents, they did not provide adequate information to tourists or others unfamiliar with the area (Figure 2).

3
Figure 2: Beach status on the website prior to the project was communicated via an HTML table updated by hand each week by placing an 'x' in the appropriate cell.
MATERIALS AND METHODS
In consultation with County Environmental Health and Information Technology staff, we developed a system to meet the County's technical and functional needs. Essential improvements included: 1) optimization of data delivery from the laboratory to the Environmental Health Department's existing Microsoft Access Database; 2) addition of a module added to the existing Visual Basic code to query and summarizes data into a Keyhole Markup Language (https://developers.google.com/kml/) output file (KML) for development of the web map interface; 3) scripts to output JavaScript Object Notation (JSON) files (http://www.json.org/) used as the data source for trend graphs displayed on the webpage; and 4) integration of climatic and ocean condition data from the National Oceanic and Atmospheric Administration's (NOAA) National Data Buoy Center (http://www.ndbc.noaa.gov/).
Working with the county laboratory, we developed a Microsoft Excel template to export lab results directly from their laboratory information management system (LIMS). This results file is transmitted electronically to the County Environmental Health department for import into their Microsoft Access database. After data are analyzed by the local Health Officer confirming any decision resulting in an advisory or closure, a newly developed output module is invoked by clicking a button added to the county's Microsoft Access application. This creates and exports KML and JSON files needed to update the county's Ocean Water Monitoring Results webpage (Figure 3 and Figure 4).
On the web server, we used Openlayers (http://openlayers.org/), an open source mapping platform for creating web map applications. Openlayers provides a set of base map layers giving context, including labeled streets and highways, cities and landmarks such as public lands and mountain peaks. These layers and controls were integrated into the application without need to obtain GIS data sets or additional software licenses at the county (Figure 5).

4
Figure 3: Modified dynamic data handling after redesigning the Microsoft Access application for San Luis Obispo County Environmental Health.
Figure 4: SLO County's Ocean Water Monitoring Results page with embedded Openlayers map indicating beach status at each monitoring station. The map interface was embedded as an inline frame (iframe) within the existing county website to maintain continuity.

5
Figure 5: An example of the Openlayers base map incorporated into the Ocean Water Monitoring Results Ocean Water Monitoring Results webpage for San Luis County. The interface provides tools for panning and zooming the map as well as clickable beach monitoring stations.
We embedded the Openlayers map into an html page. Using KML and JSON files exported from the application developed for the county's existing Microsoft Access database, display features are generated for each station. Visitors to the site are presented a map indicating beach status at each monitoring station using a stoplight, color scheme. Green indicates that beach is open; yellow indicates that the beach is under a health advisory, red indicates the beach is closed to swimming, and brown indicates an advisory due to a recent rainfall event (
Figure 6).
Figure 6: The color of the dot representing each monitoring station indicates current beach status.
Navigation controls include a dropdown list of monitored beaches by name providing direct access to information about a specific beach. The user may select a beach from the drop down list, or click directly on the dots on the map. Either action activates a pop-up information bubble containing the name of the beach, the name and location of the monitoring station on that beach, a table with the previous thirty days of data, trend graphs for the three bacterial indicators, and current conditions from a nearby NOAA data buoy (Figure 7).

6
Figure 7: Pop-up information bubble for an individual beach. Information includes the Beach Name, Station Code, Latitude and Longitude, Status, description on station location, previous 30 days of data and current conditions from a nearby NOAA buoy.
In addition to presenting visitors to the site with a 30-day data history in tabular form, we explored developing graphs to visually present beach water quality trends. Using two open source JavaScript software tools, Jquery (http://jquery.com/) and Flot (http://code.google.com/p/flot/), we created graphing scripts to represent bacteria measurements below thresholds in blue and those exceeding thresholds in orange. (Figure 8).

7
Figure 8: Dynamic generation of graphs for each indicator. Values below the AB411 threshold are shown in blue. Values above the AB411 threshold are shown in orange.
RESULTS
All components for the specified system were successfully developed and deployed to the client during an in person visit to their office. The county's data management system is an application built in Microsoft Access. By modifying the county’s existing Microsoft Access application, we facilitated direct, electronic input of laboratory results. All modifications to the county’s Microsoft Access application were installed and tested to ensure data flow was operational within their office environment.
Beach water quality data files required to update the web application are exported to a local server and displayed to the county Environmental Health Services' Ocean Water Monitoring Results web page via an inline frame. This approach facilitates direct website updates and maintenance by Environmental Health Department staff using the county's existing content management system. The web page was developed on a Windows based server running Apache (http://apache.org/) web services.
Our primary challenge was to develop the new interface within constraints of existing data structures creating a user-friendly output stream that was easy for staff to use and maintain. The site provides an intuitive interface allowing the public to view beach water quality data via a map-based interface, on the county Environmental Health Services' Ocean Water Monitoring Results web page. The resulting system was placed into production with minimal difficulty.
DISCUSSION
Through this project, we simplified and improved data handling in electronic form from the lab to the public via a new web application (Figure 3). By minimizing steps in the data flow and converting all data transfers to digital file transfers, we reduced the possibility for delays and transcription errors. Modifications to the County Environmental Heath Services' Microsoft Access application facilitated simple data export to the file formats required by the web application. As requested by the county, all new system components were developed using existing software and readily available open source components. We created a simple, but powerful portal providing data access and

8
visualization collected to protect the public’s health and represented using an easy to understand intuitive interface.
In developing these applications, we did encounter several issues that required minor workarounds or adjustments to the system. Upon initial installation of the new system at the County, the flow of data from the LIMS to the Microsoft Access application worked flawlessly. All of the proper files were successfully exported to the server for inclusion in the web application and anticipated maps displayed correctly. However, dots and drop down list for beach sampling locations were conspicuously absent. Upon investigation, we determined the KML file was not being read properly by the county’s Windows server that runs IIS web services. Those services were configured to forbid use of KML files. The solution was to rename the file with an XML extension and altering the javascript code to point to the new XML file rather than the KML file.
Secondly, we ran into issues with labeling units on the trend graphs generated with the Flot package. Since this was an additional component not deemed essential by the county, they opted to remove the graphs from the site. We subsequently corrected the labeling issue and offered to provide it to the county should they wishto add graphs of the bacteria data at a future time.
After the system had been in place for several months, we encountered one additional glitch. Because the Openlayers base maps are delivered as a web mapping service (WMS) the map visuals require a functioning connection to the WMS server. On one occasion, the WMS server was inaccessible for about 24 hours causing a loss of map functionality on the site. While this proved a minor inconvenience, the maps returned the following day. A more stable solution would require maintaining a local installation of the base maps and map server. However, the benefit of a WMS server is that those requirements are maintained elsewhere and do not require staff time, computer resources or mapping systems knowledge to implement the WMS base maps.
Overall, we were able to develop an efficient system for extracting and displaying current beach bacteria data in a manner that is both publically accessible and easy to understand. The system meets the county's needs and can serve as a foundation for development of additional dynamic data management and visualization systems while optimizing data flow from the lab to the public.
REFERENCES
1. Apache Software Foundation, Apache, http://apache.org/, (Accessed 9/12/2012).
2. County of San Luis Obispo, California, Ocean Water Monitoring Results, http://www.slocounty.ca.gov/health/publichealth/ehs/beach.htm, (Accessed 4/10/2012).
3. Flot, http://code.google.com/p/flot/, (Accessed 9/12/2012).
4. Keyhole Markup Language (KML), https://developers.google.com/kml/, (Accessed 9/12/2012).
5. Jquery, http://jquery.com/, (Accessed 9/12/2012).
6. JavaScript Object Notation (JSON), http://www.json.org/, (Accessed 9/12/2012).
7. National Oceanic and Atmospheric Administration, National Data Buoy Center (http://www.ndbc.noaa.gov/, (Accessed 9/12/2012).
8. Openlayers, http://openlayers.org/, (Accessed 9/12/2012).
9. California, State Water Resources Control Board, California Beach Water Quality Information Page (2011a), http://www.waterboards.ca.gov/water_issues/programs/beaches/beach_water_quality/index.shtml, (Accessed 4/10/2012).

9
10. California, State Water Resources Control Board, California Clean Beaches Program, (2011b) http://www.waterboards.ca.gov/water_issues/programs/beaches/beach_water_quality/beaches_program.shtml, (Accessed 4/10/2012).
ACKNOWLEDGEMENTS
We would like to give our thanks to Liberty Amundson, R.E.H.S., Environmental Health Specialist, San Luis Obispo County, Environmental Health Services and Robin Hendry, County of San Luis Obispo, Public Health Department for their assistance in planning and implementation of this project.

4/25/2012
1
Larry CooperSouthern California Coastal Water Research Projectj
What is Beach Watch?State‐wide bacterial monitoring program for ocean State wide bacterial monitoring program for ocean beaches17 coastal counties and 1 city monitor beachesIf bacteria levels exceed thresholds, beaches will be closed or have a sign posted, depending on conditionsEach county has an independent monitoring and y p gadvisory program, but shares the data with the State Water Board and EPA
2

4/25/2012
2
Beachwatch Counties
33
Basic Beach Watch SystemEach county has a desktop application developed in Each county has a desktop application developed in Microsoft Access
Stores and Analyzes local dataHas functions for reporting data to centralized databaseCustom features for each county for local reporting
Data flows to State Water Board data management system
4

4/25/2012
3
BackgroundIncreasingly organizations and Increasingly, organizations and agencies use the web as a primary means of disseminating data
Th bli t i f ti t b The public expects information to be readily available via the web
5
Problem:Presenting information on the web Presenting information on the web requires specific expertise and multiple steps
Error proneTi iTime consuming
6

4/25/2012
4
Solution:D l l f ili d i d Develop a tool set to facilitate dynamic data processing and web presentation
Case Study: San Luis Obispo Environmental HealthHealth
7
Beachwatch Counties
8

4/25/2012
5
Data sheets faxed to health officerl ll d
Data Flow(Before the project)
to health officer
Data hand entered into Beachwatch
databaseSample Analyzed by Laboratory
Sample Collected at Beach
Data analyzed
Data Stored
in LIMS
Hand written data sheets
Data analyzed (AB411 Standards)
Data hand entered into Web Page
9
Web presentation (before dynamic data processing)
10

4/25/2012
6
GoalsSan Luis Obispo Environmental Health Department
Speed up data flow from the field to the webSpeed up data flow from the field to the webStreamline data import from LIMS system
Eliminate redundant data entry: Faster and less error proneReduces personnel cost
Create an intuitive web interface based on web‐mapping technologyS li h b d Streamline the web page update process
11
Data sheets faxed to health officerl ll d
Data Flow(Before the project)
to health officer
Data hand entered into Beachwatch
databaseSample Analyzed by Laboratory
Sample Collected at Beach
Data analyzed
Data Stored
in LIMS
Hand written data sheets
Data analyzed (AB411 Standards)
Data hand entered into Web Page
12

4/25/2012
7
Data sheets faxed to health officerl ll d
Data Flow(Before the project)
to health officer
Data hand entered into Beachwatch
databaseSample Analyzed by Laboratory
Sample Collected at Beach
Data analyzed
Data Stored
in LIMS
Hand written data sheets
Data analyzed (AB411 Standards)
Data hand entered into Web Page
13
l ll dData exported
to Microsoft Excel
Dynamic Data Flow(Following the project)
Data analyzed
Sample Analyzed by Laboratory
Sample Collected at Beach
to Microsoft Excel
Data imported into Beachwatch
database
yand exported to Web PageData Stored
in LIMS
14

4/25/2012
8
Software solutionAccess Database – Visual BasicAccess Database Visual BasicWeb Page
OpenLayersJavascriptJqueryFlot
15
SLO Web Display (After dynamic programming)
16

4/25/2012
9
Map can be zoomed in
17
Information is displayed for selected beach
18

4/25/2012
10
Indicator Trend Graphs
19
Indicator Trend Graphs
•Dynamic generation y gof graphs for each indicator
•Values below AB411 threshold in blueV l b •Values above AB411 threshold in
20

4/25/2012
11
Integration of other data streams
d f•Dynamic data from local NOAA buoy
21
Where do we go from here:SLO case demonstrates successful implementation of SLO case demonstrates successful implementation of dynamic tools Continue to develop code library and apply it in other dynamic data display contexts and applicationsExtend the use of dynamic data handling in modeling applications
22

4/25/2012
12
Questions?
23

5/15/2012
1
Because Workflow Matters…Because Workflow Matters…Geospatial Field Data Collection in the World of AppsGeospatial Field Data Collection in the World of Apps
Adam Lodge, Jeff SmithAdam Lodge, Jeff SmithGeospatial Systems ConsultantsGeospatial Systems Consultants
State of the art…State of the art…

5/15/2012
2
In 2005In 2005
Mobile GIS is For GIS Mobile GIS is For GIS PropellorheadsPropellorheads
• Long ramp up time
The ResultThe Result
• Laborious workflows
• Invalid Data

5/15/2012
3
We FavorWe Favor
• Structured mobile data collection
What is Open Data Kit?What is Open Data Kit?
• Easy to use
• Easy to set up
• GPS‐enabled
• Points only
• No Map

5/15/2012
4
Enlightened Data CaptureEnlightened Data Capture
Low Bar For EntryLow Bar For Entry
Open Source
Free
Components of Open Data KitComponents of Open Data Kit
ODK Collect: A mobile “app” capable of using custom designed formscustom-designed forms
ODK Build: A web-based interface for creating custom-designed forms
ODK Aggregate: Server software that bridges your custom form to a database

5/15/2012
5
A Word About Spatial AccuracyA Word About Spatial Accuracy
AccuracyAccuracy
PricePrice
Consumer Grade(Up to 2 meter)
Enterprise Grade(2 - 4 meter)
Survey Grade(submeter)
Open Data Kit DemonstrationOpen Data Kit Demonstration

5/15/2012
6
• Can I access the technology necessary to d l ODK?
You may ask…You may ask…
deploy ODK?
• Do I have the skills to develop simple ODK workflows?
It’s not that hardIt’s not that hard
A more customized exampleA more customized example
City of Richmond Storm Drain Data CollectionCity of Richmond Storm Drain Data Collection

5/15/2012
7
http://www.fargeo.com/demos
Field App Workflow DemonstrationField App Workflow Demonstration
Hardware: Bluebird Pidion BIP‐6000
• High Accuracy
Field App TechnologiesField App Technologies
• High Accuracy
• Touch‐screen enabled
• Camera, 3G Wireless
Software: All Open Source
• Android Operating Systemp g y
• Data Component ‐ ODK Collect
• Map Component ‐ OSMDroid
• SQLite is used for both vector and raster caches

5/15/2012
8
• As simple as an ATM
Why this is coolWhy this is cool
• Minimal software acquisition cost
• Redeployable on any device
Why Android?Why Android?

5/15/2012
9
• iOS
Alternate Enabling TechnologiesAlternate Enabling Technologies
• Windows Mobile
• ArcGIS Mobile / ArcGIS SDKs
• Google Maps
• MyTracks, Custom‐Maps
• DoForms
• gvSig Mini
Create workflows that use tools
Regardless of TechnologyRegardless of Technology
that your users know how to use.
Why?Why?

5/15/2012
10
Because Workflow Matters…Because Workflow Matters…
Adam Lodge, Jeff SmithAdam Lodge, Jeff SmithGeospatial Systems ConsultantsGeospatial Systems Consultantsfargeo.comfargeo.com

4/25/2012
1
I M bil th F t fI M bil th F t fIs Mobile the Future of Is Mobile the Future of GIS?GIS?
Matt SheehanMatt SheehanWebMapSolutionsWebMapSolutions
About Matt SheehanAbout Matt Sheehan
Principal & developer Principal & developer WebMapSolutionsWebMapSolutionsCompany formed in 2006Company formed in 2006Location focused Web and Mobile Location focused Web and Mobile Application DevelopersApplication Developers

4/25/2012
2
AgendaAgendaBackground Background
-- Internet to Web 2 0 to mobileInternet to Web 2 0 to mobileInternet to Web 2.0 to mobileInternet to Web 2.0 to mobile-- Geospatial history Geospatial history
MobileMobileMobile DemystifiedMobile Demystified-- Mobile DemystifiedMobile Demystified
-- GeoGeo--Mobile applicationsMobile applications
BackgroundBackground

4/25/2012
3
History History -- Internet to Web 2.0 to Internet to Web 2.0 to MobileMobile
Lynx, Lynx, Mosaic & Mosaic & HTMLHTMLJavascriptJavascript2004 Web 2.0 “Web as Platform”2004 Web 2.0 “Web as Platform”Flash (2004)Flash (2004)AJAX (2005)AJAX (2005)Flex (2006) and Silverlight (2008)Flex (2006) and Silverlight (2008)Mobile Flex, HTML5, ObjectiveMobile Flex, HTML5, Objective--C, JavaC, Java
GeoSpatialGeoSpatial HistoryHistory19601960--75 75 -- Harvard Laboratory For Computer Graphics And Spatial Analysis1969 E i t l S t R h I tit t (ESRI) b ilt1969 - Environmental Systems Research Institute (ESRI) - built on Harvard Graphics developments1970 - Intergraph Corporation – IBM spin off1996 – MapQuest launched1997 – ESRI launch MapObjects IMS2000 – ESRI launch ArcIMS2000 – 2006 MapServer and GeoServer are released2002 – ESRI launch ArcIMS2005 – Google maps is released2005 – OpenStreetMap founded2007 – Yahoo, Microsoft offer mapping sites and API’s 2008 - First GPS enabled smart phone2012 – Mobile Maps, GIS & LBS

4/25/2012
4
MobileMobile
Mobile DemystifiedMobile DemystifiedMobile is confusing!Mobile is confusing!
H dH d S t h & T bl tS t h & T bl t-- Hardware Hardware -- Smartphones & TabletsSmartphones & Tablets-- Platforms Platforms –– iOSiOS, Android, Windows .. , Android, Windows .. -- Software Software –– Web v native v hybridWeb v native v hybrid-- Languages Languages –– Mobile Flex, HTML 5, Mobile Flex, HTML 5, a guagesa guages ob e e , 5,ob e e , 5,
ObjectiveObjective--C, Java …C, Java …

4/25/2012
5
HardwareHardwareSmartphonesSmartphones-- Screen size 2 1Screen size 2 1 –– 4”4”Screen size 2.1 Screen size 2.1 44-- Good for routing, checkGood for routing, check--in apps etcin apps etc
Tablets Tablets –– Screen size 7” Screen size 7” –– 10.1”10.1”
Off th ibilit f i hOff th ibilit f i h-- Offers the possibility of richer more Offers the possibility of richer more complex appscomplex apps
Mobile AppsMobile AppsWebWeb-- JavascriptJavascript/HTML 5 = most mobile browsers/HTML 5 = most mobile browserspp-- Flash, Flex & SilverlightFlash, Flex & Silverlight–– notnot Apple Apple iOSiOS
Native Native –– Installed apps Installed apps egeg. Objective. Objective--C (C (iOSiOS))advantages advantages –– performance?performance?disadvantage disadvantage –– built for one platformbuilt for one platform
Hybrid Hybrid -- Installed apps Installed apps egeg. Adobe Mobile Flex. Adobe Mobile Flexadvantages advantages –– runs on most platformsruns on most platformsdisadvantage disadvantage –– performance?performance?

4/25/2012
6
Applications of Mobile Applications of Mobile TechnologyTechnology
Location Focused API’sLocation Focused API’s
Maps and more Google, MapQuestMaps and more Google, MapQuest
GIS GIS –– ESRIESRI
Other location serviceOther location service–– Foursquare, Facebook, Foursquare, Facebook, GeoLoqiGeoLoqi-- GeoMarketingGeoMarketing, , GeoFencingGeoFencing, , GeoSocialGeoSocial

4/25/2012
7
Available Mobile GIS AppsAvailable Mobile GIS Apps
ESRI ESRI –– Free app Free app iOSiOS & Android. & Android. ArcGIS.comArcGIS.com
ESRI ESRI –– ArcGIS Online templatesArcGIS Online templates
WebMapSolutionsWebMapSolutions –– GeoMobileGeoMobile for ArcGISfor ArcGISFree app Free app iOSiOS, Android, Blackberry, Android, Blackberry
Sharing your GIS DataSharing your GIS Data
ArcGIS Server ArcGIS Server –– dynamic, tiled, feature dynamic, tiled, feature lyrslyrs
ArcGIS Online ArcGIS Online –– web mapsweb maps
ShapefilesShapefiles
Other Other –– GeoServerGeoServer, , MapserverMapserver

4/25/2012
8
Mobile Mobile GeoSpatialGeoSpatial Applications Applications VisualizationVisualization
View your data as layers over View your data as layers over basemapsbasemaps –– fields, soil type fields, soil type etcetcBoth static and dynamic dataBoth static and dynamic data
Mobile Mobile GeoSpatialGeoSpatial Applications Applications Management and CoordinationManagement and Coordination
Tracking and coordinating field workersTracking and coordinating field workersLive data updates from the fieldLive data updates from the fieldLive data updates from the fieldLive data updates from the field
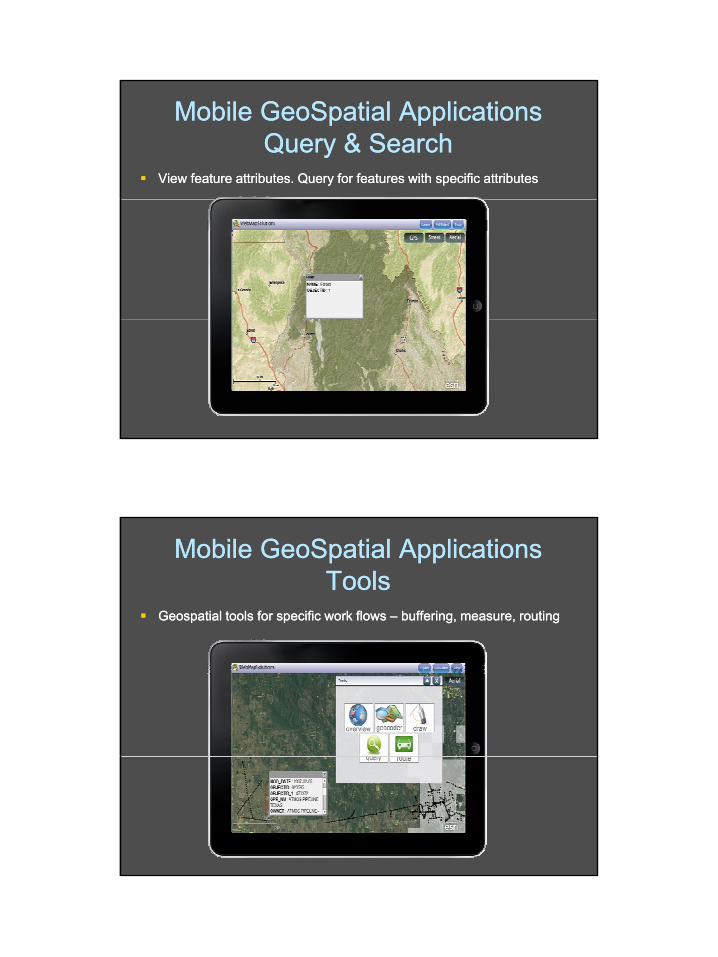
4/25/2012
9
Mobile Mobile GeoSpatialGeoSpatial Applications Applications Query & SearchQuery & Search
View feature attributes. Query for features with specific attributesView feature attributes. Query for features with specific attributes
Mobile Mobile GeoSpatialGeoSpatial Applications Applications ToolsTools
Geospatial tools for specific work flows Geospatial tools for specific work flows –– buffering, measure, routingbuffering, measure, routing

4/25/2012
10
Mobile Mobile GeoSpatialGeoSpatial Applications Applications Data CollectionData Collection
The The end of pen and paperend of pen and paperAdding & updating featuresAdding & updating features –– field fertilizationfield fertilizationAdding & updating features Adding & updating features field fertilizationfield fertilization
Mobile Mobile GeoSpatialGeoSpatial Applications Applications Updates, EditingUpdates, Editing, Annotation, Annotation
Feature and Attribute Editing. Feature and Attribute Editing. Updates done in the field sent to central serverUpdates done in the field sent to central serverUpdates done in the field sent to central serverUpdates done in the field sent to central server

4/25/2012
11
Mobile Mobile GeoSpatialGeoSpatial Applications Applications Online/OfflineOnline/Offline
No WiNo Wi--Fi …. no problem!Fi …. no problem!Caching data on the mobile deviceCaching data on the mobile deviceCaching data on the mobile deviceCaching data on the mobile device
Is Mobile the Future of GIS?Is Mobile the Future of GIS?Mobile = OpportunityMobile = OpportunityCC t tt tCContextontextNew usersNew usersNew toolsNew toolsNew marketsNew marketse a etse a ets

4/25/2012
12
QuestionsQuestionsShould we reShould we re--label ourselves label ourselves -- location location based solution providers?based solution providers?based solution providers?based solution providers?Is this the end for Trimble?Is this the end for Trimble?Will be start also looking to Google Will be start also looking to Google etcetcfor (GIS) for (GIS) solutions?solutions?
Thank You Thank You -- Questions?Questions?
Website and Blog: Website and Blog: b l tib l tiwww.webmapsolutions.comwww.webmapsolutions.com
Twitter: Twitter: www.twitter.com/flexmapperswww.twitter.com/flexmappersYouTube: YouTube: www youtube com/webmapsolutionswww youtube com/webmapsolutionswww.youtube.com/webmapsolutionswww.youtube.com/webmapsolutions
[email protected]@webmapsolutions.com

4/19/2012
1
RAWUNCLASSIFIEDLiDAR POINTS

4/19/2012
2
GROUND ANDVEGETATION
TRANSMISSIONLINES ANDTOWERS

4/19/2012
3
DANGEROUSVEGETATION
WIRESWIRES
25 ft
FULLY CLASSIFIED +DANGEROUS POINTS

4/19/2012
4
FULLY CLASSIFIED +DANGEROUS POINTS
AND VECTORS
LINEAR REFERENCING
Relevant attributes
t l ti• tower locations
• tower type
• line rating
• grow in / fall in hazard points**
• planimetric features**
** REQUIRES EXTRA PROCESSING

4/19/2012
5
RECENT DEVELOPMENTS
Integration with gorthophotography

4/19/2012
6
RECENT DEVELOPMENTS
Tools for ArcGIS
• LP360
• ArcGIS Desktop 10.1
Other OptionsOther Options
• LAStools
• FUSION
LIDAR “CAN SEE THROUGH TREES”
Contours (Photogrammetric vs. LiDAR Comparison)

4/19/2012
1
When the floodwaters are rising, who’ll do the maps?
Christina BoggsCalifornia Department of
Water Resources
Nothing Ever Happens
• Fall 2007 – Southern California Wildfires• July 2008 Mud/debris flows Inyo County Mud• July 2008 – Mud/debris flows – Inyo County Mud
Flow• January 2009 – Medford Island Levee Repair• August 2009 – Ship Soft Grounding – Bradford
Island O t b 12 13 2009 C l b D St• October 12‐13, 2009 – Columbus Day Storms
• Golden Guardian Exercise 2010/2011• F‐CO Exercise 2009/2010/2011

4/19/2012
2
Photo courtesy of http://www.flickr.com/photos/slworking/
I need 4 maps in the next hour and someone needs to know what County Hamilton City is Hamilton City is in.

4/19/2012
3
St d di ti ?Standardization?

4/19/2012
4
Imagine Angels Singing
We Can Do This!

4/19/2012
5
Standard Operating Guidelines
• Map Templates
• Incident Geodatabase
• Symbology Standardization

4/19/2012
6
Toolbox
Why are you asking me for paper?

4/19/2012
7
How did I forget socks?
I know the power of GIS, I don’t want maps – I want panswers!
Plans and Intel Chief During F‐CO Exercise 2011During F CO Exercise 2011

4/19/2012
8
Where’s that data at?
What?! Someone wants to use this later? Metawha?

4/19/2012
9
Thanks to GSTOP Writers
We
Jedi Council
• Jaime Matteoli (fearless leader)
• Jane Schafer‐Kramer
• Melody Baldwin
• Jonathan Mulder
• Christina Boggs

4/19/2012
10
Thanks!
Questions?
Shameless NHD Plug
*The National Hydrography dataset is always relevant and important. You should support it!

This presentation was delivered at CalGIS 2012: Sacramento, CA.
Abstract: The advent of cloud services is bringing on a paradigm shift in the GIS market, as future growth in this market will be through web-deliver of services to new users. Existing players in this market are in the process of MISSING this opportunity, opening the door for a new generation of firms. Cartograph Inc. (http://ww.cartograph.com) is one of these new companies.

The first general problem with GIS is that cost & complexity make it unavailable to middle-market firms.

The second general problem with GIS is that even amongst firms that can obtain the technology, technicians suffer from isolation and the inability to deliver an interactive experience to their end-users.

The inspiration for Cartograph was to address the 4 problems of cost, complexity, lack of collaboration amongst technicians, and lack of interaction between technicians and their end-users.

Cartograph seeks to recast the isolated GIS technician as a central organizer: dynamically interacting with counterparts and end users.

Cartograph provides different tool sets to users on the system according to their specific roles.

Cartograph is a stand-alone system tha seeks to change the GIS paradigm, but it is NOT going to replace desktop GIS tools. For he foreseeable future, Cloud GIS and desktop GIS will coexist.

A few facts about Cartograph Inc.

What are established GIS companies doing as the GIS market transitions to being web-centric? Surprisingly little, thus far...

Web companies offering consumer mapping have shown little interest in building their ad-supported services into “real” online GIS services.
Traditional GIS vendors have found themselves unable to aggressively go after new opportunities on the web, as doing so involved undermining their present revenue streams.

Middle-market GIS opportunites are open for a new-generation of companies to capitalize upon...

Predictions:
1) Within 3 years, GIS will start going “mainstream” (meaning that non-technincal professional people will start becoming familiar with the term)
2) The firms leading this revolution will NOT be the leading web & GIS firms commonly known today.

Cartograph Inc. (http://www.cartograph.com) is an example of one of the new-generation technology companies seeking to capitalize upon the paradigm shift happening in the GIS market.

Information Rules: Communicating
with City Residents in the Google Era
April 12, 2012
Digital Map Products

We Live in the Google Era
• Realities of the Google Era
• Data, Data Everywhere • Constant Connection to Data: Plugged-In • Data Where and When We Want It

What This Means for Cities
• Engage the Residents
• Interactive Tools • Self-Servicing options • Familiar Platforms • Maps!
• Cost Effective Solution
• Efficient Communication

Citizen Expectations
• Expectations for Information
• 24 x 7 service • Current data • Maps!
• Expectations of Government
• Transparency • Efficient • Web and Mobile-Enabled • Fast and Easy to Use
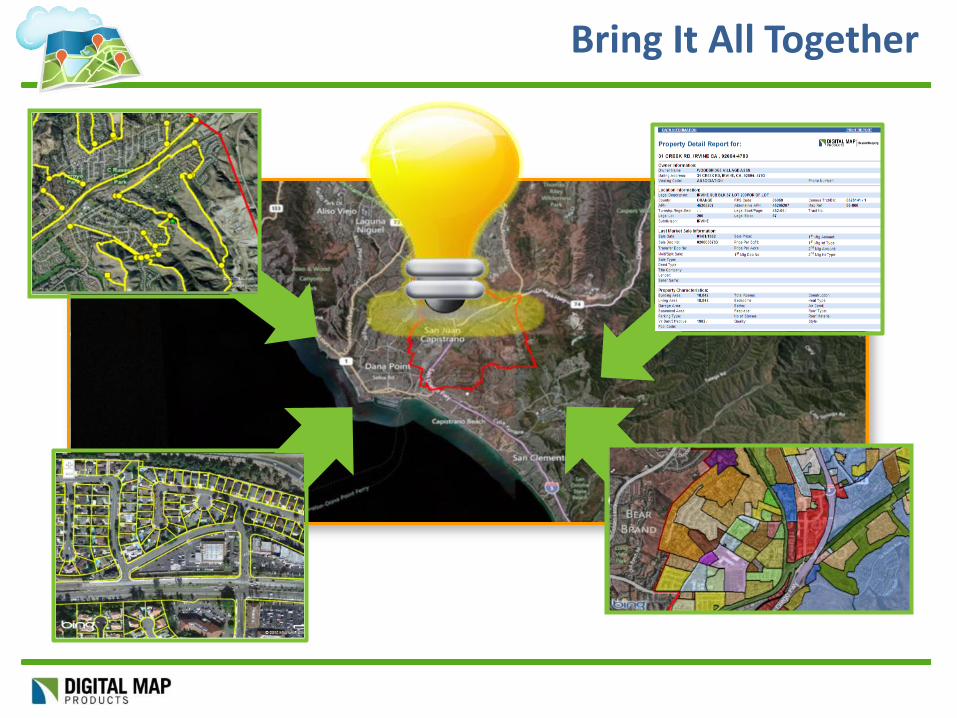
Bring It All Together

Online Interactive Maps for City Websites
•6
• Simple & Intuitive Design
– Simple Map Navigation
– Cross Browser Compatible
• Customizable
• Cloud-Based
• Share Community Information & Data
• Self-Service Info, 24-7 access

City of Mission Viejo, CA
•7

City of Mission Viejo, CA
•8

City of Mission Viejo, CA
•9

City of San Juan Capistrano, CA

City of San Juan Capistrano, CA

City of San Juan Capistrano, CA

City of El Cerrito, CA
•13

Community Information & Maps
Property Information
City Services
City Updates
Community Amenities

Constituent Engagement
• Memorial Day Celebration
• Parade Route • Road Closures • Alternate Routes • Performance Stages • Vendor Locations • Parking Options/Costs

Constituent Engagement
• Sewer System
Improvement Project
• Project Plans • Project Phases (zones) • Project Milestones • Traffic/Parking Impacts

How To?
1. Load Data
2. Customize
3. Style
4. Share

A Cloud Solution
• Faster to Deploy
• More Affordable
• Easier to Use
• More Flexible
• Secure/Reliable

Benefits for your City
•19
Increased Government Transparency
Fewer Staff Interruptions (calls into City)
Increase community participation and engagement
Progressive Government and Leadership
easy
mapping
Maps Rock!
Mapping Best Practices
Whitepapers, Articles, Videos www.digmap.com/resources/bestpractices.html
Developer Resources
Code Examples, Documentation, Trial www.spatialstream.com/microsite/examples.html
Contact us
Twitter: @DMPInc [email protected], 888.322.MAPS (6277) www.digmap.com

!"

!"#$%%$%#&'($)&'*+,&-$'(&*&)'./0&*%1&-$++&"%1&-$'(&*&)'./0&*)&-"++23&#$"%"#$$"&'()*"+,-."4(*-%&56.7&895&*%1&8.:.;%1"/&.:&4<$"%<"=">*'"2./#&*%1&*;'(./&.:&!""#$%&$'()*&+$!),-./,$0-&$12234#0$"/$5*)&/*&$)/$16&7)*32&&&
/"

0"

12"*3,.4"-+"5"(,-5'673837"8)39:"73* 4"*;)2<"5(-=*"4>)32>3")2"?323,57@"A;3,3"5,3".52B".5C-,"*;3.34"5,3"-+">-.D377)2?")2*3,34*"*-"4->)3*B"52'"9)77"',)83"4>)32&E>",3435,>;"+-,"*;3"23F*"*9-"'3>5'34@"G-=,"-+"*;343"5,3"H-2"*;3"47)'3I"J5,*"-+"K5,*;"4B4*3."4>)32>3")4"(543'"=D-2"*;3",3>-?2)&-2"*;5*"*;3"K5,*;"+=2>&-24"54"5">-.D73F"4B4*3."-+")2*3,6",375*3'">-.D-232*4"*;5*".=4*"(3"=2'3,4*--'"54"5"9;-73@"A;3".5C-,",3435,>;"L=34&-24"*;5*">-.3"-=*"-+"*;343"*;3.34"54<M"How the Earth works… (process) How the Earth should look… (design) How we should look AT the Earth… (data) """
#"

There are many natural science domains in which GIS is being used effectively to understand how the Earth works.
N"

O"7-*"-+"9-,<"(3)2?"'-23"5*"K4,)"*-"'3837-D"*,=7B"0P"'5*5"4*,=>*=,34"+-,"0P"3')&2?:"0P"4B.(-7-?B:".354=,)2?"')4*52>34"52'"52?734:"52'"(3Q3,"8)4=57)R5&-2:"D5,&>=75,7B"+-,"D3*,-73=.:".)2)2?@"S-*"9377"<2-92"(B"*;3"5>5'3.)>"?3-7-?B%?3-D;B4)>4">-..=2)*B@"T3";-D3"*-">;52?3"*;5*@"
U"

0P"8-F37"75V>3@"8-F374"5,3"(3Q3,"+-,"'324)*B".354=,3.32*4"4=>;"54"34&.5&2?"?54"433D"'324)*B"52'"-*;3,">-2&2=-=47B"85,B)2?"->352-?,5D;)>"D;32-.325@"W-F374"5,3"354)3,"*-"47)>3:"*-"',59")4-4=,+5>34:"3*>@"J-)2*4"'-"5"(3Q3,"C-("5*"D,3>)437B",32'3,)2?"5">-.D73F"-(C3>*@""X-=,*34B"P58)'"G)275B4-2:"YZ[Z@""
\"

Scientists are normally concerned with how the Earth Works. But the dominating force of humanity begs the question of how the Earth should LOOK. GeoDesign comes in here and is cross-cutting many of scholarly disciplines, bridging the natural with the social sciences !integrating design directly into GIS workflows " An Interactive and Iterative Process for Creating and Evaluating Alternative Designs and Making better Decisions
]"

^-9"93"4;-=7'"7--<"OA"*;3"K5,*;@"Z=>>344+=77B"5'',344)2?"*;343"4>)32&E>"D,-(73.4",3L=),34")2*3?,5&83"52'")22-85&83"5DD,-5>;34"*-"5257BR)2?:".-'37)2?:"52'"'3837-D)2?"3F*324)83"52'"')83,43"'5*5"43*4@""""""A;3">=,,32*">;5-&>"')4*,)(=&-2"-+"585)75(73"'5*5"43*4:"75><"-+"'->=.32*5&-2"5(-=*"*;3.:"52'"75><"-+"354B6*-6=43"5>>344"*--74"52'">-.D=*3,".-'37)2?"52'"5257B4)4">-'34"5,3"4&77".5C-,"-(4*5>734"+-,"4>)32&4*4"52'"3'=>5*-,4"57)<3@"""""""[1Z"D75B4"5"()?",-73";3,3"54")*"3F*32'4"-=,".)2'4"(B"5(4*,5>&2?"-=,"9-,7'")2*-"*;-43"<2-973'?3"-(C3>*4"*;5*"93">,35*3"52'".5)2*5)2_'5*5`").5?3,B`".-'374"*;5*"3FD75)2"D,->344"52'"9-,<a-94`"52'".5D4:"9;)>;">-..=2)>5*3"52'"5,3"D3,4)4*3'")2"5DD4@"A;3B ,3"7)<39)43">,35&2?"5"<)2'"-+"4B4*3.5&>"+,5.39-,<"+-,"=2'3,4*52')2?@"O2'"-=,">-773>&83"9-,<">,35*34"5"<)2'"-+">-773>&83"=2'3,4*52')2?")+"93">-=7'"C=4*"(,)2?")*"577"*-?3*;3,@""
b"

We are in an era of regional- to global-scale observation and simulation of the Earth as exemplified by these large NSF and GEO programs. These big programs produce big data. cd)?"'5*5"H5,3I"'5*5"*;5*"3F>33'"*;3"D,->344)2?">5D5>)*B"-+">-2832&-257"'5*5(543"4B4*3.4@"A;3"'5*5"H5,3I"*--"()?:".-83"*--"+54*:"-,"'-2e*"E*"*;3"4*,)>*=,34"-+"B-=,"
'5*5(543"5,>;)*3>*=,34@"A-"?5)2"857=3"+,-.H"*;343I"'5*5:"B-=".=4*">;--43"52"57*3,25&83"95B"*-"D,->344")*@f"K'"P=.()77")2"!"#$$%$&'()*'+%&',#-#:"geh3)77B"i3')5"
Critical Zone focuses on >7).5*3"52'"752'"=43:"a=F34"5>,-44"*;3"95*3,4;3'"(-=2'5,)34:"T5*3,:"X5,(-2:"Z3').32*4:"S=*,)32*4"[KgZZ"j"4D5>36(-,23:"5),(-,23:")2"4)*="4324-,4:"'5*5".?.*"5,>;)*3>*=,3"
K5,*;Z>-D3"j"43)4.-.3*3,4:"[JZ"-2"D75*3"(-=2'5,)34:"+5=7*"4*,5)2:">,=4*57"'3+-,.5&-2"gg1"j">5(73'"-(43,85*-,B"j"K2'=,52>3"O,,5B"9)77";583"a33*"-+"?7)'3,4_A:"Z57:"P)44-783'"g/:"X;7-,-D;B77:"(5><4>5Q3,66"4=,+5>3"(=-B4:"435a--,")24*,=.32*4"
!$"

O4"52"3F5.D73"+,-."->352"gdZKhWOAgh1KZ:";3,3")4"5"7--<"5*"*;3"*3>;2-7-?B">=,,32*7B"52'"k/$"B35,4")2*-"*;3"+=*=,3@"A;)4"?,5D;)>:">-=,*34B"-+"*;3"ShX"->352")2+,54*,=>*=,3",3D-,*:">5D*=,34"5"85,)3*B"-+")44=34:"328),-2.32*4:"52'"*--74@"
!!"

d)?"'5*5"5,3"735')2?"*-"5"239"4>)32>3"D5,5')?.:"*;3"239"4>)32>3"-+"c()?"'5*5f"l*;3")2=2'5&-2"-+"'5*5"+,-."45*377)*34:"4324-,4:"52'"-*;3,".354=,)2?"4B4*3.4"52'"*;3")44=34"544->)5*3'"9)*;"*;-43"75,?3"'5*5"43*4m"A9-",3>32*"4D3>)57")44=34")2"Z>)32>3"52'"S5*=,3"4D35<"*-"*;)4".-4*"37-L=32*7B""/$$]")44=3">-..3.-,5*3'"[--?73e4"!$*;"(),*;'5B"52'"+->=43'"34D3>)577B"-2"43.52&>4@"l3@?@:"cA;3"+=*=,3"-+"4>)32>3"'3D32'4")2"D5,*"-2"*;3">7383,2344"-+"435,>;"32?)234"(3)2?"5DD7)3'"4D3>)E>577B"*-"4>)32&E>"'5*5@fm"O2'"*;3,3")4"574-"*;3"/$$b"(--<"?("&@.;/'(&A*/*1$#B7&-($<(&C.)$')&*&%"-&C*/*1$#B&.:&)<$"%DE<&1$)<.F"/0&>"0.%1&'("&"G$)D%#&H&C*/*1$#B)&.:&9IAJKJ8J4I7&LMLNO4J47&*%1&4JIPNL?J5M&'.&*&Q'(&-("/"&$%)$#('&$)&1$)<.F"/"1&'(/.;#(&'("&B*%$C;+*D.%&*%1&"GC+./*D.%&.:&+*/#"&1*'*&)"')2&&A;3")24D),5&-2"+-,"*;3"(--<e4"&*73">-.34"+,-."73?32'5,B"i)>,-4-n">-.D=*3,"4>)32&4*"o)."[,5B:"(543'"-2"5"73>*=,3";3"?583"5*"*;3"S5&-257"O>5'3.B"-+"Z>)32>34"0"933<4"(3+-,3";3"')45DD35,3'"5*"4352&
&
!/"

12"D5,*"(3>5=43"-+"*;3"4D3>*,3"-+"c()?"'5*5f"A;3,3"5,3"574-").D-,*52*"*,32'4")2"*3,.4"-+";-9"93"Pg"4>)32>3@"T)77">-2&2=3"*-"(3M"66"i-,3")2*3?,5&83"5>,-44"*;3"')4>)D7)234"
6!6"i-,3">-775(-,5&83"l2-*"-27B"9)*;"-*;3,"4>)32&4*4"(=*"9)*;">)&R324%>)&R32"4>)32>3m"6!6"i37'"4>)32>3"9)*;"D-7)>B"6!6".-,3"XB(3,6325(73'"l9)*;"4;5,3'")2+,54*,=>*=,3:"34D3>)577B"-2"*;3">7-='m"6!66"i-,3",3576&.3"R$%&'("&)"%)"&'(*'&-"&<*%&%.&+.%#"/&*S./1&*&+"$);/"+0&*CC/.*<(&'.&)<$"%<"T&/*C$1&C;>+$<*D.%&.:&/")"*/<(&>"<.B$%#&B./"&</$D<*+U&6!66"i-,3"4324-,"(543'"l)2>7=')2?:"5?5)2:">)&R32"4324-,4m"
!0"

8.;+1&#.&.%&*'&#/"*'&+"%#'(&*>.;'&'("&B*%0&V;")D.%)&>;'&*)&*&F"/0&)B*++&)*BC+"32&^37D4"574-"*-"define infrastructure needs to do the science, including the science of the data and mapping. Driving the development of sensors and tools X-83,4"ZgX1KAOp"A^KiK"54"9377:")2>7=')2?"ZAKTOhPZ^1J"gG"A^K"KSW1hgSiKSA"
!#"

8.;+1&#.&.%&*'&#/"*'&+"%#'(&*>.;'&'("&B*%0&V;")D.%)&>;'&*)&*&F"/0&)B*++&)*BC+"32&^37D4"574-"*-"define infrastructure needs to do the science, including the science of the data and mapping. Driving the development of sensors and tools X-83,4"ZgX1KAOp"A^KiK"54"9377:")2>7=')2?"ZAKTOhPZ^1J"gG"A^K"KSW1hgSiKSA"
!N"

S-,*;"X-54*"T5*3,4;3'"O44->)5&-2:"O4*-,)5:"gh"1.D-,*52>3"-+")2>7=')2?"752'6(543'"4*5<3;-7'3,4")2"D7522)2?"+-,">-54*4"52'"->3524:"34D3>)577B"54"752'"D-77=&-2"',5)2)2?")2*-"->3524")4"5";=?3"D,-(73.@"K@?@:"\$q"-+"*;3"9-,7'e4"4395?3"?-34")2*-"*;3"->3524"=2*,35*3'@"]$q"-+"*;3"D-77=&-2")2"*;3"->3524">-.34"+,-."*;3"752'"
i5C-,">;57732?34"*-"(3"4=,3"54"93"5,3"433)2?"4)?2)E>52*"*324)-24"(3*9332"95*3,"=43"-2"*;3"752'"52'"5?"52'"-*;3,"=434:">-.D5,3'"*-"E4;3,.52r4")2*3,34*4:"54"95*3,")4"a-9)2?"-=*"*-"*;3"-D32"->3524"6";583"2-*"E?=,3'"-=*",)?;*"95B"*-";583"577"*;-43"8-)>34"5*"*;3"*5(73"B3*@"
S33'"*-"=2'3,4*52'"*;3"752'6->352">-223>&-24@"i-2*3,3B"d5B"SiZ"52"3F>37732*"3F5.D73"54"*;3),".?.*"D752")2>7='34"+5,.3,4@"
!U"

@@2-*"+,-."-)7"4D)774:"2-*"+,-."'=.D)2?"-+"*,54;"5*"435@"O2'"+=,*;3,:"\$q"-+"*;3"9-,7'e4"4395?3"?-34")2*-"*;3"->3524"YSAhKOAKP"
!\"

Esri is also driven by these questions as well as the need to learn from recent disasters such as in the Gulf and in Japan, and the desire to help implement the President’s National Ocean Policy. Esri has thus embarked on an ocean GIS initiative to help provide the tools and techniques that are needed to advance ocean science, ocean geodesign, ocean management, and ocean mapping and charting."S-9"1"9-=7'"7)<3"*-"L=)><7B"4=..5,)R3"4-.3"-+"*;3"D,-C3>*4"93"5,3"9-,<)2?"-2"54"D5,*"-+"*;)4">,-446-,?52)R5&-2"3s-,*"*-"32;52>3"K4,) 4">5D5()7)&34"*-"(3Q3,"4=DD-,*"[1Z")2"->352-?,5D;)>"5DD7)>5&-24:"54"9377"54X-54*57"52'"i5,)23"ZD5&57"J7522)2?"lXiZJm"
!]"

d5*;B.3*,B")4"4=>;"52").D-,*52*"'5*5"43*";3,3"54")*")4"+-=2'5&-257"*-"(-*;"*;3")2'=4*,)57";B',-%.5,)&.3"4)'3"52'"*;3"->352"4>)32>3"4)'3@"O2'")*")4").D-,*52*"+,-."5">5,*-?,5D;)>"4*52'D-)2*:"54"9377"54"+-,"=2'3,4*52')2?"?3-.-,D;-7-?B"O"()?"D,-C3>*"5*"K4,)")4"5"239"->352"(543.5D:"5";)?;"L=57)*B",3+3,32>3"(543.5D"*;5*">52"(3"5''3'"54"5"43,8)>3")2"O,>[1Z@>-.:"5<5"O,>[1Z"g27)23"lO[gpm:"O,>[1Z"KFD7-,3,"-,"O,>[1Z"P34<*-D@"Y2'3,435"3L=)85732*"*-">-..=2)*B".5D4"D,-?,5."i5,)&.3"*35."9-,<)2?"-2"5"75(3767344"83,4)-2"*;5*">52"(3">-.()23'"9)*;"-*;3,"(543.5D4"
!b"

Esri is building bathy into a much larger system that services both the commercial and the academic.
//"

/0"

O4"D5,*"-+"*;3"O,>[1Z"Z-7=&-24"12)&5&83")2"O[gp:"52"->3524">-..=2)*B"2-9"3F)4*4"9)*;"+35*=,3'">-2*32*"D,-8)'3'".5)27B"(B"SgOO"52'"dgKi@"W5,)5&-24"-2"*;)4"*;3.3"9)77"(3"937>-.3@"
T3"9)77"(3"32>-=,5?)2?"(,-5'"D5,&>)D5&-2"+,-."*;3"4>)32>3">-..=2)*B"*-"4;5,3M"6! P5*5"5257B&>4"6! i5D4"52'",3D-,*4"6! P)4>=44)-24"6! Z->)57"23*9-,<)2?"""
/N"

ODD4"54"')4&2?=)4;3'"+,-."*--74"52'"*;3B")2>7='3"g[X"TiZ:"TGZ:"(=*"574-"TJZv@"d=)7*"(B"*;3">-..=2)*B"52'"4;5,3'@"X52"(3"-2"*;3"93("-,"'-927-5'5(73"*-".-()73"'38)>34:"4=>;"54"9;5*"X32XggZ"57,35'B";54"585)75(73@"A;)4")4"7)<3"5"[1Z"83,4)-2"-+"*;3")A=234"Z*-,3@"
/U"

O2-*;3,"3F5.D73")2"O,>[1Z"KFD7-,3,"9;)>;"577-94"+-,",)>;3,">5,*-?,5D;)>">-2*32*"52'"9)*;"*;3"5()7)*B"*-".5<3"D,3432*5&-24"4-"*;5*"B-=">52"*377"4*-,)34"9)*;"B-=,".5D4"
/\"

SeaSketch is Esri s big CMSP tool effort where we are collaborating very closely with the Will McClintock lab at UCSB to develop the next generation of MarineMap. Many of you are familiar with the MarineMap decision-support tool developed to support the MLPA. SeaSketch is all about 8.++*>./*DF"&W".=")$#%&:./&8.*)'*+&I*/$%"&4C*D*+&A+*%%$%#&52'"9)77")2>-,D-,5*3"5".=>;"75,?3,"4=)*3"-+"4D5&57"5257B&>47&$%<+;1$%#&)C*D*+&1$B"%)$.%)&.:&'/*1".S)&5.-2?"D-*32&577B">-2a)>&2?",34-=,>34:"43,8)>34:"43>*-,4:"52'"&.34@"h3576&.3".5D"52'"*;,35'3'"')4>=44)-24:"4;5,3'"8)394"-+"'34)?2"4<3*>;34"-2".5D4@"J,-*-*BD3"(B"75*3"i5,>;%35,7B"OD,)7:")2)&57"(3*5"*34&2?"(B"Sw"P3D*"-+"X-243,85&-2:"52'"*;32"+=77"+=2>&-24"*-"(3"4;-92"5*"/$!/"K4,)"YX@"We aim for SeaSketch to make a big contribution in another key area: P5*5"4;5,)2?"84@"4>)32>3"4;5,)2?"6"7-*4"?-)2?"-2"*-"4;5,3"'5*5"(=*"2-*"54".=>;"*-"4;5,3"4>)32>3"(3*9332"')s3,32*",3?)-24"52'"3>-4B4*3.4`"52'"233'"4;5,)2?"(3*9332"D;B4)>57"4>)32>34"52'"4->)57"4>)32>34""
/]"

[3-P34)?2")4"5"D-93,+=7">-2>3D*@"1.5?)23"*;)4"j"577"B-="'-")4"4<3*>;@"d=*"9;32"B-="4<3*>;:"B-="?3*",3576&.3"+33'(5><"-2"*;3"D-*32&57">-243L=32>3"-+"B-=,"'34)?2@"dB")*3,5&2?"*;,-=?;"4<3*>;34"52'"3857=5&-24:"B-=">-.()23"4>)32>3"9)*;"*;3"=232>=.(3,3'"5,*"-+"'34)?2"6"+,337B"3FD7-,)2?"52B"D-*32&57"D752"52'"735,2)2?"54"B-="?-";-9"*;-43"'34)?24"5s3>*"*;3"9-,7'"52'")*4"D3-D73@""
""
"
/b"

Y43,4"9)77"(3"5(73"*-"8)39".5D"'5*5"+,-."5=*;-,)*5&83"4-=,>34"+,-."577"-83,"*;3"9-,7'@"A;3Be77"433"*;3"')4*,)(=&-2"-+";5()*5*4:"323,?B",34-=,>34:")2+,54*,=>*=,3:"52'".-,3@"A;32:"=4)2?"*;343".5D4"54"5",3+3,32>3:"*;3Be77"(3"5(73"*-"4<3*>;".525?3.32*"D7524@"""""Y43,4"9)77"3FD,344"*;3),").%$%)$/"6"x1"*;)2<"5"9)2'"*=,()23"4;-=7'"?-";3,3:x"-,"54<"L=34&-24:"xT;5*";5DD324")+"1"D=*"5".5,)23"D,-*3>*3'"5,35";3,3yf"*;,-=?;"4<3*>;)2?"-=*"')s3,32*")'354@"A;32:"*;343"D7524"5,3"5=*-.5&>577B"3857=5*3'"(543'"-2"*;3"(34*"585)75(73"4>)32>3"52'"'5*5@""""""O2'"*;,-=?;"5">;5*"+-,=."*;5*")4"&3'"*-"*;3),".5D4:"*;3Be77"(3"5(73"*-"')4>=44"*;3),"D7524"9)*;"-*;3,"=43,4:"52'"(=)7'"4=DD-,*"+-,"*;3),"D7524"(543'"-2"4>)32&E>".3,)*@""
0$"

d)-7-?)>5763>-2-.)>".-'37"-+"*,5'3-s4"(3*9332"3>-4B4*3."43,8)>34")2",375&-2"*-""D-*32&57".525?3.32*"4*,5*3?)34"A-=,)4.:">-243,85&-2:"323,?B"'3837-D.32*:"7-(4*3,"E4;)2?:"9;5734"o=4*"D=(7)4;3'"(B"X,-9"3*"57@")2"JSOZM"T;)*3:"X@:"^57D3,2:"d@"Z@:"52'"z5DD37:"X@"W@:"/$!/:"K>-4B4*3."43,8)>3"*,5'3-s"5257B4)4",383574"*;3"857=3"-+".5,)23"4D5&57"D7522)2?"+-,".=7&D73"->352"=434M"J,->@"S5*@"O>5'@"Z>)@:"8@"!$]:@";QDM%%'F@'-)@-,?%!$@!$\0%D254@!!!#/!N!$b@"
0!"

0/"

12"5"2=*4;377"*;3"g>352"^357*;"12'3F")4"'34)?23'"*-"*5<3"*;3"D=743"-+"*;3"->352"*-"D,-8)'3"5"L=)><"43*"-+"8)*57"4)?24"l)@3@:")2')>5*-,4"*;5*".354=,3"*;3")2*324)*B"-+"*;3".-4*"=,?32*"->352"4*,344-,4:")2>7=')2?">7).5*3">;52?3:"->352"5>)')E>5&-2:"-83,E4;)2?:";5()*5*"'3?,5'5&-2:")2854)83"4D3>)34:"7-44"-+"()-')83,4)*B:"D-77=&-2"52'"3=*,-D;)>5&-2m@"A;343"9)77";37D".525?3,4:"D-7)>B.5<3,4:"52'"*;3"D=(7)>"L=)><7B"')5?2-43"9;3,3"D,-(73.4"7)3"52'")'32&+B"D-44)(73"4-7=&-24@"A;3"D,-C3>*"*;3,3+-,3"433<4"*-"(,)'?3"*;3"4>)32>3%D-7)>B.5<3,"')8)'3@""K4,)")4">=,,32*7B"9-,<)2?"9%SXKOZ%XiOJ:"X-243,85&-2"12*3,25&-257:"h5')>57"i3')5"-2"52")2*3,5>&83"5*754"8)393,"*;5*"9)77".5D"-=*"->352";357*;")2'3F"'5*5"+-,"4373>*3'",3?)-24"-+"*;3"9-,7'@"1*"9)77"(3"=4)2?"5">=4*-.)R5&-2"-+"*;3"->352"(543.5D@"A;3"D,-C3>*"54"5"9;-73")4"73'"(B"YXZd"52'"X-243,85&-2"12*3,25&-257")2">-775(-,5&-2"9)*;"5"75,?3"52'"')4&2?=)4;3'"?,-=D"-+".5,)23"3>-7-?)4*4:"4=>;"54"p5,,B"X,-9'3,:"XgiJOZZ:"52'"*;3"S39"K2?752'"OL=5,)=.@"
00"

6"G-73B"3*"57@"D5D3,")4"[=)')2?"3>-7-?)>57"D,)2>)D734"+-,".5,)23"4D5&57"D7522)2?"6"p35')2?"4>;-75,4"5,3"'3837-D)2?")2')>5*-,4"*-"*,5><"*;3"->352e4">=,,32*"52'"+=*=,3";357*;:"+->=4)2?"-2"!$"(,-5'7B";37'"D=(7)>"?-574@"6! d543'"-2"*;343"?-574:"93"5,3">,35&2?"5"43*"-+")2')>5*-,4"*-">-24)4*32*7B"52'",37)5(7B".354=,3"*;3";357*;"-+"*;3"->352"52'">-54*4"5>,-44"5"85,)3*B"-+"')s3,32*">-2*3F*4"j"'5*5"D--,"52'"'5*5",)>;:"*,-D)>57"52'"*3.D3,5*3:",3?)-257"52'"?7-(57@"
6"Y7&.5*37B:"*;343")2')>5*-,4"9)77"(3")2>-,D-,5*3'")2*-"5"4)2?73"g>352"^357*;"12'3F"lg^1m"*;5*"9)77"(3">57>=75*3'"522=577B"+-,"*;3"32&,3"?7-(3"54"9377"54"5*"4.5773,",3?)-257"4)*34@"
0#"

K4,)")4">=,,32*7B"9-,<)2?"9%YXZd 4"X32*3,"+-,"i5,)23"O44344.32*"{"J7522)2?:"X-243,85&-2"12*3,25&-257:"h5')>57"i3')5"-2"52")2*3,5>&83"5*754"8)393,"*;5*"9)77".5D"-=*"->352";357*;")2'3F"'5*5"+-,"4373>*3'",3?)-24"-+"*;3"9-,7'@"1*"9)77"=43"5">=4*-.)R5&-2"-+"*;3"->352"(543.5D@"h373543"D75223'"+-,"*;3"4D,)2?"*-">-)2>)'3"9)*;"X1 4".5)2"93("75=2>;"52'"*;3"D=(7)>5&-2"-+"52"g^1"C-=,257"5,&>73:";-D3+=77B")2"S5*=,3@"
0N"

K4,)")4"574-"83,B")28-783'")2"*;3"TX[O:"D5,&>=75,7B"5*"*;)4"D-)2*")2";37D)2?"*-"34*5(7)4;"5"P5*5"S3*9-,<"O>&-2"X--,')25&-2"A35.@"
0U"

M.-&9M=JMW&-$'(&*&)'./03&
0\"

0]"

39
i=>;".-,3"*;5*"1">-=7'"*57<"5(-=*"(=*"1";-D3"*;)4"?)834"B-="4-.3")'35"-+"*;3"8)4)-2"5*"K4,)"+-,"4>)32>3:"-=,"+->=4"-2"4=(4*52&83"5DD7)3'"4>)32>3"L=34&-24"52'"*,32'4:">-2&2=3'"'3837-D.32*"-+"'5*5".-'374"52'"*--74"*-"4=DD-,*"4>)32>3"5DD7)>5&-24:")2>7=')2?"D,5>&>57"*--74"'3,)83'"+,-."(54)>",3435,>;:"*;3")'35"-+"[1Z"54"5".3')=."+-,"4D5&57",354-2)2?:"54"5".3')=."+-,"4>)32>3@!SPATIAL REASONING: Where the process and procedures of manipulating maps leads user to think and interact in the “language” of spatial analysis functions in GIS, spatial statistics, spatial process models; interfacing also with policy and management!

!"#