Harlan Chernoff Technical Definition and Description Final Draft
date post
22-Dec-2015Category
view
214download
0
Calculation of Similarity
(Chernoff et al. 1999, 2000, 2001)
1. Observed Similarity = mean of 200 random sub-samples of larger population at size of
smaller population (rarefication)
2. Use Simpson’s Similarity index -- shared presences only
41

Calculation of Similarity
(Chernoff et al. 1999, 2000, 2001)
3. Compare to distribution of 500 random species vectors at size of smaller population
4. Observed Similarity can be interpreted if more than 2 std. dev’s above or below mean of
random distribution
42

Fishes collected during AquaRAP expedition to Pando, Bolivia inSeptember 1996.Jaime Sarmiento, Barry Chernoff, Soraya Barrera, Antonio Machado-Allison, NarcioMenezes, and Hernan OrtegaTAXA Upper
NareudaLower
NareudaUpper
TahuamanuMiddle
TahuamanuLower
TahuamanuManuripi
RajiformesPotamotrygonidae
Potamotrygon motoro - - - -
ClupeiformesEngraulidae
Anchoviella cf. carrikeri - - - -
CharaciformesAnostomidae
Abramites hypselonotus - - - Laemolyta sp. - - - - - Leporinus cf. fasciatus - - - - - Leporinus friderici - - - Leporinus cf. nattereri - - - - Schizodon fasciatum - - -
CharacidaeAphyocharax alburnus - - - -Aphyocharax dentatus - Aphyocharax pusillus - - - Astyanax cf. abramis Astyanax sp. - - - - -Brachychalcinus copei - - -Bryconamericus cf. caucanus - - - - -
43

Simpson's Similarity
Nu
mb
er
of
Ob
se
rva
tio
ns
0
4
8
12
16
20
24
28
32
36
40
44
48
52
56
<= 26(26,28]
(28,30](30,32]
(32,34](34,36]
(36,38](38,40]
(40,42](42,44]
(44,46](46,48]
(48,50]> 50
Random Similarity, community=120, total=313
44

Number of Species
Me
an
Ra
nd
om
Sim
ila
rity
5
15
25
35
45
55
65
75
20 60 100 140 180 220 260
Mean Random SimilarityTotal=313
45

Number of Species
Sta
nd
ard
De
via
tio
n o
f R
an
do
m S
imil
ari
ty
1.0
1.5
2.0
2.5
3.0
3.5
4.0
4.5
5.0
5.5
20 60 100 140 180 220 260
Variation of Random SimilarityTotal = 313
46

R H L S BK V BAR 6 0 2 4 0 0H 63.0 0 4 1 8 1L 78.0 57.6 0 1 0 1S 78.3 54.2 84.8 16 0 1
BK 75.0 44.9 93.2 75.6 1 1
V 66.7 85.7 45.2 69.1 61.9 1BA 72.7 56.8 75 88.6 90.9 31.0n 92 107 59 119 119 42 44u 1 28 0 12 15 2 0
%u 1.1 26.2 0 10.1 12.6 4.8 0#c 11 31 6 6 18 4 4
Similarity Among Macrohabitats -- Fish Data
47
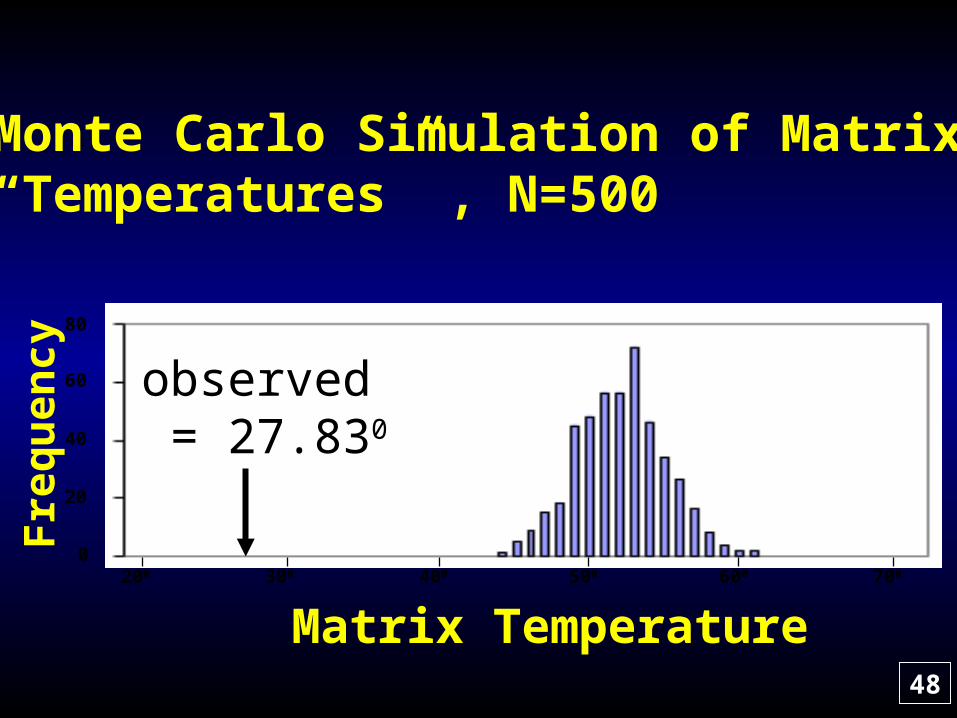
Fre
qu
ency
200 300 400 500 600 700
0
20
40
60
80
Matrix Temperature
observed = 27.830
Monte Carlo Simulation of Matrix“Temperatures” , N=500
48

Similarity Networks
1. Only if matrix is not entropic
2. Camin-Sokal Parsimony
• No reversals
• Only independent acquisitions
• Clusters based on shared presence of species
49

50

> 2,800,000 km2
51

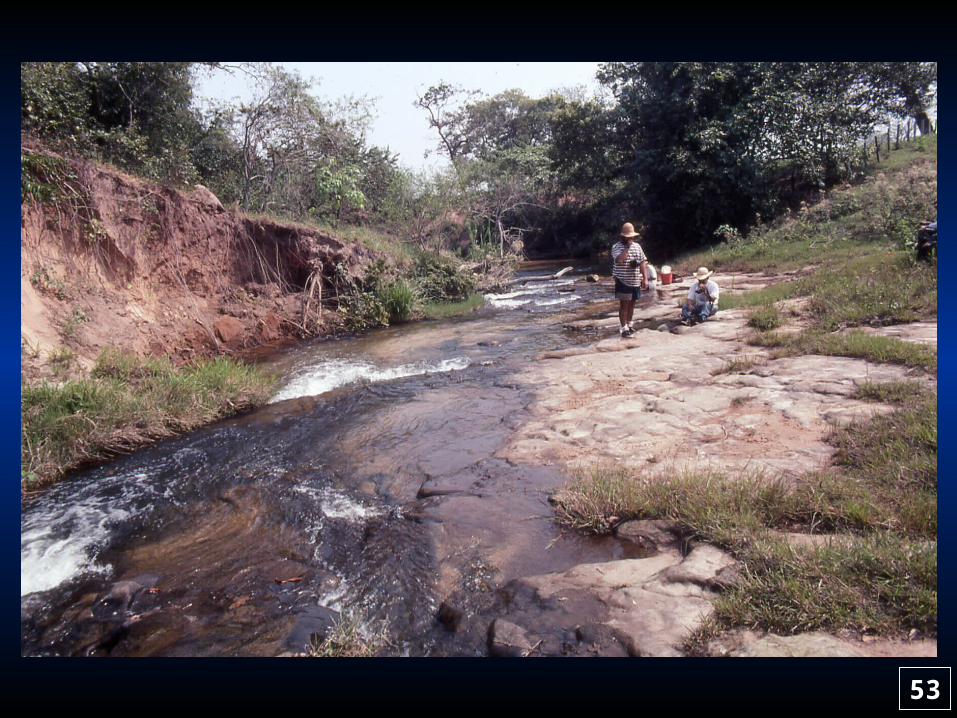
AquaRAP
Southern Pantanal
Brazil
52
53

54

55

56

57

58

59

60


![A Matrix Expander Chernoff Boundnikhil/mchernoff.pdf · Ankit Garg, Yin Tat Lee, Zhao Song, Nikhil Srivastava UC Berkeley. Vanilla Chernoff Bound Thm [Hoeffding, Chernoff]. If ...](https://static.fdocuments.in/doc/165x107/60da042c6c264c5d2f4a3bbf/a-matrix-expander-chernoff-bound-nikhilmchernoffpdf-ankit-garg-yin-tat-lee.jpg)