Calculation of molecular lipophilicity: State-of-the …ablab.ucsd.edu/pdf/09_logP_Tetko_NOT...
33
Calculation of Molecular Lipophilicity: State-of-the-Art and Comparison of Log P Methods on More Than 96,000 Compounds RAIMUND MANNHOLD, 1 GENNADIY I. PODA, 2 CLAUDE OSTERMANN, 3 IGOR V. TETKO 4,5 1 Molecular Drug Research Group, Heinrich-Heine-Universita ¨t, Universita ¨tsstraße 1, D-40225 Du ¨ sseldorf, Germany 2 Pfizer Global R & D, 700 Chesterfield Parkway West, Mail Zone BB2C, Chesterfield, Missouri 63017 3 Nycomed GmbH, Byk-Gulden-Str. 2, D-78467 Konstanz, Germany 4 Helmholtz Zentrum Mu ¨nchen—German Research Center for Environmental Health (GmbH), Institute of Bioinformatics and Systems Biology Ingolsta ¨dter Landstraße 1, Neuherberg D-85764, Germany 5 Institute of Bioorganic & Petrochemistry, Ukrainian National Academy of Sciences, UA-02660 Kyiv, Ukraine Received 12 June 2007; revised 2 June 2008; accepted 4 June 2008 Published online 6 August 2008 in Wiley InterScience (www.interscience.wiley.com). DOI 10.1002/jps.21494 ABSTRACT: We first review the state-of-the-art in development of log P prediction approaches falling in two major categories: substructure-based and property-based methods. Then, we compare the predictive power of representative methods for one public (N ¼ 266) and two in house datasets from Nycomed (N ¼ 882) and Pfizer (N ¼ 95809). A total of 30 and 18 methods were tested for public and industrial datasets, respectively. Accuracy of models declined with the number of nonhydrogen atoms. The Arithmetic Average Model (AAM), which predicts the same value (the arithmetic mean) for all compounds, was used as a baseline model for comparison. Methods with Root Mean Squared Error (RMSE) greater than RMSE produced by the AAM were considered as unacceptable. The majority of analyzed methods produced reasonable results for the public dataset but only seven methods were successful on the both in house datasets. We proposed a simple equation based on the number of carbon atoms, NC, and the number of hetero atoms, NHET: log P ¼ 1.46(0.02) þ 0.11(0.001) NC0.11(0.001) NHET. This equation outperformed a large number of programs benchmarked in this study. Factors influencing the accuracy of log P predictions were elucidated and discussed. ß 2008 Wiley- Liss, Inc. and the American Pharmacists Association J Pharm Sci 98:861–893, 2009 Keywords: lipophilicity; log P calculation; substructure-based approaches; fragmen- tal methods; atom-based methods; property-based approaches; methods based on 3D- structure representation; empirical approaches; quantum chemical semi-empirical calculations; continuum solvation models; molecular dynamics calculations; molecular lipophilicity potential; lattice energy calculations; topological descriptors; graph molecular connectivity; electrotopological-state (E-state) descriptors; consensus model INTRODUCTION Lipophilicity is an important parameter moni- tored by medicinal chemists in drug discovery on daily basis. Optimal lipophilicity range along with low molecular weight and low polar surface area is the major driving force that leads to good Correspondence to: Igor V. Tetko (Telephone: þ49-89-3187- 3575; Fax: þ49-89-3187-3585; E-mail: [email protected]) Journal of Pharmaceutical Sciences, Vol. 98, 861–893 (2009) ß 2008 Wiley-Liss, Inc. and the American Pharmacists Association JOURNAL OF PHARMACEUTICAL SCIENCES, VOL. 98, NO. 3, MARCH 2009 861
Transcript of Calculation of molecular lipophilicity: State-of-the …ablab.ucsd.edu/pdf/09_logP_Tetko_NOT...
Calculation of Molecular Lipophilicity: State-of-the-Artand Comparison of Log P Methods on More Than96,000 Compounds
RAIMUND MANNHOLD,1 GENNADIY I. PODA,2 CLAUDE OSTERMANN,3 IGOR V. TETKO4,5
1Molecular Drug Research Group, Heinrich-Heine-Universitat, Universitatsstraße 1, D-40225 Dusseldorf, Germany
2Pfizer Global R & D, 700 Chesterfield Parkway West, Mail Zone BB2C, Chesterfield, Missouri 63017
3Nycomed GmbH, Byk-Gulden-Str. 2, D-78467 Konstanz, Germany
4Helmholtz Zentrum Munchen—German Research Center for Environmental Health (GmbH),Institute of Bioinformatics and Systems Biology Ingolstadter Landstraße 1, Neuherberg D-85764, Germany
5Institute of Bioorganic & Petrochemistry, Ukrainian National Academy of Sciences, UA-02660 Kyiv, Ukraine
Received 12 June 2007; revised 2 June 2008; accepted 4 June 2008
Published online 6 August 2008 in Wiley InterScience (www.interscience.wiley.com). DOI 10.1002/jps.21494
Corresponde3575; Fax: þ49-
Journal of Pharm
� 2008 Wiley-Liss
ABSTRACT: We first review the state-of-the-art in development of log P predictionapproaches falling in two major categories: substructure-based and property-basedmethods. Then, we compare the predictive power of representative methods for onepublic (N¼ 266) and two in house datasets from Nycomed (N¼ 882) and Pfizer(N¼ 95809). A total of 30 and 18 methods were tested for public and industrial datasets,respectively. Accuracy of models declined with the number of nonhydrogen atoms. TheArithmetic Average Model (AAM), which predicts the same value (the arithmetic mean)for all compounds, was used as a baseline model for comparison. Methods with RootMean Squared Error (RMSE) greater than RMSE produced by the AAM were consideredas unacceptable. The majority of analyzed methods produced reasonable results for thepublic dataset but only seven methods were successful on the both in house datasets. Weproposed a simple equation based on the number of carbon atoms, NC, and the number ofhetero atoms, NHET: log P¼ 1.46(�0.02)þ 0.11(�0.001) NC�0.11(�0.001) NHET. Thisequation outperformed a large number of programs benchmarked in this study. Factorsinfluencing the accuracy of log P predictions were elucidated and discussed. � 2008 Wiley-
Liss, Inc. and the American Pharmacists Association J Pharm Sci 98:861–893, 2009
Keywords: lipophilicity; log P calculati
on; substructure-based approaches; fragmen-tal methods; atom-based methods; property-based approaches; methods based on 3D-structure representation; empirical approaches; quantum chemical semi-empiricalcalculations; continuum solvation models; molecular dynamics calculations; molecularlipophilicity potential; lattice energy calculations; topological descriptors; graphmolecular connectivity; electrotopological-state (E-state) descriptors; consensus modelnce to: Igor V. Tetko (Telephone: þ49-89-3187-89-3187-3585; E-mail: [email protected])
aceutical Sciences, Vol. 98, 861–893 (2009)
, Inc. and the American Pharmacists Association
JOURNAL OF
INTRODUCTION
Lipophilicity is an important parameter moni-tored by medicinal chemists in drug discovery ondaily basis. Optimal lipophilicity range along withlow molecular weight and low polar surface area isthe major driving force that leads to good
PHARMACEUTICAL SCIENCES, VOL. 98, NO. 3, MARCH 2009 861
862 MANNHOLD ET AL.
absorption of chemicals in the intestine by passivediffusion. Lipophilicity plays a main role ingoverning kinetic and dynamic aspects of drugaction.1–20
Hansch et al.2 described in detail the impactof lipophilicity on pharmacodynamic events.Furthermore, many reviews document the primeimportance of log P in predicting ADMET proper-ties.2,4–8,10,11,13–22
The common quantitative descriptor of lipophi-licity, the octanol–water partition coefficient P, isdefined as the ratio of the concentrations of aneutral compound in organic and aqueous phasesof a two-compartment system under equilibriumconditions. It is mostly used in its logarithmicform, log P. Experimental procedures to measurelog P are described in details in Ref. 23.
The extent of existing experimental log P data isnegligible compared to the enormous number ofcompounds for which such data are needed. Thus,methods deriving log P from molecular structureare highly desired. The first published method forcalculating log P from structure was based on a‘‘substitution’’ procedure and was developed withsubstituent p-constants for aromatic rings inmind.24 This method was limited to deriving anew log P from a ‘‘parent’’ structure whose log Pwas already known. Rekker and his colleagues25–
28 were the first to publish a novel and moregeneral procedure assigning fragmental constantsto structural moieties. Current methods for
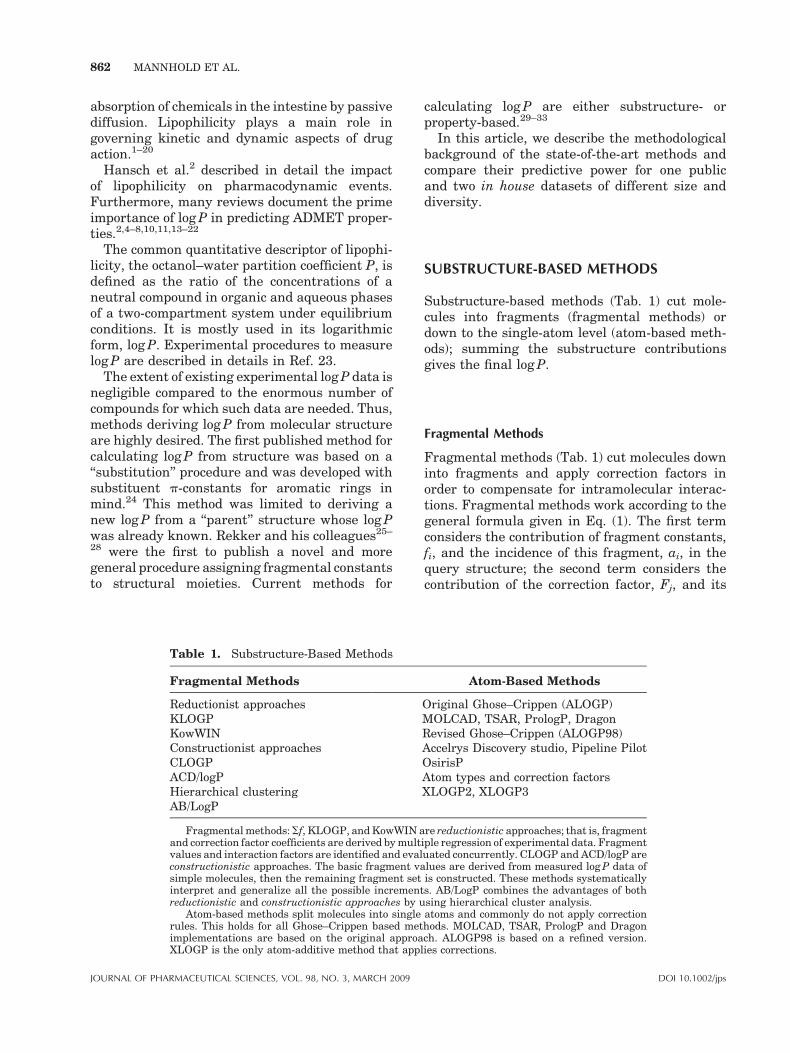
Table 1. Substructure-Based Methods
Fragmental Methods
Reductionist approachesKLOGPKowWINConstructionist approachesCLOGPACD/logPHierarchical clusteringAB/LogP
Fragmental methods:Sf, KLOGP, and KowWIN aand correction factor coefficients are derived by multvalues and interaction factors are identified and evalconstructionistic approaches. The basic fragment vasimple molecules, then the remaining fragment setinterpret and generalize all the possible incrementreductionistic and constructionistic approaches by u
Atom-based methods split molecules into singlerules. This holds for all Ghose–Crippen based metimplementations are based on the original approaXLOGP is the only atom-additive method that appl
JOURNAL OF PHARMACEUTICAL SCIENCES, VOL. 98, NO. 3, MARCH 2009
calculating log P are either substructure- orproperty-based.29–33
In this article, we describe the methodologicalbackground of the state-of-the-art methods andcompare their predictive power for one publicand two in house datasets of different size anddiversity.
SUBSTRUCTURE-BASED METHODS
Substructure-based methods (Tab. 1) cut mole-cules into fragments (fragmental methods) ordown to the single-atom level (atom-based meth-ods); summing the substructure contributionsgives the final log P.
Fragmental Methods
Fragmental methods (Tab. 1) cut molecules downinto fragments and apply correction factors inorder to compensate for intramolecular interac-tions. Fragmental methods work according to thegeneral formula given in Eq. (1). The first termconsiders the contribution of fragment constants,fi, and the incidence of this fragment, ai, in thequery structure; the second term considers thecontribution of the correction factor, Fj, and its
Atom-Based Methods
Original Ghose–Crippen (ALOGP)MOLCAD, TSAR, PrologP, DragonRevised Ghose–Crippen (ALOGP98)Accelrys Discovery studio, Pipeline PilotOsirisPAtom types and correction factorsXLOGP2, XLOGP3
re reductionistic approaches; that is, fragmentiple regression of experimental data. Fragmentuated concurrently. CLOGP and ACD/logP arelues are derived from measured log P data ofis constructed. These methods systematicallys. AB/LogP combines the advantages of bothsing hierarchical cluster analysis.atoms and commonly do not apply correctionhods. MOLCAD, TSAR, PrologP and Dragonch. ALOGP98 is based on a refined version.ies corrections.
DOI 10.1002/jps
CALCULATION OF MOLECULAR LIPOPHILICITY 863
frequency, bj:
log P ¼Xn
i¼1
aifi þXm
j¼1
bjFj (1)
Defining fragments larger than single atomsguarantees, that significant electronic interac-tions are comprised within one fragment; this is aprime advantage of using fragments. Arbitraryfragmentations and missing fragments that pre-vent calculation are the main disadvantages.
Sf-System
Rekker’s group developed the first fragmentalmethod.25–28 Experimental log P of simple organ-ics were used to derive fragmental values by Free–Wilson analyses. The development of the Sf-system comprised three main phases.
The first period resulted in a calculation systembased on 126 fragment values. Experimental log Pof simple organics were used to derive fragmentalvalues by Free–Wilson analyses. The first periodof development resulted in a Sf-system based on126 fragment values. Fragmentation leaves func-tional groups with direct resonance interactionintact. Fragments range from atoms over sub-stituents to complicated heterocycles; fragmentsare differentiated according to aliphatic oraromatic attachment. Systematic differencesbetween measured log P and log P calculationsbased on the mere summation of fragmentvalues were found. Attribution of these differ-ences to chemical characteristics of the moleculesallowed the definition of correction rules. Correc-tion values were shown to represent multiples of aconstant value of 0.289.
In the second phase, thorough revision of theoriginal system34 resulted in a better fit of log Pexp
for simple halo-alkanes and aliphatic hydrocar-bons with Sf-data, and a refinement of thecorrection factor to a value of 0.219. Complexmulti-halogenation in aliphatic hydrocarbons,resonance interaction as well as decoupling ofresonance were treated in a third phase.35 The Sf-system is the only fragment method allowingmanual log P calculation. Computerized versionslike SANALOGP_ER36 allow the calculation oflarger databases.
KLOGP
KLOGP37 was derived via regression analysisfrom a database with 1663 diverse organics.38–42 Aset of basic group parameters was defined, which
DOI 10.1002/jps JOU
consist of: (i) heavy atoms with both theirhybridization and the number of hydrogensattached to them, and (ii) fundamental functionalgroups. In some cases, the nearest heavy atomsare also specified. The initial model was estab-lished with the basic group contribution para-meters without considering interactions betweenthese groups. Log P calculations were satisfactoryfor simple compounds, whereas complex com-pounds showed high deviations due to unparame-trized interactions between substructures. TheCASE methodology43 was used to identify thesubstructures responsible for large calculationerrors. In addition to the basic group parameters,CASE correction factors for tautomerizationeffects, dipolar ion effects, proximity effects, andconjugated multi-hetero atomic effects were thenused for developing the final estimation model:
log P ¼ a þ SbiBi þ S cjCj (2)
where a, bi, and cj are regression coefficients, Bi isthe number of occurrences of the ith basic group,and Cj is the number of occurrences of thejth correction factor identified by CASE.
For the revised version of KLOGP,44 153 basicparameters were selected based on the diversity ofthe atoms and their environment inside themolecule. Via MultiCASE (an upgrade of CASE),41 substructures were identified and used ascorrection factors in the final log P model:
log P ¼ C0 þXn
i¼1
Cið1 � HiÞGi (3)
The steric index, Hi, represents the sterichindrance of the ith atom by other atoms in themolecule: functional groups next to large sub-stituents weakly contribute to the estimated log P.
In the structural analogue approach,45 log P ofunknown chemicals is calculated from the knownexperimental log P of their closest structuralanalogues. The contribution of the differingmolecular parts is estimated from a compilationof fragment contributions. This strategy promisesenhanced prediction accuracy. Several otherapproaches such as TLOGP,46 KowWIN,47 SLIP-PER,48,49 ALOGPS50 and XLOGP351 apply asimilar methodology to estimate the value ofquery compounds using the lipophilicity of theirnearest neighbors.
KowWIN
Meylan and Howard47,52,53 developed the atom/fragment contribution (AFC) method which is
RNAL OF PHARMACEUTICAL SCIENCES, VOL. 98, NO. 3, MARCH 2009
864 MANNHOLD ET AL.
known as KowWIN. 9500 out of 13062 databasecompounds are from the C log P-StarList.2 Thetraining set contains 2473 mostly simple com-pounds, whereas the validation set (N¼ 10589compounds) contains simple, moderate, and com-plex molecules. One hundred fifty atom/fragmentsare used. In general, each nonhydrogen atom in astructure is core for a fragment; the exactfragment is determined by the type of the atomsconnected to the core.
The AFC method uses 250 correction factors forsteric interactions, H-bondings, and effects frompolar substructures. Fragment and correctionfactor coefficient values were derived with twoseparate MLR analyses. The first regressioncorrelated atom/fragment values of compoundsthat are adequately estimated by fragments alone.The second regression correlated correction fac-tors using the difference between experimentallog P and the log P estimated by fragments alone.Regression analyses yield the following generalequation for estimating log P:
log P ¼ SðfiniÞ þ SðcjnjÞ þ 0:229 (4)
where fi is the fragment coefficient, ni thefrequency of the fragment in the structure, cj
the correction factor coefficient, and nj thefrequency of the factor in the structure; 0.229 isthe constant value generated by the multiplelinear regression.
KowWIN calculates log P based on an atom/fragment contribution method. Its extension, theExperimental Value Adjusted (EVA) approach,starts from the measured log P of a structuralanalogue of a query compound.47 The analogue ismodified by subtracting and adding fragmentsand factors to build the query compound. Theestimate is the sum of the experimental log P andthe value of the fragment/factor modifications.Such estimations are more accurate than usingthe original method.
CLOGP
For CLOGP2,54–58 basic fragmental values werederived from measured log P data of simplemolecules, then the remaining fragment set wasconstructed. Measured values for molecularhydrogen, methane and ethane served to derivefragment constants for carbon and hydrogen, freeof obscuring interactions. For more complexhydrocarbons, whose measured values were notthe sum of fragment values, the differences weredefined in terms of correction factors (Tab. 2).
JOURNAL OF PHARMACEUTICAL SCIENCES, VOL. 98, NO. 3, MARCH 2009
Fragmentation Rules. The isolating carbon (IC)atom is a main concept within fragmentation. AnIC is not doubly- or triply bonded to a hetero atom;it may be bonded to a hetero atom by a single or anaromatic bond. A fragment is an atom or a group ofatoms bounded by ICs; all except of hydrogens areconsidered polar. Polar fragments can interact invarious ways. Following types of polar fragmentsneed to be defined: (i) X¼ any halogen, and (ii)Y¼ all non-X fragments.
Structural Factors. CLOGP needs to know thenumber and types of certain bonds in the solutestructure. Bond effects within a fragment aregenerally reflected by the fragment value. Bondswhich need to be identified are: (i) chain bonds,that is, nonring bonds between ICs plus anyvalence bonds to fragments, (ii) ring bonds, that is,nonaromatic ring bonds between ICs plus anyvalence bonds to fragments, and (iii) branchbonds, that is, chain bonds emanating frombranched fragments and counted to the last ICpreceding any polar fragment.
Interaction Factors. Interaction factors consideraliphatic proximity, electronic effects through p-bonds as well as special ortho effects. Aliphaticproximity is separately treated for interactionsbetween halogens (X vs. X), between H-polargroups (Y vs. Y) or between halogens and H-polargroups (X vs. Y). Electronic effects through p-bonds consider fragment valence types, extensionof aromaticity as well as sigma/rho fragmentinteractions. And finally, special ortho-effectsreflect crowding of certain fragment types, whichcan effectively lower their aromatic-attachedvalues and intramolecular hydrogen bondingbetween ortho-substituted donors and acceptors.
CLOGP is the most frequently used log Pcalculation program. Recent versions includethe FRAGCALC algorithm58 for calculating frag-ment values from scratch. It is based on a test setof 600 dependably measured fragments havingonly aliphatic or aromatic bonds.
ACD/LogP
The ACD/logP algorithm59,60 is based on contribu-tions of separate atoms, structural fragments, andintramolecular interactions between differentfragments. These contributions have been derivedfrom an ACD/Labs internal database of over18400 structures with experimental log P values.
DOI 10.1002/jps
Table 2. Correction Factors in CLOGP
Structural Factors Interaction Factors
Bonds Aliphatic proximity, measured topologicallyChain bonds Halogen versus Halogen (X vs. X)Ring bonds H-Polar versus H-Polar (Y vs. Y)Branch bonds Halogen versus H-Polar (X vs. Y)
Branching at isolating carbons Electronic effects through p-bondsChain branch Fragment valence typeGroup branch Extension of aromaticity
Sigma/Rho fragment interactionSpecial ortho-effects
CrowdingIntramolecular hydrogen bonding
CALCULATION OF MOLECULAR LIPOPHILICITY 865
The log P increments are stored in the internaldatabases of log P contributions.
The database of ‘‘Fragmental Contributions’’contains increments for over 1200 differentfunctional groups. They differ by their chemicalstructure, attachment to the hydrocarbon skele-ton, cyclization, and aromaticity. Fragmentationrules differ in some respects from the definition inCLOGP. First, Csp2 attached to two aromatichetero atoms or to Csp are not ICs. This simplifiesthe analysis of intramolecular interactions. Sec-ond, hydrogen atoms are never detached from ICs.This eliminates the need for several structuralcorrection factors.
The database of ‘‘Carbon Atom Contributions’’contains increments for different types of carbonsthat are not involved in any functional group.They differ by their state of hybridization, numberof attached hydrogen atoms or branching, cycliza-tion, and aromaticity.
The database of ‘‘Intramolecular InteractionContributions’’ contains increments for over 2400different types of pair-wise group interactions.They differ by the type of the interacting terminalgroups and the length and type of the fragmentalsystem in-between the interacting groups. Intra-molecular Interaction Contributions comprise themain subgroups of aliphatic and aromatic inter-actions. Great care has been taken to generalizethese interactions and to reflect their bi-direc-tional character, in order to avoid too manyspecialized interaction rules.
If, during log P calculation, fragmental orintramolecular interaction contributions are notfound in the internal databases, they are calcu-lated by special ‘‘secondary’’ algorithms. In suchcases the calculated log P values are provided withlarger uncertainty limits (�� 0.6).
DOI 10.1002/jps JOU
ACD/logP calculations involve following steps:(i) structure fragmentation and assignment of fconstants; missing fragments are estimated byatomic increments similar to Ghose-Crippen; (ii)assignment of implemented Fij constants; missinginterfragmental interactions are calculated by apolylinear expression similar to the Hammett–Palm equation, and (iii) summation of theimplemented and estimated f- and Fij-constants.ACD/logP uses the following equation:
log P ¼ S fj þ ðSQjÞ þ S aliph � Fijk þ S vinyl
� Fijk þ S arom � Fijk (5)
where fi¼ fragmental increments, Qj¼ incre-increments of ‘‘superfragments’’ (very occasionaluse), Fijk¼ increments of interactions betweenany two (ith and jth) groups separated by k-number of aliphatic, vinylic or aromatic atoms.
AB/LogP
The general procedure of AB/LogP61 is illustratedin Figure 1 and includes following steps:
Step 1: ICs are defined as any carbons containingno double or triple bonds to hetero atoms. ICsisolate functional groups from each other accord-ing to the classical Hammett concept, so that thetreatment of complex structures is simple.
Step 2: What remains after identifying ICs repre-sents functional groups, which are differen-tiated according to branching, cyclization, andaromaticity. In addition, they depend on con-jugation with IC atoms. Increments of the miss-ing functional groups can be estimated viaspecial algorithms.
RNAL OF PHARMACEUTICAL SCIENCES, VOL. 98, NO. 3, MARCH 2009
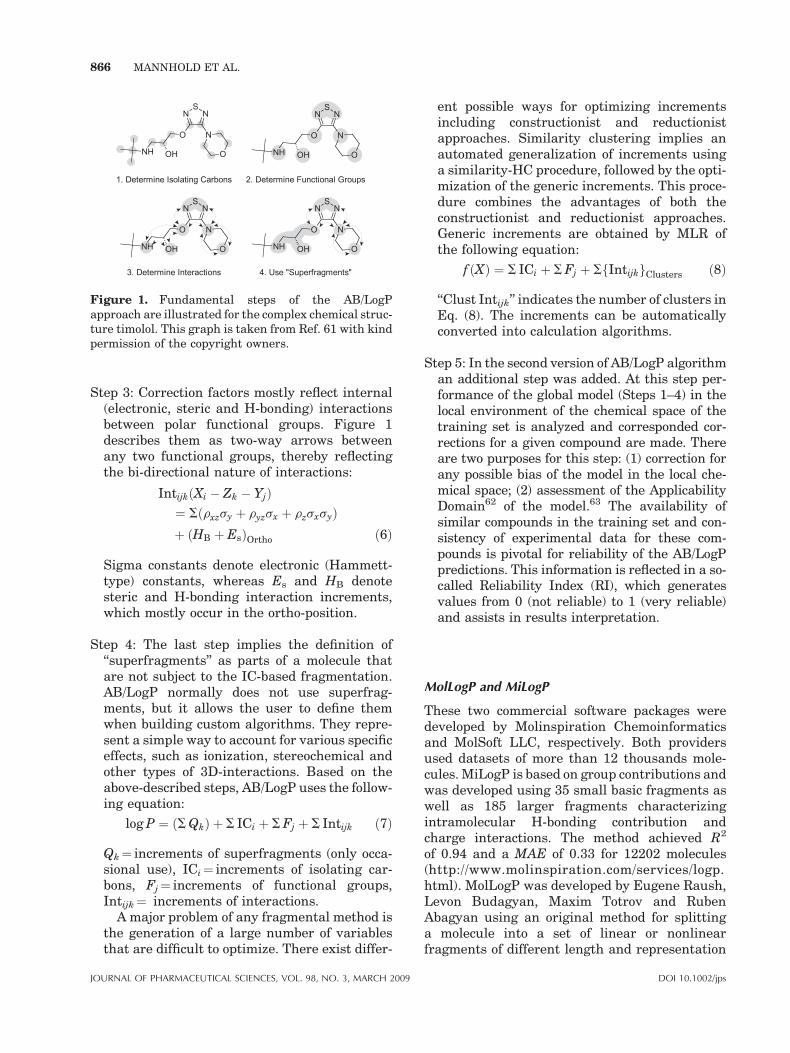
Figure 1. Fundamental steps of the AB/LogPapproach are illustrated for the complex chemical struc-ture timolol. This graph is taken from Ref. 61 with kindpermission of the copyright owners.
866 MANNHOLD ET AL.
Step 3: Correction factors mostly reflect internal(electronic, steric and H-bonding) interactionsbetween polar functional groups. Figure 1describes them as two-way arrows betweenany two functional groups, thereby reflectingthe bi-directional nature of interactions:
IntijkðXi � Zk � YjÞ¼ Sðrxzsy þ ryzsx þ rzsxsyÞþ ðHB þ EsÞOrtho ð6Þ
Sigma constants denote electronic (Hammett-type) constants, whereas Es and HB denotesteric and H-bonding interaction increments,which mostly occur in the ortho-position.
Step 4: The last step implies the definition of‘‘superfragments’’ as parts of a molecule thatare not subject to the IC-based fragmentation.AB/LogP normally does not use superfrag-ments, but it allows the user to define themwhen building custom algorithms. They repre-sent a simple way to account for various specificeffects, such as ionization, stereochemical andother types of 3D-interactions. Based on theabove-described steps, AB/LogP uses the follow-ing equation:
log P ¼ ðSQkÞ þ S ICi þ SFj þ S Intijk ð7Þ
Qk¼ increments of superfragments (only occa-sional use), ICi¼ increments of isolating car-bons, Fj¼ increments of functional groups,Intijk¼ increments of interactions.
A major problem of any fragmental method isthe generation of a large number of variablesthat are difficult to optimize. There exist differ-
JOURNAL OF PHARMACEUTICAL SCIENCES, VOL. 98, NO. 3, MARCH 2009
ent possible ways for optimizing incrementsincluding constructionist and reductionistapproaches. Similarity clustering implies anautomated generalization of increments usinga similarity-HC procedure, followed by the opti-mization of the generic increments. This proce-dure combines the advantages of both theconstructionist and reductionist approaches.Generic increments are obtained by MLR ofthe following equation:
f ðXÞ ¼ S ICi þ SFj þ SfIntijkgClusters ð8Þ
‘‘Clust Intijk’’ indicates the number of clusters inEq. (8). The increments can be automaticallyconverted into calculation algorithms.
Step 5: In the second version of AB/LogP algorithman additional step was added. At this step per-formance of the global model (Steps 1–4) in thelocal environment of the chemical space of thetraining set is analyzed and corresponded cor-rections for a given compound are made. Thereare two purposes for this step: (1) correction forany possible bias of the model in the local che-mical space; (2) assessment of the ApplicabilityDomain62 of the model.63 The availability ofsimilar compounds in the training set and con-sistency of experimental data for these com-pounds is pivotal for reliability of the AB/LogPpredictions. This information is reflected in a so-called Reliability Index (RI), which generatesvalues from 0 (not reliable) to 1 (very reliable)and assists in results interpretation.
MolLogP and MiLogP
These two commercial software packages weredeveloped by Molinspiration Chemoinformaticsand MolSoft LLC, respectively. Both providersused datasets of more than 12 thousands mole-cules. MiLogP is based on group contributions andwas developed using 35 small basic fragments aswell as 185 larger fragments characterizingintramolecular H-bonding contribution andcharge interactions. The method achieved R2
of 0.94 and a MAE of 0.33 for 12202 molecules(http://www.molinspiration.com/services/logp.html). MolLogP was developed by Eugene Raush,Levon Budagyan, Maxim Totrov and RubenAbagyan using an original method for splittinga molecule into a set of linear or nonlinearfragments of different length and representation
DOI 10.1002/jps
CALCULATION OF MOLECULAR LIPOPHILICITY 867
levels and Partial Least Squares (PLS) approach.The accuracy of the method was Q2¼ 0.95 andRMSE¼ 0.56 (http://www.molsoft.com/mprop-desc.html).
Atom-Based Methods
Atom-based methods,41,64–73 listed in Table 1, cutmolecules down to single atoms and commonly donot apply correction rules. According to Eq. (9)they work by summing the products of thecontribution of an atom type i times the frequencyof its presence in a query molecule:
log P ¼ Sniai (9)
ni¼number of atoms of type i; ai¼ contribution ofan atom of type i.
Since the partition coefficient is not a simpleadditive property, the constitutive feature iscovered by classifying huge numbers of atomtypes according to structural environment. Anadvantage of atom-based methods is that ambi-guities are avoided; a shortcoming is the failure todeal with long-range interactions.
Several atom-based approaches underlie com-mon software packages. Dragon ALOGP,74 MOL-CAD, TSAR, and PrologP are based on the originalGhose-Crippen approach.41,66–68 Discovery Studioand Pipeline Pilot by Accelrys use a refinedversion ALOGP98.73 XLOGP is the only atom-additive method applying corrections.71,72
Ghose–Crippen Approach
The group of Crippen41,66–68 has described thedevelopment of a purely atom-based procedure,which exclusively applies atomic contributionsand avoids correction factors:
log P ¼ SakNk (10)
Nk is the occurrence of the kth atom type.Carbon, hydrogen, oxygen, nitrogen, sulfur, and
halogens are classified into 110 atom types; afterseveral revisions, the number of atom classifica-tions has increased to 120 obtained from atraining set of 893 structures (R2¼ 0.86,SD¼ 0.50). Hydrogen and halogens are classifiedby the hybridization and oxidation state of thecarbon they are bonded to; carbons are classifiedby their hybridization state and the chemicalnature of their neighboring atoms. The corre-sponding software is MOLCAD (http://www.tripos.com) and TSAR (http://www.accelrys.com).
DOI 10.1002/jps JOU
Model building within PrologP was based onnearly 13 thousands experimental log P values.The software includes three calculation algo-rithms. Two are linear models: one is based onthe Rekker’s fragmental method, the other on theGhose–Crippen atomic method, while the thirdone is a feed-forward neural network model thatcan recognize nonlinear relationships betweenchemical structure and log P.70 A further option ofPrologP combines the optimum results obtainedby the different models. PrologP is a part of thePALLAS package (http://www.compudrug.com).
ALOGP9873 is a refinement of the originalGhose-Crippen approach aimed at consideringearlier criticisms, in particular the chemical senseof atomic contributions. The new version com-prises 68 atomic definitions obtained via SMARTSfrom Daylight. The chemical interpretation of theatomic definitions is improved by constrainingseveral carbon atom types to have positivecontributions to log P in the fitting process. Thetraining set was expanded to the 9000 structuresin the POMONA database: a standard deviation of0.67 is reported.
XLOGP2 and XLOGP3
The XLOGP algorithm is essentially an atom-additive model, which is supplemented by a smallnumber of correction factors:
log P ¼XM
i¼1
aiAi þXN
j¼1
cjCj (11)
Here ai and Ai are the contribution and theoccurrence of the ith atom type in a given molecule,respectively; while cj and Cj are the contributionand the occurrence of the jth correction factor,respectively. For example, XLOGP271,72 uses atotal of 90 atom types to classify atoms in neutralorganic compounds. Atom classifications are madeaccording to: (i) element, (ii) hybridization state,(iii) solvent accessibility, (iv) nature of the neigh-boring atoms, and (v) adjacency to p-systems.Thus, atoms belonging to the same atom typegenerally have similar solvent accessible surfacesand charge densities. This establishes the roughtheoretical basis that a certain type of atoms has aspecific contribution to log P. A total of 10 correc-tion factors are also implemented in XLOGP2 tocompensate for some intramolecular group-groupinteractions, such as hydrophobic carbons, internalH-bonds, halogen 1–3 pairs, a-amino acids andsome others.
RNAL OF PHARMACEUTICAL SCIENCES, VOL. 98, NO. 3, MARCH 2009
868 MANNHOLD ET AL.
Recently, a new version of this algorithm waspublished.51 XLOGP3 adopts an optimized classi-fication scheme of 87 atom/group types as well astwo correction factors accounting for internal H-bonds and amino acids. A major development ofXLOGP3, according to the authors, is that areference compound with known log P value isused as a starting point in computation in order toimprove accuracy. The difference in the log P valuesof the query compound and the reference compoundis then computed by the additive model. Thisapproach can be described conceptually as:
log P ¼ log P0 þXM
i¼1
aiðAi � A0i Þ
þXN
j¼1
cjðCj � C0j Þ (12)
where log P0 is the known log P value of thereference compound. The reference compound isselected according to its 2D-structural similarityto the query molecule by default from the trainingset of XLOGP3, that is, a pool of 8199 compoundswith reliable experimental log P values. Users canalso supply their own log P datasets to improve theaccuracy of prediction. In our comparative studywe used the default option only.
OsirisP
OSIRIS Property Explorer is an integral part ofActelion’s in house substance registration system.It allows to calculate on-the-fly various drug-relevant properties, such as log P, aqueous solu-bility, druglikeness, toxicity scores, etc. The inhouse log P calculation method, OsirisP, is imple-mented as increment system adding contributionsof every atom based on its atom type. Altogetherthe OsirisP predicting engine distinguishes 368atom types, which are composed of variousproperties of the atom itself (atomic nr and ringmembership) and its direct neighbors (bond type,aromaticity state and encoded atomic nr). Morethan 5000 compounds with experimentally deter-mined log P values were used as training set tooptimize the 369 contribution values associatedwith the atom types.
PROPERTY-BASED METHODS
Property-based approaches (Tab. 3) utilizedescriptions of the entire molecule and comprise:
JOURNAL OF PHARMACEUTICAL SCIENCES, VOL. 98, NO. 3, MARCH 2009
(i) empirical approaches and methods that use 3D-structure representation and (ii) methods basedon topological descriptors.
Empirical Approaches and Methods Based on 3D-Structure Representation
For two relatively immiscible solvents log Pcan be considered75 proportional to the molarGibbs free energy of transfer between octanol andwater
� 2:303RT log P ¼ DGoct � DGw ¼ DGow
¼ DGelow þ DGnel
ow (13)
where DGw and DGoct are the solvation freeenergies of the solute in water and octanol, andDGel
ow; DGnelow correspond to electrostatic and non-
polar terms (cavity formation and van der Waalsdispersion) of solute–solvent interactions.
Because theoretical prediction of the Gibbsenergy in Eq. (13) is difficult, one can considerphysical effects influencing the partition ofmolecules amid both phases and derive arestricted set of experimental parameters govern-ing this process. Such approaches are exemplifiedin Empirical Approaches Section by linear solva-tion energy relationships (LSER), SLIPPER, andSPARC. The measurements of experimentalvalues cannot be used to derive log P for largedatasets. However, one can expect that para-meters, which capture the physical effects impor-tant for the Gibbs energy such as molecular sizeand atomic charges should be able to providereliable models for prediction of this property.These assumptions are the main driving forces fora number of studies described in Methods Basedon Quantum Mechanical Semi-Empirical Calcu-lations Section. Continuum solvation modelssimplify the problem of Gibbs energy calculationsby considering the solution as continuous med-ium. These models were originated by Born in192076 and mainly cover DGel
ow, that is, the largestcomponent of the solvation free energy. Threecontinuum solvation models are reviewed inApproaches Based on Continuum Solvation Mod-els Section. A computationally demanding methodto calculate Gibbs free energy was published byDuffy and Jorgensen,77 who applied a moleculardynamics approach and used explicit watermolecules in their model. This model and itssimplification, QikProp, are considered in ModelsBased on Molecular Dynamics Calculations Sec-
DOI 10.1002/jps
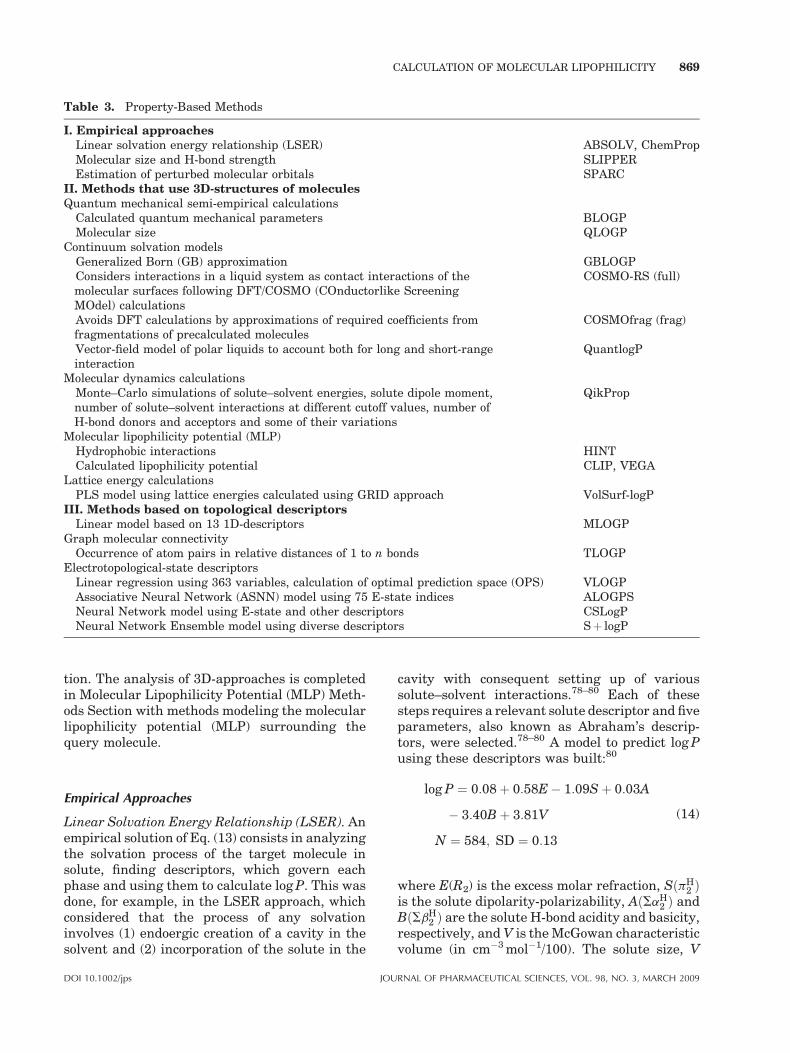
Table 3. Property-Based Methods
I. Empirical approachesLinear solvation energy relationship (LSER) ABSOLV, ChemPropMolecular size and H-bond strength SLIPPEREstimation of perturbed molecular orbitals SPARC
II. Methods that use 3D-structures of moleculesQuantum mechanical semi-empirical calculations
Calculated quantum mechanical parameters BLOGPMolecular size QLOGP
Continuum solvation modelsGeneralized Born (GB) approximation GBLOGPConsiders interactions in a liquid system as contact interactions of themolecular surfaces following DFT/COSMO (COnductorlike ScreeningMOdel) calculations
COSMO-RS (full)
Avoids DFT calculations by approximations of required coefficients fromfragmentations of precalculated molecules
COSMOfrag (frag)
Vector-field model of polar liquids to account both for long and short-rangeinteraction
QuantlogP
Molecular dynamics calculationsMonte–Carlo simulations of solute–solvent energies, solute dipole moment,number of solute–solvent interactions at different cutoff values, number ofH-bond donors and acceptors and some of their variations
QikProp
Molecular lipophilicity potential (MLP)Hydrophobic interactions HINTCalculated lipophilicity potential CLIP, VEGA
Lattice energy calculationsPLS model using lattice energies calculated using GRID approach VolSurf-logP
III. Methods based on topological descriptorsLinear model based on 13 1D-descriptors MLOGP
Graph molecular connectivityOccurrence of atom pairs in relative distances of 1 to n bonds TLOGP
Electrotopological-state descriptorsLinear regression using 363 variables, calculation of optimal prediction space (OPS) VLOGPAssociative Neural Network (ASNN) model using 75 E-state indices ALOGPSNeural Network model using E-state and other descriptors CSLogPNeural Network Ensemble model using diverse descriptors Sþ logP
CALCULATION OF MOLECULAR LIPOPHILICITY 869
tion. The analysis of 3D-approaches is completedin Molecular Lipophilicity Potential (MLP) Meth-ods Section with methods modeling the molecularlipophilicity potential (MLP) surrounding thequery molecule.
Empirical Approaches
Linear Solvation Energy Relationship (LSER). Anempirical solution of Eq. (13) consists in analyzingthe solvation process of the target molecule insolute, finding descriptors, which govern eachphase and using them to calculate log P. This wasdone, for example, in the LSER approach, whichconsidered that the process of any solvationinvolves (1) endoergic creation of a cavity in thesolvent and (2) incorporation of the solute in the
DOI 10.1002/jps JOU
cavity with consequent setting up of varioussolute–solvent interactions.78–80 Each of thesesteps requires a relevant solute descriptor and fiveparameters, also known as Abraham’s descrip-tors, were selected.78–80 A model to predict log Pusing these descriptors was built:80
log P ¼ 0:08 þ 0:58E � 1:09S þ 0:03A
� 3:40B þ 3:81V
N ¼ 584; SD ¼ 0:13
(14)
where E(R2) is the excess molar refraction, SðpH2 Þ
is the solute dipolarity-polarizability, AðSaH2 Þ and
BðSbH2 Þ are the solute H-bond acidity and basicity,
respectively, and V is the McGowan characteristicvolume (in cm�3 mol�1/100). The solute size, V
RNAL OF PHARMACEUTICAL SCIENCES, VOL. 98, NO. 3, MARCH 2009
870 MANNHOLD ET AL.
(molecule favors octanol) together with solute H-bond basicity, B (favors water) are the dominatingparameters of this equation. The use of B0ðSbO
2 Þresulted in Eq. (15) with higher accuracy of log Pprediction:81
log P ¼ 0:088 þ 0:562E � 1:054S þ 0:032A
� 3:460B0þ3:814V
N ¼ 613; SD ¼ 0:116
(15)
while V and E can be easily calculated frommolecular structure, S, A, B, and B0 are normallyobtained from experiments. This provided seriouslimitations on the applicability of the method topredict new series of compounds. A fragmental-based approach to calculate these parameters hasbeen developed.82 The calculated values of Abra-ham’s descriptors were used83 to develop a newequation
log P ¼ 0:315 þ 0:962E � 0:841S þ 0:241A
� 2:506B0þ2:647V
N ¼ 8844; RMSE ¼ 0:674
(16)
for prediction of compounds from the BioByteStarList.2 Despite a change in the regressioncoefficients, solute size and H-bond basicity wereagain most important to predict log P. Thismethod is available within the ABSOLV pro-gram84 which uses either the original Eq. (15)or a new equation developed with Abraham’sdescriptors and over 15000 compounds withexperimental log P values (P. Japertas, personalcommunication):
log P ¼ 0:395 þ 0:738E � 0:586S � 0:338A
� 2:972B þ 2:74V (17)
Another implementation82 is available in Chem-Prop, developed by the group of Schuurman.85
SLIPPER. The importance of molecular size andH-bond strength for octanol/water partitioning isused by the SLIPPER model,48,49 which calculateslipophilicity for 2850 simple compounds usingonly two terms, the polarizability, a, and the H-bond acceptor strength, SCa:
log P ¼ 0:267a� SCa
N ¼ 2850; SD ¼ 0:23(18)
Polarizability is highly interrelated with othersize-related parameters, such as molecularvolume, surface area and refractivity. Either ofthese terms could be used in Eq. (18) but the best
JOURNAL OF PHARMACEUTICAL SCIENCES, VOL. 98, NO. 3, MARCH 2009
results were obtained using polarizability. Thesecond term reflects intermolecular interactionsduring the solvation process and was calculatedvia Hydrogen Bond Thermodynamics (HYBOT).86
Thus, the terms in Eq. (17) and the two dominat-ing terms in Eqs. (13)–(16) describe the samephysical effects.
Log P prediction for multi-functional com-pounds via Eq. (18) runs into problems. Thedifficulties are associated with intramolecularinteractions, which could not be addressed byadditive schemes as used in the SLIPPER model.Therefore, the authors correct the log P predictionof a given molecule according to the lipophilicityvalues of the nearest neighbors by using cosinesimilarity measures and molecular frag-ments.48,49
Sparc Performs Automated Reasoning in Chem-istry (SPARC). SPARC87–89 uses LSER90 toestimate Perturbed Molecular Orbitals91 todescribe quantum effects such as charge distribu-tion and delocalization, and polarizability ofmolecules followed by QSAR studies to correlatestructure with molecular properties. SPARCdescribes Gibbs energy of a given process (e.g.,solvation in water) as a sum of
DG ¼ DGdispersion þ DGinduction
þ DGdipole-dipole þ DGH�bond þ DGother (19)
Depending on the nature of a given molecule, oneor several terms will be considered in thecalculation. SPARC does not calculate log Pdirectly, but uses the calculated activities atinfinite dilution of the molecular species in bothphases as
log P ¼ log g1o � log g1
w þ log Rm (20)
where g1 are the activities at infinite dilution ofthe compound of interest in each phase andRm¼�0.82 is the ratio of the molecularities of thetwo phases, that is, coefficients that convert themole fraction concentration to moles/L for waterand ‘‘wetted’’ octanol. To calculate individualterms SPARC breaks molecules into fragments.Calculation of molecular properties is performedusing a linear combination of the fragmentcontributions
x0j ðmoleculeÞ ¼ Siðx0
j � AiÞ (21)
where x0j are the intrinsic fragmental contribu-
tions (usually tabulated values) and Ai areadjustments related to steric perturbations of
DOI 10.1002/jps
CALCULATION OF MOLECULAR LIPOPHILICITY 871
the analyzed molecule caused by continuousstructural elements of the molecule. Both x0
j
and Ai are empirically trained either on theinvestigated or related properties. For octanol–water partitioning these properties include activ-ity coefficient, solubility, GC retention time,Henry’s constant and distribution coefficients.92
Methods Based on Quantum MechanicalSemi-Empirical Calculations
Correlation of Log P with Quantum MechanicalParameters. Semi-empirical quantum mechani-cal methods are used for fast calculation andoptimization of molecular structures (in vacuumor gas phase) since the second half of the lastcentury. In 1969, Rogers and Cammarata93
pioneered studies to empirically correlate log Pwith molecular properties contributing to theGibbs free energy. Quantum chemical calcula-tions (topology-based MINDO/3 and Huckel-type)were applied for log P prediction by Klopman andIroff.94 Afterwards, the BLOGP method, involving18 parameters, was developed using the AM1methodology.95,96 The calculated quantum che-mical parameters usually were limited to a sum(absolute or squared) of atomic charges of specificatoms, dipole moments and parameters reflectingmolecular shape. Despite a strong educationalimpact these approaches could not be used forlog P predictions of drug-like molecules. Indeed, inthose studies only a few hundreds of compoundsfrom structurally simple chemical classes wereused.
Two models of practical interest using quan-tum-chemical parameters were developed byClark and colleagues97,98 Both studies were basedon 1085 molecules and 36 descriptors calculatedwith the AM1 method following structure optimi-zation and electron density calculation. An initialset of descriptors was selected with a multiplelinear regression model and further optimized bytrial-and-error variation. The second studycalculated a SE of 0.56 for 1085 compounds andit also estimated the reliability of neural networkprediction by analysis of the standard deviationerror for an ensemble of 11 networks trained ondifferent randomly selected subsets of the initialtraining set.98
QLOGP: Importance of Molecular Size. Theimportance of molecular size for log P predictionwas demonstrated by Bodor and Buchwald.99
Molecular size determines the DGnelow term in Eq.
DOI 10.1002/jps JOU
(13), that is, the energy required to create a cavityfor the solute in the solvent. The calculation of themolecular volume, v, was performed followinggeometry optimization using molecular mech-anics or the semi-empirical AM1 method.100 Apreliminary analysis of molecules lacking strongpolar H-bonding atoms gave
log P ¼ �0:042ð�0:061Þ þ 0:033ð�0:0005ÞvN ¼ 142; R2 ¼ 0:96
(22)
with an intercept close to zero. The residuals forother molecules were surprisingly equal withindifferent classes of mono-substituted compounds.The final equation was
log P ¼ 0:032ð�0:0002Þv � 0:723ð�0:007Þn
þ 0:010ð�0:0007ÞvI
N ¼ 320; R2 ¼ 0:98; SD ¼ 0:214
(23)
where n is a positive integer, additively increasingby each functional group (see below); I is anindicator variable that is equal to 1 for saturatedunsubstituted hydrocarbons and 0 for othersatoms. QLOGP, developed using Eq. (23), recog-nizes 40 functional groups able to form H-bonds.The groups contribute values from 1 to 4,depending on their type and attachment. Forexample, the OH-group contributes 1 or 2depending on aromatic ring or alkyl chainattachment. A change in n by one unit is relatedto an average free energy change of �4.2 kJ/molfor an H-bond in water thus suggesting a relationto changes occurring in H-bonding during theoctanol–water transport. Indeed, although n isonly an integer, a very good correlation of thisdescriptor was found with the H-bond acceptorbasicity SbH
2 used in LSER Eq. (14) for compoundsfrom Kamlet’s original article:78
SbH2 ¼ 0:114 þ 0:118n
N ¼ 257; R2 ¼ 0:88; SD ¼ 0:07(24)
QLOGP was successfully applied to predict thelog P of proteins.101
Approaches Based on Continuum Solvation Models
GBLOGP. Totrov102 developed a model to esti-mate electrostatic solvation transfer energy DGel
ow
in Eq. (13) based on the Generalized Born (GB)approximation, which considers the electrostaticcontribution to the free energy of solvation as:
DGelow ¼ �0:5
1
"w� 1
"oct
� �Sqiqj
fGB(25)
RNAL OF PHARMACEUTICAL SCIENCES, VOL. 98, NO. 3, MARCH 2009
872 MANNHOLD ET AL.
where ew, eoct are dielectric constants, qi and qj arepartial charges and fGB is a function thatinterpolates between the so-called ‘‘effective Bornradius,’’ when the distance between atoms is smalland rij is large. Thus GB approximation reducesthe complex multicenter nature of solvationelectrostatics to the pairwise interactions of atomsand self-contribution terms but requires thecalculation of the Born radii, which themselvesdepend on the overall shape of the molecules.
The author assumed that the Born radii ofatoms can be estimated from the solvent exposurefactors for sampling spheres around the atoms.Two spheres were used in a 5-parameter equationto calculate the Born radii. The parameters of theequation were estimated using numerical calcula-tions from X-ray protein structures for dihydro-folate reductase. In addition to DGel
ow the authoralso considered the DGnel
ow term accounting forcavity formation and dispersion of the solute–solvent interactions as
DGnelow ¼ bow þ gowASA þ S dow
i (26)
where dowi are six atomic correction factors, ASA is
water accessible surface area, bow and gow areadjustable parameters. Totrov also noticed thatthe microscopic dielectric constant of octanol inEq. (25) can be different from its macroscopicvalues, and thus its value should be adjusted. Allnine parameters of Eq. (26) were estimated from81 molecules with an RMSE of 0.23. The predic-tion power was evaluated for 19 drugs(RMSE¼ 0.96, N¼ 19) originally used by Mor-iguchi et al.103
Continuum Solvation Model for Real Solvents(COSMO-RS) Full Approach. COSMO-RS con-siders interactions in a liquid system as contactinteractions of the molecular surfaces.104–106 Theanalysis starts with a DFT/COSMO (COnductor-like Screening MOdel)104 calculation to get thetotal energy ECOSMO and the polarization (orscreening) charge density (SCD) s on the surfaceof a molecule. Once calculated, COSMO files foreach molecule are stored for future use. Theinteraction of molecules is modeled as an ensem-ble of pairwise interacting molecular surfaces.The interaction energies, such as H-bonding andelectrostatic terms, are written as pairwiseinteractions of the respective polarization chargedensities:
Eesðs; s0Þ ¼ a2 ðs þ s0Þ2
Ehbðs; s0Þ ¼ chbminf0; ss0 þ s2hbg
(27)
JOURNAL OF PHARMACEUTICAL SCIENCES, VOL. 98, NO. 3, MARCH 2009
where constants a, chb and shb were adjusted to fita large amount of thermodynamic data and s,s0
refer to solute and solvent, respectively. Theensemble of interacting molecules is replaced bythe corresponding system of surface segments(both for solute and solvent) and the system issolved under the condition that the surfaces ofboth solute and solution interact with each other.The resulting function ms(s) describes the solventbehavior regarding electrostatics, H-bond affinity,and hydrophobicity and covers both enthalpy andentropy of the solvation. The integration of ms(s)over the surface of a compound X gives a chemicalpotential of X in solute S. This allows to derivemodels for different solvent–water partitionsystems or their mixtures. Calculation of suchproperties using the COSMOtherm programrequires only fractions of a second.
COSMOfrag (Fragment-Based) Approach. TheDFT/COSMO calculations are the speed-limitingpart of the method and can easily take a few hoursfor molecules with up to 40 heavy atoms on a 3GHz computer.107 The COSMOfrag method wasdeveloped to overcome speed limitations. Thebasic idea is to skip the resource-demandingquantum-chemical calculations and to compose s-profiles of a new molecule from stored s-profiles ofprecalculated molecules within a database of morethan 40000 compounds. A comparison of the fulland fragment-based versions was performedusing 2570 molecules from the PHYSPROP.108
An RMSE of 0.62 and 0.59 were calculated for thefull COSMO and COSMOfrag methods.107
Ab Initio Methods. Increasing computer powerenabled the use of extremely resource-demandingapproaches, such as ab initio methods for log Pprediction. Geometry optimization and calcula-tion of the electrostatic potential of 74 moleculesat the HF/6-31G level using GAUSSIAN 94 weredone already 10 years ago by Haeberlein andBrinck.109 They calculated about 100 theoreticaldescriptors reflecting bulk, cavity, dipolarity,polarizability and H-bonding potential andderived a three-parameter equation involvingsurface area, polarity and H-bonding terms withR2¼ 0.96, SD¼ 0.32, N¼ 74.
Recently, Chuman et al.110 directly estimatedelectrostatic solvation energy using ab initio MO-Self Consistent Reaction Field (SCRF) calcula-tions within the COSMO model.104 Moleculargeometry was optimized in each solvent phaseusing the Hartree–Fock (HF) calculation at the 3–
DOI 10.1002/jps
CALCULATION OF MOLECULAR LIPOPHILICITY 873
21G level. For molecules with multiple localenergy minima, conformational analysis wasperformed in each phase and the resultingconformation was used to evaluate the totalelectrostatic energy Esol in each solvent phaseusing the COSMO model and then DEow betweenn-octanol and water phases was calculated. A two-descriptor model was considered:
log P ¼ aDEow þ bASA þ c (28)
Its second term, the water accessible surface area,ASA, covered the effect of the solute size and thusthe entropic effect. The analysis was performedfor 155 small molecules (<30 atoms) subdivided ingroups of nonhydrogen bonders, hydrogen accep-tors, amphitropics and (dia)azine molecules. Theuse of Eq. (28) provided reasonably good correla-tion for each subset with the best results fornonhydrogen bonders (N¼ 69, SD¼ 0.16) and thelowest accuracy for amphitropic molecules(N¼ 50, SD¼ 0.50). The final equation includedtwo indicator variables:
log Psol=w ¼ �0:776DEoct þ 0:0266ASA
� 0:760IHAc þ 0:564Isol � 0:421
N ¼ 208; R2 ¼ 0:94; SD ¼ 0:28
(29)
IHAc was used to indicate non H-bonders and Isol
was used for predicting octanol or chloroform/-water systems. A similar accuracy of prediction(SD¼ 0.31) was achieved for 51 compounds thatwere not included in the model development. Thediscussion of possible reasons why this procedurefailed to elucidate log P values of a heterogeneousset of compounds included limitations of theCOSMO theory (particularly for donor molecules)and insufficient modeling of the entropy ofpartitioning. The author also concluded that themolecular orbital-related procedures published todate have been too optimistic in prediction of log Pvalues and require further elaboration.
QuantlogP. QuantlogP, developed by QuantumPharmaceuticals, uses another quantum-chemi-cal model to calculate the solvation energy. Like inCOSMO-RS, the authors do not explicitly considerwater molecules but use a continuum solvationmodel. However, while the COSMO-RS modelsimplifies solvation to interaction of molecularsurfaces, the new vector-field model of polarliquids accounts for short-range (H-bond forma-tion) and long-range dipole–dipole interactions oftarget and solute molecules.111 QuantlogP calcu-
DOI 10.1002/jps JOU
lated log P for over 900 molecules with an RMSEof 0.7 and R2 of 0.94.112
Models Based on Molecular Dynamics Calculations
Molecular dynamics (MD) simulations in explicitsolvents are still beyond the scope of the currentcomputational power for screening of a largenumber of molecules. However, mining powerfulquantum chemical parameters to predict log P viathis approach remains a challenging task. Qik-Prop,113 is based on a study77 which used Monte–Carlo simulations to calculate 11 parameters,including solute–solvent energies, solute dipolemoment, number of solute–solvent interactions atdifferent cutoff values, number of H-bond donorsand acceptors (HBDN, HBAC) and some of theirvariations. These parameters made it possible toestimate a number of free energies of solvation ofchemicals in hexadecane, octanol, water as well asoctanol/water distribution coefficients. The equa-tion calculated for the octanol/water coefficient is
log P ¼ 0:0145ASA � 0:731HBAC
� 1:064NAMIN þ 1:172NN � 1:772
N ¼ 200; RMSE ¼ 0:55; R2 ¼ 0:90
(30)
where NAMIN and NN are the number of aminesand nitro groups. The dominating term in Eq. (30)is ASA, which corresponds to similar results onthe impact of molecular size for log P predictionindicated in former studies. Surprisingly, funda-mental MD parameters like solute–solvent Cou-lomb and Lennard–Jones energies, were notsignificant and substituted with the simpleparameters NAMIN and NN.
QikProp does not perform MD simulations butcalculates required parameters from supplied 3Dstructures of molecules. For example, it computesatomic charges using the semi-empirical CM1pmethod, ASA is calculated using a 1.4 A proberadius.114 The recent parameters of QikProp wereoptimized using 500 drugs and related hetero-cyclic compounds and the model calculated an R2
of 0.93 and an RMSE of 0.49 for more than 400drug-like compounds.113
Molecular Lipophilicity Potential (MLP) Methods
The molecular forces underlying log P, in parti-cular H-bonds, are also important for binding ofsmall molecules to their biological targets. Effectsdue to solvation/desolvation of water molecules
RNAL OF PHARMACEUTICAL SCIENCES, VOL. 98, NO. 3, MARCH 2009
874 MANNHOLD ET AL.
are quite difficult to describe either with quantummechanical or MD calculations, since bothapproaches mainly cover electrostatic interac-tions. The MLP methods were proposed to over-come these limitations. They determine thedistribution of an empirically introduced lipophi-licity potential of molecules, which accumulatesall effects determining log P. The MLP can be usedto approximate the interactive forces governingnot only separation of molecules in the lipid phasebut also interactions between bioactive moleculesand receptors.
Considering the success of fragment methods,which apply additive models for log P prediction,one can assume that additive approaches may alsosatisfactory work for MLP. Indeed, similar to theGB model, one can consider fragments of mole-cules as centers of some potential functions anduse an empirically defined distance function f() tocalculate the MLP value by:
MLPðxÞ ¼ Sipif ðjxi � xjÞ (31)
where summation is done over all fragments i¼ 1,. . ., N in the molecule, pi are lipophilic constants ofthe fragment i, and jxi�xj is the distance from thefragment i to the point of interest.
The MLP potential defined by Eq. (31) wasintroduced in 1980s simultaneously by severalgroups.115–117 Dubost and colleagues117 used ahyperbolic distance function and calculated pi
using the fragmental system of Rekker and deKort.27 The same function was also applied byFuret et al.115 who used the fragmental system ofGhose and Crippen.66 The MLP approach intro-duced by Fauchere et al.116 used an exponentialdistance function. Two approaches for MLPcalculations are discussed below.
Hydrophobic Interactions (HINT). The HINTmethod118–120 refers to the idea of Abraham andLeo121 that hydrophobic fragment constants,reduced to atomic values, could be used toevaluate interactions between small and largemolecules. The interaction energy term bij scoresatom–atom interactions (i,j) within or betweenthe molecules using the following equation
bij ¼ aiSiajSjTijRij þ rij (32)
where Rij is an exponential function f(jxi�xj)from Eq. (31), ai are the hydrophobic atomconstants, Si is the accessible surface area(estimated using the H2O probe119), Tij¼ {�1,1}is a logic function describing the character ofinteracting pairs (attraction or repulsion) and rij
JOURNAL OF PHARMACEUTICAL SCIENCES, VOL. 98, NO. 3, MARCH 2009
describes a penalty term to flag van der Waalsviolations. The ai contributions are calculated byan adaptation of the CLOGP method,58,121 that is,by calculating the hydrophobic atom constantsfollowing summation of CLOGP group contribu-tions. Later on, the authors used Eq. (32) to derivea non-Newtonian HINT ‘‘natural’’ force-field120
that can be used to optimize molecular structuresand to analyze protein–protein and protein–ligand complexes. HINT has been successfullyused to calculate and view hydrophobic fields,estimate pKa values of protein residues, andcalculate free energy of binding between proteinsubunits and between substrates and enzy-mes.119,122
Calculated Lipophilicity Potential (CLIP). CLIP,developed by the group of Testa,123 is based on theatomic lipophilic system of Broto et al.64 and usesa modified exponential distance function of e�d/2,which differs from the e�d function of Fauchereet al.116 In addition the authors restricted thedistance function at 4 A to avoid influence of toodistant elements. The current version of CLIPuses a Fermi-like distance function, which doesnot require cutoff values.124 Another implementa-tion of the approach is available in the VEGAsoftware of Pedretti et al.125
Both HINT and CLIP allow to calculate whole-molecule log P values by integrating the MLP overthe surface, for example, by calculating SMLP,SMLPþ, SMPL� corresponding to a total sum ofall MLP values and its ‘‘lipophilic’’ (positive MLPvalues) and ‘‘hydrophilic’’ (negative) parts, respec-tively. Calculated in such a way log P values aresensitive to intramolecular factors, such asproximity between polar groups and, especially,molecular conformations and are known as‘‘virtual’’ log P values.123 The dependence of log Pon molecular conformations was directly con-firmed by recent experimental studies of Clenbu-terol rotamers. The NMR-based measurementsindicated a difference of 0.73 log units in the log Pvalues for different conformers.126
Log P Prediction Using Lattice Energies
One of the first studies to predict log P by usingpotential energy fields calculated using the GRIDand CoMFA approaches was done by Kim,127 whoinvestigated Hþ, CH3, and H2O probes andcalculated the best models using the ‘‘hydrophobicprobe’’ H2O for relatively small series (20 or lesscompounds each) of furans, carbamates, pyri-
DOI 10.1002/jps
CALCULATION OF MOLECULAR LIPOPHILICITY 875
dines, and pyrazines. In a similar study Waller128
predicted a small series of 24 polyhalogenatedcompounds. Recently, Caron and Ermondi129 useda new version of VolSurf,130 to predict octanol/water (R2¼ 0.77, q2¼ 0.72, SDEP¼ 0.60) andalkane/water log P (R2¼ 0.76, q2¼ 0.71, SDEP¼0.85) for 152 compounds.
Methods Based on Topological Descriptors
A large number of log P calculation methods arebased on topological descriptors. One of their mainadvantages is speed. Indeed, these algorithms canbe hundreds of thousand times faster than theresource-demanding algorithms based on ab initioor MD calculations. Speed renders these methodsan important tool for predicting large datasets, inparticular for screening virtual combinatoriallibraries.
MLOGP
Moriguchi et al.131 developed one of the first butyet successful method, MLOGP, which uses thesum of lipophilic (CX—summation of weightednumbers of carbon C and halogens atoms), andhydrophilic atoms (NO—total number of N and Oatoms) as two basic descriptors. These twodescriptors were able to explain 73% of thevariance in the experimental log P values for1230 compounds. The use of 11 correction factorscovered 91% of the variance. These factorsincluded PRX, proximity effect of N/O; UB,number of unsaturated bonds; POL, number ofpolar aromatic substituents; RNG, presence ofring structures; NO2, number of nitro groups; HB,presence of intramolecular hydrogen bonds; AMP,amphoteric property; ALK, dummy variable foralkane, alkene, cycloalkane or cycloalkene; QN,quaternary nitrogen; NCS, isothiocyano; BLM,dummy variable for the presence of b-lactam,resulting in the 13-parameter Eq. (33):
log P ¼ 1:244ðCXÞ0:6 � 1:017ðNOÞ0:9 þ 0:406PRX
� 0:145ðUBÞ0:8 þ 0:511HB þ 0:268POL
� 2:215AMP þ 0:912ALK � 0:392RNG
� 3:684QN þ 0:474NO2 þ 1:582NCS
þ 0:773BLM � 1:041
N ¼ 1230; R2 ¼ 0:91; SD ¼ 0:41
(33)
DOI 10.1002/jps JOU
Due to the simplicity of this equation, MLOGPwas widely used as a calculation and referenceapproach for many years. In our study we usedMLOGP implemented in ADMET PredictorTM132
and in Dragon by Todeschini and colleagues.74
Graph Molecular Connectivity
Molecular formulas are represented by their 2Dgraphs. Graph analysis allows to introducegraph–theoretical invariants that are well relatedto physico-chemical parameters with relevance forlipophilicity,133,134 such as their size, surface area,polarizability, and dipolarity. Niemi et al.135
divided molecules in 14 groups according to thenumber of H-bonds per atom and calculatedregression coefficients for each group usinggraph–theoretical descriptors. Within each groupthe authors used 50%/50% training/test setpartition to avoid chance correlation. The result-ing set of best-subset equations calculated anRMSE of 0.64 for more than 4000 compounds forthe joined training/test set. The results for thetraining/test set protocol, that is, when modelsdeveloped with training sets were used to predicttest set molecules, resulted in an RMSE of 0.85.The poorest prediction results were obtained forcomplex molecules.
TLOGP. Junghans and Pretsch46 used topologi-cal descriptors of uniform length136 representingn-dimensional vectors. The vectors showed theoccurrence of atom pairs in relative distances of 1to n bonds. The hetero atoms or atoms withspecified hybridization were painted to producecolored derivatives of the graph for which the pathcounting was repeated. In the three-dimensionalversion of this graph the corresponding normal-ized interatomic distances were summed up foreach path length. The 3D-geometries were gen-erated using CORINA.137 The authors built twoclasses of models: global and local. The globalmodel included all molecules and local modelswere calculated following clustering of moleculesfor each cluster. The authors noticed that thequality of prediction depended on similarity totraining set compounds. In case of low similaritythe accuracy of local models significantlydecreased and the authors performed predictionsusing the global model.
Methods Based on E-State Descriptors
The E-state indices138,139 were developed to coverboth topological and valence states of atoms.
RNAL OF PHARMACEUTICAL SCIENCES, VOL. 98, NO. 3, MARCH 2009
876 MANNHOLD ET AL.
These indices were successfully used to buildQSAR models for different physico-chemical andbiological properties.138 Several articles by differ-ent authors demonstrated the applicability ofthese indices for lipophilicity predictions.50,140–148
VLOGP. Gombar and Enslein141,142 used E-statedescriptors and other topological indices for abetter description of molecular symmetry andshape. The model was based on 8686 compoundsfrom the BioByte StarList.2 The final 363-variableequation was derived using 6675 compounds anda set of 2011 (25%) compounds which were outsideof the so-called Optimal Prediction Space (OPS)were set aside during the model development. Astandard error of 0.2 log unit and R2 of 0.98 werecalculated for compounds inside the OPS. Aftercreation of a model, the range-based cutoffs areused to determine whether the query molecule isinside or outside of the space of the training set ofmolecules. For a test set of 113 compounds thepredictive ability of the method for 29 compoundsoutside the OPS was about five times lowercompared to the molecules inside.141 Thus, theuse of the OPS allowed discrimination between‘‘bad’’ and ‘‘good’’ predictions. In our testing weused the recent version of this program providedby Accelrys Software, Inc.149
ALOGPS. A series of studies with increasingnumbers of molecules was done by Tetko andcolleagues.22,50,143–147 The first study144 wasperformed using a small set of 345 drug-likecompounds. Only 32 atom-type E-state descrip-tors were used to calculate linear and neuralnetwork models, which had very similar perfor-mance (q2¼ 0.83–0.84, RMSELOO¼ 0.69–0.71).The second study used 1754 molecules by includ-ing the set of Klopman and Zhu.37 The authorsextended the basic set of E-state indices to bettercover the surrounding of nitrogens and oxygens.In the next study145 an increased set of 12908molecules from the PHYSPROP database108
demanded the additional use of bond-type E-statedescriptors to build a predictive model. The neuralnetworks produced significantly better results(R2¼ 0.95, RMSE¼ 0.39) compared to the linearregression (R2¼ 0.89, RMSE¼ 0.61) using 75descriptors. The most recent version, ALOGPS2.1,50,146,147 was developed using the associativeneural network method150,151 (N¼ 12908,RMSE¼ 0.35). Similar to Niemi et al.135 theauthors noticed a decrease in performance of
JOURNAL OF PHARMACEUTICAL SCIENCES, VOL. 98, NO. 3, MARCH 2009
their and several other methods as a function ofthe number of nonhydrogen atoms in the mole-cules, that is, their size and complexity.145
Recently, the program was also used to predictlog P of platinum complexes.152
CSLogP. Two programs to predict lipophilicity ofmolecules were developed by Parham et al.140 Theauthors used an ensemble of 10 neural networksthat were applied to the initial training set of12942 organic compounds. The compounds used intheir study were taken from the PHYSPROP108
and from private sources. Their model wasdeveloped using 107 E-state indices that wereselected from the original set of 224 MolconnZindices using the Interactive Analysis software.The prediction accuracy of their model, R2¼ 0.96,MAE¼ 0.31, was calculated using a test set of1258 molecules. Later on the authors developed anew model, CSLogP, based on a set of 16893compounds compiled from the LOGKOW,153
CLOGP BioByte StarList2 and PHYSPROP.108
The authors selected a set of 519 topological andE-state descriptors. The final model calculated anR2 of 0.89 and a MAE of 0.43.
Methods Based on Diverse Descriptors
SþLogP
The model was built using a diverse array of 217uncorrelated 2D descriptors (including 19 consti-tutional, 61 functional group counts, 57 E-state,18 electronic, i.e., charge and polarizability, 14Meylan flags,47 12 Moriguchi descriptors,131 10hydrogen bonding and some other descriptors)generated by ADMET Predictor(TM) at Simula-tions Plus, Inc.132 The model is based on theartificial neural network ensembles (ANNE)constructed by Simulations Plus’ ADMET Mod-eler(TM) module from 12628 compounds selectedfrom the BioByte StarList2 of ion-correctedexperimental log P values. ANNE training andverifying involved a representative subset of 8770compounds, while the remaining 3858 compoundswere set aside as purely external test set forvalidation. The model performed with MAE¼ 0.26and R2¼ 0.96 on the training set, and withMAE¼ 0.26 and R2¼ 0.95 on the external testset (R. Fraczkiewicz, personal communication).
DOI 10.1002/jps
CALCULATION OF MOLECULAR LIPOPHILICITY 877
COMPARISON OF LOG P PREDICTIONMETHODS
The application of log P prediction software toolsfor rational drug design in pharmaceutical indus-try deserves a comprehensive validity check onlarge databases that cover a broad chemical spacefor drug-like as well as lead-like structures. Anumber of evaluations of calculated versusexperimental log P values have appeared in theliterature.154–161 Most of these studies suffer fromsmall size, limited chemical diversity, and/orinclusion of only a few log P prediction softwaretools. Here we present a validity check using apublic dataset of 266 molecules and two in housedatasets including 95809 and 882 compoundsfrom Pfizer and Nycomed, respectively.
Benchmarking of Methods Using a Public Dataset
Thirty calculation methods were compared on adataset selected from Table 4 of a monograph byAvdeef.162 This dataset contains both experimen-tal values from Avdeef and some data fromliterature. About 20 molecules in the originaldataset are zwitterions and predominantlyionized in water at any pH. For such compoundsonly distribution coefficients, log D, rather thanpartition coefficients, log P, can be measured.163
We excluded all these molecules from analysis.The final dataset comprised 266 molecules avail-able for download at http://www.vcclab.org/data-sets. It is worth noting that 223 of these testmolecules are also part of the BioByte StarList.2
StarList values were widely used to develop anumber of log P calculation methods. Moleculesoutside of the StarList may represent relativelynew chemical classes and could be well outside theapplicability domain for these methods. Thus,molecules from the StarList (N¼ 223), and theremaining Non-Star set (N¼ 43) were analyzedseparately. Since the prediction accuracies for theentire set and the StarList set were very similar,the results calculated for the former set were notincluded.
Several methods, for example, QLOGP,CLIP, VEGA, and HINT, required 3D-geometriesof molecules. For these methods 3D-structureswere generated using CORINA.137 3D-geometriesfor GBLOGP were energy minimized usingthe MMFF94 force field as implemented inICM.164
DOI 10.1002/jps JOU
Background Models
The molecules in the entire public dataset have amean log P of 2.32. This value could be used as anestimation of an a priori log P value of any datasetmolecule, that is, as a model that always predictsonly one value for any given structure. We use thisas the Arithmetic Average Model (AAM).165 Thismodel has an R2¼ 0 between predicted andexperimental values and as such has no predictionpower. Models with RMSE larger than that of theAAM are considered by us as nonpredictive orunacceptable (see, however, Efficiency of Bench-marking Section). Statistical differences in modelperformance compared to the AAM were esti-mated with a bootstrap test using 10000 repli-cas.165 A significance level of p< 0.05 was used.Methods exhibiting a worse RMSE than the AAMreceived rank III.
Because AB/LogP and ALOGPS calculated thesmallest RMSE for both the Star and the Non-Starset, they served as reference for further rankingthe included methods, using the same bootstrapset. Methods that produced results statisticallyidentical or very similar to the reference methodswere top-ranked, that is, they received rank I. Allmethods with rank I showed a similar ‘‘best’’performance. The remaining models receivedrank II.
Additionally, Consensus log P was calculated asthe simple average of predicted log P values fromall methods, which exhibit rank I or II. The RMSEof the models as well as their ranks aresummarized in Table 5.
Finally, we classified the prediction accuracy asfollows: differences between measured and calcu-lated log P (Dlog P) in the range of 0.00 to �0.50were considered as ‘‘acceptable,’’ Dlog P valuesbetween �0.50 to �1.00 were viewed as ‘‘dis-putable’’ and differences exceeding �1.00 as‘‘unacceptable.’’ The percentages of moleculespredicted within these limits are given in Table 5.
Benchmarking Results
Models are ranked in Table 5 according to theirpredictive performance for both datasets. Predic-tion results for the Star set were statisticallyalmost identical for the top-ranked methods AB/LogP, SþlogP, and ACD/logP. Two of them, AB/LogP and ACD/logP, are fragment-based, whereasthe third method, SþlogP, is based on diverse setof descriptors.
For the Non-Star set, as many as 18 methodsnonsignificantly differed in their performance
RNAL OF PHARMACEUTICAL SCIENCES, VOL. 98, NO. 3, MARCH 2009
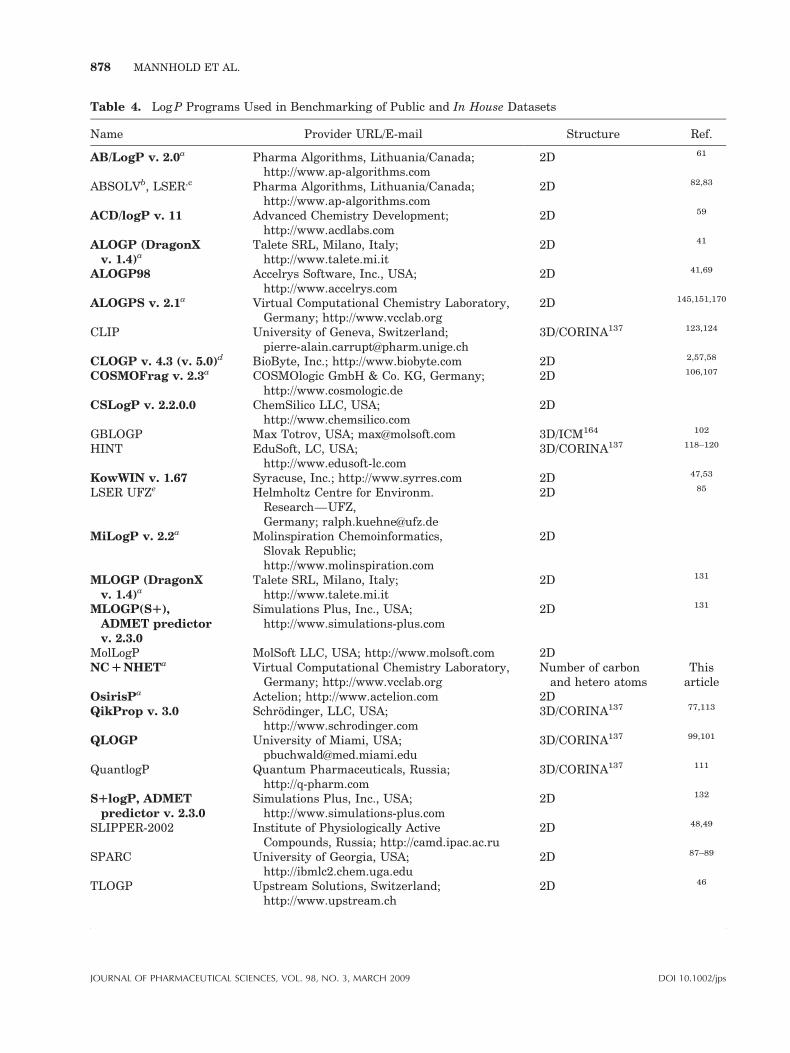
Table 4. Log P Programs Used in Benchmarking of Public and In House Datasets
Name Provider URL/E-mail Structure Ref.
AB/LogP v. 2.0a Pharma Algorithms, Lithuania/Canada;http://www.ap-algorithms.com
2D 61
ABSOLVb, LSER,c Pharma Algorithms, Lithuania/Canada;http://www.ap-algorithms.com
2D 82,83
ACD/logP v. 11 Advanced Chemistry Development;http://www.acdlabs.com
2D 59
ALOGP (DragonXv. 1.4)a
Talete SRL, Milano, Italy;http://www.talete.mi.it
2D 41
ALOGP98 Accelrys Software, Inc., USA;http://www.accelrys.com
2D 41,69
ALOGPS v. 2.1a Virtual Computational Chemistry Laboratory,Germany; http://www.vcclab.org
2D 145,151,170
CLIP University of Geneva, Switzerland;[email protected]
3D/CORINA137 123,124
CLOGP v. 4.3 (v. 5.0)d BioByte, Inc.; http://www.biobyte.com 2D 2,57,58
COSMOFrag v. 2.3a COSMOlogic GmbH & Co. KG, Germany;http://www.cosmologic.de
2D 106,107
CSLogP v. 2.2.0.0 ChemSilico LLC, USA;http://www.chemsilico.com
2D
GBLOGP Max Totrov, USA; [email protected] 3D/ICM164 102
HINT EduSoft, LC, USA;http://www.edusoft-lc.com
3D/CORINA137 118–120
KowWIN v. 1.67 Syracuse, Inc.; http://www.syrres.com 2D 47,53
LSER UFZe Helmholtz Centre for Environm.Research—UFZ,Germany; [email protected]
2D 85
MiLogP v. 2.2a Molinspiration Chemoinformatics,Slovak Republic;http://www.molinspiration.com
2D
MLOGP (DragonXv. 1.4)a
Talete SRL, Milano, Italy;http://www.talete.mi.it
2D 131
MLOGP(SR),ADMET predictorv. 2.3.0
Simulations Plus, Inc., USA;http://www.simulations-plus.com
2D 131
MolLogP MolSoft LLC, USA; http://www.molsoft.com 2DNC R NHETa Virtual Computational Chemistry Laboratory,
Germany; http://www.vcclab.orgNumber of carbon
and hetero atomsThis
articleOsirisPa Actelion; http://www.actelion.com 2DQikProp v. 3.0 Schrodinger, LLC, USA;
http://www.schrodinger.com3D/CORINA137 77,113
QLOGP University of Miami, USA;[email protected]
3D/CORINA137 99,101
QuantlogP Quantum Pharmaceuticals, Russia;http://q-pharm.com
3D/CORINA137 111
SRlogP, ADMETpredictor v. 2.3.0
Simulations Plus, Inc., USA;http://www.simulations-plus.com
2D 132
SLIPPER-2002 Institute of Physiologically ActiveCompounds, Russia; http://camd.ipac.ac.ru
2D 48,49
SPARC University of Georgia, USA;http://ibmlc2.chem.uga.edu
2D 87–89
TLOGP Upstream Solutions, Switzerland;http://www.upstream.ch
2D 46
JOURNAL OF PHARMACEUTICAL SCIENCES, VOL. 98, NO. 3, MARCH 2009 DOI 10.1002/jps
878 MANNHOLD ET AL.
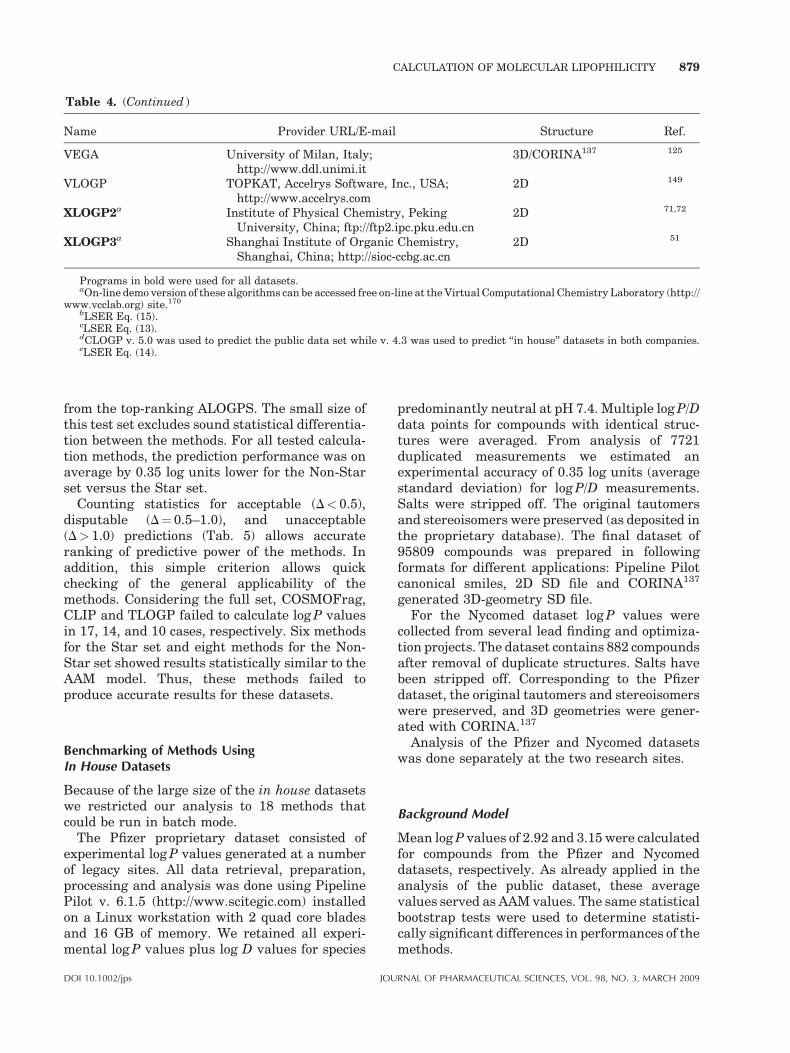
Table 4. (Continued )
Name Provider URL/E-mail Structure Ref.
VEGA University of Milan, Italy;http://www.ddl.unimi.it
3D/CORINA137 125
VLOGP TOPKAT, Accelrys Software, Inc., USA;http://www.accelrys.com
2D 149
XLOGP2a Institute of Physical Chemistry, PekingUniversity, China; ftp://ftp2.ipc.pku.edu.cn
2D 71,72
XLOGP3a Shanghai Institute of Organic Chemistry,Shanghai, China; http://sioc-ccbg.ac.cn
2D 51
Programs in bold were used for all datasets.aOn-line demo version of these algorithms can be accessed free on-line at the Virtual Computational Chemistry Laboratory (http://
www.vcclab.org) site.170
bLSER Eq. (15).cLSER Eq. (13).dCLOGP v. 5.0 was used to predict the public data set while v. 4.3 was used to predict ‘‘in house’’ datasets in both companies.eLSER Eq. (14).
CALCULATION OF MOLECULAR LIPOPHILICITY 879
from the top-ranking ALOGPS. The small size ofthis test set excludes sound statistical differentia-tion between the methods. For all tested calcula-tion methods, the prediction performance was onaverage by 0.35 log units lower for the Non-Starset versus the Star set.
Counting statistics for acceptable (D< 0.5),disputable (D¼ 0.5–1.0), and unacceptable(D> 1.0) predictions (Tab. 5) allows accurateranking of predictive power of the methods. Inaddition, this simple criterion allows quickchecking of the general applicability of themethods. Considering the full set, COSMOFrag,CLIP and TLOGP failed to calculate log P valuesin 17, 14, and 10 cases, respectively. Six methodsfor the Star set and eight methods for the Non-Star set showed results statistically similar to theAAM model. Thus, these methods failed toproduce accurate results for these datasets.
Benchmarking of Methods UsingIn House Datasets
Because of the large size of the in house datasetswe restricted our analysis to 18 methods thatcould be run in batch mode.
The Pfizer proprietary dataset consisted ofexperimental log P values generated at a numberof legacy sites. All data retrieval, preparation,processing and analysis was done using PipelinePilot v. 6.1.5 (http://www.scitegic.com) installedon a Linux workstation with 2 quad core bladesand 16 GB of memory. We retained all experi-mental log P values plus log D values for species
DOI 10.1002/jps JOU
predominantly neutral at pH 7.4. Multiple log P/Ddata points for compounds with identical struc-tures were averaged. From analysis of 7721duplicated measurements we estimated anexperimental accuracy of 0.35 log units (averagestandard deviation) for log P/D measurements.Salts were stripped off. The original tautomersand stereoisomers were preserved (as deposited inthe proprietary database). The final dataset of95809 compounds was prepared in followingformats for different applications: Pipeline Pilotcanonical smiles, 2D SD file and CORINA137
generated 3D-geometry SD file.For the Nycomed dataset log P values were
collected from several lead finding and optimiza-tion projects. The dataset contains 882 compoundsafter removal of duplicate structures. Salts havebeen stripped off. Corresponding to the Pfizerdataset, the original tautomers and stereoisomerswere preserved, and 3D geometries were gener-ated with CORINA.137
Analysis of the Pfizer and Nycomed datasetswas done separately at the two research sites.
Background Model
Mean log P values of 2.92 and 3.15 were calculatedfor compounds from the Pfizer and Nycomeddatasets, respectively. As already applied in theanalysis of the public dataset, these averagevalues served as AAM values. The same statisticalbootstrap tests were used to determine statisti-cally significant differences in performances of themethods.
RNAL OF PHARMACEUTICAL SCIENCES, VOL. 98, NO. 3, MARCH 2009
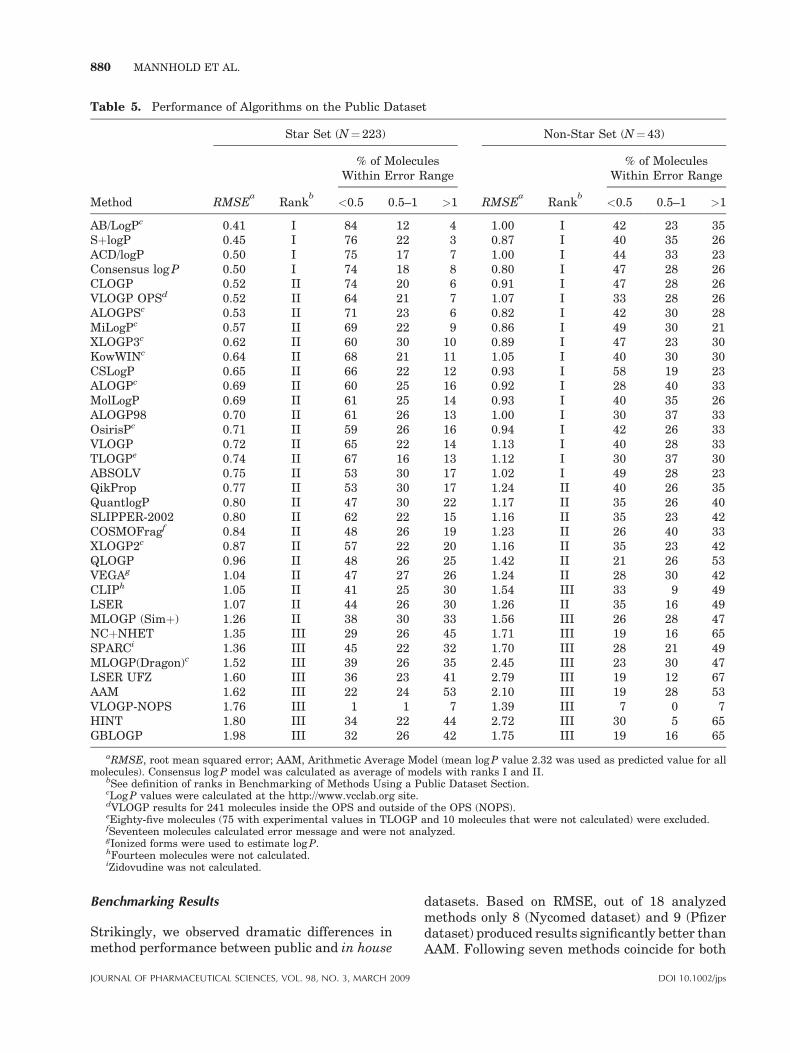
Table 5. Performance of Algorithms on the Public Dataset
Method
Star Set (N¼ 223) Non-Star Set (N¼ 43)
RMSEa
Rankb
% of MoleculesWithin Error Range
RMSEa
Rankb
% of MoleculesWithin Error Range
<0.5 0.5–1 >1 <0.5 0.5–1 >1
AB/LogPc 0.41 I 84 12 4 1.00 I 42 23 35SþlogP 0.45 I 76 22 3 0.87 I 40 35 26ACD/logP 0.50 I 75 17 7 1.00 I 44 33 23Consensus log P 0.50 I 74 18 8 0.80 I 47 28 26CLOGP 0.52 II 74 20 6 0.91 I 47 28 26VLOGP OPSd 0.52 II 64 21 7 1.07 I 33 28 26ALOGPSc 0.53 II 71 23 6 0.82 I 42 30 28MiLogPc 0.57 II 69 22 9 0.86 I 49 30 21XLOGP3c 0.62 II 60 30 10 0.89 I 47 23 30KowWINc 0.64 II 68 21 11 1.05 I 40 30 30CSLogP 0.65 II 66 22 12 0.93 I 58 19 23ALOGPc 0.69 II 60 25 16 0.92 I 28 40 33MolLogP 0.69 II 61 25 14 0.93 I 40 35 26ALOGP98 0.70 II 61 26 13 1.00 I 30 37 33OsirisPc 0.71 II 59 26 16 0.94 I 42 26 33VLOGP 0.72 II 65 22 14 1.13 I 40 28 33TLOGPe 0.74 II 67 16 13 1.12 I 30 37 30ABSOLV 0.75 II 53 30 17 1.02 I 49 28 23QikProp 0.77 II 53 30 17 1.24 II 40 26 35QuantlogP 0.80 II 47 30 22 1.17 II 35 26 40SLIPPER-2002 0.80 II 62 22 15 1.16 II 35 23 42COSMOFragf 0.84 II 48 26 19 1.23 II 26 40 33XLOGP2c 0.87 II 57 22 20 1.16 II 35 23 42QLOGP 0.96 II 48 26 25 1.42 II 21 26 53VEGAg 1.04 II 47 27 26 1.24 II 28 30 42CLIPh 1.05 II 41 25 30 1.54 III 33 9 49LSER 1.07 II 44 26 30 1.26 II 35 16 49MLOGP (Simþ) 1.26 II 38 30 33 1.56 III 26 28 47NCþNHET 1.35 III 29 26 45 1.71 III 19 16 65SPARCi 1.36 III 45 22 32 1.70 III 28 21 49MLOGP(Dragon)c 1.52 III 39 26 35 2.45 III 23 30 47LSER UFZ 1.60 III 36 23 41 2.79 III 19 12 67AAM 1.62 III 22 24 53 2.10 III 19 28 53VLOGP-NOPS 1.76 III 1 1 7 1.39 III 7 0 7HINT 1.80 III 34 22 44 2.72 III 30 5 65GBLOGP 1.98 III 32 26 42 1.75 III 19 16 65
aRMSE, root mean squared error; AAM, Arithmetic Average Model (mean log P value 2.32 was used as predicted value for allmolecules). Consensus log P model was calculated as average of models with ranks I and II.
bSee definition of ranks in Benchmarking of Methods Using a Public Dataset Section.cLog P values were calculated at the http://www.vcclab.org site.dVLOGP results for 241 molecules inside the OPS and outside of the OPS (NOPS).eEighty-five molecules (75 with experimental values in TLOGP and 10 molecules that were not calculated) were excluded.fSeventeen molecules calculated error message and were not analyzed.gIonized forms were used to estimate log P.hFourteen molecules were not calculated.iZidovudine was not calculated.
880 MANNHOLD ET AL.
Benchmarking Results
Strikingly, we observed dramatic differences inmethod performance between public and in house
JOURNAL OF PHARMACEUTICAL SCIENCES, VOL. 98, NO. 3, MARCH 2009
datasets. Based on RMSE, out of 18 analyzedmethods only 8 (Nycomed dataset) and 9 (Pfizerdataset) produced results significantly better thanAAM. Following seven methods coincide for both
DOI 10.1002/jps
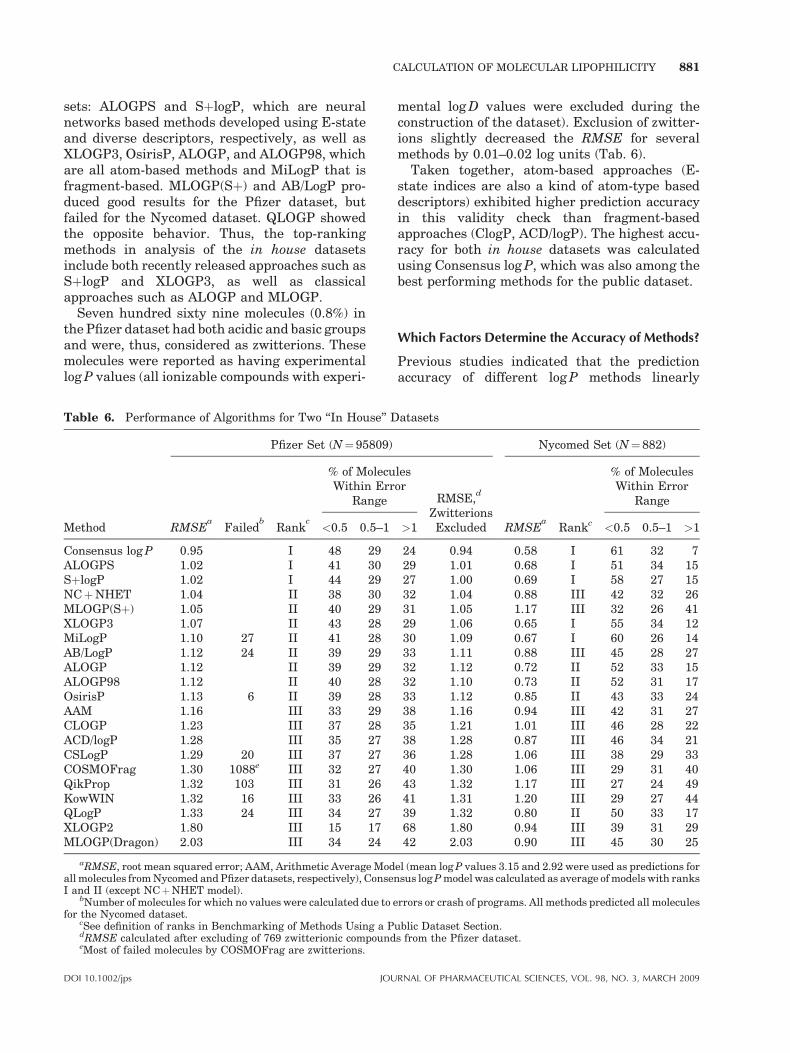
CALCULATION OF MOLECULAR LIPOPHILICITY 881
sets: ALOGPS and SþlogP, which are neuralnetworks based methods developed using E-stateand diverse descriptors, respectively, as well asXLOGP3, OsirisP, ALOGP, and ALOGP98, whichare all atom-based methods and MiLogP that isfragment-based. MLOGP(Sþ) and AB/LogP pro-duced good results for the Pfizer dataset, butfailed for the Nycomed dataset. QLOGP showedthe opposite behavior. Thus, the top-rankingmethods in analysis of the in house datasetsinclude both recently released approaches such asSþlogP and XLOGP3, as well as classicalapproaches such as ALOGP and MLOGP.
Seven hundred sixty nine molecules (0.8%) inthe Pfizer dataset had both acidic and basic groupsand were, thus, considered as zwitterions. Thesemolecules were reported as having experimentallog P values (all ionizable compounds with experi-
Table 6. Performance of Algorithms for Two ‘‘In House’’ D
Method
Pfizer Set (N¼ 95809)
RMSEa
Failedb
Rankc
% of MolecuWithin Err
Range
<0.5 0.5–1
Consensus log P 0.95 I 48 29ALOGPS 1.02 I 41 30SþlogP 1.02 I 44 29NCþNHET 1.04 II 38 30MLOGP(Sþ) 1.05 II 40 29XLOGP3 1.07 II 43 28MiLogP 1.10 27 II 41 28AB/LogP 1.12 24 II 39 29ALOGP 1.12 II 39 29ALOGP98 1.12 II 40 28OsirisP 1.13 6 II 39 28AAM 1.16 III 33 29CLOGP 1.23 III 37 28ACD/logP 1.28 III 35 27CSLogP 1.29 20 III 37 27COSMOFrag 1.30 1088e III 32 27QikProp 1.32 103 III 31 26KowWIN 1.32 16 III 33 26QLogP 1.33 24 III 34 27XLOGP2 1.80 III 15 17MLOGP(Dragon) 2.03 III 34 24
aRMSE, root mean squared error; AAM, Arithmetic Average Modall molecules from Nycomed and Pfizer datasets, respectively), ConsenI and II (except NCþNHET model).
bNumber of molecules for which no values were calculated due to efor the Nycomed dataset.
cSee definition of ranks in Benchmarking of Methods Using a PdRMSE calculated after excluding of 769 zwitterionic compoundeMost of failed molecules by COSMOFrag are zwitterions.
DOI 10.1002/jps JOU
mental log D values were excluded during theconstruction of the dataset). Exclusion of zwitter-ions slightly decreased the RMSE for severalmethods by 0.01–0.02 log units (Tab. 6).
Taken together, atom-based approaches (E-state indices are also a kind of atom-type baseddescriptors) exhibited higher prediction accuracyin this validity check than fragment-basedapproaches (ClogP, ACD/logP). The highest accu-racy for both in house datasets was calculatedusing Consensus log P, which was also among thebest performing methods for the public dataset.
Which Factors Determine the Accuracy of Methods?
Previous studies indicated that the predictionaccuracy of different log P methods linearly
atasets
Nycomed Set (N¼ 882)
lesor
RMSE,d
ZwitterionsExcluded RMSE
aRankc
% of MoleculesWithin Error
Range
>1 <0.5 0.5–1 >1
24 0.94 0.58 I 61 32 729 1.01 0.68 I 51 34 1527 1.00 0.69 I 58 27 1532 1.04 0.88 III 42 32 2631 1.05 1.17 III 32 26 4129 1.06 0.65 I 55 34 1230 1.09 0.67 I 60 26 1433 1.11 0.88 III 45 28 2732 1.12 0.72 II 52 33 1532 1.10 0.73 II 52 31 1733 1.12 0.85 II 43 33 2438 1.16 0.94 III 42 31 2735 1.21 1.01 III 46 28 2238 1.28 0.87 III 46 34 2136 1.28 1.06 III 38 29 3340 1.30 1.06 III 29 31 4043 1.32 1.17 III 27 24 4941 1.31 1.20 III 29 27 4439 1.32 0.80 II 50 33 1768 1.80 0.94 III 39 31 2942 2.03 0.90 III 45 30 25
el (mean log P values 3.15 and 2.92 were used as predictions forsus log P model was calculated as average of models with ranks
rrors or crash of programs. All methods predicted all molecules
ublic Dataset Section.s from the Pfizer dataset.
RNAL OF PHARMACEUTICAL SCIENCES, VOL. 98, NO. 3, MARCH 2009
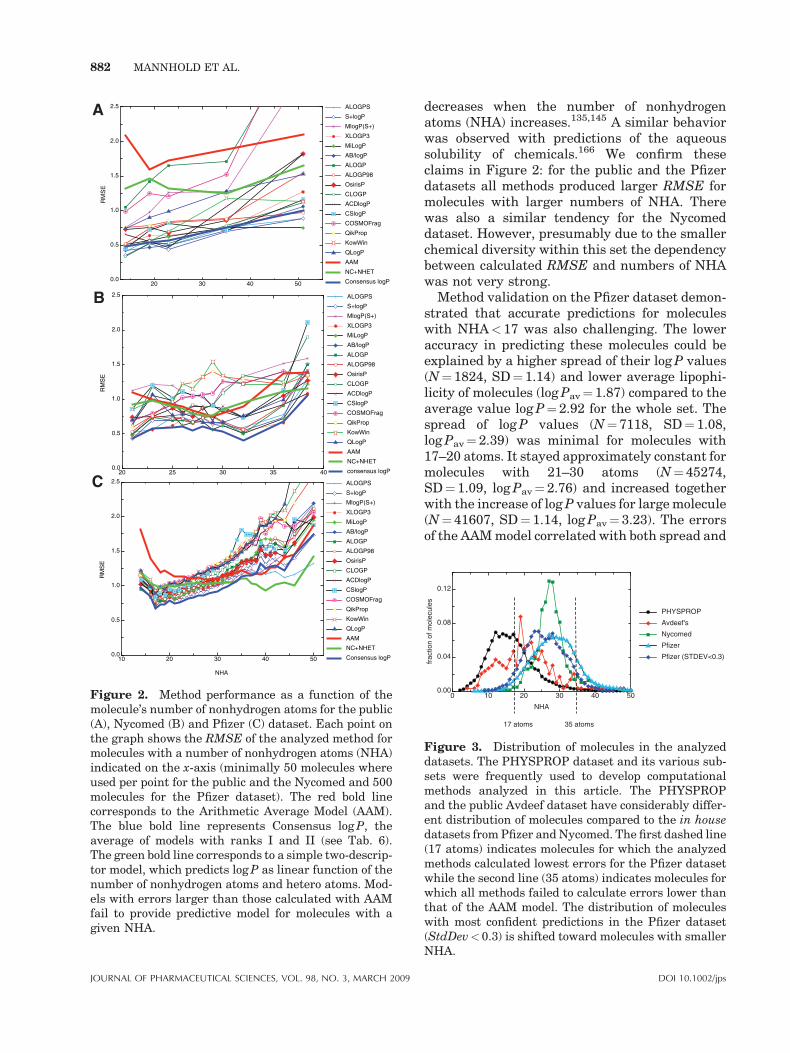
20 30 40 500.0
0.5
1.0
1.5
2.0
2.5
NHA
RM
SE
ALOGPS
S+logP
MlogP(S+)
XLOGP3
MiLogP
AB/logP
ALOGP
ALOGP98
OsirisP
CLOGP
ACDlogP
CSlogP
COSMOFrag
QikProp
KowWin
QLogP
AAM
NC+NHET
Consensus logP
20 25 30 35 400.0
0.5
1.0
1.5
2.0
2.5
NHA
RM
SE
ALOGPS
S+logP
MlogP(S+)
XLOGP3
MiLogP
AB/logP
ALOGP
ALOGP98
OsirisP
CLOGP
ACDlogP
CSlogP
COSMOFrag
QikProp
KowWin
QLogP
AAM
NC+NHET
consensus logP
10 20 30 40 500.0
0.5
1.0
1.5
2.0
2.5
NHA
RM
SE
ALOGPS
S+logP
MlogP(S+)
XLOGP3
MiLogP
AB/logP
ALOGP
ALOGP98
OsirisP
CLOGP
ACDlogP
CSlogP
COSMOFrag
QikProp
KowWin
QLogP
AAM
NC+NHET
Consensus logP
A
B
C
Figure 2. Method performance as a function of themolecule’s number of nonhydrogen atoms for the public(A), Nycomed (B) and Pfizer (C) dataset. Each point onthe graph shows the RMSE of the analyzed method formolecules with a number of nonhydrogen atoms (NHA)indicated on the x-axis (minimally 50 molecules whereused per point for the public and the Nycomed and 500molecules for the Pfizer dataset). The red bold linecorresponds to the Arithmetic Average Model (AAM).The blue bold line represents Consensus log P, theaverage of models with ranks I and II (see Tab. 6).The green bold line corresponds to a simple two-descrip-tor model, which predicts log P as linear function of thenumber of nonhydrogen atoms and hetero atoms. Mod-els with errors larger than those calculated with AAMfail to provide predictive model for molecules with agiven NHA.
JOURNAL OF PHARMACEUTICAL SCIENCES, VOL. 98, NO. 3, MARCH 2009
882 MANNHOLD ET AL.
decreases when the number of nonhydrogenatoms (NHA) increases.135,145 A similar behaviorwas observed with predictions of the aqueoussolubility of chemicals.166 We confirm theseclaims in Figure 2: for the public and the Pfizerdatasets all methods produced larger RMSE formolecules with larger numbers of NHA. Therewas also a similar tendency for the Nycomeddataset. However, presumably due to the smallerchemical diversity within this set the dependencybetween calculated RMSE and numbers of NHAwas not very strong.
Method validation on the Pfizer dataset demon-strated that accurate predictions for moleculeswith NHA< 17 was also challenging. The loweraccuracy in predicting these molecules could beexplained by a higher spread of their log P values(N¼ 1824, SD¼ 1.14) and lower average lipophi-licity of molecules (log Pav¼ 1.87) compared to theaverage value log P¼ 2.92 for the whole set. Thespread of log P values (N¼ 7118, SD¼ 1.08,log Pav¼ 2.39) was minimal for molecules with17–20 atoms. It stayed approximately constant formolecules with 21–30 atoms (N¼ 45274,SD¼ 1.09, log Pav¼ 2.76) and increased togetherwith the increase of log P values for large molecule(N¼ 41607, SD¼ 1.14, log Pav¼ 3.23). The errorsof the AAM model correlated with both spread and
0 10 20 30 40 500.00
0.04
0.08
0.12
NHA
frac
tion
of m
olec
ules
PHYSPROP
Avdeef's
Nycomed
Pfizer
Pfizer (STDEV<0.3)
17 atoms 35 atoms
Figure 3. Distribution of molecules in the analyzeddatasets. The PHYSPROP dataset and its various sub-sets were frequently used to develop computationalmethods analyzed in this article. The PHYSPROPand the public Avdeef dataset have considerably differ-ent distribution of molecules compared to the in housedatasets from Pfizer and Nycomed. The first dashed line(17 atoms) indicates molecules for which the analyzedmethods calculated lowest errors for the Pfizer datasetwhile the second line (35 atoms) indicates molecules forwhich all methods failed to calculate errors lower thanthat of the AAM model. The distribution of moleculeswith most confident predictions in the Pfizer dataset(StdDev< 0.3) is shifted toward molecules with smallerNHA.
DOI 10.1002/jps
CALCULATION OF MOLECULAR LIPOPHILICITY 883
deviation of the log P values in the consideredinterval from the average value for the wholedataset.
The density plot distribution of molecules in thePfizer and Nycomed datasets (Fig. 3) showed thatless than 2% (Pfizer) and 1.2% (Nycomed) of allmolecules had NHA< 17. Thus, from a practicalpoint of view the contribution of molecules withNHA< 17 to the total performance of methods ismarginal. It is interesting that the appearance ofNHA¼ 17 has a clear reason. The analysis of thedistribution of molecules indicates a steepdecrease of the number of molecules withNHA> 17 in the PHYSPROP database (Fig. 3).This database strongly overlaps with the StarListfrom BioByte, Inc.145 Both databases have valuesfrom public sources and thus we can expect bothdatabases to have a similar distribution ofmolecules. The PHYSPROP and StarList data-bases or some of theirs parts were used to developmost of the log P methods reviewed in this article.The low number of molecules with NHA> 17 inthese databases limits the performance of thelog P methods for these molecules.
The optimal performance of the validatedmethods was calculated for molecules with NHAof 17–18 and gradually decreased for the largernumbers of NHA for the Pfizer set. Insufficientdatabase size prevented to derive similar trendsfor the public and Nycomed datasets. Thus, ourfurther discussion will predominantly focus onresults obtained with the Pfizer dataset.
The AAM curve could be considered as a lowerlimit of method performance for each range ofNHA, that is, methods with errors larger thanthat of AAM fail to provide accurate predictionsfor molecules of such size. Figure 2 shows that formolecules with NHA< 30–35, most models pro-duced errors lower than those by the AAM butfailed to produce significantly accurate results formore complex molecules. The only exception wasthe ASNN-based ALOGPS algorithm, whichproduced lower errors even for the complexmolecules. Twelve percent of the Pfizer and 4%of Nycomed database exhibit NHA> 35. It isstriking to note that prediction of these complexmolecules with existing methods could be evenworse than assuming all of them to have just thesame average log P.
The prediction accuracy of the Consensus log Pmodel for the Pfizer dataset increases to RMSE of0.88, 0.83, and 0.78 for molecules with NHA< 35,NHA< 30, and NHA< 25. Unfortunately, thesethresholds also restrict the fraction of molecules
DOI 10.1002/jps JOU
that could be predicted to 88%, 62%, and 32% forthe Pfizer and to 96%, 83%, and 29% for theNycomed datasets.
We have also analyzed the accuracy of methodsdepending on the number of hetero atoms (NHET)and the number of rotatable bonds (NROT) inmolecules. The errors of methods increased as afunction of both descriptors (data not shown).However, they had less pronounced effects on theaccuracy of predictions compared to the NHA.Moreover, both NHET and NROT were highlycorrelated with the NHA. Thus the observedeffects could be indirectly related to the complex-ity of molecules, that is, NHA, rather than to thesedescriptors.
Following the concept of MLOGP we developeda simple two-descriptor model using the entirePfizer set
log P ¼ 1:46ð�0:02Þ þ 0:11ð�0:001ÞNC
� 0:11ð�0:001ÞNHET
N ¼ 95809; RMSE ¼ 1:04; R2 ¼ 0:2
(34)
were NC is the number of carbon atoms. The useof twofold cross-validation (i.e., the model wasdeveloped twice; each time 50% of the Pfizer datawere selected by chance and then used to predictremaining 50%) calculated exactly the samestatistical coefficients. This equation was almostas accurate as the best model for the Pfizerdataset, which could be mainly because of itscoverage of the Pfizer chemical space. For theNycomed dataset this model produced an RMSEof 0.88 and R2¼ 0.12, showing an accuracy similarto that of other best eight methods tested on thisdataset (Tab. 6). The model, however, producedlow accuracy RMSE¼ 1.35 and RMSE¼ 1.71 forthe Star and non-Star datasets, respectively(Tab. 5). Figure 2 shows that the NCþNHETequation accuracy was approximately constant(RMSE¼ 1.00), which did not depend on thecomplexity of molecules. It provided higheraccuracy compared to any of the analyzed modelsfor molecules with NHA> 35. It is interesting thatincluding of this equation into the Consensus log Pmodel decreased the RMSE to 0.90 for the Pfizerdataset but did not influence the results for theNycomed dataset.
Thus, complexity of molecules and in particulartheir size, expressed as the number of nonhydro-gen atoms (NHA), determines the accuracy ofmethods and one should be very careful whenpredicting log P for large molecules.
RNAL OF PHARMACEUTICAL SCIENCES, VOL. 98, NO. 3, MARCH 2009
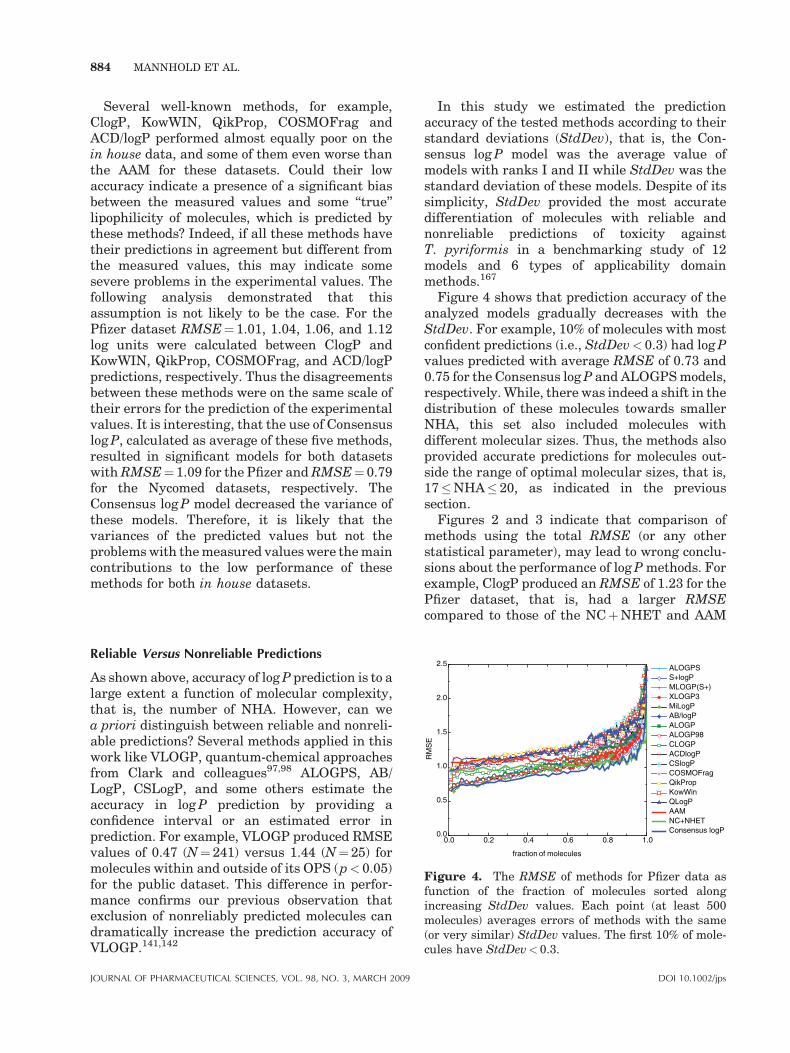
884 MANNHOLD ET AL.
Several well-known methods, for example,ClogP, KowWIN, QikProp, COSMOFrag andACD/logP performed almost equally poor on thein house data, and some of them even worse thanthe AAM for these datasets. Could their lowaccuracy indicate a presence of a significant biasbetween the measured values and some ‘‘true’’lipophilicity of molecules, which is predicted bythese methods? Indeed, if all these methods havetheir predictions in agreement but different fromthe measured values, this may indicate somesevere problems in the experimental values. Thefollowing analysis demonstrated that thisassumption is not likely to be the case. For thePfizer dataset RMSE¼ 1.01, 1.04, 1.06, and 1.12log units were calculated between ClogP andKowWIN, QikProp, COSMOFrag, and ACD/logPpredictions, respectively. Thus the disagreementsbetween these methods were on the same scale oftheir errors for the prediction of the experimentalvalues. It is interesting, that the use of Consensuslog P, calculated as average of these five methods,resulted in significant models for both datasetswith RMSE¼ 1.09 for the Pfizer and RMSE¼ 0.79for the Nycomed datasets, respectively. TheConsensus log P model decreased the variance ofthese models. Therefore, it is likely that thevariances of the predicted values but not theproblems with the measured values were the maincontributions to the low performance of thesemethods for both in house datasets.
1.00.80.60.40.20.00.0
0.5
1.0
1.5
2.0
2.5
fraction of molecules
RM
SE
ALOGPSS+logPMLOGP(S+)XLOGP3MiLogPAB/logPALOGPALOGP98CLOGPACDlogPCSlogPCOSMOFragQikPropKowWinQLogPAAMNC+NHETConsensus logP
Figure 4. The RMSE of methods for Pfizer data asfunction of the fraction of molecules sorted alongincreasing StdDev values. Each point (at least 500molecules) averages errors of methods with the same(or very similar) StdDev values. The first 10% of mole-cules have StdDev< 0.3.
Reliable Versus Nonreliable Predictions
As shown above, accuracy of log P prediction is to alarge extent a function of molecular complexity,that is, the number of NHA. However, can wea priori distinguish between reliable and nonreli-able predictions? Several methods applied in thiswork like VLOGP, quantum-chemical approachesfrom Clark and colleagues97,98 ALOGPS, AB/LogP, CSLogP, and some others estimate theaccuracy in log P prediction by providing aconfidence interval or an estimated error inprediction. For example, VLOGP produced RMSEvalues of 0.47 (N¼ 241) versus 1.44 (N¼ 25) formolecules within and outside of its OPS (p< 0.05)for the public dataset. This difference in perfor-mance confirms our previous observation thatexclusion of nonreliably predicted molecules candramatically increase the prediction accuracy ofVLOGP.141,142
JOURNAL OF PHARMACEUTICAL SCIENCES, VOL. 98, NO. 3, MARCH 2009
In this study we estimated the predictionaccuracy of the tested methods according to theirstandard deviations (StdDev), that is, the Con-sensus log P model was the average value ofmodels with ranks I and II while StdDev was thestandard deviation of these models. Despite of itssimplicity, StdDev provided the most accuratedifferentiation of molecules with reliable andnonreliable predictions of toxicity againstT. pyriformis in a benchmarking study of 12models and 6 types of applicability domainmethods.167
Figure 4 shows that prediction accuracy of theanalyzed models gradually decreases with theStdDev. For example, 10% of molecules with mostconfident predictions (i.e., StdDev< 0.3) had log Pvalues predicted with average RMSE of 0.73 and0.75 for the Consensus log P and ALOGPS models,respectively. While, there was indeed a shift in thedistribution of these molecules towards smallerNHA, this set also included molecules withdifferent molecular sizes. Thus, the methods alsoprovided accurate predictions for molecules out-side the range of optimal molecular sizes, that is,17�NHA� 20, as indicated in the previoussection.
Figures 2 and 3 indicate that comparison ofmethods using the total RMSE (or any otherstatistical parameter), may lead to wrong conclu-sions about the performance of log P methods. Forexample, ClogP produced an RMSE of 1.23 for thePfizer dataset, that is, had a larger RMSEcompared to those of the NCþNHET and AAM
DOI 10.1002/jps
CALCULATION OF MOLECULAR LIPOPHILICITY 885
models. One may wonder if it means that ClogPpredictions are not useful. Should one just use theNCþNHET equation instead? This is not true.For the same 10% threshold of the most confidentpredictions ClogP produced an RMSE of 0.87,indicating a better performance than both theAAM (RMSE¼ 1.07) and NCþNHET (RMSE¼0.95) models. Thus, despite the NCþNHETequation had a lower RMSE compared to ClogPfor the entire set, the latter model provided higheraccuracy for the molecules with most confidentpredictions. The same conclusion holds when weconsider molecules with NHA¼ 17–18. For thesemolecules ClogP calculated an RMSE of 0.84 thatwas significantly lower compared to RMSE of 1.25and 0.98 obtained with the AAM and NCþNHETmodels, respectively.
Thus, the estimation of log P prediction errorsdefinitely helps to differentiate reliable fromnonreliable predictions. Otherwise a valid com-parison of the performance of log P methods couldbe problematic.62 It is worth to notice that for thisstudy we used a simple measure, StdDev of modelscontributing to the Consensus log P model, todiscriminate molecules with low and high con-fidence in prediction. The analysis of methodperformance via the number of NHA providedanother way to access this problem. The use ofother methods, for example, those offered by someprograms analyzed in this study, may providebetter differentiation of reliable and nonreliablepredictions. However, this analysis is beyond thescope of this article and will be provided else-where.
The Impact of Method Implementation on MethodPerformance
The implementations of methods could signifi-cantly influence their performances. Our analysisincluded three LSER-like models (two implemen-tations from Pharma Algorithms and one from theSchuurmann group), two MLOGP models (imple-mented by Simulations Plus, Inc. and Talete Srl)and two ALOGP models (original version from1989 implemented in Dragon 1.4 by Talete Srl andrevised ALOGP98 version implemented byAccelrys, Inc.).
The LSER models were only tested for thepublic dataset. The two implementations fromPharma Algorithms differed with respect to theused regression coefficients in the LSER equation.However, even this presumably minor change
DOI 10.1002/jps JOU
resulted in significantly different performance ofboth models (p< 0.05) for the Star set. The LSERapproach from the group of Schuurman85 refers tothe publications of Platts83,168 and uses theoriginal regression coefficients from Eq. (14). Itprovided significantly worse results (p< 0.05)than the approaches from Pharma Algorithms.
Also for the two implementations of MLOGP weobserved—partially strong—differences in per-formance. For example, they differed by 1.00 logunits for the Pfizer dataset and by 0.9 log units forthe Non-Star dataset. MLOGP(Sþ) by Simula-tions Plus, Inc. was the third best model for thePfizer dataset, while MLOGP(Dragon) by TaleteSrl calculated a lower RMSE for the Nycomeddataset. A comparison of log P values calculatedwith both implementations indicated that theproximity effect of N/O (PRX), the presence ofintramolecular hydrogen bonds (HB), the numberof polar aromatic substituents (POL), and QN(quaternary nitrogen) were the most frequentfactors leading to the observed differences inperformance. This result is not surprising causethe original publication provided quite ambiguousdefinitions of the used descriptors. For example,the number of aromatic polar substituents candepend on the definition of aromaticity, while thenumber of internal hydrogen bonds, HB, can bedifficult to calculate since it is conformationdependent. Accordingly, implementations of thisalgorithm always require certain assumptionsregarding fragment definition.169
On the other hand, the different implementa-tions of ALOGP calculated consistent results forthe prediction of both public and in housedatasets. This result indicates that the authorsof ALOGP provided an unambiguous descriptionof their algorithm, which allowed other research-ers to implement it easily. Our data also indicatethat the revised version, ALOGP98,73 does notprovide significant improvements over the origi-nal version published in 1989.41,66–68
Taken together, variations in the performancesof different implementations of the same approachshould not be neglected. The authors are invited toprovide most comprehensive method descriptionsin order to allow their simple and unambiguousimplementation.
Efficiency of Benchmarking
Prediction accuracy of log P methods showed largediscrepancies for public versus in house datasets.
RNAL OF PHARMACEUTICAL SCIENCES, VOL. 98, NO. 3, MARCH 2009
886 MANNHOLD ET AL.
For the public dataset most models revealedsignificantly lower prediction errors than theAAM, but only a few of them produced suchresults for the in house datasets. The programsalso demonstrated different accuracies for theStar and Non-Star subsets of the public data. Asmentioned above, the Star set contains moleculesalso present in the training sets of some methods.Therefore, methods, which better fitted thetraining set data, also calculated lower errorsfor this set. The Non-Star set contained some newmolecules that were presumably not used in thetraining set. Thus this set may provide a betterestimation of the accuracy of predictions ofmethods.
We ordered the 18 methods, which were used topredict molecules in all datasets, according totheir RMSE and calculated the nonparametricSpearman rank correlation coefficients. AnRSpearman¼ 0.51 (Pfizer) and 0.37 (Nycomed) werecalculated between ranks of methods for the Starand in house datasets. The correlation coefficientsRSpearman¼ 0.67 (Pfizer) and 0.66 (Nycomed)between the Non-Star and the in house datasetswere much higher. Thus, despite the Non-Stardataset is five times smaller than the Star set, itprovided better ranking of methods with respectto the performance for new molecules. It isinteresting to note that an RSpearman¼ 0.60between ranks for the two in house datasetsindicates that the results for one of them are notcompletely predictive for another. If we consid-ered only seven top-ranked methods that werecommon for both sets (see Benchmarking Resultsunder Benchmarking of Methods Using In HouseDatasets Section), then the aforementioned cor-relation coefficients calculated between ranks ofthese methods for the Star set and two in housedatasets would increase to Rspearman¼ 0.90(Pfizer) and 0.61 (Nycomed). The same coefficientsbetween the Non-Star set and two in housedatasets increased to Rspearman¼ 0.80 (Pfizer)and 0.71 (Nycomed). The correlation betweenranks of methods for both in house datasetsincreased to 0.69. These results indicate that thetop seven methods, presumably, did not overfit thedata in the training sets they used and theirperformances on public datasets reflected theirprediction powers.
The failure of a number of software programs toaccurately predict log P for proprietary com-pounds indicates that these methods have beentrained primarily of small organic moleculesrather than on drug-like and lead-like compounds
JOURNAL OF PHARMACEUTICAL SCIENCES, VOL. 98, NO. 3, MARCH 2009
that are pursued at pharmaceutical industry indrug discovery process. Thus in order to accu-rately predict log P for a given chemical series it isrecommended to have log P experimentally mea-sured for a representative set of compounds in thischemical class. The newly determined experi-mental values could be used to improve theprediction power using the user-training optionwithout retraining (also known as a ‘‘localcorrection,’’ LIBRARY mode or the AssociativeMemory approach) provided by, for example,ALOGPS, SþlogP, SLIPPER, KowWIN, AB/LogP,ACD/logP, XLOGP3 and other methods.
CONCLUSIONS
We reviewed the state-of-the-art in the develop-ment of calculation methods for the lipophilicity ofmolecules, measured by the octanol–water parti-tion coefficient, log P. Accurate prediction of log Pis highly important for the pharmaceuticalindustry since it limits costly and time-consumingexperiments to measure log P required to optimizepharmacodynamic and pharmacokinetic proper-ties of hits and leads. Development of methods oflog P prediction attracts increasing interest dur-ing the past years. Most of the developed methodsexplicitly indicate a main importance of molecularsize and hydrogen bonding capacity for accurateprediction. In this study we give a classificationscheme for the various methodological approacheswithin log P calculation software tools.
Our benchmarking results highlight largedifferences in method accuracy for the publicand in house datasets. Most methods producedreasonable results for the public dataset, but onlya few of them provided results better than theAAM (i.e., an arithmetic average of log P values)for the in house datasets. Among the bestmethods, ALOGPS, SþlogP, XLOGP3, OsirisP,ALOGP, and ALOGP98 were consistent acrossboth in house datasets. Surprisingly, thesemethods include the classical approaches ALOGPand MLOGP. The best performances for thein house datasets were calculated by usingConsensus log P, which averages the statisticallysignificant models (rank I and rank II).
All models, except Consensus log P, calculatedan RMSE> 1.00 for the Pfizer dataset. Despite oflow average accuracy of prediction, the confidenceof prediction and analysis of molecular size can beused to distinguish between reliable and nonreli-able predictions. For example, molecules with
DOI 10.1002/jps
CALCULATION OF MOLECULAR LIPOPHILICITY 887
NHA¼ 18–20 or molecules with a small StdDevhad an RMSE< 0.75 for Consensus log P. Allmodels failed to calculate predictive models formolecules with NHA> 30–35. Particular for thesemolecules we propose a simple two descriptorequation (based on NC and NHET) that couldprovide a base-line estimation of log P with anRMSE of about 1.00 log unit.
Experimental log P measurements are highlyrecommended, when prediction accuracy is toolow. The new experimental values allow improv-ing the prediction power using the user-trainingoption without retraining provided by, for exam-ple, ALOGPS, SLIPPER, KowWIN, AB/LogP,ACD/logP, XLOGP3 and some other methods,and good local models for new accurate predictionswithin a similar series of compounds can bederived as demonstrated elsewhere.62,146,147,150
It is interesting, that most of the methodsproviding the user-training feature, for example,KowWIN EVA, ALOGPS, SLIPPER, XLOGP3,AB/LogP v.2, explore the similarity principle, thatis, the prediction of the target molecule is derivedfrom its nearest analogue (or several suchanalogs) as
log P ¼ log Pexp;analog þ Dlog Ptarget!analog
The difference between them consists in thedefinitions of similarity of molecules and algo-rithms to estimate the correction factors.160
In summary, despite a common opinion thatcalculation of lipophilicity of molecules is a simpleand easy task, our analysis demonstrated lowprediction accuracy for most of existing log Pcalculation methods. Inaccurate prediction oflog P can mislead selection of chemical series tofollow up from virtual screening, high-throughputscreens triage and new analog design since it maylead to discarding of potentially promising che-mical series from further consideration due to‘‘poor’’ physico-chemical properties. The use of theconfidence in log P prediction allows medicinalchemists to distinguish between reliable andnonreliable predictions and, thus, helps to avoidthis problem.62
ABBREVIATIONS
AAM A
DOI 10.1002/jps
rithmetic Average Model
ADMET a bsorption, distribution, metabolism,excretion, and toxicity
AFC a tom/fragment contribution ASA w ater accessible surface areaJOU
CASE c
RNAL OF PHAR
omputer automated structureevaluation
COSMO C
Onductorlike Screening MOdel DFT D ensity Functional Theory EVA E xperimental Value Adjusted GB G eneralized Born HF H artree–Fock IC is olating carbon log P o ctanol–water partition coefficient log D o ctanol–water distribution coefficient LSER li near solvation energy relationship MAE m ean absolute error MD m olecular dynamics MLP m olecular lipophilicity potential MLR m ultivariate linear regression NC n umber of carbon atoms NHA n umber of non hydrogen atoms NHET n umber of hetero atoms NOPS n onoptimal prediction space OPS o ptimal prediction space QSAR q uantitative structure–activityrelationships
R2 s quared Pearson correlationcoefficient
RMSE r oot mean square error SCRF s elf-consistent reaction field SD s tandard deviation StdDev s tandard deviation of models contri-buting to the Consensus log P model
ACKNOWLEDGMENTS
The authors want to thank P. Buchwald (Univer-sity of Miami, USA) for providing QLOGP calcula-tions, P.-A. Carrupt (University of Geneva,Switzerland) for CLIP calculations, R. Fraczkie-wicz (SimulationsPlus, Inc. USA) for SRlogP cal-culations, D. Haney (EduSoft LC, USA) for HINTcalculations, P. Japertas (Pharma Algorithms,Canada) for calculation using ABSOLV, AB/LogPand original LSER equation, R. Kuhne (HelmholtzCentre for Environmental Research, Germany)for calculations using ChemProp, R. Hoffmann(Accelrys Software, Inc., France) for ALOGP98analysis, H. McClelland (Accelrys Software,Inc., USA) for VLOGP calculations, M. Medlin(BioByte, Inc.) for providing a demo version ofthe Bio-Loom software to access CLOGP v. 5.0,O. Raevsky (Institute of Physiologically ActiveCompounds, Russia) for SLIPPER calculations,A. Saravanaraj (University of Georgia, USA) for
MACEUTICAL SCIENCES, VOL. 98, NO. 3, MARCH 2009
888 MANNHOLD ET AL.
SPARC calculations, M. Totrov and R. Abagyan(MolSoft LLC, USA) for GBLOGP and MolLogPcalculations, G. Vistoli (University of Milano) forVEGA calculations, J. Votano (ChemSilico LLC,USA) for CSLogP calculations. IVT thanks A.Klamt (COSMOlogic GmbH & Co. KG, Germany),M. Slimak (Molinspiration Chemoinformatics,Slovak Republic), A. Petrauskas (Pharma Algo-rithms, Lithuania), T. Sanders (Actelion, Switzer-land), R. Todeschini (Universita di Milano—Bicocca, Italy), L. Lai (Peking University, P. R.China) and R. Wang (Shanghai Institute ofOrganic Chemistry, P. R. China) for the possibilityto use their algorithms as demo versions at theVirtual Computational Chemistry Laboratory site(http://www.vcclab.org). The authors also thankA. Avdeef (pIon, Inc., USA) for help with prepara-tion and verification of the public benchmarkingdataset used in this study.
REFERENCES
1. Dearden JC. 1985. Partitioning and lipophilicityin quantitative structure-activity relationships.Environ Health Perspect 61:203–228.
2. Hansch C, Leo A, Hoekman D. 1995. Hydrophobic,electronic, and steric constants. Washington, DC:American Chemical Society.
3. Kubinyi H. 1979. Lipophilicity and drug activity.Prog Drug Res 23:97–198.
4. Lipinski CA, Lombardo F, Dominy BW, Feeney PJ.1997. Experimental and computational appro-aches to estimate solubility and permeability indrug discovery and development settings. AdvDrug Deliv Rev 23:3–25.
5. Lombardo F, Gifford E, Shalaeva MY. 2003.In silico ADME prediction: Data, models, factsand myths. Mini Rev Med Chem 3:861–875.
6. Pliska V, Testa B, van de Waterbeemd H.1997. Lipophilicity in drug action and toxicology.Weinheim: Wiley-VCH.
7. Smith DA, Jones BC, Walker DK. 1996. Design ofdrugs involving the concepts and theories of drugmetabolism and pharmacokinetics. Med Res Rev16:242–266.
8. Smith DA, van de Waterbeemd H, Walker DK.2006. Pharmacokinetics and metabolism in drugdesign. 2nd ed. Methods and principles in medi-cinal chemistry, Vol. 31. Weinheim: Wiley-VCH.
9. Taylor NR, Smith R. 1996. The World Wide Web asa graphical user interface to program macros formolecular graphics, molecular modeling, andstructure-based drug design. J Mol Graph 14:291–296.
JOURNAL OF PHARMACEUTICAL SCIENCES, VOL. 98, NO. 3, MARCH 2009
10. Testa B, van de Waterbeemd H, Folkers G, Guy R.2001. Pharmacokinetic optimization in drugresearch: Biological, physicochemical, and compu-tational strategies. Zurich: Wiley-VCH.
11. Testa B, Kramer SD, Wunderli-Allenspach H,Folkers G. 2006. Pharmacokinetics profiling indrug research. Zurich and Weinheim: VerlagHelvetica Chimica Acta and Willey-VCH.
12. Van de Waterbeemd H, Testa B. 1987. The para-metrization of lipophilicity and other structuralproperties in drug design. In: Testa B, editor.Advances in drug research. London: AcademicPress. pp 85–225.
13. van De Waterbeemd H, Smith DA, Beaumont K,Walker DK. 2001. Property-based design: Optimi-zation of drug absorption and pharmacokinetics.J Med Chem 44:1313–1333.
14. van de Waterbeemd H, Gifford E. 2003. ADMET insilico modelling: Towards prediction paradise? NatRev Drug Discov 2:192–204.
15. Van de Waterbeemd H, Lennernas H, Artursson P.2003. Drug bioavailability. Estimation of solubi-lity, permeability, absorption and bioavailability.Methods and principles in medicinal chemistry,Vol. 18. Weinheim: Wiley-VCH.
16. Van de Waterbeemd H, Testa B. 2007. ADME/Toxapproaches. In: Testa B, van de Waterbeemd H,editors. Comprehensive medicinal chemistry II:In silico tools in ADMET. Oxford: Elsevier. p 1152.
17. Atkinson F, Cole S, Green C, Van de WaterbeemdH. 2002. Lipophilicity and other parameters affect-ing brain penetration. Curr Med Chem Cent NervSyst Agents 2:229–240.
18. Crivori P, Cruciani G, Carrupt PA, Testa B. 2000.Predicting blood-brain barrier permeation fromthree-dimensional molecular structure. J MedChem 43:2204–2216.
19. Cronin MTD. 2006. The role of hydrophobicity intoxicity prediction. Curr Comput-Aided Drug Des2:405–413.
20. Testa B, Crivori P, Reist M, Carrupt PA. 2000. Theinfluence of lipophilicity on the pharmacokineticbehavior of drugs: Concepts and examples. Per-spect Drug Discov Des 19:179–211.
21. van de Waterbeemd H, Smith DA, Jones BC. 2001.Lipophilicity in PK design: Methyl, ethyl, futile.J Comput-Aided Mol Des 15:273–286.
22. Tetko IV. 2007. Prediction of physicochemicalproperties. In: Ekins S, editor. Computational tox-icology: Risk assessment for pharmaceutical andenvironmental chemicals. New Jersey: John Wiley& Sons, Inc. pp 241–275.
23. Sangster J. 1997. Octanol-water partition coeffi-cients: Fundamentals and physical chemistry.Chichester: John Wiley & Sons Ltd. p 178.
24. Fujita T, Iwasa J, Hansch C. 1964. A new sub-stituent constant, p, derived from partition coeffi-cients. J Am Chem Soc 86:5175–5180.
DOI 10.1002/jps
CALCULATION OF MOLECULAR LIPOPHILICITY 889
25. Nys GG, Rekker RF. 1974. The concept of hydro-phobic fragmental constants (f-values). II. Exten-sion of its applicability to the calculation oflipophilicities of aromatic and hetero-aromaticstructures. Chim Ther 9:361–374.
26. Rekker RF. 1977. The hydrophobic fragmentalconstant. Its derivation and application. A meansof characterizing membrane systems. Amsterdam:Elsevier.
27. Rekker RF, de Kort HM. 1979. The hydrophobicfragmental constant; an extension to a 1000 datapoint set. Eur J Med Chem 14:479–488.
28. Nys GG, Rekker RF. 1973. Statistical analysis of aseries of partition coefficients with special refer-ence to the predictability of folding of drug mole-cules. Introduction of hydrophobic fragmentalconstants (f-values). Chim Ther 8:521–535.
29. Buchwald P, Bodor N. 1998. Octanol-water parti-tion: Searching for predictive models. Curr MedChem 5:353–380.
30. Carrupt PA, Testa B, Gaillard P. 1997. Computa-tional approaches to lipophilicity: Methods andapplications. Rev Comput Chem 11:241–315.
31. Klopman G, Zhu H. 2005. Recent methodologiesfor the estimation of n-octanol/water partitioncoefficients and their use in the prediction ofmembrane transport properties of drugs. MiniRev Med Chem 5:127–133.
32. Mannhold R, Cruciani G, Dross K, Rekker R. 1998.Multivariate analysis of experimental and compu-tational descriptors of molecular lipophilicity.J Comput-Aided Mol Des 12:573–581.
33. Mannhold R, Dross K. 1996. Calculation proce-dures for molecular lipophilicity: A comparativestudy. Quant Struct-Activ Rel 15:403–409.
34. Rekker RF, Mannhold R. 1992. Calculation of druglipophilicity. The hydrophobic fragmental con-stant approach. Weinheim: VCH.
35. Mannhold R, Rekker RF, Dross K, Bijloo G,de Vries G. 1998. The lipophilic behaviour oforganic compounds: 1. An updating of the hydro-phobic fragmental constant approach. QuantStruct-Activ Rel 17:517–536.
36. Petelin DE, Arslanov NA, Palyulin VA, Zefirov NS.10th Eur Symp on Structure-Activity Relation-ships, Barcelona, 1994. p B263.
37. Klopman G, Li J-Y, Wang S, Dimayuga M. 1994.Computer automated log P calculations based onan extended group contribution approach. J ChemInf Comput Sci 34:752–781.
38. Hansch C, Leo AJ. 1979. Subsistent constantsfor correlation analysis in chemistry and biology.New York: Wiley.
39. Leo A, Hansch C, Elkins D. 1971. Partition coeffi-cients and their uses. Chem Rev 61:525–616.
40. Suzuki T, Kudo Y. 1990. Automated log P estima-tion based on combined additive modeling meth-ods. J Comput-Aided Mol Des 4:155–198.
DOI 10.1002/jps JOU
41. Viswanadhan VN, Ghose AK, Revankar GR,Robins RK. 1989. Atomic physicochemical para-meters for three dimensional structure directedquantitative structure-activity relationships. 4.Additional parameters for hydrophobic and dis-persive interactions and their application for anautomated superposition of certain naturallyoccurring nucleoside antibiotics. J Chem Inf Com-put Sci 9:163–172.
42. Viswanadhan VN, Reddy MR, Bacquet RJ. ErionMD. 1993. Assessment of methods used for pre-dicting lipophilicity: Application to nucleosidesand nucleoside bases. J Comput Chem 14:1019–1026.
43. Klopman G. 1992. MULTICASE 1. A hierarchicalcomputer automated structure evaluation pro-gram. Quant Struct-Activ Rel 11:176–184.
44. Zhu H, Sedykh A, Chakravarti SK, Klopman G.2005. A new group contribution approach to thecalculation of logP. Curr Comput-Aided Drug Des1:3–9.
45. Sedykh AY, Klopman G. 2006. A structural ana-logue approach to the prediction of the octanol-water partition coefficient. J Chem Inf Model46:1598–1603.
46. Junghans M, Pretsch E. 1997. Estimation ofpartition coefficients of organic compounds: Localdatabase modeling with uniform-length structuredescriptors. Fresenius J Anal Chem 359:88–92.
47. Meylan WM, Howard PH. 2000. Estimatinglog P with atom/fragments and water solubilitywith log P. Perspect Drug Discov Des 19:67–84.
48. Raevsky OA, Trepalin SV, Trepalina HP, Gerasi-menko VA, Raevskaja OE. 2002. SLIPPER-2001—Software for predicting molecular properties onthe basis of physicochemical descriptors and struc-tural similarity. J Chem Inf Comput Sci 42:540–549.
49. Raevsky OA. 2001. Molecular lipophilicity calcu-lations of chemically heterogeneous chemicals anddrugs on the basis of structural similarity andphysicochemical parameters. SAR QSAR EnvironRes 12:367–381.
50. Tetko IV, Tanchuk VY. 2002. Application of asso-ciative neural networks for prediction of lipophi-licity in ALOGPS 2.1 program. J Chem Inf ComputSci 42:1136–1145.
51. Cheng T, Zhao Y, Li X, Lin F, Xu Y, Zhang X, Li Y,Wang R, Lai L. 2007. Computation of octanol-water partition coefficients by guiding an additivemodel with knowledge. J Chem Inf Model 47:2140–2148.
52. Meylan WM, Howard PH, Boethling RS. 1996.Improved method for estimating water solubilityfrom octanol water partition coefficient. EnvironToxicol Chem 15:100–106.
RNAL OF PHARMACEUTICAL SCIENCES, VOL. 98, NO. 3, MARCH 2009
890 MANNHOLD ET AL.
53. Meylan WM, Howard PH. 1995. Atom/fragmentcontribution method for estimating octanol-waterpartition coefficients. J Pharm Sci 84:83–92.
54. Leo A, Jow PY, Silipo C, Hansch C. 1975. Calcula-tion of hydrophobic constant (log P) from pi and fconstants. J Med Chem 18:865–868.
55. Leo AJ. 1987. Some advantages of calculatingoctanol-water partition coefficients. J Pharm Sci76:166–168.
56. Leo AJ. 1991. Hydrophobic parameter: Measure-ment and calculation. Methods Enzymol 202:544–591.
57. Leo AJ. 1993. Calculating logPoct from structures.Chem Rev 93:1281–1306.
58. Leo AJ, Hoekman D. 2000. Calculating log P(oct)with no missing fragments; The problem of esti-mating new interaction parameters. PerspectDrug Discov Des 18:19–38.
59. Petrauskas AA, Kolovanov EA. 2000. ACD/LogPmethod description. Perspect Drug Discov Des 19:99–116.
60. Petrauskas A, Kolovanov EA. 2000. Limitations offragmental methods and ACD/LogP training fea-ture. In Testa B, editor Log P 2000—The secondLogP Symposium, Laussane, Switzerland. http://www.acdlabs.com/publish/poster1.html (accessedJuly 1, 2008).
61. Japertas P, Didziapetris R, Petrauskas A. 2002.Fragmental methods in the design of new com-pounds. Applications of The Advanced AlgorithmBuilder. Quant Struct-Activ Rel 21:23–37.
62. Tetko IV, Bruneau P, Mewes HW, Rohrer DC,Poda GI. 2006. Can we estimate the accuracy ofADME-Tox predictions? Drug Discov Today 11:700–707.
63. Japertas P, Sazonovas A, Didziapetris R, Petraus-kas A. The 235th ACS National Meeting, NewOrleans, LA, April 6–10 2008.
64. Broto P, Moreau G, Vandycke C. 1984. Molecularstructures, perception, autocorrelation descriptorand SAR studies; system of atomic contributionsfor the calculation of the octanol-water partitioncoefficient. Eur J Med Chem 19:71–78.
65. Convard T, Dubost JP, Le Solleu H, Kummer E.1994. SmilogP: A program for a fast evaluation oftheoretical log P from the Smiles code of a mole-cule. Quant Struct-Activ Rel 13:34–37.
66. Ghose AK, Crippen GM. 1986. Atomic physico-chemical parameters for three-dimensionalstructure-directed quantitative structure-activityrelationships. I. Partition coefficients as a measureof hydrophobicity. J Comp Chem 7:565–677.
67. Ghose AK, Crippen GM. 1987. Atomic physi-cochemical parameters for three-dimensional-structure-directed quantitative structure-activityrelationships. 2. Modeling dispersive and hydro-phobic interactions. J Chem Inf Comput Sci 27:21–35.
JOURNAL OF PHARMACEUTICAL SCIENCES, VOL. 98, NO. 3, MARCH 2009
68. Ghose AK, Pritchett A, Crippen GM. 1988. Atomicphysicochemical parameters for three-dimen-sional structure-directed quantitative structure-activity relationships. III. Modeling hydrophobicinteractions. J Comp Chem 9:80–90.
69. Ghose AK, Viswanadhan VN, Wendoloski JJ.1998. Prediction of hydrophobic (lipophilic) prop-erties of small organic molecules using fragmentalmethods: An analysis of ALOGP and CLOGPmethods. J Phys Chem A 102:3762–3772.
70. Molnar L, Keseru GM, Papp A, Gulyas Z, DarvasF. 2004. A neural network based prediction ofoctanol-water partition coefficients using atomic5 fragmental descriptors. Bioorg Med Chem Lett14:851–853.
71. Wang RX, Fu Y, Lai LH. 1997. A new atom-addi-tive method for calculating partition coefficients.J Chem Inf Comput Sci 37:615–621.
72. Wang RX, Gao Y, Lai LH. 2000. Calculating parti-tion coefficient by atom-additive method. PerspectDrug Discov Des 19:47–66.
73. Wildman SA, Crippen GM. 1999. Prediction ofphysicochemical parameters by atomic contribu-tions. J Chem Inf Comput Sci 39:868–873.
74. Mauri A, Consonni V, Pavan M, Todeschini R.2006. Dragon software: An easy approach to mole-cular descriptor calculations. Match-CommunMath Comput Chem 56:237–248.
75. Sangster J. 1989. Octanol-water partition coeffi-cients of simple organic compounds. J Phys ChemRef Data 18:1111–1229.
76. Born M. 1920. Volumen un Hydrationwarme derIonen. Z Phys 1:45–48.
77. Duffy EM, Jorgensen WL. 2000. Prediction ofproperties from simulations: Free energies of sol-vation in hexadecane, octanol, and water. J AmChem Soc 122:2878–2888.
78. Kamlet MJ, Doherty RM, Carr P, Abraham MH,Marcus Y, Taft RW. 1988. Linear solvation energyrelationships. 46. An improved equation for corre-lation and prediction of octanol-water partitioncoefficients of organic non-electrolytes (includingstrong hydrogen bond donor solutes). J Phys Chem92:5244–5255.
79. Kamlet MJ, Abboud J-LM, Abraham MH, TaftRW. 1983. Linear solvation energy relation-ships. 23. A comprehensive collection of thesolvatochromic parameters, pi , alpha, and beta,and some methods for simplifying the generalizedsolvatochromic equation. J Org Chem 48:2877–2887.
80. Abraham MH. 1993. Scales of solute hydrogen-bonding: Their construction and application tophysicochemical and biochemical processes. ChemSoc Rev 22:73–83.
81. Abraham MH, Chadha HS, Whiting GS, MitchellRC. 1994. Hydrogen bonding. 32. An analysis ofwater-octanol and water-alkane partitioning and
DOI 10.1002/jps
CALCULATION OF MOLECULAR LIPOPHILICITY 891
the delta log P parameter of seiler. J Pharm Sci83:1085–1100.
82. Platts JA, Butina D, Abraham MH, Hersey A.1999. Estimation of molecular linear free energyrelation descriptors using a group contributionapproach. J Chem Inf Comput Sci 39:835–845.
83. Platts JA, Abraham MH, Butina D, Hersey A.2000. Estimation of molecular linear free energyrelationship descriptors by a group contributionapproach. 2. Prediction of partition coefficients.J Chem Inf Comput Sci 40:71–80.
84. Absolv program, http://pharma-algorithms.com.85. Schuurmann G, Ebert RU, Kuhne R. 2006. Predic-
tion of physicochemical properties of organic com-pounds from 2D molecular structure—Fragmentmethods vs. LFER models. Chimia 60:691–698.
86. Raevsky OA. 1997. Quantification of non-covalentinteractions on the basis of the thermodynamichydrogen bond parameters. J Phys Org Chem10:405–413.
87. Hilal SH, Carreira LA, Karickhoff SW, MeltonCM. 1994. Estimation of gas-liquid chromato-graphic retention times from molecular structure.J Chromatogr A 662:269–280.
88. Hilal SH, Carreira LA, Karickhoff SW, MeltonCM. 1993. Estimation of electron affinity basedon structure activity relationships. Quant Struct-Activ Rel 12:389–396.
89. Karickhoff SW, McDaniel VK, Melton C, VellinoAN, Nute DE, Carreira LA. 1991. Predicting che-mical reactivity by computer. Environ ToxicolChem 10:1405–1416.
90. Hammett LP. 1970. Physical organic chemistry. 2edition. New York: McGraw Hill.
91. Dewar MJS. 1969. The molecular orbital theory fororganic chemistry. New York: McGraw-Hill.
92. Hilal SH, Karickhoff SW, Carreira LA. 2004. Pre-diction of the solubility, activity coefficient andliquid/liquid partition coefficient of organic com-pounds. QSAR Comb Sci 23:709–720.
93. Rogers KS, Cammarata A. 1969. A molecular orbi-tal description of the partitioning of aromatic com-pounds between polar and nonpolar phases.Biochim Biophys Acta 193:22–29.
94. Klopman G, Iroff LD. 1981. Calculation of parti-tion coefficients by the charge density method.J Comput Chem 2:157–160.
95. Bodor N, Gabanyi Z, Wong C. 1989. A new methodfor the estimation of partition coefficient. J AmChem Soc 111:3783–3786.
96. Bodor N, Huang MJ. 1992. An extended version ofa novel method for the estimation of partitioncoefficients. J Pharm Sci 81:272–281.
97. Breindl A, Beck B, Clark T, Glen RC. 1997. Pre-diction of the n-octanol/water partition coefficient,logP, using a combination of semiempirical MO-calculations and a neural network. J Mol Model3:142–155.
DOI 10.1002/jps JOU
98. Beck B, Breindl A, Clark T. 2000. QM/NN QSPRmodels with error estimation: Vapor pressure andLog P. J Chem Inf Comput Sci 40:1046–1051.
99. Bodor N, Buchwald P. 1997. Molecular size basedapproach to estimate partition properties fororganic solutes. J Phys Chem B 101:3404–3412.
100. Dewar MJS, Zoebisch EG, Healy EF, Stewart JJP.1985. AM1: A new general purpose quantummechanical molecular model. J Am Chem Soc107:3902–3909.
101. Buchwald P, Bodor N. 1998. Octanol-water parti-tion of nonzwitterionic peptides: Predictive powerof a molecular size-based model. Proteins 30:86–99.
102. Totrov M. 2004. Accurate and efficient generalizedborn model based on solvent accessibility: Deriva-tion and application for LogP octanol/water pre-diction and flexible peptide docking. J ComputChem 25:609–619.
103. Moriguchi I, Hirono S, Nakagome I, Hirano H.1994. Comparison of reliability of log P values fordrugs calculated by several methods. ChemPharm Bull 42:976–978.
104. Klamt A, Schuurmann G. 1993. COSMO: Anew approach to dielectric screening in solventswith explicit expressions for the screening energyand its gradient. J Chem Soc Perkin Trans 2:799–805.
105. Eckert F, Klamt A. 2002. Fast solvent screeningvia quantum chemistry: COSMO-RS approach.AIChE J 48:369–385.
106. Klamt A, Eckert F. 2001. COSMO-RS: A novel wayfrom quantum chemistry to free energy, solubilityand general QSAR-descriptors for partitioning. In:Holtje H-D, Sippl W, editors. Rational approachesto drug design. Barcelona: Prous Science S.A.pp 195–205.
107. Hornig M, Klamt A. 2005. COSMOfrag: Anovel tool for high-throughput ADME propertyprediction and similarity screening based onquantum chemistry. J Chem Inf Model 45:1169–1177.
108. The Physical Properties Database (PHYSPROP),Syracuse Research Corporation.
109. Haeberlein M, Brinck T. 1997. Prediction ofwater–octanol partition coefficients using theore-tical descriptors derived from the molecular sur-face area and the electrostatic potential. J ChemSoc, Perkin Trans 2:289–294.
110. Chuman H, Mori A, Tanaka H, Yamagami C,Fujita T. 2004. Analyses of the partition coeffi-cient, log P, using ab initio MO parameter andaccessible surface area of solute molecules.J Pharm Sci 93:2681–2697.
111. Fedichev PO, Men’shikov LI. 2006. Long-rangeorder and interactions of macroscopic objects inpolar liquids. arXiv:cond-mat/0601129.
112. Quantum Pharmaceuticals, Moscow, Russia.113. QikProp, Schrodinger, LLC.
RNAL OF PHARMACEUTICAL SCIENCES, VOL. 98, NO. 3, MARCH 2009
892 MANNHOLD ET AL.
114. Jorgensen WL, Duffy EM. 2002. Prediction of drugsolubility from structure. Adv Drug Deliv Rev54:355–366.
115. Furet P, Sele A, Cohen NC. 1988. 3D molecularlipophilicity potential profiles: A new tool in mole-cular modeling. J Mol Graph 6:182–189.
116. Fauchere JL, Quarendon P, Kaetterer L. 1988.Estimating and representing hydrophobicitypotential. J Mol Graph 6:203–206.
117. Audry E, Dallet P, Langlois MH, Colleter JC,Dubost JP. 1989. Quantitative structure affinityrelationships in a series of alpha-2 adrenergicamines using the molecular lipophilicity potential.Prog Clin Biol Res 291:63–66.
118. Kellogg GE, Semus SF, Abraham DJ. 1991. HINT:A new method of empirical hydrophobic field cal-culation for CoMFA. J Comput-Aided Mol Des5:454–552.
119. Kellogg GE, Abraham DJ. 2000. Hydrophobicity:Is Log P(o/w) more than the sum of its parts? Eur JMed Chem 35:651–661.
120. Kellogg GE, Burnett JC, Abraham DJ. 2001. Veryempirical treatment of solvation and entropy: Aforce field derived from Log P-o/w. J Comput-Aided Mol Des 15:381–393.
121. Abraham DJ, Leo AJ. 1987. Extension of the frag-ment method to calculate amino acid zwitterionand side chain partition coefficients. Proteins2:130–152.
122. Amadasi A, Spyrakis F, Cozzini P, Abraham DJ,Kellogg GE, Mozzarelli A. 2006. Mapping theenergetics of water-protein and water-ligandinteractions with the ‘‘natural’’ HINT forcefield:Predictive tools for characterizing the roles ofwater in biomolecules. J Mol Biol 358:289–309.
123. Gaillard P, Carrupt PA, Testa B, Boudon A. 1994.Molecular lipophilicity potential, a tool in 3DQSAR: Method and applications. J Comput-AidedMol Des 8:83–96.
124. Testa B, Carrupt PA, Gaillard P, Billois F, WeberP. 1996. Lipophilicity in molecular modeling.Pharm Res 13:335–343.
125. Pedretti A, Villa L, Vistoli G. 2002. VEGA: Aversatile program to convert, handle and visualizemolecular structure on Windows-based PCs. J MolGraph Model 21:47–49.
126. Kraszni M, Banyai I, Noszal B. 2003. Determina-tion of conformer-specific partition coefficients inoctanol/water systems. J Med Chem 46:2241–2245.
127. Kim KH. 1995. Calculation of hydrophobic para-meters directly from three-dimensional structuresusing comparative molecular field analysis.J Comput-Aided Mol Des 9:308–318.
128. Waller CL. 1994. A three dimensional techniquefor the calculation of octanol-water partition coef-ficients. Quant Struct-Activ Rel 13:172–176.
129. Caron G, Ermondi G. 2005. Calculating virtuallog P in the alkane/water system (log P(N)(alk))
JOURNAL OF PHARMACEUTICAL SCIENCES, VOL. 98, NO. 3, MARCH 2009
and its derived parameters deltalog P(N)(oct-alk)and log D(pH)(alk). J Med Chem 48:3269–3279.
130. Cruciani G, Pastor M, Guba W. 2000. VolSurf:A new tool for the pharmacokinetic optimizationof lead compounds. Eur J Pharm Sci 11:S29–S39.
131. Moriguchi I, Hirono S, Liu Q, Nakagome I, Mat-sushita Y. 1992. Simple method of calculatingoctanol/water partition coefficient. Chem PharmBull 40:127–130.
132. ADMET Predictor(TM) version 2.3.0, SimulationsPlus, Inc.
133. Devillers J, Balaban AT. 1999. Topological indicesand related descriptors in QSAR and QSPR. TheNetherlands: Gordon and Breach.
134. Todeschini R, Consonni V. 2000. Handbook ofmolecular descriptors. Methods and principlesin medicinal chemistry, Vol. 11. Weinheim:Wiley-VCH.
135. Niemi GJ, Basak SC, Veith GD, Grunwald GD.1992. Prediction of octanol water partition coeffi-cient (Kow) using algorithmically-derived vari-ables. Environ Toxicol Chem 11:893–900.
136. Baumann K, Clerc JT. 1997. Computer-assistedIR spectra prediction—Linked similarity searchesfor structures and spectra. Anal Chim Acta348:327–343.
137. Sadowski J, Gasteiger J, Klebe G. 1994. Compar-ison of automatic three-dimensional modelbuilders using 639 X-ray structures. J Chem InfComput Sci 34:1000–1008.
138. Kier LB, Hall LH. 1999. Molecular structuredescription: The electrotopological state. London:Academic Press. p 245.
139. Hall LH, Kier LB. 1995. Electrotopological stateindices for atom types—A novel combination ofelectronic, topological, and valence state informa-tion. J Chem Inf Comput Sci 35:1039–1045.
140. Parham ME, Hall LH, Kier LB. 2000. High qualityof property predictions by Molconn-Z and artificialneural network modeling. Abstr Pap Am ChemSoc 220:U288–U288.
141. Gombar VK, Enslein K. 1996. Assessment of n-octanol/water partition coefficient: When is theassessment reliable? J Chem Inf Comput Sci36:1127–1134.
142. Gombar VK. 1999. Reliable assessment of logP ofcompounds of pharmaceutical relevance. SARQSAR Environ Res 10:371–380.
143. Huuskonen JJ, Livingstone DJ, Tetko IV. 2000.Neural network modeling for estimation of parti-tion coefficient based on atom-type electrotopolo-gical state indices. J Chem Inf Comput Sci 40:947–955.
144. Huuskonen JJ, Villa AE, Tetko IV. 1999. Predic-tion of partition coefficient based on atom-typeelectrotopological state indices. J Pharm Sci 88:229–233.
DOI 10.1002/jps
CALCULATION OF MOLECULAR LIPOPHILICITY 893
145. Tetko IV, Tanchuk VY, Villa AE. 2001. Predictionof n-octanol/water partition coefficients from PHY-SPROP database using artificial neural networksand E-state indices. J Chem Inf Comput Sci 41:1407–1421.
146. Tetko IV, Poda GI. 2004. Application of ALOGPS2.1 to predict log D distribution coefficient forPfizer proprietary compounds. J Med Chem 47:5601–5604.
147. Tetko IV, Bruneau P. 2004. Application ofALOGPS to predict 1-octanol/water distributioncoefficients, logP, and logD, of AstraZeneca in-house database. J Pharm Sci 93:3103–3110.
148. Livingstone DJ, Ford MG, Huuskonen JJ, Salt DW.2001. Simultaneous prediction of aqueous solubi-lity and octanol/water partition coefficient based ondescriptors derived from molecular structure.J Comput-Aided Mol Des 15:741–752.
149. VLOGP (v 3.1) model from the Toxicity Prediction(TOPKAT) protocol in Discovery Studio 1.7.
150. Tetko IV. 2002. Neural network studies. 4. Intro-duction to associative neural networks. J Chem InfComput Sci 42:717–728.
151. Tetko IV. 2002. Associative neural network.Neural Process Lett 16:187–199.
152. Tetko IV, Jaroszewicz I, Platts JA, Kuduk-Jaworska J. 2008. Calculation of lipophilicity forPt(II) complexes: Experimental comparison of sev-eral methods. Biochem 102:1424–1437.
153. A databank of evaluated octanol-water partitioncoefficients (LOGKOW), http://logkow.cisti.nrc.ca/logkow/.
154. Mannhold R, Petrauskas A. 2003. Substructureversus whole-molecule approaches for calculatinglog P. QSAR Comb Sci 22:466–475.
155. Mannhold R, van de Waterbeemd H. 2001. Sub-structure and whole molecule approaches for cal-culating log P. J Comput-Aided Mol Des 15:337–354.
156. Rekker RF, ter Laak AM, Mannhold M. 1993.On the reliability of calculated log P-values:Rekker, Hansch/Leo and Suzuki approach. QuantStruct-Activ Rel 12:152–157.
157. Mannhold R, Dross KP, Rekker RF. 1990. Druglipophilicity in QSAR practice: I. A. comparison ofexperimental with calculative approaches. QuantStruct-Activ Rel 9:21–28.
158. Eros D, Kovesdi I, Orfi L, Takacs-Novak K, AcsadyG, Keri G. 2002. Reliability of logP predictionsbased on calculated molecular descriptors: A cri-tical review. Curr Med Chem 9:1819–1829.
159. Benfenati E, Gini G, Piclin N, Roncaglioni A, VariMR. 2003. Predicting log P of pesticides usingdifferent software. Chemosphere 53:1155–1164.
DOI 10.1002/jps JOU
160. Tetko IV, Livingstone DJ. 2006. Rule-based sys-tems to predict lipophilicity. In: Testa B, van deWaterbeemd H, editors. Comprehensive medi-cinal chemistry II: In silico tools in ADMET, ed.Amsterdam: Elsevier. pp 649–668.
161. Tetko IV, Poda GI. 2007. Prediction of Log P withproperty-based methods. In: Mannhold R, editor.Molecular drug properties—Measurement andprediction. Methods and principles in medicinalchemistry, Vol. 37. Weinheim: Wiley-VCH.pp 381–406.
162. Avdeef A. 2003. Absorption and drug develop-ment. solubility, permeability and charge state,ed. Hoboken, NJ: Wiley–Interscience. p 312.
163. Lombardo F, Faller B, Shalaeva M, Tetko I, TiltonS. 2007. The good, the bad and the ugly of dis-tribution coefficients: Current status, views andoutlook. In: Mannhold R, editor. Molecular drugproperties—Measurement and prediction. Meth-ods and principles in medicinal chemistry, Vol. 37.Weinheim: Wiley-VCH. pp 407–437.
164. ICM, (Internal Coordinate Mechanics) software,MolSoft LLC.
165. Tetko IV, Solov’ev VP, Antonov AV, Yao X, DoucetJP, Fan B, Hoonakker F, Fourches D, Jost P,Lachiche N, Varnek A. 2006. Benchmarking oflinear and nonlinear approaches for quantitativestructure-property relationship studies of metalcomplexation with ionophores. J Chem Inf Model46:808–819.
166. Tetko IV, Tanchuk VY, Kasheva TN, Villa AE.2001. Estimation of aqueous solubility of chemicalcompounds using E-state indices. J Chem InfComput Sci 41:1488–1493.
167. Tetko IV, Sushko I, Pandey AK, Tropsha A, Zhu H,Papa E, Oberg T, Todeschini R, Fourches D, Var-nek A. 2008. Critical assessment of QSAR Modelsto predict environmental toxicity against Tetra-hymena pyriformis: Focusing on applicabilitydomain and overfitting by variable selection.J Chem Inf Model (in press).
168. Platts JA, Abraham MH, Zhao YH, Hersey A, IjazL, Butina D. 2001. Correlation and prediction of alarge blood-brain distribution data set—An LFERstudy. Eur J Med Chem 36:719–730.
169. Pearlman RS, Wu Y. 2006. An Improved Methodfor Predicting Log P. 2006 AAPS Annual Meetingand Exposition, San Antonio, TX.
170. Tetko IV, Gasteiger J, Todeschini R, Mauri A,Livingstone D, Ertl P, Palyulin VA, RadchenkoEV, Zefirov NS, Makarenko AS, Tanchuk VY,Prokopenko VV. 2005. Virtual computationalchemistry laboratory—Design and description.J Comput-Aided Mol Des 19:453–463.
RNAL OF PHARMACEUTICAL SCIENCES, VOL. 98, NO. 3, MARCH 2009

![Chromatographic and computational assessment of lipophilicity … · 2017. 11. 30. · Hydrophilic interaction liquid chromatography 86 (HILIC) [14] or salting-out chromatography](https://static.fdocuments.in/doc/165x107/60459fed9773835ebd46a3c4/chromatographic-and-computational-assessment-of-lipophilicity-2017-11-30-hydrophilic.jpg)