Calculation of 2016 Crude Average Carbon Intensity Value · PDF fileCalculation of 2016 Crude...
22
June 7, 2017 Calculation of 2016 Crude Average Carbon Intensity Value Posting: Section 95489(c)(3) of the Low Carbon Fuel Standard (LCFS) Regulation 1 states that each year the Executive Officer will post the Annual Crude Average carbon intensity calculation at the ARB-LCFS website for public comment. Written comments shall be accepted for 15 calendar days following the date on which the analysis was posted. Only comments related to potential factual or methodological errors in the posted Annual Crude Average carbon intensity value may be considered. The Executive Officer shall evaluate the comments received and, if the Executive Officer deems it necessary, may request in writing additional information or clarification from the commenters. Commenters shall have 10 days to respond to these requests. The Executive Officer shall post the final Annual Crude Average carbon intensity value at the ARB-LCFS website within 15 days of completion of the comment period, if no comments are received. If comments are received, the Executive Officer shall post the final Annual Crude Average carbon intensity value within 30 days of completion of the comment period or within 25 days of the latest request by the Executive Officer for additional information or clarification from a commenter, whichever is later. Calculation of 2014, 2015 and 2016 Annual Crude Average Carbon Intensity Values: In table 1, California crude volumes and Annual Crude Average carbon intensity values for 2014, 2015 and 2016 are shown. In tables 2, 3 and 4, breakdowns of the sources of crude oil supplied to California refineries during 2014, 2015 and 2016 as well as the carbon intensity values assigned to these crude sources are displayed. All crude oil produced in and offshore of California during the time period of 2014 to 2016 was assumed to be refined in California. 2 The volume contributions for California produced crudes are based on oil production data obtained from the California Department of Conservation. 3 The volume contributions for California federal offshore crudes are based on oil production data obtained from the Bureau of Safety and Environmental Enforcement. 4 The volume contributions of imported crudes are based on oil supply data submitted by refineries as part of annual LCFS reporting. The annual crude average carbon intensity values are a volume-weighted average of the carbon intensities for the crudes supplied in a given year. 1 The LCFS regulation is found at California Code of Regulations (CCR), title 17, sections 95480-95497. Subsequent section references are to CCR title 17. 2 The total volume of California state and federal offshore crude supplied to California refineries as reported to ARB was 630 million barrels, which closely matches the total volume reported by oil producers to California Department of Conservation and Bureau of Safety and Environmental Enforcement of 626 million barrels. 3 California Department of Conservation, Online Production and Injection Query and Database, http://opi.consrv.ca.gov/opi/opi.dll (accessed April 17, 2015, May 19, 2016 and May 10, 2017). 4 Bureau of Safety and Environmental Enforcement website https://www.data.bsee.gov/Main/PacificProduction.aspx (accessed April 17, 2015, April 21, 2016 and May 11, 2017). 1
-
Upload
duongnguyet -
Category
Documents
-
view
213 -
download
0
Transcript of Calculation of 2016 Crude Average Carbon Intensity Value · PDF fileCalculation of 2016 Crude...

June 7, 2017
Calculation of 2016 Crude Average Carbon Intensity Value Posting: Section 95489(c)(3) of the Low Carbon Fuel Standard (LCFS) Regulation1 states that each year the Executive Officer will post the Annual Crude Average carbon intensity calculation at the ARB-LCFS website for public comment. Written comments shall be accepted for 15 calendar days following the date on which the analysis was posted. Only comments related to potential factual or methodological errors in the posted Annual Crude Average carbon intensity value may be considered. The Executive Officer shall evaluate the comments received and, if the Executive Officer deems it necessary, may request in writing additional information or clarification from the commenters. Commenters shall have 10 days to respond to these requests. The Executive Officer shall post the final Annual Crude Average carbon intensity value at the ARB-LCFS website within 15 days of completion of the comment period, if no comments are received. If comments are received, the Executive Officer shall post the final Annual Crude Average carbon intensity value within 30 days of completion of the comment period or within 25 days of the latest request by the Executive Officer for additional information or clarification from a commenter, whichever is later. Calculation of 2014, 2015 and 2016 Annual Crude Average Carbon Intensity Values: In table 1, California crude volumes and Annual Crude Average carbon intensity values for 2014, 2015 and 2016 are shown. In tables 2, 3 and 4, breakdowns of the sources of crude oil supplied to California refineries during 2014, 2015 and 2016 as well as the carbon intensity values assigned to these crude sources are displayed. All crude oil produced in and offshore of California during the time period of 2014 to 2016 was assumed to be refined in California.2 The volume contributions for California produced crudes are based on oil production data obtained from the California Department of Conservation.3 The volume contributions for California federal offshore crudes are based on oil production data obtained from the Bureau of Safety and Environmental Enforcement.4 The volume contributions of imported crudes are based on oil supply data submitted by refineries as part of annual LCFS reporting. The annual crude average carbon intensity values are a volume-weighted average of the carbon intensities for the crudes supplied in a given year.
1 The LCFS regulation is found at California Code of Regulations (CCR), title 17, sections 95480-95497. Subsequent section references are to CCR title 17. 2 The total volume of California state and federal offshore crude supplied to California refineries as reported to ARB was 630 million barrels, which closely matches the total volume reported by oil producers to California Department of Conservation and Bureau of Safety and Environmental Enforcement of 626 million barrels. 3 California Department of Conservation, Online Production and Injection Query and Database, http://opi.consrv.ca.gov/opi/opi.dll (accessed April 17, 2015, May 19, 2016 and May 10, 2017). 4 Bureau of Safety and Environmental Enforcement website https://www.data.bsee.gov/Main/PacificProduction.aspx (accessed April 17, 2015, April 21, 2016 and May 11, 2017).
1

June 7, 2017
Table 1: Crude Volumes and Annual Crude Average Carbon Intensity Values
Year 2014 2015 2016 CI (gCO2e/MJ) 11.19 12.06 12.14 Volume (bbl) 612,332,497 605,749,048 582,101,235
Calculation of California Baseline Crude Average Carbon Intensity: 𝐶𝐶𝐶𝐶𝐵𝐵𝐵𝐵𝐵𝐵𝐵𝐵𝐵𝐵𝐵𝐵𝐵𝐵𝐵𝐵𝐵𝐵𝐵𝐵𝐵𝐵𝐵𝐵𝐵𝐵𝐵𝐵𝐵𝐵𝐵𝐵 is the California Baseline Crude Average carbon intensity value, in gCO2e/MJ, attributed to the production and transport of the crude oil supplied as petroleum feedstock to California refineries during the baseline calendar year, 2010, and is calculated by the following formula for the 2016 compliance period: 𝐶𝐶𝐶𝐶𝐵𝐵𝐵𝐵𝐵𝐵𝐵𝐵𝐵𝐵𝐵𝐵𝐵𝐵𝐵𝐵𝐵𝐵𝐵𝐵𝐵𝐵𝐵𝐵𝐵𝐵𝐵𝐵𝐵𝐵𝐵𝐵 =
[11.39 × 612,332,497 + 11.98 × 605,749,048 + 11.98 × 582,101,235][612,332,497 + 605,749,048 + 582,101,235]
𝐶𝐶𝐶𝐶𝐵𝐵𝐵𝐵𝐵𝐵𝐵𝐵𝐵𝐵𝐵𝐵𝐵𝐵𝐵𝐵𝐵𝐵𝐵𝐵𝐵𝐵𝐵𝐵𝐵𝐵𝐵𝐵𝐵𝐵𝐵𝐵 = 11.78
Calculation of Three-Year California Crude Average Carbon Intensity: 𝐶𝐶𝐶𝐶2016𝐵𝐵𝐵𝐵𝐵𝐵𝐵𝐵𝐵𝐵𝐵𝐵𝐵𝐵𝐵𝐵 is the Three-year California Crude Average carbon intensity value, in gCO2e/MJ, attributed to the production and transport of the crude oil supplied as petroleum feedstock to California refineries during the most recent three calendar years (2014, 2015 and 2016), and is calculated by the following formula:
𝐶𝐶𝐶𝐶2016𝐵𝐵𝐵𝐵𝐵𝐵𝐵𝐵𝐵𝐵𝐵𝐵𝐵𝐵𝐵𝐵 =[11.19 × 612,332,497 + 12.06 × 605,749,048 + 12.14 × 582,101,235]
[612,332,497 + 605,749,048 + 582,101,235]
𝐶𝐶𝐶𝐶2016𝐵𝐵𝐵𝐵𝐵𝐵𝐵𝐵𝐵𝐵𝐵𝐵𝐵𝐵𝐵𝐵 = 11.79
Summary: The Three-year California Crude Average carbon intensity of 11.79 gCO2e/MJ is less than the California Baseline Crude Average carbon intensity of 11.78 gCO2e/MJ plus 0.10 gCO2e/MJ. Therefore, no incremental deficits for CARBOB or diesel will be added to each affected regulated party’s compliance obligation for the annual compliance period of 2018.
2

June 7, 2017
Table 2: 2014 Refinery Crude Supply
Country/State Crude Name CI (g/MJ)
2014 Volume (bbl)
2014 Volume Weighted Average CI 11.19 612,332,497 Angola Clov 11.39 1,955,065 Pazflor 11.39 11,305,783 Brazil Albacora Leste 7.35 554,900 Lula 11.39 114,572 Sapinhoa 11.39 6,063,680 Canada Access Western Blend 11.39 4,074,970 Albian Heavy Synthetic 21.02 746,514 Albian Vacuum Blend 11.39 124,685 Canadian Heavy 11.39 51,871 Cold Lake 18.74 5,334,932 Fosterton 11.39 609,584 High Prairie Bitumen 11.39 92,820 Kearl Lake 11.39 546,566 Koch Alberta 7.61 87,459 Light Sweet 11.39 162,424 McKay Heavy 11.39 549,285 Mixed Sweet 7.75 371,558 Peace River Sour 11.39 33,421 Premium Albian Synthetic 11.39 672,100 Seal Bitumen 11.39 17,980 Suncor Synthetic (all grades) 24.49 710,900 Surmont 11.39 918,406 Western Canadian Select 11.39 9,390 Colombia Castilla 6.45 12,729,107 Magdalena 11.39 5,804,028 South Blend 11.39 3,021,157 Vasconia 6.63 9,858,634 Ecuador Napo 7.45 17,364,711 Oriente 9.34 36,382,389 Equatorial Guinea Ceiba 11.39 1,474,959 Iraq Basra Light 12.08 70,562,909 Mexico Isthmus 11.39 4,318,914 Neutral Zone Eocene 5.59 535,800 Peru Loreto 5.82 2,729,775 Mayna 7.14 415,167 Russia ESPO 12.09 752,695
3

June 7, 2017
Sokol 11.39 2,025,198 Saudi Arabia Arab Extra Light 6.86 30,663,255 Arab Light 6.75 73,768,778 Arab Medium 11.39 2,037,200 Venezuela Boscan 12.53 1,036,380 Hamaca 11.39 653,984 Hamaca DCO 11.39 919,900 US Alaska ANS 12.81 70,438,234 US Colorado Niobrara 11.39 880,842 US Louisiana GCA 11.39 162,695 US New Mexico Four Corners 11.39 1,129,938 New Mexico Sweet 11.39 85,329 US North Dakota Bakken 11.39 3,089,846 US Utah Covenant 11.39 259,064 Utah Sweet 11.39 913,318 Utah Black Wax 11.39 220,976 US Wyoming Wyoming 11.39 618,489 US California* Aliso Canyon 1.97 207,560 Ant Hill 26.37 48,791 Antelope Hills 2.69 121,034 Antelope Hills, North 13.16 316,664 Arroyo Grande 27.81 422,592 Asphalto 7.92 229,677 Bandini 7.75 5,875 Bardsdale 5.24 170,049 Barham Ranch 2.74 83,030 Beer Nose 2.18 13,206 Belgian Anticline 3.62 38,754 Bellevue 8.27 27,654 Bellevue, West 8.63 10,295 Belmont, Offshore 3.19 670,435 Belridge, North 5.00 2,372,083 Belridge, South 14.49 23,578,653 Beverly Hills 3.33 685,013 Big Mountain 3.15 28,992 Blackwells Corner 11.05 11,618 Brea-Olinda 2.97 1,074,529 Buena Vista 13.61 1,170,187 Burrel 16.44 14,858 Cabrillo 2.84 24,378 Canal 4.04 27,497
4

June 7, 2017
Canfield Ranch 3.58 105,820 Caneros Creek 2.96 20,001 Cascade 2.20 132,485 Casmalia 11.61 200,271 Castaic Hills 2.79 6,264 Cat Canyon 5.09 1,579,569 Cheviot Hills 3.06 46,751 Chico-Martinez 3.83 168,064 Cienaga Canyon 3.89 25,550 Coalinga 25.36 6,105,373 Coles Levee, N 3.47 207,319 Coles Levee, S 4.27 72,539 Comanche 10.75 28,858 Coyote, East 5.59 243,727 Cuyama, South 11.86 208,230 Cymric 19.91 15,685,203 Deer Creek 18.29 46,115 Del Valle 4.30 55,590 Devils Den 3.63 17,519 Edison 9.03 833,919 El Segundo 2.98 26,397 Elk Hills 5.36 11,811,836 Elwood, S., Offshore 4.18 1,366,871 Fruitvale 10.24 451,811 Greeley 8.14 113,322 Hasley Canyon 2.07 30,034 Helm 3.35 63,708 Holser 3.01 18,383 Honor Rancho 2.69 50,500 Huntington Beach 7.80 2,314,022 Hyperion 1.65 9,839 Inglewood 8.74 2,664,143 Jacalitos 2.22 124,479 Jasmin 17.54 125,925 Kern Front 25.06 4,619,561 Kern River 9.55 25,264,002 Kettleman Middle Dome 3.53 63,295 Kettleman North Dome 4.70 75,584 Landslide 10.49 32,727 Las Cienegas 4.46 295,786 Livermore 2.17 12,538
5
June 7, 2017
Lompoc 31.05 342,134 Long Beach 5.12 1,402,368 Long Beach Airport 3.73 11,527 Los Angeles Downtown 4.11 14,374 Los Angeles, East 8.28 28,091 Lost Hills 11.40 11,219,489 Lost Hills, Northwest 4.35 24,919 Lynch Canyon 7.73 291,504 Mahala 3.57 10,886 McCool Ranch 1.71 21,835 McDonald Anticline 4.92 63,620 McKittrick 15.47 3,131,900 Midway-Sunset 21.18 29,287,992 Montalvo, West 2.63 572,639 Montebello 10.29 513,055 Monument Junction 3.81 109,107 Mount Poso 20.57 1,258,638 Mountain View 4.42 100,261 Newhall-Potrero 2.83 113,963 Newport, West 4.33 87,783 Oak Canyon 3.81 23,370 Oak Park 2.13 17,116 Oakridge 2.57 147,570 Oat Mountain 1.90 83,680 Ojai 3.27 264,077 Olive 1.93 85,627 Orcutt 12.52 1,369,801 Oxnard 16.89 336,359 Paloma 3.42 19,238 Placerita 31.66 896,067 Playa Del Rey 6.04 52,031 Pleito 4.01 982,619 Poso Creek 28.41 3,606,689 Pyramid Hills 2.92 55,326 Railroad Gap 6.56 98,623 Raisin City 7.64 126,411 Ramona 3.37 42,709 Richfield 3.63 312,338 Rincon 2.93 292,997 Rio Bravo 4.85 343,180 Rio Viejo 2.50 52,281
6

June 7, 2017
Riverdale 2.99 64,401 Rose 2.10 605,610 Rosecrans 5.18 154,072 Rosecrans, South 3.11 9,583 Rosedale 6.60 10,095 Rosedale Ranch 8.84 154,135 Round Mountain 28.73 4,225,365 Russell Ranch 6.56 58,546 Salt Lake 2.82 57,511 Salt Lake, South 3.68 29,412 San Ardo 28.82 7,682,477 San Miguelito 4.44 451,169 San Vicente 2.31 266,409 Sansinena 2.54 160,505 Santa Clara Avenue 3.31 53,044 Santa Fe Springs 11.34 1,058,837 Santa Maria Valley 6.48 229,496 Santa Susana 3.14 15,871 Sargent 4.77 32,284 Saticoy 3.26 39,774 Sawtelle 2.83 186,785 Seal Beach 4.07 450,916 Semitropic 3.39 40,063 Sespe 2.91 477,032 Shafter, North 2.54 787,194 Shiells Canyon 3.24 81,063 South Mountain 3.10 741,363 Stockdale 1.71 124,938 Tapia 6.42 26,369 Tapo Canyon, South 2.87 9,283 Tejon 7.96 460,092 Tejon Hills 5.74 13,800 Tejon, North 4.72 38,037 Temescal 3.10 72,793 Ten Section 6.22 91,380 Timber Canyon 3.30 31,586 Torrance 4.45 367,184 Torrey Canyon 2.88 118,353 Union Avenue 1.79 9,713 Ventura 4.35 5,089,921 Wayside Canyon 2.93 24,046
7

June 7, 2017
West Mountain 2.89 9,239 Wheeler Ridge 3.34 74,985 White Wolf 1.64 11,879 Whittier 2.51 95,020 Wilmington 6.36 14,240,290 Yowlumne 11.22 176,201 Zaca 10.45 245,055 US Federal OCS Beta 1.74 1,732,242 Carpinteria 2.62 355,317 Dos Cuadras 3.83 933,465 Hondo 4.27 5,180,905 Hueneme 4.33 96,849 Pescado 3.45 2,667,240 Point Arguello 8.68 1,306,278 Point Pedernales 6.00 1,722,801 Sacate 2.33 2,945,500 Santa Clara 2.41 633,594 Sockeye 5.82 851,044
8

June 7, 2017
Table 3: 2015 Refinery Crude Supply
Country/State Crude Name CI (g/MJ)
2015 Volume (bbl)
2015 Volume Weighted Average CI 12.06 605,749,048 Angola Clov 8.25 4,204,843 Girassol 10.33 1,118,099 Greater Plutonio 9.78 1,774,496 Hungo 9.10 1,486,409 Pazflor 8.91 3,119,864 Sangos 11.98 3,051,709 Australia Pyrenees 5.99 454,412 Vincent 5.05 652,505 Belize Belize Light 11.98 360,417 Brazil Bijupira Salema 8.08 433,868 Iracema (Cernambi) 11.98 5,078,582 Lula 9.94 2,931,225 Ostra 6.54 337,723 Peregrino 11.98 302,079 Sapinhoa 8.53 5,694,501 Tubarao Azul 11.98 26,098 Tubarao Martelo 11.98 104,143 Canada Access Western Blend 16.31 247,794 Albian Heavy Synthetic (all grades) 19.90 1,463,238 Boundary Lake 8.27 102,760 Burnaby Blend 11.98 154,030 Canadian Conventional Heavy 9.27 269,969 Cold Lake 18.40 3,605,136 Kearl Lake 12.05 308,662 Mixed Sweet 8.27 1,707,626 Shell Synthetic (all grades) 21.39 199,994 Suncor Synthetic (all grades) 23.71 2,286,703 Surmont Heavy Blend 18.26 792,787 Wabasca 6.79 269,509 Western Canadian Select 18.43 29,942 Colombia Castilla 9.61 4,374,828 Magdalena 21.01 3,066,144 South Blend 9.22 3,669,732 Vasconia 9.33 30,722,134
9
June 7, 2017
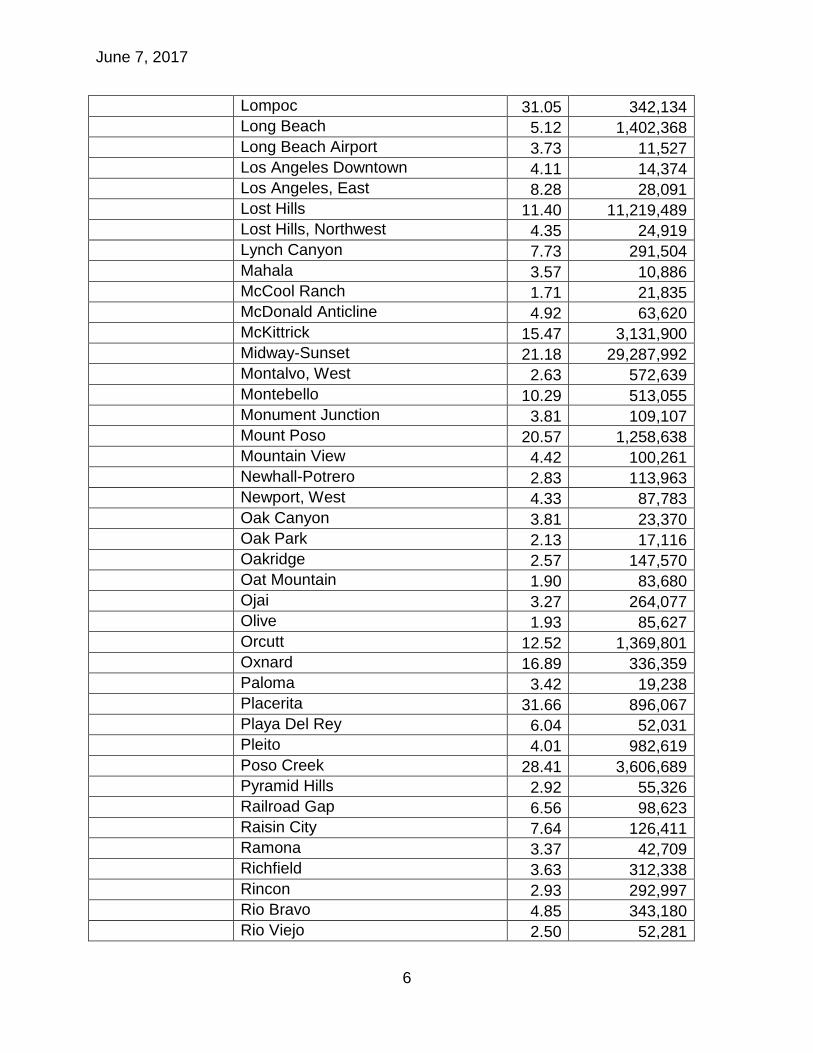
Ecuador Napo 9.56 23,122,264 Oriente 10.90 39,409,691 Equatorial Guinea Ceiba 10.88 1,713,733 Iraq Basra Light 13.08 17,149,050 Kuwait Kuwait 10.31 26,477,992 Mexico Isthmus 10.16 359,910 Peru Loreto 8.23 687,938 Pirana 11.98 249,579 Russia ESPO 13.70 3,264,866 Sokol 10.51 536,721 Saudi Arabia Arab Extra Light 9.35 27,322,040 Arab Light 9.15 81,249,853 Arab Medium 8.66 5,423,168 Venezuela Boscan 10.76 1,602,120 Hamaca DCO 7.63 692,490 US Alaska ANS 12.93 75,321,220 US Colorado Niobrara 8.03 1,330,366 US Gulf of Mexico Mars 11.98 304,100 US Louisiana GCA 11.98 93,626 US New Mexico Four Corners 9.37 1,263,943 New Mexico Sweet 9.37 236,315 US North Dakota Bakken 10.18 862,859 US Texas Eagle Ford Shale 12.03 134,093 US Utah Utah Sweet 5.99 351,327 Utah Black Wax 5.09 169,700 US Wyoming Wyoming Sweet 24.11 70,744 US California* Aliso Canyon 4.16 194,618 Ant Hill 22.04 42,769 Antelope Hills 6.56 111,775 Antelope Hills, North 19.14 336,624 Arroyo Grande 29.33 498,091 Asphalto 8.00 225,255 Bandini 6.78 5,910 Bardsdale 3.63 268,388 Barham Ranch 2.64 77,361 Beer Nose 2.50 3,706 Belgian Anticline 3.56 35,974
10

June 7, 2017
Bellevue 7.52 31,508 Bellevue, West 4.55 9,164 Belmont, Offshore 4.15 621,834 Belridge, North 4.77 2,329,514 Belridge, South 14.84 22,901,920 Beverly Hills 4.49 670,634 Big Mountain 2.58 25,188 Blackwells Corner 5.03 11,797 Brea-Olinda 3.17 1,071,791 Buena Vista 7.45 1,186,195 Burrel 25.23 14,840 Cabrillo 2.49 22,714 Canal 4.17 23,829 Canfield Ranch 3.99 90,987 Carneros Creek 3.40 19,447 Cascade 2.12 159,831 Casmalia 9.35 198,338 Castaic Hills 2.52 5,812 Cat Canyon 4.08 1,289,170 Cheviot Hills 3.39 31,173 Chico-Martinez 15.81 199,064 Cienaga Canyon 4.08 23,212 Coalinga 27.85 6,780,338 Coles Levee, N 4.56 210,258 Coles Levee, S 2.70 71,286 Comanche 7.88 22,968 Coyote, East 6.15 239,183 Cuyama, South 14.43 192,364 Cymric 19.23 16,544,912 Deer Creek 9.96 38,926 Del Valle 4.73 43,930 Devils Den 5.88 13,338 Edison 15.55 747,779 El Segundo 3.77 25,318 Elk Hills 6.30 11,231,816 Elwood, S., Offshore 3.57 497,254 Fruitvale 3.87 460,887 Greeley 9.60 108,477
11
June 7, 2017
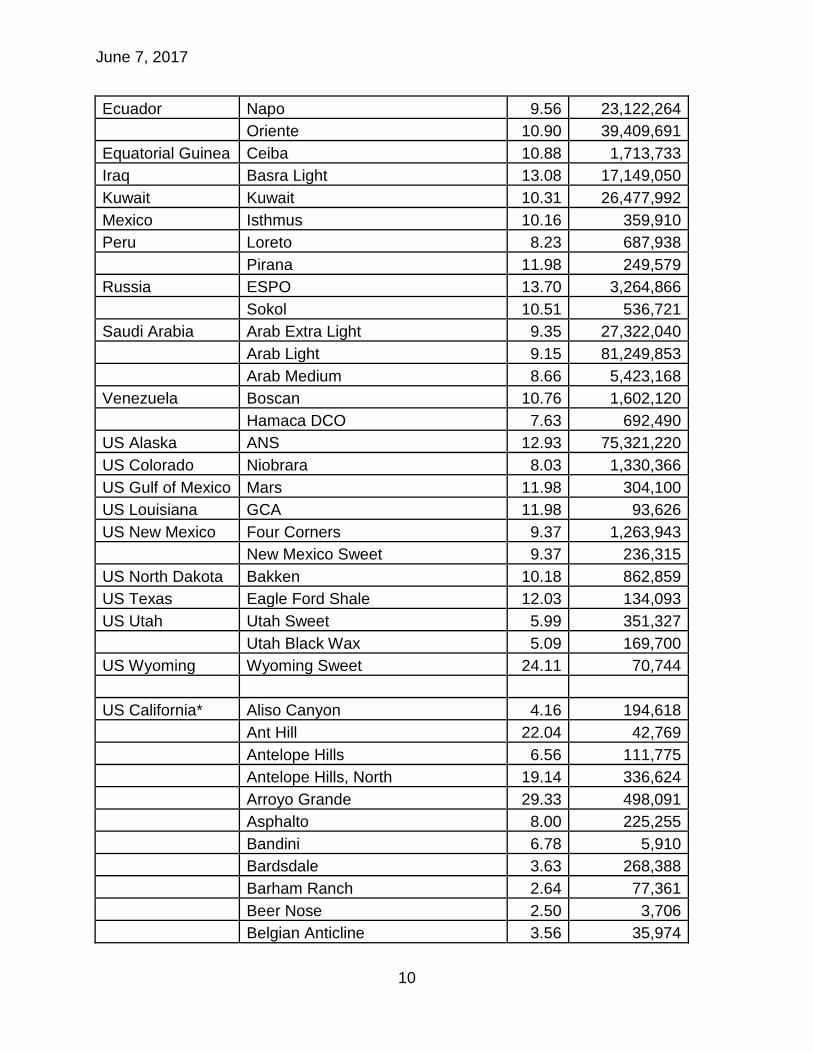
Hasley Canyon 2.15 26,148 Helm 3.93 47,364 Holser 3.04 20,135 Honor Rancho 4.09 70,309 Huntington Beach 5.11 2,472,233 Hyperion 2.05 10,369 Inglewood 9.52 2,376,814 Jacalitos 2.40 113,835 Jasmin 12.77 112,176 Kern Front 25.10 5,005,420 Kern River 9.63 25,684,157 Kettleman Middle Dome 3.70 87,981 Kettleman North Dome 5.14 171,640 Landslide 12.17 31,189 Las Cienegas 4.63 279,585 Livermore 2.56 9,687 Lompoc 19.65 345,984 Long Beach 6.84 1,639,756 Long Beach Airport 4.02 10,101 Los Angeles Downtown 5.71 42,492 Los Angeles, East 10.02 12,161 Lost Hills 10.26 11,209,502 Lost Hills, Northwest 3.91 16,358 Lynch Canyon 12.00 268,814 Mahala 2.70 7,298 McCool Ranch 3.32 27,873 McDonald Anticline 4.30 60,061 McKittrick 24.64 3,334,461 Midway-Sunset 25.05 28,163,266 Montalvo, West 2.28 399,469 Montebello 14.96 507,852 Monument Junction 3.62 96,716 Mount Poso 11.17 1,303,617 Mountain View 3.71 95,609 Newhall-Potrero 2.85 107,690 Newport, West 4.38 85,699 Oak Canyon 3.50 22,522 Oak Park 2.48 13,925
12

June 7, 2017
Oakridge 2.39 113,970 Oat Mountain 2.59 74,677 Ojai 2.75 238,334 Olive 1.98 68,485 Orcutt 12.71 1,140,191 Oxnard 9.16 326,774 Paloma 3.51 17,106 Placerita 31.20 879,526 Playa Del Rey 4.58 46,480 Pleito 2.60 1,249,956 Poso Creek 28.15 4,137,105 Pyramid Hills 3.34 55,893 Railroad Gap 5.05 83,256 Raisin City 8.72 112,082 Ramona 3.41 41,606 Richfield 4.40 296,903 Rincon 3.93 270,538 Rio Bravo 5.75 329,409 Rio Viejo 2.87 42,527 Riverdale 3.74 54,922 Rose 2.70 399,905 Rosecrans 5.52 147,910 Rosecrans, South 3.11 9,467 Rosedale 6.49 17,171 Rosedale Ranch 8.00 149,044 Round Mountain 25.99 3,610,219 Russell Ranch 7.56 48,831 Salt Lake 2.67 46,379 Salt Lake, South 3.84 16,683 San Ardo 27.26 7,795,661 San Miguelito 5.65 422,815 San Vicente 2.47 226,885 Sansinena 2.56 139,140 Santa Clara Avenue 3.49 44,356 Santa Fe Springs 10.50 939,517 Santa Maria Valley 5.15 203,347 Santa Susana 2.93 13,936 Sargent 3.98 26,784
13

June 7, 2017
Saticoy 3.33 34,119 Sawtelle 3.18 187,851 Seal Beach 5.08 420,447 Semitropic 3.48 35,096 Sespe 2.79 404,945 Shafter, North 3.01 598,178 Shiells Canyon 3.38 72,929 South Mountain 3.31 641,600 Stockdale 2.13 127,532 Tapia 7.55 18,789 Tapo Canyon, South 2.92 9,800 Tejon 6.49 365,138 Tejon Hills 6.47 12,846 Tejon, North 3.14 34,268 Temescal 2.75 69,640 Ten Section 6.60 79,708 Timber Canyon 2.99 27,589 Torrance 4.49 364,790 Torrey Canyon 2.73 124,284 Union Avenue 3.57 5,288 Ventura 4.61 4,746,716 Wayside Canyon 1.67 27,229 West Mountain 2.84 9,579 Wheeler Ridge 4.28 102,447 White Wolf 1.88 11,658 Whittier 2.42 96,315 Wilmington 7.02 13,660,268 Yowlumne 10.62 101,829 Zaca 8.16 232,480 US Federal OCS Beta 1.71 2,036,833 Carpinteria 2.85 355,145 Dos Cuadras 4.00 908,709 Hondo 5.54 1,959,967 Hueneme 3.04 115,165 Pescado 5.72 994,848 Point Arguello 14.23 569,983 Point Pedernales 9.38 1,890,073 Sacate 3.59 935,703
14

June 7, 2017
Santa Clara 2.47 823,404 Sockeye 8.35 638,669
15

June 7, 2017
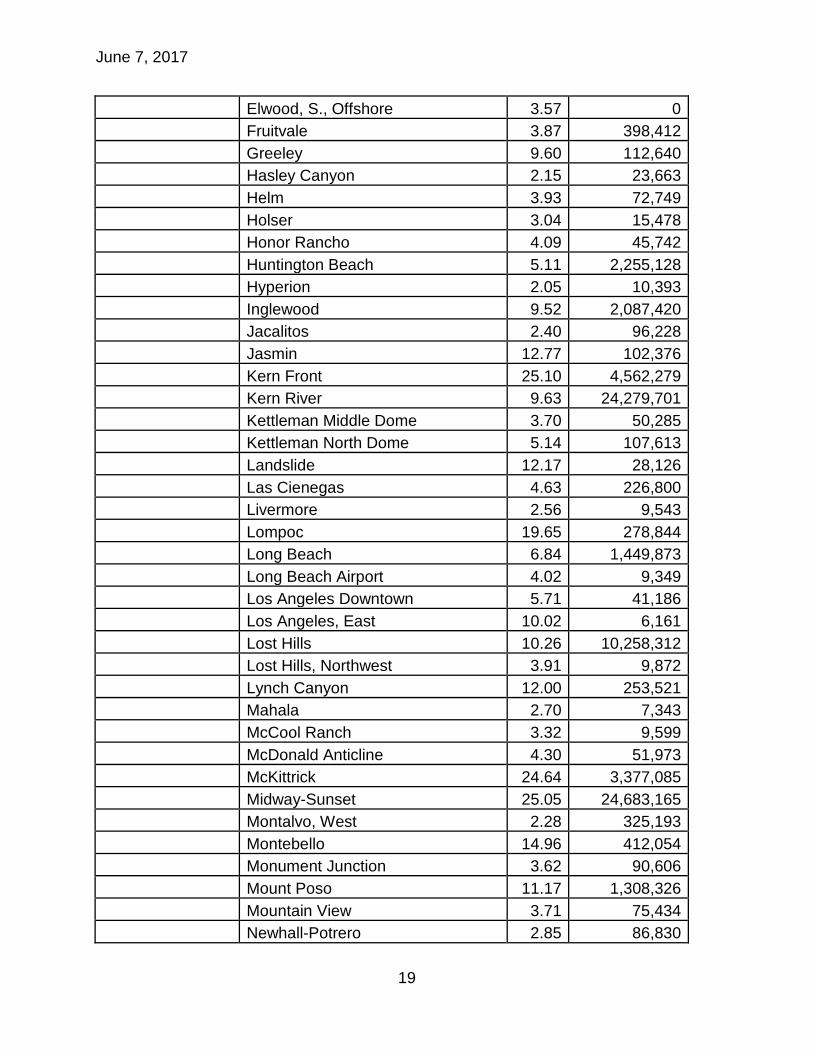
Table 4: 2016 Refinery Crude Supply
Country/State Crude Name CI (g/MJ)
2016 Volume (bbl)
2016 Volume Weighted Average CI 12.14 582,101,235 Angola Clov 8.25 15,190 Dalia 9.78 1,474,555 Girassol 10.33 957,592 Greater Plutonio 9.78 2,091,565 Hungo 9.10 420,075 Pazflor 8.91 5,330,519 Sangos 11.98 735,882 Argentina Escalante 9.30 805,623 Australia Pyrenees 5.99 75,454 Vincent 5.05 657,236 Belize Belize Light 11.98 147,660 Brazil Iracema (Cernambi) 11.98 5,930,893 Lula 9.94 941,247 Papa Terra 11.98 305,180 Sapinhoa 8.53 1,939,517 Tubarao Azul 11.98 63,760 Tubarao Martelo 11.98 710,667 Canada Access Western Blend 16.31 167,231 Albian Heavy Synthetic (all grades) 19.90 1,382,106 Burnaby Blend 11.98 342,430 Canadian Conventional Heavy 9.27 8,028 Christina Dilbit Blend 13.34 71,874 Christina Synbit 17.43 61,151 Cold Lake 18.40 3,205,705 Kearl Lake 12.05 1,235,972 Koch Alberta 8.27 63,119 Mixed Sweet 8.27 320,359 Peace River Sour 8.27 63,807 Suncor Synthetic (all grades) 23.71 557,872 Surmont Heavy Blend 18.26 895,151 Colombia Acordionero 11.98 622,982
Castilla 9.61 4,047,210
Magdalena 21.01 3,658,417 Puerto Bahia 11.98 50,732
16

June 7, 2017
South Blend 9.22 2,517,964 Vasconia 9.33 32,668,178 Ecuador Napo 9.56 30,282,738 Oriente 10.90 43,489,670 Equatorial Guinea Ceiba 10.88 2,194 Zafiro 21.56 596,645 Ghana Ten Blend 11.98 78,119 Iraq Basra Light 13.08 13,028,012 Basra Heavy 11.98 926,750 Kuwait Kuwait 10.31 26,980,599 Mexico Isthmus 10.16 699,917 Nigeria Antan 33.44 556,452 Oman Oman 12.35 10,979,852 Peru Loreto 8.23 228,059 Pirana 11.98 435,001 Russia ESPO 13.70 2,920,405 Sokol 10.51 228,115 Saudi Arabia Arab Extra Light 9.35 25,886,753 Arab Light 9.15 68,991,575 Arab Medium 8.66 12,313,808 UAE Upper Zakum 8.97 995,767 Venezuela Boscan 10.76 17,570 Hamaca DCO 7.63 576,941 Zuata (all grades) 23.51 538,266 US Alaska ANS 12.93 73,604,859 US Colorado Niobrara 8.03 166,664 US New Mexico Four Corners 9.37 836,544 US North Dakota Bakken 10.18 169,116 US Utah Utah Sweet 5.99 14,331 US California* Aliso Canyon 4.16 117,447 Ant Hill 22.04 38,810 Antelope Hills 6.56 94,342 Antelope Hills, North 19.14 289,014 Arroyo Grande 29.33 572,247 Asphalto 8.00 193,898 Bandini 6.78 5,917 Bardsdale 3.63 195,993
17

June 7, 2017
Barham Ranch 2.64 93,236 Beer Nose 2.50 7,033 Belgian Anticline 3.56 30,739 Bellevue 7.52 23,644 Bellevue, West 4.55 8,439 Belmont, Offshore 4.15 561,214 Belridge, North 4.77 2,100,802 Belridge, South 14.84 22,537,553 Beverly Hills 4.49 552,472 Big Mountain 2.58 20,805 Blackwells Corner 5.03 11,285 Brea-Olinda 3.17 1,032,422 Buena Vista 7.45 1,167,228 Burrel 25.23 11,051 Cabrillo 2.49 18,699 Canal 4.17 16,593 Canfield Ranch 3.99 76,102 Carneros Creek 3.40 19,365 Cascade 2.12 131,662 Casmalia 9.35 129,666 Castaic Hills 2.52 6,384 Cat Canyon 4.08 1,185,719 Cheviot Hills 3.39 40,514 Chico-Martinez 15.81 68,133 Cienaga Canyon 4.08 16,950 Coalinga 27.85 6,395,643 Coles Levee, N 4.56 194,790 Coles Levee, S 2.70 64,197 Comanche 7.88 16,793 Coyote, East 6.15 235,254 Cuyama, South 14.43 168,558 Cymric 19.23 16,944,262 Deer Creek 9.96 32,255 Del Valle 4.73 30,320 Devils Den 5.88 10,680 Edison 15.55 561,860 El Segundo 3.77 22,416 Elk Hills 6.30 10,053,472
18
June 7, 2017
Elwood, S., Offshore 3.57 0 Fruitvale 3.87 398,412 Greeley 9.60 112,640 Hasley Canyon 2.15 23,663 Helm 3.93 72,749 Holser 3.04 15,478 Honor Rancho 4.09 45,742 Huntington Beach 5.11 2,255,128 Hyperion 2.05 10,393 Inglewood 9.52 2,087,420 Jacalitos 2.40 96,228 Jasmin 12.77 102,376 Kern Front 25.10 4,562,279 Kern River 9.63 24,279,701 Kettleman Middle Dome 3.70 50,285 Kettleman North Dome 5.14 107,613 Landslide 12.17 28,126 Las Cienegas 4.63 226,800 Livermore 2.56 9,543 Lompoc 19.65 278,844 Long Beach 6.84 1,449,873 Long Beach Airport 4.02 9,349 Los Angeles Downtown 5.71 41,186 Los Angeles, East 10.02 6,161 Lost Hills 10.26 10,258,312 Lost Hills, Northwest 3.91 9,872 Lynch Canyon 12.00 253,521 Mahala 2.70 7,343 McCool Ranch 3.32 9,599 McDonald Anticline 4.30 51,973 McKittrick 24.64 3,377,085 Midway-Sunset 25.05 24,683,165 Montalvo, West 2.28 325,193 Montebello 14.96 412,054 Monument Junction 3.62 90,606 Mount Poso 11.17 1,308,326 Mountain View 3.71 75,434 Newhall-Potrero 2.85 86,830
19

June 7, 2017
Newport, West 4.38 78,895 Oak Canyon 3.50 17,241 Oak Park 2.48 13,575 Oakridge 2.39 105,395 Oat Mountain 2.59 69,853 Ojai 2.75 198,628 Olive 1.98 178,824 Orcutt 12.71 890,961 Oxnard 9.16 426,749 Paloma 3.51 14,134 Placerita 31.20 607,757 Playa Del Rey 4.58 41,011 Pleito 2.60 876,063 Poso Creek 28.15 4,202,196 Pyramid Hills 3.34 45,223 Railroad Gap 5.05 95,243 Raisin City 8.72 142,831 Ramona 3.41 36,210 Richfield 4.40 265,445 Rincon 3.93 221,383 Rio Bravo 5.75 271,503 Rio Viejo 2.87 47,037 Riverdale 3.74 47,419 Rose 2.70 282,185 Rosecrans 5.52 129,620 Rosecrans, South 3.11 8,718 Rosedale 6.49 12,202 Rosedale Ranch 8.00 115,929 Round Mountain 25.99 2,574,219 Russell Ranch 7.56 45,729 Salt Lake 2.67 48,016 Salt Lake, South 3.84 13,147 San Ardo 27.26 7,925,192 San Miguelito 5.65 367,385 San Vicente 2.47 217,116 Sansinena 2.56 131,923 Santa Clara Avenue 3.49 29,098 Santa Fe Springs 10.50 877,266
20

June 7, 2017
Santa Maria Valley 5.15 131,612 Santa Susana 2.93 8,342 Sargent 3.98 24,557 Saticoy 3.33 29,695 Sawtelle 3.18 172,525 Seal Beach 5.08 386,176 Semitropic 3.48 28,829 Sespe 2.79 372,585 Shafter, North 3.01 555,299 Shiells Canyon 3.38 61,966 South Mountain 3.31 542,001 Stockdale 2.13 116,181 Tapia 7.55 15,616 Tapo Canyon, South 2.92 6,464 Tejon 6.49 276,201 Tejon Hills 6.47 9,994 Tejon, North 3.14 33,072 Temescal 2.75 69,405 Ten Section 6.60 67,512 Timber Canyon 2.99 25,068 Torrance 4.49 332,852 Torrey Canyon 2.73 112,770 Union Avenue 3.57 565 Ventura 4.61 4,505,876 Wayside Canyon 1.67 10,478 West Mountain 2.84 9,572 Wheeler Ridge 4.28 69,873 White Wolf 1.88 11,611 Whittier 2.42 65,846 Wilmington 7.02 12,551,717 Yowlumne 10.62 63,751 Zaca 8.16 210,226 US Federal OCS Beta 1.71 1,923,383 Carpinteria 2.85 324,308 Dos Cuadras 4.00 897,918 Hondo 5.54 0 Hueneme 3.04 104,855 Pescado 5.72 0
21

June 7, 2017
Point Arguello 14.23 0 Point Pedernales 9.38 1,471,041 Sacate 3.59 0 Santa Clara 2.47 739,499 Sockeye 8.35 677,866
*All California fields that produced at least 10,000 bbls during 2013, 2014, or 2015
22