CALCULATION METHOD OF LOAD CONDITIONS FOR …
11
CALCULATION METHOD OF LOAD CONDITIONS FOR PERFORMANCE TEST OF RAIL FASTENINGS OF A FLOATING SLAB TRACK SHINGO TAMAGAWA Department of Track Structures and Components, Railway Technical Research Institute, Japan ABSTRACT This study aims to establish a calculation method of load conditions for a performance test of rail fastenings of a floating slab track. A floating slab track is a type of vibration-reducing tracks. It is composed of rails, rail fastenings and concrete slabs supported by elastic layers such as coil springs. Among these components, the design of rail fastenings is an important factor in determining the performance of the floating slab track. In the design of rail fastenings, the Japanese design standard for railway structures requires that the performance of rail fastenings should be checked by the static loading test at a laboratory. In the performance test, the test load is applied to the rail in consideration of the load dispersion by the track. In this study, an FEM model of the floating slab track is developed to estimate the dispersed forces. It also shows the calculation method of load conditions for a performance test of rail fastening of the floating slab track. Furthermore, the performance test of the rail fastening is performed. Keywords: rail fastening, floating slab track, performance test, load condition, FEM. 1 INTRODUCTION A floating slab track is a type of vibration-reducing tracks and is composed of rail, rail fastenings and concrete slabs supported by elastic layers such as coil springs (Fig. 1). Even among these components, the design of rail fastenings is an important factor in the determining the performance of the floating slab track. In the design of rail fastenings, the Japanese design standard for railway structures (RTRI [2]) requires that the performance of rail fastenings should be checked by the static loading test at a laboratory (hereafter, performance test). Fig. 2 shows examples of the test arrangement for a general rail fastenings. In the test, the test load is applied to the rail in consideration of the load dispersion by the track (Youichi [3]). The dispersed design load, namely vertical rail pressure, lateral rail pressure, and rail tilting moment should be applied to the rail with a single assembled rail fastening. Vertical and lateral rail pressures refer to the dispersed forces that act on a single assembled rail fastening when the wheel load and lateral load act on the track. Rail tilting moment refers to the moment by rail tilting that acts on a single assembled rail fastening and is defined around the central point of the rail bottom surface. These dispersed forces have been estimated using the practical solution based on the torsion theory (Yutaka [4], Takeshi et al. [5]). On the other hand, the author has developed the FEM model of a ballasted track or a general slab track to estimate the dispersed forces mentioned above and has proposed the calculation method of the load conditions for the performance test of rail fastenings based on the FEM results (Shingo et al. [6], Tadashi et al. [7]). However, the conventional FEM model cannot be applied to the floating slab track. In this study, a FEM model of the floating slab track is developed to estimate the dispersed forces and the calculation method of load conditions for a performance test of rail fastening of the floating slab track is shown. Furthermore, the performance test of the rail fastening is performed. Computers in Railways XVII 273 www.witpress.com, ISSN 1743-3509 (on-line) WIT Transactions on The Built Environment, Vol 199, © 2020 WIT Press doi:10.2495/CR200251
Transcript of CALCULATION METHOD OF LOAD CONDITIONS FOR …

CALCULATION METHOD OF LOAD CONDITIONS FOR PERFORMANCE TEST OF RAIL FASTENINGS
OF A FLOATING SLAB TRACK SHINGO TAMAGAWA
Department of Track Structures and Components, Railway Technical Research Institute, Japan
ABSTRACT This study aims to establish a calculation method of load conditions for a performance test of rail fastenings of a floating slab track. A floating slab track is a type of vibration-reducing tracks. It is composed of rails, rail fastenings and concrete slabs supported by elastic layers such as coil springs. Among these components, the design of rail fastenings is an important factor in determining the performance of the floating slab track. In the design of rail fastenings, the Japanese design standard for railway structures requires that the performance of rail fastenings should be checked by the static loading test at a laboratory. In the performance test, the test load is applied to the rail in consideration of the load dispersion by the track. In this study, an FEM model of the floating slab track is developed to estimate the dispersed forces. It also shows the calculation method of load conditions for a performance test of rail fastening of the floating slab track. Furthermore, the performance test of the rail fastening is performed. Keywords: rail fastening, floating slab track, performance test, load condition, FEM.
1 INTRODUCTION A floating slab track is a type of vibration-reducing tracks and is composed of rail, rail fastenings and concrete slabs supported by elastic layers such as coil springs (Fig. 1). Even among these components, the design of rail fastenings is an important factor in the determining the performance of the floating slab track. In the design of rail fastenings, the Japanese design standard for railway structures (RTRI [2]) requires that the performance of rail fastenings should be checked by the static loading test at a laboratory (hereafter, performance test). Fig. 2 shows examples of the test arrangement for a general rail fastenings. In the test, the test load is applied to the rail in consideration of the load dispersion by the track (Youichi [3]). The dispersed design load, namely vertical rail pressure, lateral rail pressure, and rail tilting moment should be applied to the rail with a single assembled rail fastening. Vertical and lateral rail pressures refer to the dispersed forces that act on a single assembled rail fastening when the wheel load and lateral load act on the track. Rail tilting moment refers to the moment by rail tilting that acts on a single assembled rail fastening and is defined around the central point of the rail bottom surface. These dispersed forces have been estimated using the practical solution based on the torsion theory (Yutaka [4], Takeshi et al. [5]). On the other hand, the author has developed the FEM model of a ballasted track or a general slab track to estimate the dispersed forces mentioned above and has proposed the calculation method of the load conditions for the performance test of rail fastenings based on the FEM results (Shingo et al. [6], Tadashi et al. [7]). However, the conventional FEM model cannot be applied to the floating slab track. In this study, a FEM model of the floating slab track is developed to estimate the dispersed forces and the calculation method of load conditions for a performance test of rail fastening of the floating slab track is shown. Furthermore, the performance test of the rail fastening is performed.
Computers in Railways XVII 273
www.witpress.com, ISSN 1743-3509 (on-line) WIT Transactions on The Built Environment, Vol 199, © 2020 WIT Press
doi:10.2495/CR200251

Figure 1: Floating slab track [1]. Figure 2: Performance test arrangement for rail fastenings.
2 FEM MODEL OF A FLOATING SLAB TRACK
2.1 FEM model
Fig. 3 shows the FEM model of a floating slab track. The FEM model is composed of solid elements, plate elements and spring elements. The rail is modelled by solid elements and is supported by 64 rail fastenings, which are spaced at 625 mm intervals. Two slabs are modelled by plate elements and are supported by 32 coil springs, which are spaced at 1,250 mm intervals. The rail clips composed of tip springs and lateral springs are modelled by non-linear elastic spring elements. The tie plates are modelled by plate elements. The springs under the rail and under the tie plates are modelled by the non-linear spring elements as well as the rail clips. The following are the constraining conditions of the respective elements.
• All elements: v=0 on the cross section to which loads are applied • Slabs: u=θy=0 on the side opposite to the rail • Coil springs: u=v=w=θx=θy=θz=0 on the side opposite to the slabs.
Tip spring
Lateral spring
Rail Wheel Load and lateral load
← Gauge corner Field corner →
z
x
y
Coil spring
Slab Tie plate
Spring under rail Spring under tie plate Sym.
Load
Slab (19.98 m length)
Slab (19.98 m length)
z
x
y
Gap (20 mm)
(a) (b)
Figure 3: FEM model of a floating slab track. (a) Rail cross section; and (b) Longitudinal direction.
274 Computers in Railways XVII
www.witpress.com, ISSN 1743-3509 (on-line) WIT Transactions on The Built Environment, Vol 199, © 2020 WIT Press

Here, u, v, and w indicates the displacement in x, y, and z directions and θx, θy, and θz indicates the rotation around x, y, and z axes. The loads are applied to the side of rail head assuming the train loads, which are composed of the wheel load and the lateral load. In this study, FEM analyses executed are non-linear elastic analyses using NASTRAN (ver. 10) software (Siemens [8]). The total values of applied loads are divided into 10 steps. The convergence calculation at each step is performed with the quasi-Newton method.
2.2 Spring coefficients
The spring coefficients were measured prior to the performance test and incorporated into the FEM model. This study focuses on the rail fastening as shown in Fig. 4. The coefficient of the spring under the rail and the tie plate was measured by applying the compression force from 0 kN to 100 kN to the rail as shown in Fig. 5. The coefficient of the tip spring was measured by applying the vertical force to the rail as shown in Fig. 6. The test procedure was done as follows: The initial displacement of rail was set to 0 mm. The rail was pulled up and the rail pad was extracted from under the rail. The force applied to the rail at this time was defined as Pmax. The force was decreased until 0 kN and was increased until Pmax once again. As a result, the relationship between the force and the displacement was measured and was defined as the coefficient of the tip springs. The force at the time of displacement was decreased until 0 mm was defined as the initial clamping force. The coefficient of the lateral springs was measured by applying the lateral force from 0 kN to 60 kN to the rail base as shown in Fig. 7. The coefficient of the coil spring was presented by manufacturer. The relationships between the force and the displacement obtained above were approximated by some lines and the coefficient of each spring was determined as shown in Fig. 8. The spring coefficients of the lateral springs and the tip springs are the values per a clip. The initial clamping force was 4 kN per a clip.
2.3 FEM results
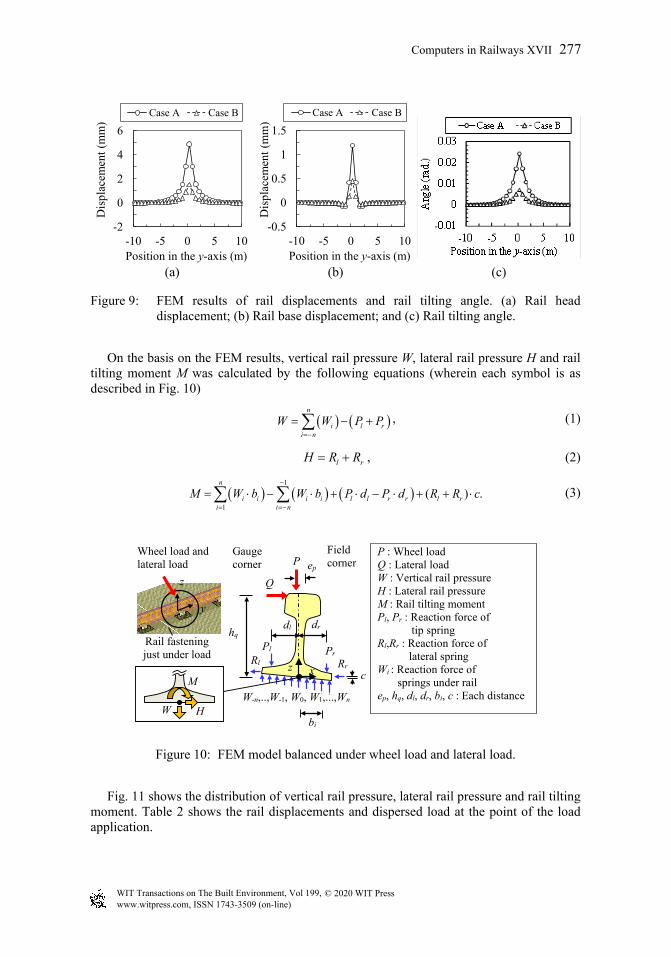
FEM analyses were carried out in two cases (case A and case B). The wheel loads and lateral loads which apply on the FEM model are shown in Table 1. The design load A is applied to the rail from the gauge corner and the design load B is applied from the field corner alternately. These loads are generally used at the sharp curved track. As FEM results, Fig. 9 shows the distribution of rail head displacement, rail base displacement and rail tilting angle.
Figure 4: Rail fastening. Figure 5: Test for spring under rail and tie plate.
Load
Computers in Railways XVII 275
www.witpress.com, ISSN 1743-3509 (on-line) WIT Transactions on The Built Environment, Vol 199, © 2020 WIT Press

Figure 6: Test for tip spring. Figure 7: Test for lateral spring.
-100
-80-60-40-20
020
-3-2-101
Load
(kN
)
Displacement (mm)
-100-80-60-40-20
020
-2-101
Load
(kN
)
Displacement (mm)
-6
-3
0
3
6-10010
Load
(kN
)Displacement (mm)
(a) (b) (c)
-40
-20
0
20
40
-4 0 4
Load
(kN
)
Displacement (mm)
-40
-20
0
20
40
-4 0 4
Load
(kN
)
Displacement (mm) (d) (e)
Figure 8: Spring coefficients of each spring. (a) Spring under rail; (b) Spring under tie plate; (c) Tip spring; (d) Lateral spring; and (e) Coil spring.
Table 1: Wheel load and lateral load (Meter-gauged line, R < 600 m).
Load Case A (Design load A) Case B (Design load B)
Wheel load P 98kN 86kN
Lateral load Q 60kN 30kN
Load
Load
276 Computers in Railways XVII
www.witpress.com, ISSN 1743-3509 (on-line) WIT Transactions on The Built Environment, Vol 199, © 2020 WIT Press
-2
0
2
4
6
-10 -5 0 5 10
Dis
plac
emen
t(m
m)
Position in the y-axis (m)
Case A Case B
(a) (b) (c)
Figure 9: FEM results of rail displacements and rail tilting angle. (a) Rail head displacement; (b) Rail base displacement; and (c) Rail tilting angle.
On the basis on the FEM results, vertical rail pressure W, lateral rail pressure H and rail tilting moment M was calculated by the following equations (wherein each symbol is as described in Fig. 10)
( ) ( )n
i l ri n
W W P P=−
= − +∑ , (1)
l rH R R= + , (2)
( ) ( ) ( )1
1( ) .
n
i i i i l l r r l ri i n
M W b W b P d P d R R c−
= =−
= ⋅ − ⋅ + ⋅ − ⋅ + + ⋅∑ ∑ (3)
W
H
M
Wheel load and lateral load
Gauge corner
Field corner
P
Q
bi
dl
dr
Rr
Pr
Pl
c
ep
hq
x
z
W-n,..,W-1, W0, W1,...,Wn
Rl
P : Wheel load Q : Lateral load W : Vertical rail pressure H : Lateral rail pressure M : Rail tilting moment Pl, Pr : Reaction force of tip spring Rl,Rr : Reaction force of lateral spring Wi : Reaction force of springs under rail ep, hq, dl, dr, bi, c : Each distance
y
z
Rail fastening just under load
Figure 10: FEM model balanced under wheel load and lateral load.
Fig. 11 shows the distribution of vertical rail pressure, lateral rail pressure and rail tilting moment. Table 2 shows the rail displacements and dispersed load at the point of the load application.
-0.5
0
0.5
1
1.5
-10 -5 0 5 10
Dis
plac
emen
t(m
m)
Position in the y-axis (m)
Case A Case B
Computers in Railways XVII 277
www.witpress.com, ISSN 1743-3509 (on-line) WIT Transactions on The Built Environment, Vol 199, © 2020 WIT Press

-100
10203040
-10 -5 0 5 10
Pres
sure
(kN
)
Position in the y-axis (m)
Case A Case B
-100
10203040
-10 -5 0 5 10
Pres
sure
(kN
)Position in the y-axis (m)
Case A Case B
-5000
500100015002000
-10 -5 0 5 10
Mom
ent(
kNm
m)
Position in the y-axis (m)
Case A Case B
(a) (b) (c)
Figure 11: Dispersed design loads estimated from FEM results. (a) Vertical rail pressure; (b) Lateral rail pressure; and (c) Rail tilting moment.
Table 2: Rail displacements and dispersed loads at the point of the load application.
Unit Case A Case BRail head displacement mm 4.88 1.54Rail base displacement mm 1.2 0.45
Rail tilting angle rad. 0.0241 0.0071Vertical rail pressure W kN 31.6 26.3Lateral rail pressure H kN 30.1 17Rail tilting moment M kNmm 1567 564
Item
Rail displacements
Dispersed loads
3 CALCULATION OF LOAD CONDITIONS FOR PERFORMANCE TEST This section shows the method for determining the loading conditions of the performance test based on the FEM results.
3.1 Calculation method
The performance test is performed under bi-axial loading condition in which the loads are applied alternately from the gauge corner and the field corner of test rail as shown in Fig. 12. Test loads LA and LB, the angles of load application θA and θB, and the height of load application h are expressed by the following equations
( ) ( )2 20 0sin cosA A B A BL W L H L= − θ + + θ , (4)
( ) ( )2 20 0sin cosB B A B AL W L H L= − θ + + θ , (5)
01
0
sintancos
A BA
A B
W LH L
− − θ
θ = + θ , (6)
278 Computers in Railways XVII
www.witpress.com, ISSN 1743-3509 (on-line) WIT Transactions on The Built Environment, Vol 199, © 2020 WIT Press

01
0
sintancos
B AB
B A
W LH L
− − θ
θ = + θ , (7)
( )02 sinA A B
A
M e W Lh
H+ − θ
= , (8)
( )02 sinB B A
B
M e W Lh
H+ − θ
= . (9)
Here, WA, HA, and MA or WB, HB, and MB are vertical rail pressure, lateral rail pressure, and rail tilting moment calculated by eqns (1)–(3) when design load A or B are applied. The subscript A or B means Case A or B. L0 is the minimum load applied in the opposite direction to LA or LB and is set at 5 kN–10 kN in consideration of stability of the test. The detail of the solution of eqns (4)–(9) is described in the paper (Shingo et al. [6]).
Gauge corner Field corner
LA: Test load (Gauge corner) LB: Test load (Field corner) θA: Angle of load application (Gauge corner) θB: Angle of load application (Field corner) L0: Minimum load applied during the test (set at 5 kN - 10 kN) h: Height of load application e: Distance between LA or LB and center of test rail
LA θA
h
e
e
θB
L0
L0 θA
h
e
e
θB
LB
Gauge corner Field corner
Figure 12: Bi-axial loading condition for performance test. (a) Design load A; and (b) Design load B.
3.2 Calculation results
Loading condition of the performance test was calculated on the basis of the FEM results. Substituting the values of vertical rail pressure, lateral rail pressure and rail tilting moment shown in Table 2 into eqns (4)–(9), we calculate test loads LA and LB, the angles of load application θA and θB, and the height of load application h as shown in Table 3. L0 and e is set at 5 kN and 30 mm.
Table 3: Load condition of performance test.
Item L A L B θA θB h L 0 eUnit kN kN Degrees Degrees mm kN mm
Value 42.0 29.3 41.2 51.6 80 5 30
Computers in Railways XVII 279
www.witpress.com, ISSN 1743-3509 (on-line) WIT Transactions on The Built Environment, Vol 199, © 2020 WIT Press

4 PERFORMANCE TEST OF THE RAIL FASTENING In order to verify the validity of the calculation of loading condition based on the FEM model, the performance test was carried out. The test result was compared with the FEM results.
4.1 Test procedure
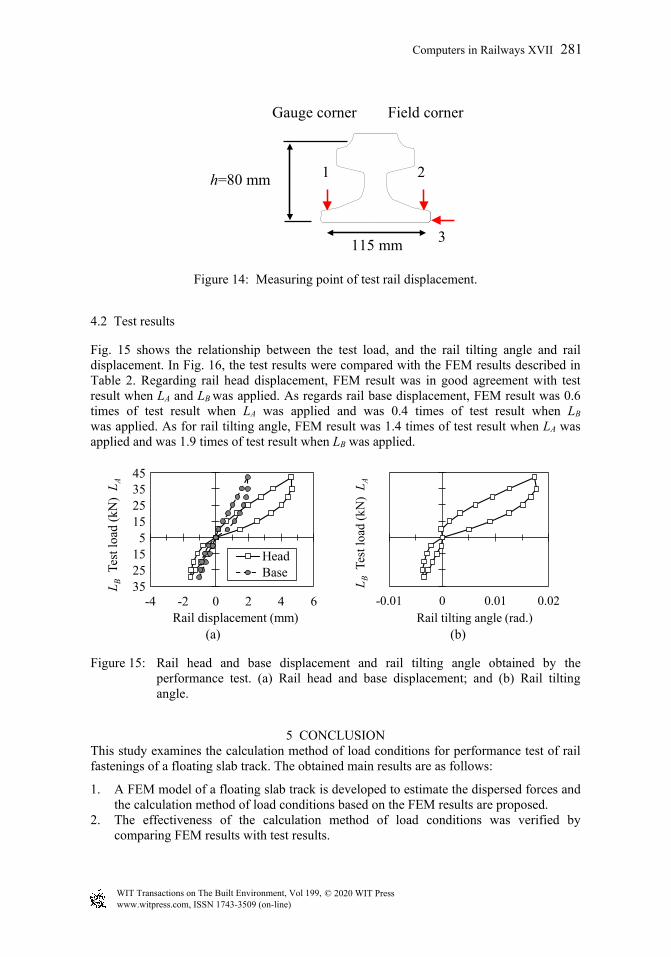
Fig. 13 shows the test specimen. A concrete block cut to the length of 700 mm was set on the testing machine. JIS-50 kgN test rail (height 80 mm) was set on the block and was fastened to the block by the rail fastenings of the floating slab track. Rail clips were fastened by the bolts with 140 Nm, the torque specified in the specifications. The block was fastened to the testing machine firmly without elastic layers. Table 4 shows the process of loading. The load condition refers to Table 3. Fig. 14 shows the measuring points of rail displacement. Rail tilting angle was calculated by dividing the difference between the displacement at measuring point 1 and 2 by the distance between two measuring points (115 mm). Rail base displacement was measured at point 3. We converted rail head displacement into a value of the top of JIS-50 kgN rail by multiplying rail tilting angle by a height of JIS-50 kgN rail (153 mm) and by adding rail base displacement. The direction of lateral displacement from gauge corner to field corner was defined as positive and clockwise rail tilting angle was defined as positive.
LB=29.3kN θB=51.6°
LA=42.0kN θA=41.2°
Gauge corner Field corner
Figure 13: Performance test specimen.
Table 4: Load procedure.
L A : 0 → 5.0L B : 0 → 5.0
L A : 5.0 → 42.0 → 5.0L B : 5.0 (fixed)L A : 5.0 (fixed)
L B : 5.0 → 29.3 → 5.0
Load procedure
Preload
L A
L B
Test load (kN)
280 Computers in Railways XVII
www.witpress.com, ISSN 1743-3509 (on-line) WIT Transactions on The Built Environment, Vol 199, © 2020 WIT Press
115 mm
h=80 mm
Gauge corner Field corner
1
2
3
Figure 14: Measuring point of test rail displacement.
4.2 Test results
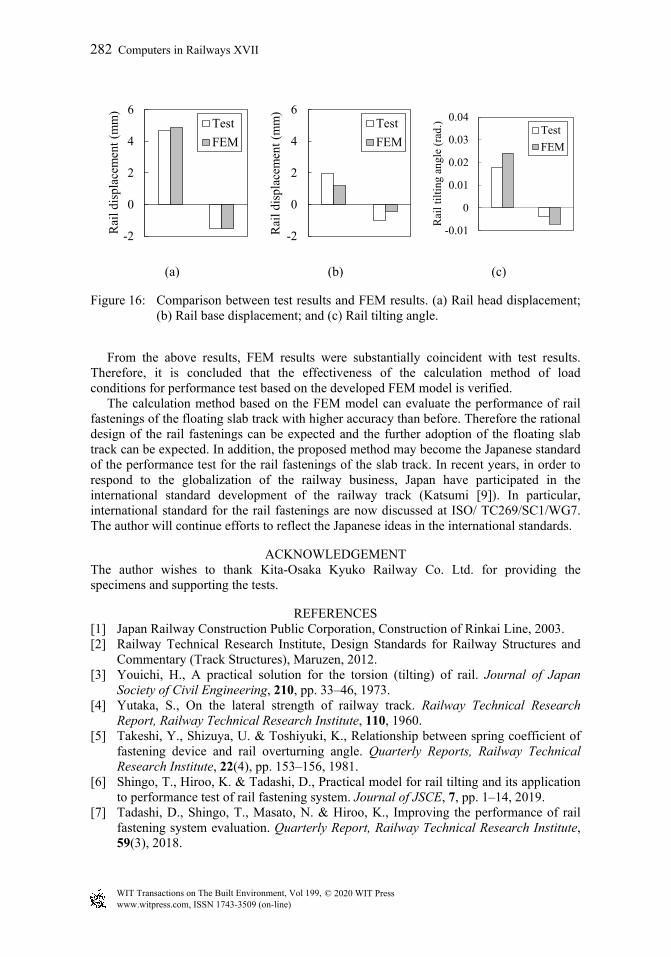
Fig. 15 shows the relationship between the test load, and the rail tilting angle and rail displacement. In Fig. 16, the test results were compared with the FEM results described in Table 2. Regarding rail head displacement, FEM result was in good agreement with test result when LA and LB was applied. As regards rail base displacement, FEM result was 0.6 times of test result when LA was applied and was 0.4 times of test result when LB was applied. As for rail tilting angle, FEM result was 1.4 times of test result when LA was applied and was 1.9 times of test result when LB was applied.
453525155
152535
-4 -2 0 2 4 6
L BTe
stlo
ad(k
N)
L A
Rail displacement (mm)
HeadBase
-0.01 0 0.01 0.02
L BTe
stlo
ad(k
N)
L A
Rail tilting angle (rad.) (a) (b)
Figure 15: Rail head and base displacement and rail tilting angle obtained by the performance test. (a) Rail head and base displacement; and (b) Rail tilting angle.
5 CONCLUSION This study examines the calculation method of load conditions for performance test of rail fastenings of a floating slab track. The obtained main results are as follows:
1. A FEM model of a floating slab track is developed to estimate the dispersed forces and the calculation method of load conditions based on the FEM results are proposed.
2. The effectiveness of the calculation method of load conditions was verified by comparing FEM results with test results.
Computers in Railways XVII 281
www.witpress.com, ISSN 1743-3509 (on-line) WIT Transactions on The Built Environment, Vol 199, © 2020 WIT Press
-2
0
2
4
6R
ail d
ispl
acem
ent (
mm
)TestFEM
-2
0
2
4
6
Rai
l dis
plac
emen
t (m
m)
TestFEM
-0.01
0
0.01
0.02
0.03
0.04
Rai
l tilt
ing
angl
e (ra
d.)
TestFEM
(a) (b) (c)
Figure 16: Comparison between test results and FEM results. (a) Rail head displacement; (b) Rail base displacement; and (c) Rail tilting angle.
From the above results, FEM results were substantially coincident with test results. Therefore, it is concluded that the effectiveness of the calculation method of load conditions for performance test based on the developed FEM model is verified. The calculation method based on the FEM model can evaluate the performance of rail fastenings of the floating slab track with higher accuracy than before. Therefore the rational design of the rail fastenings can be expected and the further adoption of the floating slab track can be expected. In addition, the proposed method may become the Japanese standard of the performance test for the rail fastenings of the slab track. In recent years, in order to respond to the globalization of the railway business, Japan have participated in the international standard development of the railway track (Katsumi [9]). In particular, international standard for the rail fastenings are now discussed at ISO/ TC269/SC1/WG7. The author will continue efforts to reflect the Japanese ideas in the international standards.
ACKNOWLEDGEMENT The author wishes to thank Kita-Osaka Kyuko Railway Co. Ltd. for providing the specimens and supporting the tests.
REFERENCES [1] Japan Railway Construction Public Corporation, Construction of Rinkai Line, 2003. [2] Railway Technical Research Institute, Design Standards for Railway Structures and
Commentary (Track Structures), Maruzen, 2012. [3] Youichi, H., A practical solution for the torsion (tilting) of rail. Journal of Japan
Society of Civil Engineering, 210, pp. 33–46, 1973. [4] Yutaka, S., On the lateral strength of railway track. Railway Technical Research
Report, Railway Technical Research Institute, 110, 1960. [5] Takeshi, Y., Shizuya, U. & Toshiyuki, K., Relationship between spring coefficient of
fastening device and rail overturning angle. Quarterly Reports, Railway Technical Research Institute, 22(4), pp. 153–156, 1981.
[6] Shingo, T., Hiroo, K. & Tadashi, D., Practical model for rail tilting and its application to performance test of rail fastening system. Journal of JSCE, 7, pp. 1–14, 2019.
[7] Tadashi, D., Shingo, T., Masato, N. & Hiroo, K., Improving the performance of rail fastening system evaluation. Quarterly Report, Railway Technical Research Institute, 59(3), 2018.
282 Computers in Railways XVII
www.witpress.com, ISSN 1743-3509 (on-line) WIT Transactions on The Built Environment, Vol 199, © 2020 WIT Press

[8] NX Nastran User’s Guide, Siemens PLM software, 2014. [9] Katsumi, M., Development status of International standards on the rail track and the
trend of the related research of RTRI. RTRI Report, 31(12), pp. 1–4, 2017.
Computers in Railways XVII 283
www.witpress.com, ISSN 1743-3509 (on-line) WIT Transactions on The Built Environment, Vol 199, © 2020 WIT Press