Calculating Available Forage - UW Extension · CALCULATING AVAILABLE FORAGE Mindy Pratt and G....
8
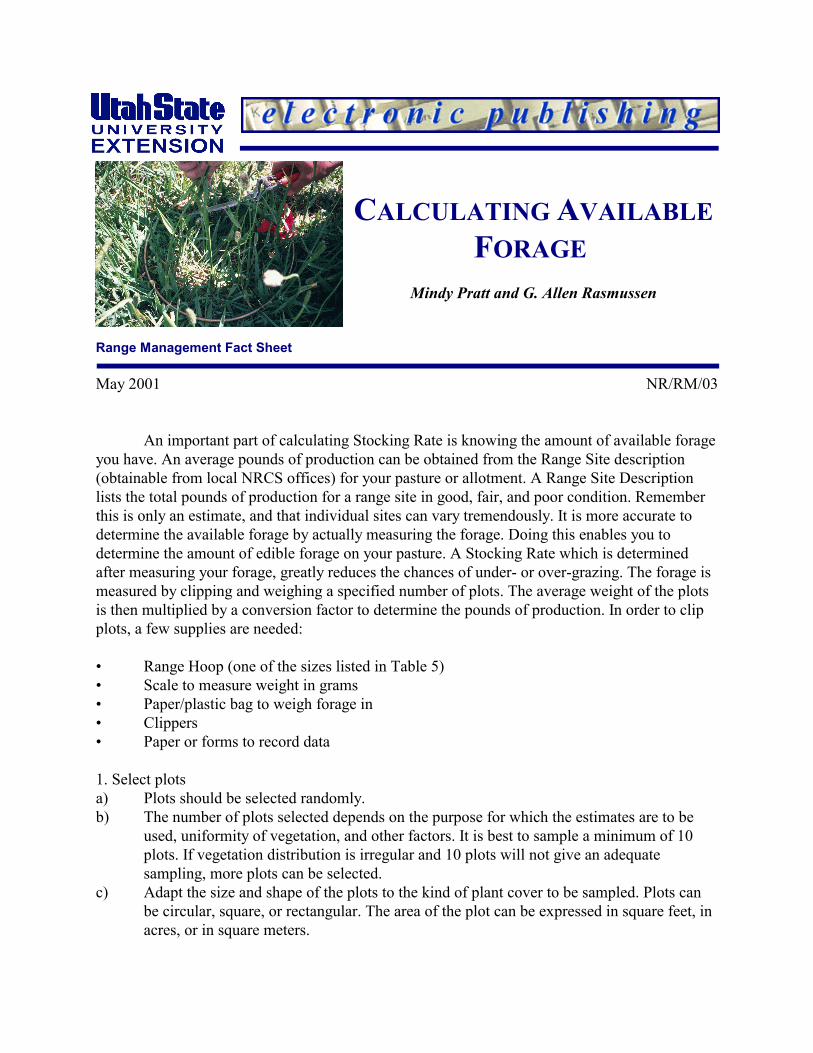
CALCULATING AVAILABLE FORAGE Mindy Pratt and G. Allen Rasmussen Range Management Fact Sheet May 2001 NR/RM/03 An important part of calculating Stocking Rate is knowing the amount of available forage you have. An average pounds of production can be obtained from the Range Site description (obtainable from local NRCS offices) for your pasture or allotment. A Range Site Description lists the total pounds of production for a range site in good, fair, and poor condition. Remember this is only an estimate, and that individual sites can vary tremendously. It is more accurate to determine the available forage by actually measuring the forage. Doing this enables you to determine the amount of edible forage on your pasture. A Stocking Rate which is determined after measuring your forage, greatly reduces the chances of under- or over-grazing. The forage is measured by clipping and weighing a specified number of plots. The average weight of the plots is then multiplied by a conversion factor to determine the pounds of production. In order to clip plots, a few supplies are needed: • Range Hoop (one of the sizes listed in Table 5) • Scale to measure weight in grams • Paper/plastic bag to weigh forage in • Clippers • Paper or forms to record data 1. Select plots a) Plots should be selected randomly. b) The number of plots selected depends on the purpose for which the estimates are to be used, uniformity of vegetation, and other factors. It is best to sample a minimum of 10 plots. If vegetation distribution is irregular and 10 plots will not give an adequate sampling, more plots can be selected. c) Adapt the size and shape of the plots to the kind of plant cover to be sampled. Plots can be circular, square, or rectangular. The area of the plot can be expressed in square feet, in acres, or in square meters.
Transcript of Calculating Available Forage - UW Extension · CALCULATING AVAILABLE FORAGE Mindy Pratt and G....
CALCULATING AVAILABLEFORAGE
Mindy Pratt and G. Allen Rasmussen
Range Management Fact Sheet
May 2001 NR/RM/03
An important part of calculating Stocking Rate is knowing the amount of available forageyou have. An average pounds of production can be obtained from the Range Site description(obtainable from local NRCS offices) for your pasture or allotment. A Range Site Descriptionlists the total pounds of production for a range site in good, fair, and poor condition. Rememberthis is only an estimate, and that individual sites can vary tremendously. It is more accurate todetermine the available forage by actually measuring the forage. Doing this enables you todetermine the amount of edible forage on your pasture. A Stocking Rate which is determinedafter measuring your forage, greatly reduces the chances of under- or over-grazing. The forage ismeasured by clipping and weighing a specified number of plots. The average weight of the plotsis then multiplied by a conversion factor to determine the pounds of production. In order to clipplots, a few supplies are needed:
• Range Hoop (one of the sizes listed in Table 5)• Scale to measure weight in grams• Paper/plastic bag to weigh forage in• Clippers• Paper or forms to record data
1. Select plotsa) Plots should be selected randomly.b) The number of plots selected depends on the purpose for which the estimates are to be
used, uniformity of vegetation, and other factors. It is best to sample a minimum of 10plots. If vegetation distribution is irregular and 10 plots will not give an adequatesampling, more plots can be selected.
c) Adapt the size and shape of the plots to the kind of plant cover to be sampled. Plots canbe circular, square, or rectangular. The area of the plot can be expressed in square feet, inacres, or in square meters.
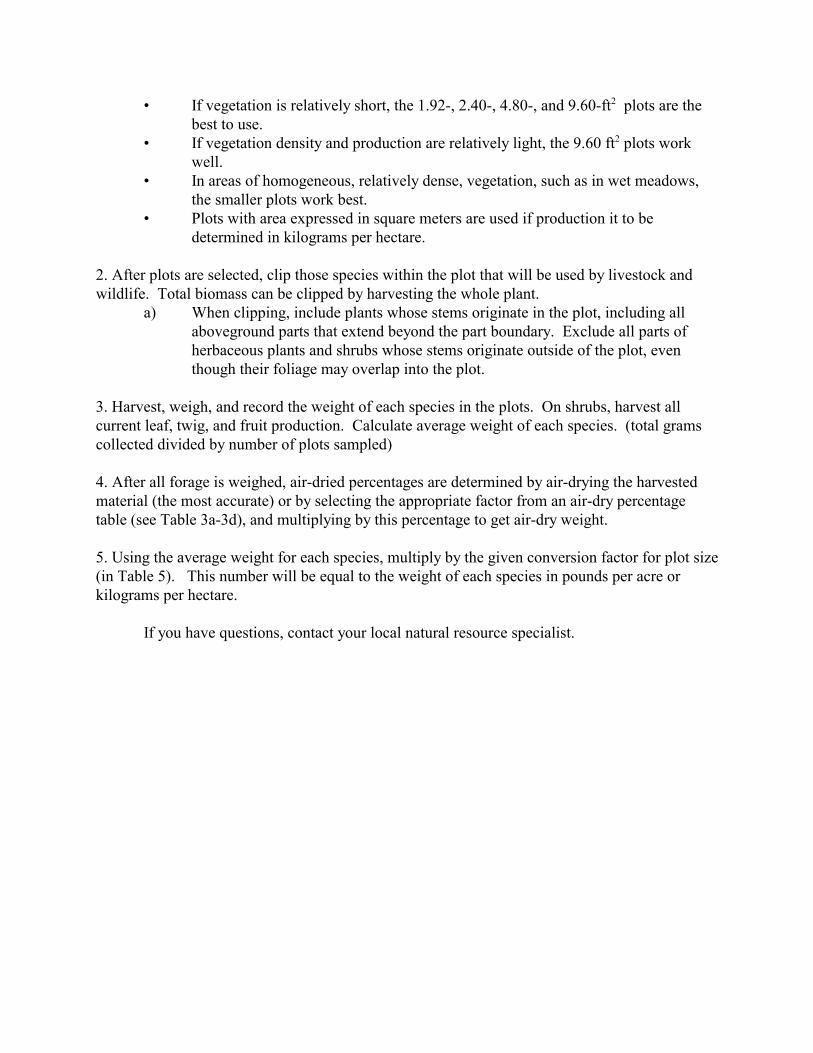
• If vegetation is relatively short, the 1.92-, 2.40-, 4.80-, and 9.60-ft2 plots are thebest to use.
• If vegetation density and production are relatively light, the 9.60 ft2 plots workwell.
• In areas of homogeneous, relatively dense, vegetation, such as in wet meadows,the smaller plots work best.
• Plots with area expressed in square meters are used if production it to bedetermined in kilograms per hectare.
2. After plots are selected, clip those species within the plot that will be used by livestock andwildlife. Total biomass can be clipped by harvesting the whole plant.
a) When clipping, include plants whose stems originate in the plot, including allaboveground parts that extend beyond the part boundary. Exclude all parts ofherbaceous plants and shrubs whose stems originate outside of the plot, eventhough their foliage may overlap into the plot.
3. Harvest, weigh, and record the weight of each species in the plots. On shrubs, harvest allcurrent leaf, twig, and fruit production. Calculate average weight of each species. (total gramscollected divided by number of plots sampled)
4. After all forage is weighed, air-dried percentages are determined by air-drying the harvestedmaterial (the most accurate) or by selecting the appropriate factor from an air-dry percentagetable (see Table 3a-3d), and multiplying by this percentage to get air-dry weight.
5. Using the average weight for each species, multiply by the given conversion factor for plot size(in Table 5). This number will be equal to the weight of each species in pounds per acre orkilograms per hectare.
If you have questions, contact your local natural resource specialist.

TABLE 1: Percentage of air dry matter in harvested grass at various stages of growth
GRASSES
Beforeheading; initialgrowth to boot
stage(%)
Headed out; boot stage to
flowering
(%)
Seed Ripe; leaf tipsdrying
(%)
Leaves dry;stems partly
dry
(%)
Apparentdormancy
(%)
Cool Season (Wheatgrass, perennial brome,bluegrass, prairie junegrass)
35 45 60 85 95
Warm Season Tall Grasses:(Bush muhly, tall dropseed)
30 45 60 85 95
Midgrasses:(Side-oats grama, oniongrass)
40 55 65 90 95
Short grasses:(Blue grama, saltgrass, shortthree-awns)
45 60 80 90 95
(from USDA NRCS National Range and Pasture Handbook)
TABLE 2: Percentage of air dry matter in harvested forbs at various stages of growth
FORBSInitial growthto flowering
(%)
Flowering toseed maturity
(%)
Seed Ripe; leaf tips dry
(%)
Leaves dry;stems dry
(%)
Dry
(%)
Succulent (violet, waterleaf, buttercup,bluebells, onion, lillies)
15 35 60 90 100
Leafy(lupine, balsamroot, tickclover)
20 40 60 90 100
Fibrous leaves or mat(phlox, mat eriogonum,pussytoes)
30 50 75 90 100
(from USDA NRCS National Range and Pasture Handbook)

TABLE 3: Percentage of air dry matter in harvested shrubs at various stages of growth
SHRUBS
New leaf andtwig growth
until leaves arefull size
(%)
Older and full-size green
leaves
(%)
Green Fruit
(%)
Dry Fruit
(%)
Evergreen (big sagebrush, bitterbrush, ephedra,algerita, gallberry)
55 65 35 85
Deciduous(snowberry, rabbitbrush, snakeweed,Gambel oak, mesquite)
35 50 30 85
Yucca and yucca-like plants(yucca, sotol, saw-palmetto)
55 65 35 85
(from USDA NRCS National Range and Pasture Handbook)
TABLE 4: Percentage of air dry matter in harvested trees at various stages of growth
TREES
New leaf andtwig growth
until leaves arefull size
(%)
Older and full-size green
leaves
(%)
Green Fruit
(%)
Dry Fruit
(%)
Evergreen Coniferous (Pine, Juniper, Spruce)
45 55 35 85
Live Oak 40 55 40 80
Deciduous(blackjack oak, post oak, hickory)
40 55 35 85
(from USDA NRCS National Range and Pasture Handbook)
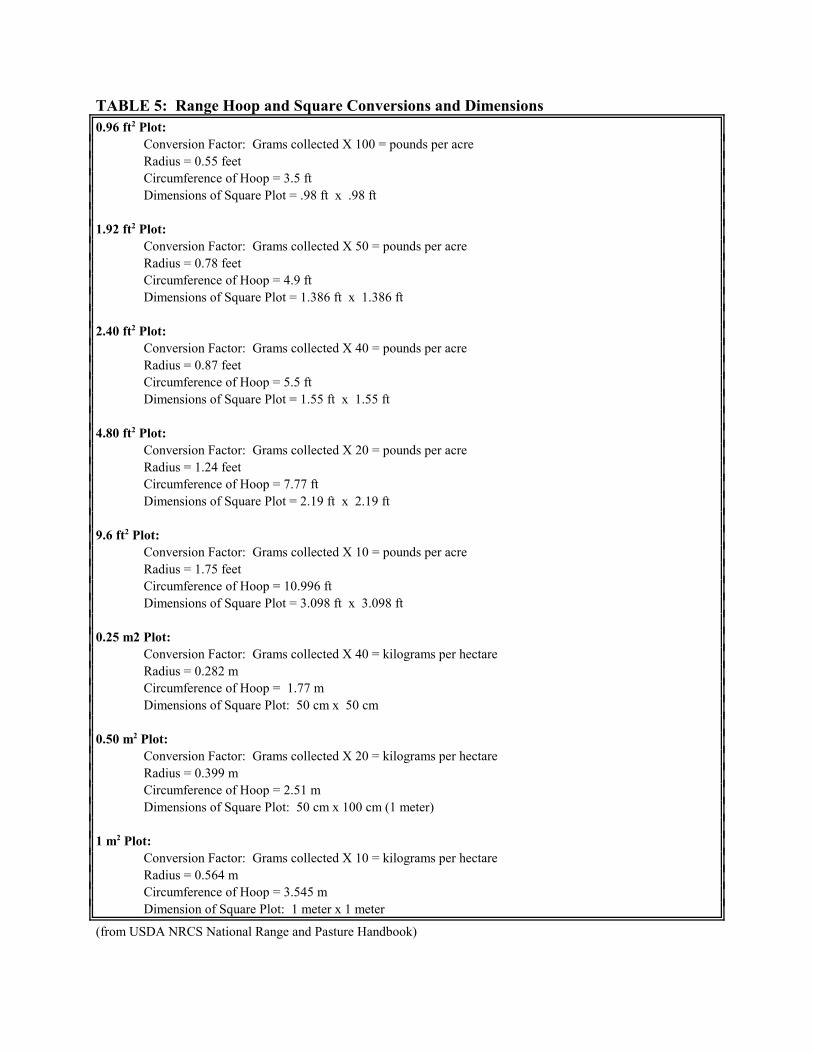
TABLE 5: Range Hoop and Square Conversions and Dimensions0.96 ft2 Plot:
Conversion Factor: Grams collected X 100 = pounds per acreRadius = 0.55 feetCircumference of Hoop = 3.5 ftDimensions of Square Plot = .98 ft x .98 ft
1.92 ft2 Plot:Conversion Factor: Grams collected X 50 = pounds per acreRadius = 0.78 feetCircumference of Hoop = 4.9 ftDimensions of Square Plot = 1.386 ft x 1.386 ft
2.40 ft2 Plot:Conversion Factor: Grams collected X 40 = pounds per acreRadius = 0.87 feetCircumference of Hoop = 5.5 ftDimensions of Square Plot = 1.55 ft x 1.55 ft
4.80 ft2 Plot:Conversion Factor: Grams collected X 20 = pounds per acreRadius = 1.24 feetCircumference of Hoop = 7.77 ftDimensions of Square Plot = 2.19 ft x 2.19 ft
9.6 ft2 Plot:Conversion Factor: Grams collected X 10 = pounds per acreRadius = 1.75 feetCircumference of Hoop = 10.996 ft Dimensions of Square Plot = 3.098 ft x 3.098 ft
0.25 m2 Plot:Conversion Factor: Grams collected X 40 = kilograms per hectareRadius = 0.282 mCircumference of Hoop = 1.77 mDimensions of Square Plot: 50 cm x 50 cm
0.50 m2 Plot:Conversion Factor: Grams collected X 20 = kilograms per hectareRadius = 0.399 mCircumference of Hoop = 2.51 mDimensions of Square Plot: 50 cm x 100 cm (1 meter)
1 m2 Plot:Conversion Factor: Grams collected X 10 = kilograms per hectareRadius = 0.564 mCircumference of Hoop = 3.545 mDimension of Square Plot: 1 meter x 1 meter
(from USDA NRCS National Range and Pasture Handbook)
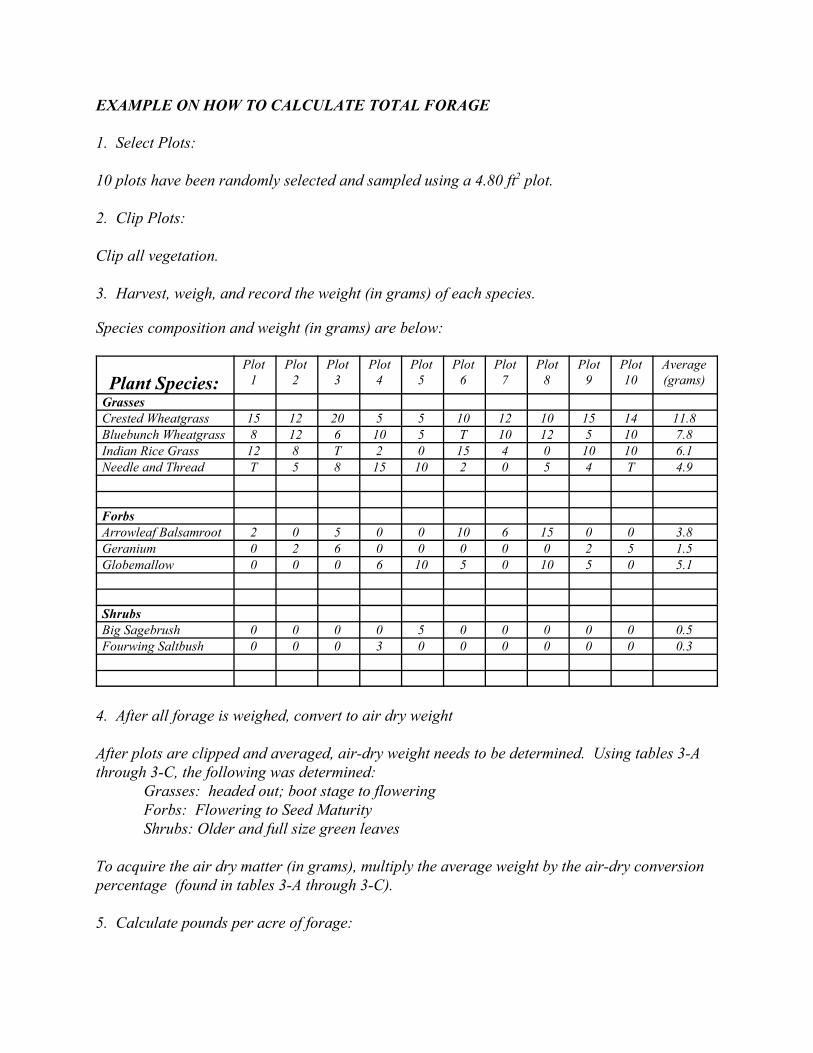
EXAMPLE ON HOW TO CALCULATE TOTAL FORAGE
1. Select Plots:
10 plots have been randomly selected and sampled using a 4.80 ft2 plot. 2. Clip Plots:
Clip all vegetation.
3. Harvest, weigh, and record the weight (in grams) of each species.
Species composition and weight (in grams) are below:
Plant Species:Plot
1Plot
2Plot
3Plot
4Plot
5Plot
6Plot
7Plot
8Plot
9Plot10
Average(grams)
GrassesCrested Wheatgrass 15 12 20 5 5 10 12 10 15 14 11.8Bluebunch Wheatgrass 8 12 6 10 5 T 10 12 5 10 7.8Indian Rice Grass 12 8 T 2 0 15 4 0 10 10 6.1Needle and Thread T 5 8 15 10 2 0 5 4 T 4.9
ForbsArrowleaf Balsamroot 2 0 5 0 0 10 6 15 0 0 3.8Geranium 0 2 6 0 0 0 0 0 2 5 1.5Globemallow 0 0 0 6 10 5 0 10 5 0 5.1
ShrubsBig Sagebrush 0 0 0 0 5 0 0 0 0 0 0.5Fourwing Saltbush 0 0 0 3 0 0 0 0 0 0 0.3
4. After all forage is weighed, convert to air dry weight
After plots are clipped and averaged, air-dry weight needs to be determined. Using tables 3-Athrough 3-C, the following was determined:
Grasses: headed out; boot stage to floweringForbs: Flowering to Seed MaturityShrubs: Older and full size green leaves
To acquire the air dry matter (in grams), multiply the average weight by the air-dry conversionpercentage (found in tables 3-A through 3-C).
5. Calculate pounds per acre of forage:

Utah State University Extension does not discriminate on the basis of race, color, national origin, gender, religion,age, disability, political beliefs, sexual orientation, or marital or family status in employment or program delivery.
Issued in furtherance of Cooperative Extension work, Acts of May 8 and June 30, 1914, in cooperation with the U.S.Department of Agriculture, Robert L. Gilliland, Vice-President and Director, Cooperative Extension Service, Utah StateUniversity, Logan, Utah. (EP/DF/05-2001)
After determining air dry matter, multiply the figure by the conversion factor for the plot sizeused (in table 4). We used a 4.80 ft2 plot, with a conversion factor of 20.
Plant Species: Average(grams)
Air-dryconversionpercentage
(Tables 3a – 3d)
Air drymatter (in
grams)
Conversionfactor for plot
size(Table 4)
Total foragein
pounds peracre
GrassesCrested Wheatgrass 11.8 45% 5.31 20 106.2Bluebunch Wheatgrass 7.8 45% 3.512 20 70.24Indian Rice Grass 6.1 45% 2.745 20 54.9Needle and Thread 4.9 45% 2.205 20 44.1
Total Grasses: 275.44
ForbsArrowleaf Balsamroot 3.8 40% 1.52 20 30.4Geranium 1.5 40% 0.6 20 12.0Globemallow 5.1 40% 2.04 20 40.8
Total Forbs: 83.2
ShrubsBig Sagebrush 0.5 65% 0.325 20 6.5Fourwing Saltbush 0.3 50% 0.15 20 3.0
Total Shrubs: 9.5
Total Available Forage: 368.14
Generally, it is recommended that only half of the total forage be used for animal grazing. However, based on your grazing system and plants, different levels can be used. Consult yourlocal Natural Resource Specialist for these numbers.
REFERENCES:
USDA Natural Resources Conservation Service. National Range and Pasture Handbook.1997.

Plant Species:Plot
1Plot
2Plot
3Plot
4Plot
5Plot
6Plot
7Plot
8Plot
9Plot10
Average(grams)
Grasses
Forbs
Shrubs
Plant Species: Average(grams)
Air-dryconversionpercentage
(Tables 3a – 3d)
Air drymatter (in
grams)
Conversionfactor for plot
size(Table 4)
Total foragein
pounds peracre
Grasses
Forbs
Shrubs
Total Available Forage: