Calcaneal quantitative ultrasound (QUS) and dual X … quantitative ultrasound (QUS) and dual X-ray...
24
Calcaneal quantitative ultrasound (QUS) and dual X-ray absorptiometry (DXA) bone analysis in adult HIV-positive patients Alberto Clò 1 , Davide Gibellini 2 , Davide Damiano 3 , Fabio Vescini 4 , Cristina Ponti 5 , Silvia Morini 1 , Anna Miserocchi 1 , Giuseppina Musumeci 1 , Leonardo Calza 3 , Vincenzo Colangeli 3 , Pierluigi Viale 3 , Maria Carla Re 1 , Marco Borderi 3 1 Department of Experimental, Diagnostic, and Specialty Medicine, University of Bologna, Microbiology Unit, S. Orsola Malpighi Hospital, Bologna, Italy; 2 Department of Pathology and Diagnostics, Microbiology Unit, University of Verona, Italy; 3 Infectious Diseases Unit, Department of Medical and Surgical Sciences, Infectious Diseases Unit, S. Orsola Malpighi Hospital, University of Bologna, Italy; 4 Endocrinology and Metabolism Unit, University-Hospital S. Maria della Misericordia, Udine, Italy; 5 Department of Life Sciences, University of Trieste, Italy Corresponding Author: Davide Gibellini Department of Pathology and Diagnostics, Microbiology Unit, University of Verona, Verona, Italy E-mail: [email protected] Phone:00390458027559 Running Title: QUS and DXA analysis in HIV-positive patients.
Transcript of Calcaneal quantitative ultrasound (QUS) and dual X … quantitative ultrasound (QUS) and dual X-ray...

Calcaneal quantitative ultrasound (QUS) and dual X-ray absorptiometry (DXA)
bone analysis in adult HIV-positive patients
Alberto Clò1, Davide Gibellini
2, Davide Damiano
3, Fabio Vescini
4, Cristina
Ponti5, Silvia Morini
1, Anna Miserocchi
1, Giuseppina Musumeci
1, Leonardo
Calza3, Vincenzo Colangeli
3, Pierluigi Viale
3, Maria Carla Re
1, Marco Borderi
3
1Department of Experimental, Diagnostic, and Specialty Medicine, University of
Bologna, Microbiology Unit, S. Orsola Malpighi Hospital, Bologna, Italy; 2Department of Pathology and Diagnostics, Microbiology Unit, University of Verona,
Italy; 3Infectious Diseases Unit, Department of Medical and Surgical Sciences, Infectious
Diseases Unit, S. Orsola Malpighi Hospital, University of Bologna, Italy; 4Endocrinology and Metabolism Unit, University-Hospital S. Maria della
Misericordia, Udine, Italy; 5Department of Life Sciences, University of Trieste, Italy
Corresponding Author:
Davide Gibellini
Department of Pathology and Diagnostics,
Microbiology Unit,
University of Verona,
Verona,
Italy
E-mail: [email protected]
Phone:00390458027559
Running Title: QUS and DXA analysis in HIV-positive patients.
2
SUMMARY
Human immunodeficiency virus (HIV)-infected patients have an increased risk of
developing osteopenia or osteoporosis compared with healthy individuals. Our aim
was to compare dual X-ray absorptiometry (DXA), the gold standard for measuring
bone mineral density (BMD), with bone quantitative ultrasound (QUS), an alternative
technique for predicting fractures and screening low BMD, at least in postmenopausal
populations. We analyzed DXA and QUS parameters to investigate their accuracy in
the diagnosis and prediction of bone alterations in a cohort of 224 HIV-1-positive
patients. The speed of sound (SOS), broadband ultrasound attenuation (BUA) and
stiffness index (SI) parameters showed a moderate correlation with DXA, especially
with total-body BMD (r coefficient of 0.38, 0.4 and 0.42 respectively), particularly in
the female subgroup. In addition, multivariate analysis of HIV-positive patients
assessed for vertebral fractures indicated that QUS was more effective than DXA at
predicting the risk of fracture. QUS can be used as an additional tool for analyzing
bone density in HIV-positive patients and its case of use and low cost make it
especially suitable for resource-limited settings where DXA is not employed.
KEY WORDS: HIV, QUS, DXA, Bone.
3
INTRODUCTION
Several studies have demonstrated that the human immunodeficiency virus (HIV),
together with certain combinations of antiretroviral drugs, induces a significant bone
loss in HIV-positive patients in comparison with uninfected individuals (Borderi et
al., 2009; Brown & Qaqish, 2006; Brown & McComsey, 2006). These observations
suggest that HIV infection is an independent risk factor for reduced bone mineral
density (BMD) (Womack et al., 2011). Osteoporosis in HIV-infected patients is
emerging as a problem worldwide, and its management has been improving over the
past decade through the use of biochemical and instrumental approaches and, most
recently, anti-osteoporotic drugs (McComsey et al., 2010). Osteoporosis is
significantly associated with an increase in bone fractures, which, in turn, can
negatively affect life expectancy (Womack et al., 2011). The diagnosis of osteopenia
and osteoporosis is currently determined by DXA (Kanis et al., 2008). DXA measures
the BMD at specific anatomical sites (i.e. the femur, lumbar spine and wrist), and it
can be expressed as both a T-score and a Z-score (NIH Consensus 2001). DXA is
currently considered the gold standard for the diagnosis of osteoporosis. Although
DXA effectively describes mineralization status, this technique is less consistent in
assessing certain important characteristics of bone structure, such as the trabecular
dimensions and bone elasticity, which play important roles in the maintenance of
global bone strength evaluation (Chappard et al., 1997; Glüer et al., 1993; Wu et al.,
1998). Moreover, because DXA is expensive, it is not an ideal choice for screening
for bone mass alterations, particularly in resource-limited countries (Cournil et al.,
2012). Hence, a different approach, based on ultrasound, has been proposed to study
bone structure. This method, the QUS technique, is able to detect various bone
mechanical properties and the trabecular structural orientation through the
measurement of parameters represented by the speed of sound (SOS), broadband
ultrasound attenuation (BUA) and stiffness (Frost et al., 1999; Frost et al., 2000;
Laugier et al., 1997). These three parameters can be used to describe the strength of
bone. Additional studies have validated calcaneal QUS for clinical use in osteoporosis
and demonstrated that QUS can predict fragility fractures in postmenopausal women
and in men over the age of 65, independently of central BMD as determined by DXA
(Bauer et al., 1995; Bauer et al., 1997; Bauer et al., 2007; Hans et al., 1996; Khaw et

4
al., 2004; Steward et al., 2006). In this study, we performed DXA and QUS
measurements in HIV-positive patients to evaluate the ability of these techniques to
accurately screen for bone disease in this population.
5
MATERIALS AND METHODS
Study population
A total of 224 HIV-positive patients were consecutively enrolled during their periodic
clinical evaluations at the Infectious Disease Unit, St. Orsola-Malpighi Hospital,
Bologna. The group consisted of 152 men and 72 women with a global mean age of
47.02±9.26 years (range 24-72 years). Most of these patients were Caucasian (213 of
224; 95.1%) and their mean BMI (kg/m2) was 23.73±3.45. As indicated in the ISCD
guidelines, people at risk of osteoporosis were postemenopausal women and men
aged 50 or more. Among the 224 HIV-positive patients enrolled in our study, 30
women (41.7%) were in post-menopausal age, whereas 62 men (40.8%) were aged 50
or more.
This cross-sectional study performed QUS (Sahara® Hologic, Bedford, MA) of the
calcaneus in all the patients and total-body DXA in 183 patients, L1-L4 vertebral
DXA in 187 patients, femur DXA in 186 patients and femoral neck DXA in 185
patients to measure the relative BMD (Z-score and T-score) with DXA Lunar Prodigy
Primo TM device (GE Healthcare). In addition, the patients’ fracture history was
recorded. For a subgroup of patients (53 of 224), a recent lateral spine X-ray was
available. The study was approved by the local Independent St. Orsola-Malpighi
Hospital Bologna Ethics Committee (protocol number: 3278/2012) and complied with
the Code of Ethics (Declaration of Helsinki). Informed consent was obtained from
each patient enrolled.
BMD, T-score and Z-score by DXA
In accordance with World Health Organization (WHO) classification criteria, BMD is
reported in terms of T-score, which represents the number of standard deviations
below the mean for a young, sex- and ethnicity-matched control population. It is
calculated using the following formula T-score = (patient’s BMD - reference
BMD)/SD, where the reference BMD and standard deviation (SD) refer to the control
population. The WHO classification criteria identify a T-score values >-1 SD as being
normal, between - 1 SD and - 2.5 SD as indicating osteopenia, and ≤-2.5 SD as
indicating osteoporosis (NIH Consensus 2001).
Guidelines issued by the International Society for Clinical Densitometry (ISCD)
recommend using the T-score with the diagnostic cut-off values specified by the

6
WHO only for women in menopause. Although definitive data are lacking, it is
generally accepted that the same method can be applied to men over the age of fifty if
they have at least one major risk factor for osteoporosis. For individuals aged under
50 years, diagnosis is recommended using the Z-score, which compares a patient’s
BMD with that of a healthy age-, sex- and ethnicity-matched population. It is
calculated using the following formula Z-score = (patient’s BMD - reference
BMD)/SD, where the reference BMD and SD refer to the mean of the matched
population. A Z-score of - 2.0 or lower is defined as “below the expected range for
age” and a Z-score above - 2.0 is “within the expected range for age”. (Baim et al.,
2008).
SOS, BUA, stiffness, T-score and Z-score by QUS
All patients were analyzed by calcaneal QUS. This device consists of two unfocused
transducers mounted coaxially on a monitor caliper. One transducer acts as the
transmitter, the other as a receiver. The transducers are acoustically coupled to the
heel using soft rubber pads and an oil-based coupling gel. The Sahara®
Hologic
device measures both broadband ultrasound attenuation (BUA, dB/MHz) and speed of
sound (SOS, m/s) at a fixed region of interest in the mid-calcaneus, and the BUA and
SOS results are combined to provide an estimate of the quantitative ultrasound index
(QUI or stiffness) using the formula QUI=0.41 x (BUA + SOS) - 571. QUS results
were also expressed as the corresponding T-scores, and Z-scores using the same cut-
offs as those for the DXA measurements. The QUS T- and Z-scores were calculated
following the manufacturers’ indications.
Statistical analysis
Descriptive statistics included the numbers and percentages of patients, as well as the
mean and standard deviation (SD) values. The association between the QUS
parameters and the DXA measurements was determined using the Pearson’s
correlation r coefficient. Multiple linear regression analysis was performed, with the
DXA parameters as dependent variables and stiffness, age, sex and BMI as
independent variables. Simple regression analysis was used to test for trends among
the different variables. A receiver operator characteristic (ROC) curve analysis was
performed to assess the performance of the different QUS parameters in the
identification of patients with or without a T-score ≤-2.5, for all four sites measured
7
by DXA. Areas under the curve (AUCs), 95% CIs and p-values were recorded. To
test the strength of association between T-scores (dichotomized into osteoporotic and
non-osteoporotic) from QUS and DXA, a Phi () test of association was performed.
Multivariate test analyses were conducted to consider the effects of group variables
on QUS and DXA parameters, and Wilks’ Lambda () F statistics were obtained. All
tests were two-tailed and only p<0.05 was considered statistically significant. All
statistical calculations were carried out using SPSS for Windows 20.0 version (IBM
Corp., Armonk, NY, USA).
8
RESULTS
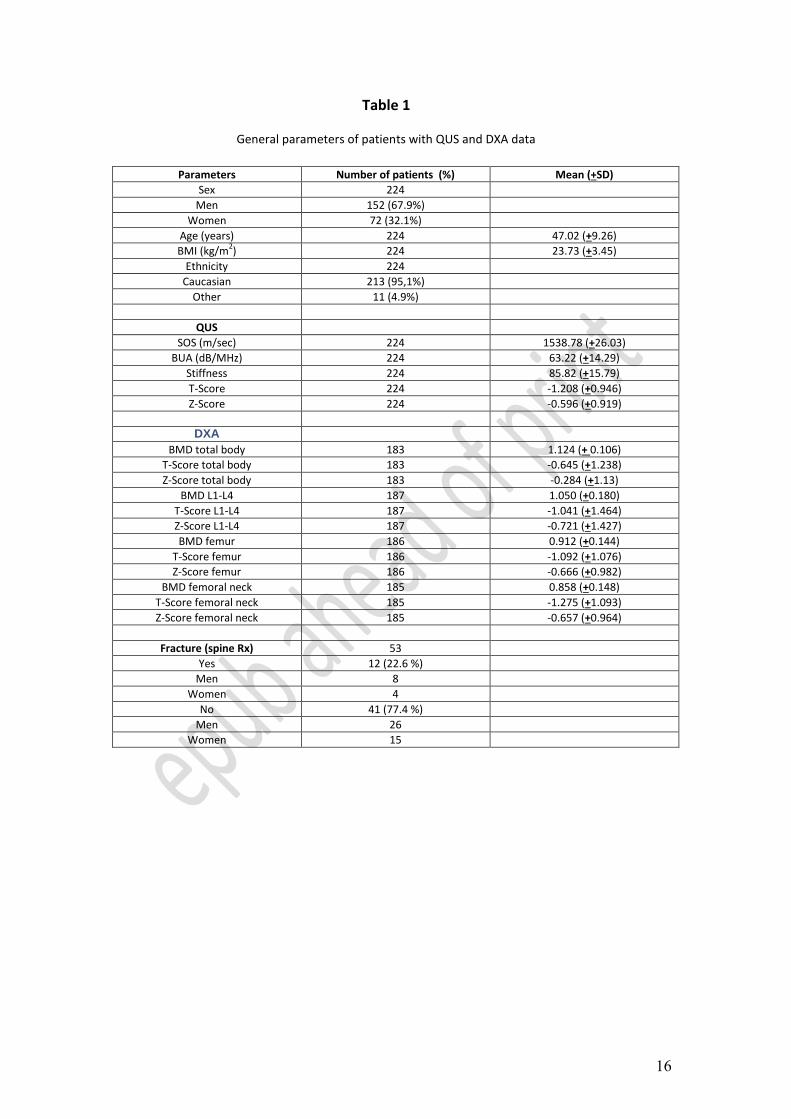
In this cross-sectional study we selected a group of 224 HIV-positive patients (Table
1). All patients were analyzed using calcaneal QUS to measure their SOS (m/sec),
BUA (dB/MHz), stiffness, T-score and Z-score. In parallel, total-body DXA was
performed in 183 patients, L1-L4 vertebral DXA in 187 patients, femur DXA in 186
patients and femoral neck DXA in 185 patients in order to measure the relative BMD
(Z-score and T-score).
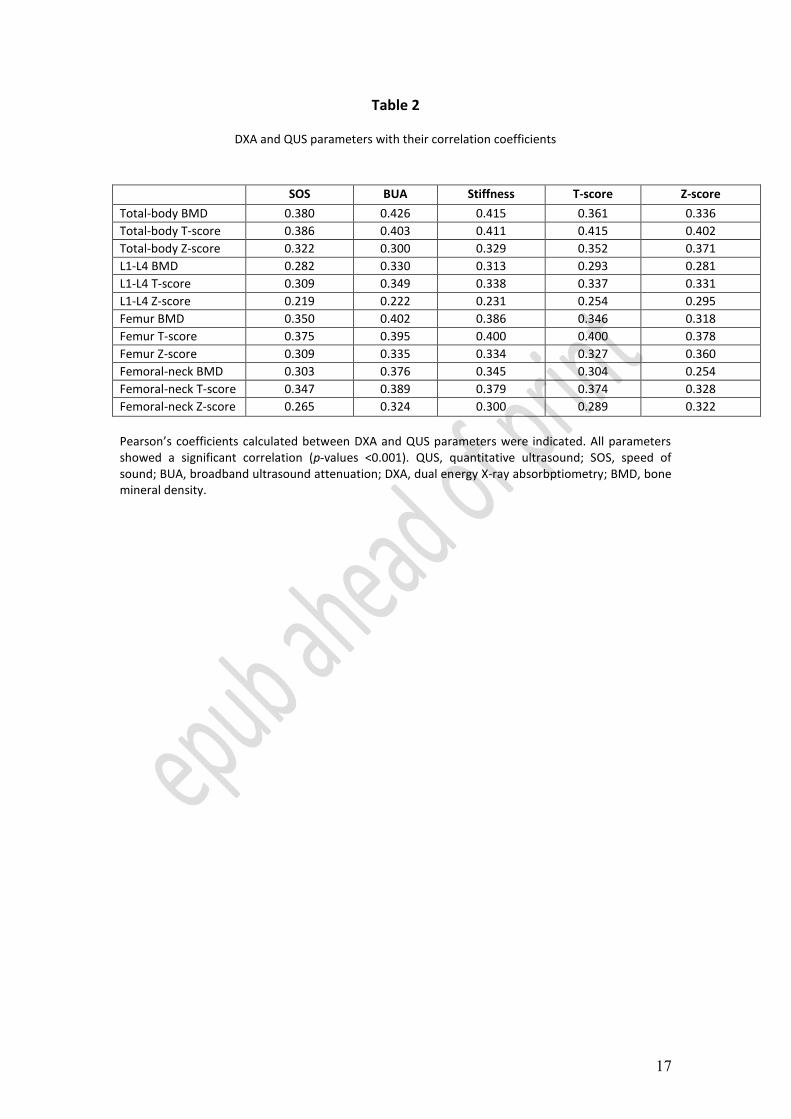
The correlation between calcaneal QUS and DXA parameters was determined for all
HIV- positive patients using Pearson’s test (Table 2). Total-body BMD measurements
in HIV-positive patients were significantly associated with calcaneal SOS (r=0.38;
p<0.001), BUA (r=0.426; p<0.001) and stiffness (r=0.415; p<0.001). Similar r
coefficient values were obtained when lumbar spine, femur and femoral neck BMD
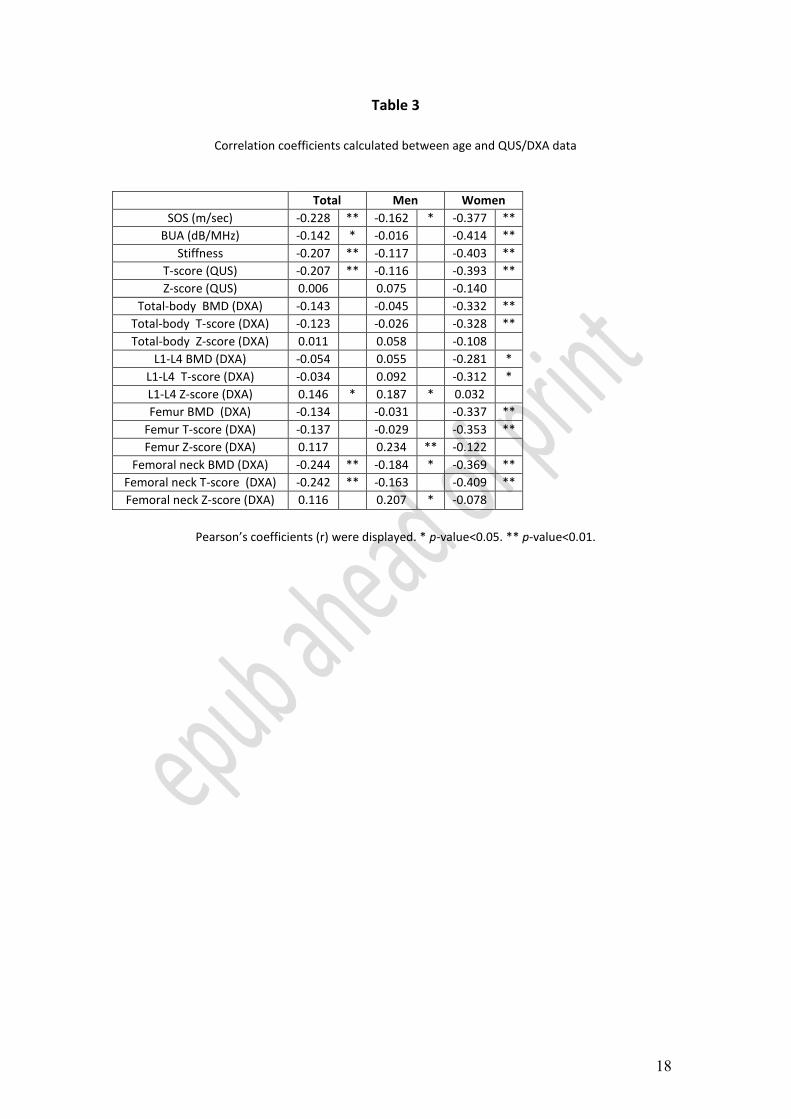
were compared with QUS parameters (Table 2). When these data were stratified by
sex and correlated with age, the QUS parameters including SOS (r=-0.377; p<0.01),
BUA (r=-0.414; p<0.01), stiffness (r=-0.403; p<0.01) and T-score (r=-0.393; p<0.01)
showed an increased Pearson’s coefficient in women (Table 3), whereas only the SOS
parameter (r=-0.162; p<0.05) was significant in men, with a very low r coefficient.
The same analysis performed with DXA parameters showed a more complex
situation. Age was significantly correlated with several DXA parameters in women
(Table 3) but in men a correlation was found only for the femoral neck (r=0.207;
p<0.05) and total-hip (r=0.234; p<0.01) Z-scores.
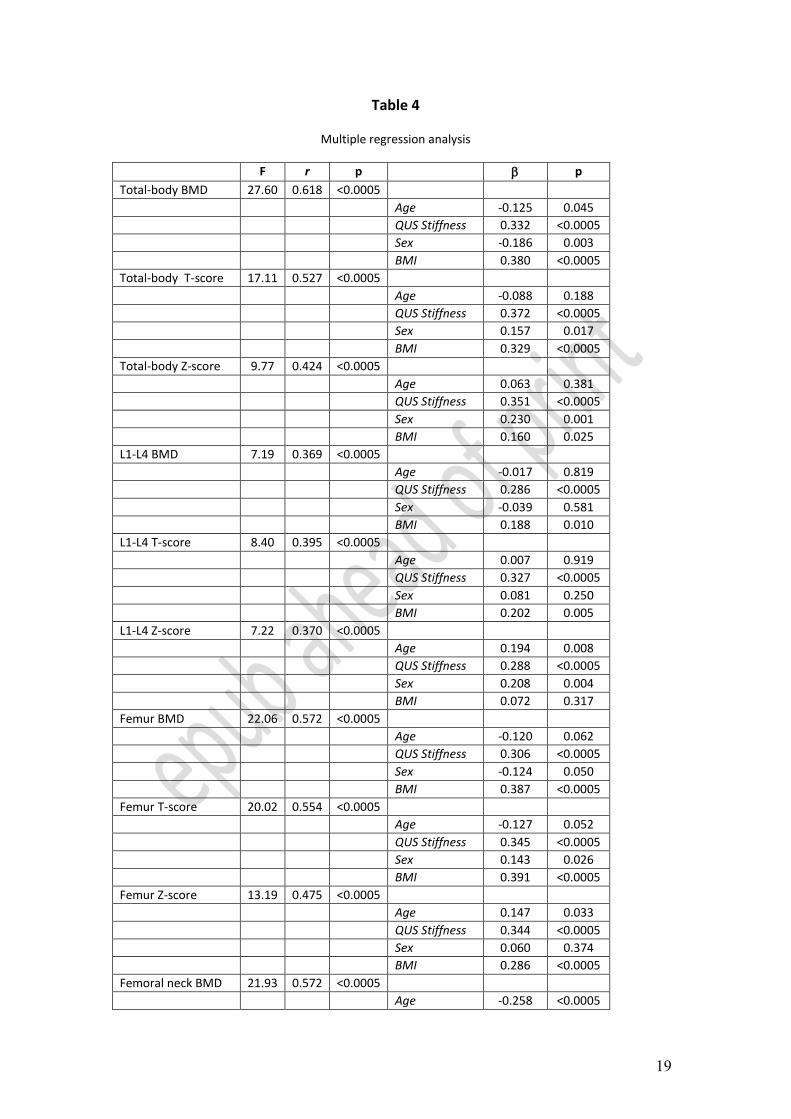
A multiple regression analysis was carried out to predict DXA parameters from
stiffness, age, sex and BMD. Interestingly, this statistical approach demonstrated that
these independent variables significantly predicted all DXA parameters (p<0.0005;
Table 4).
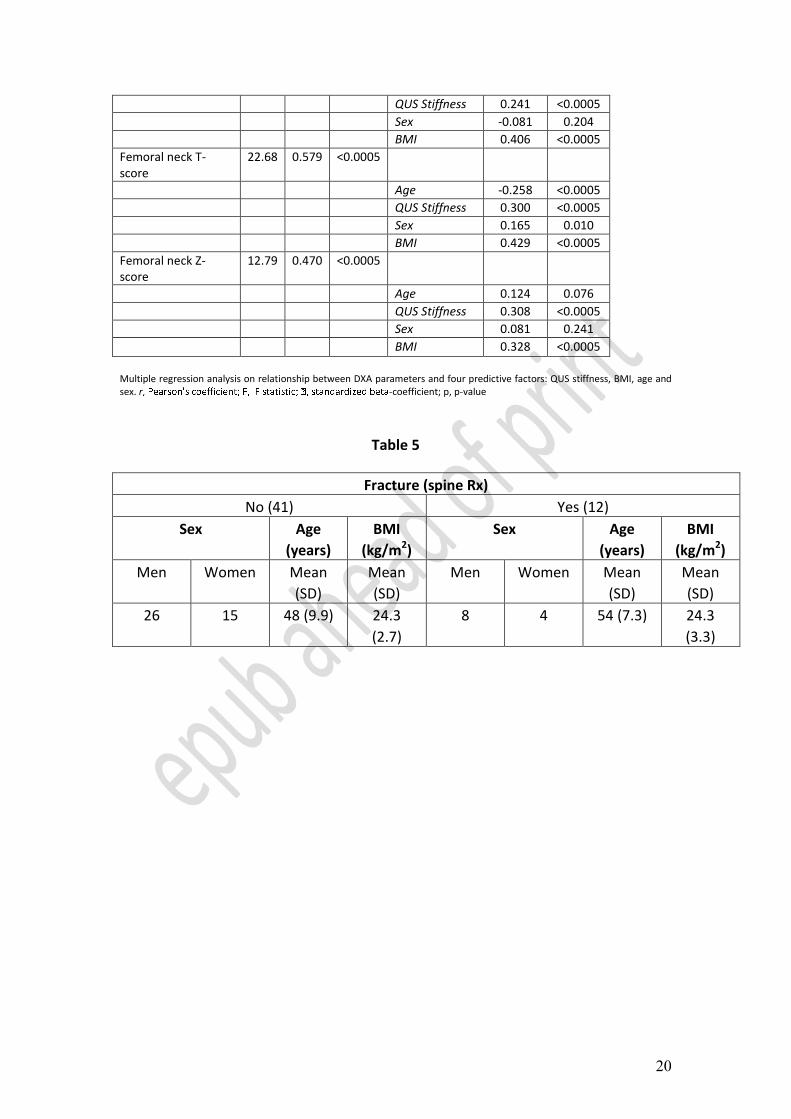
In the subgroup of patients (53 subjects) with an available spinal X-ray we observed
12 spinal fractures (22.6% of the entire study population; Tables 1 and 5).
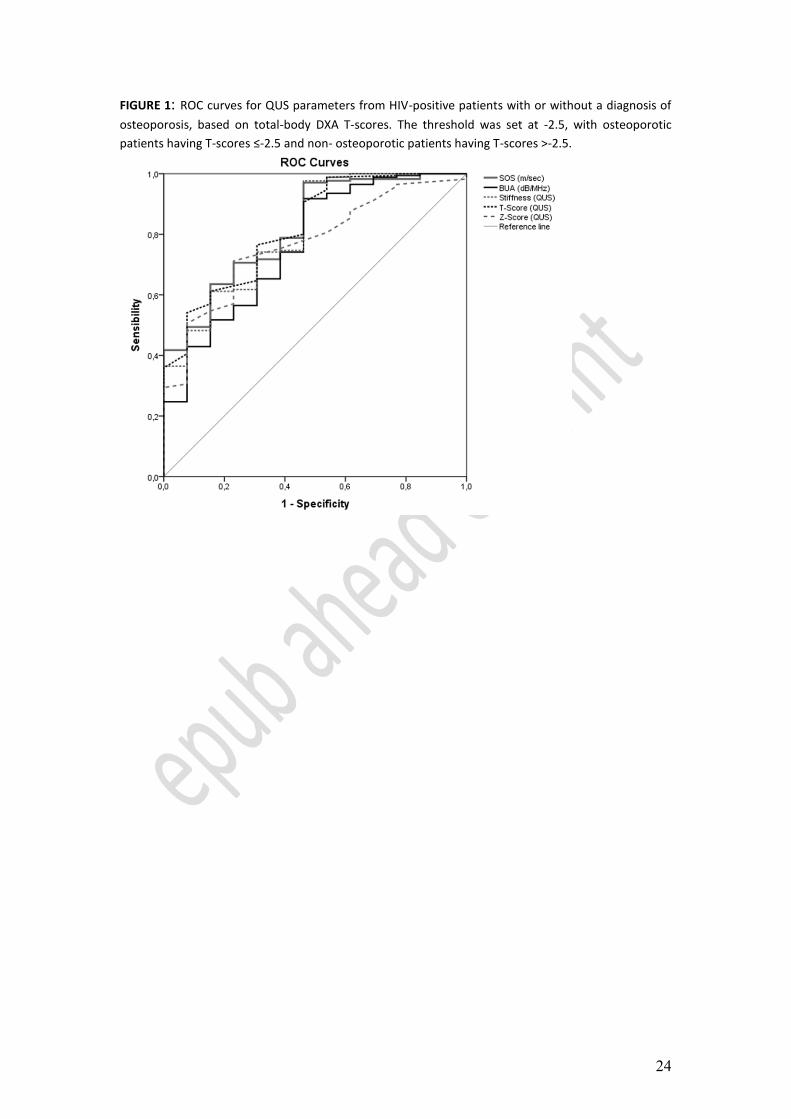
To investigate the specificity and sensitivity of QUS in the discrimination of the
presence/absence of osteoporosis, we applied an ROC and the AUCs were calculated
to assess the correspondence between QUS and DXA, the latter considered as the
gold standard for the diagnosis of osteoporosis (Figure 1). The AUC reflects the
potential of QUS to discriminate between normal and osteoporotic patients as
diagnosed by DXA. We used the DXA T-scores as a reference, with a cut-off value of
9
-2.5, to discriminate between normal/osteopenic and osteoporotic patients. All QUS
parameters significantly predict the osteoporosis risk, with consistently high AUC
values. Notably, when we analyze the total-body T-score data subset, the AUCs were
consistently high for all QUS parameters, especially for the QUS T-score
(AUC=0.820; 95% CI 0.706-0.935; p<0.0005). Figure 1 shows the ROC curve for the
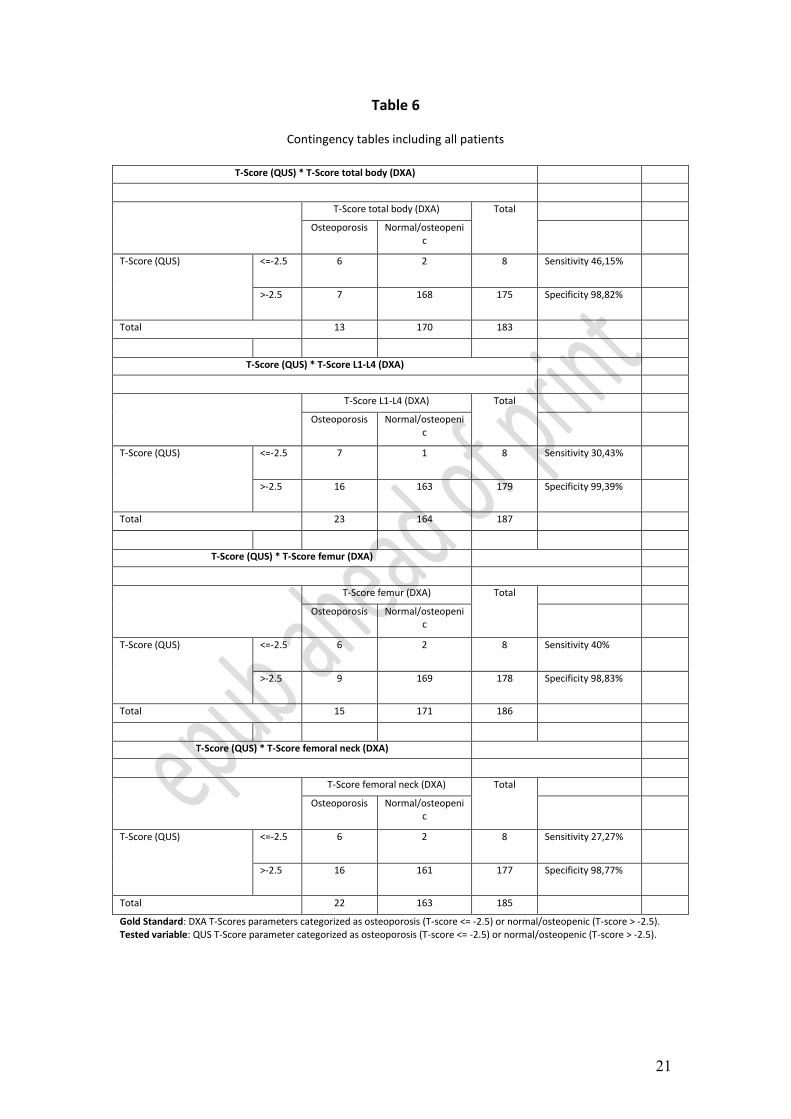
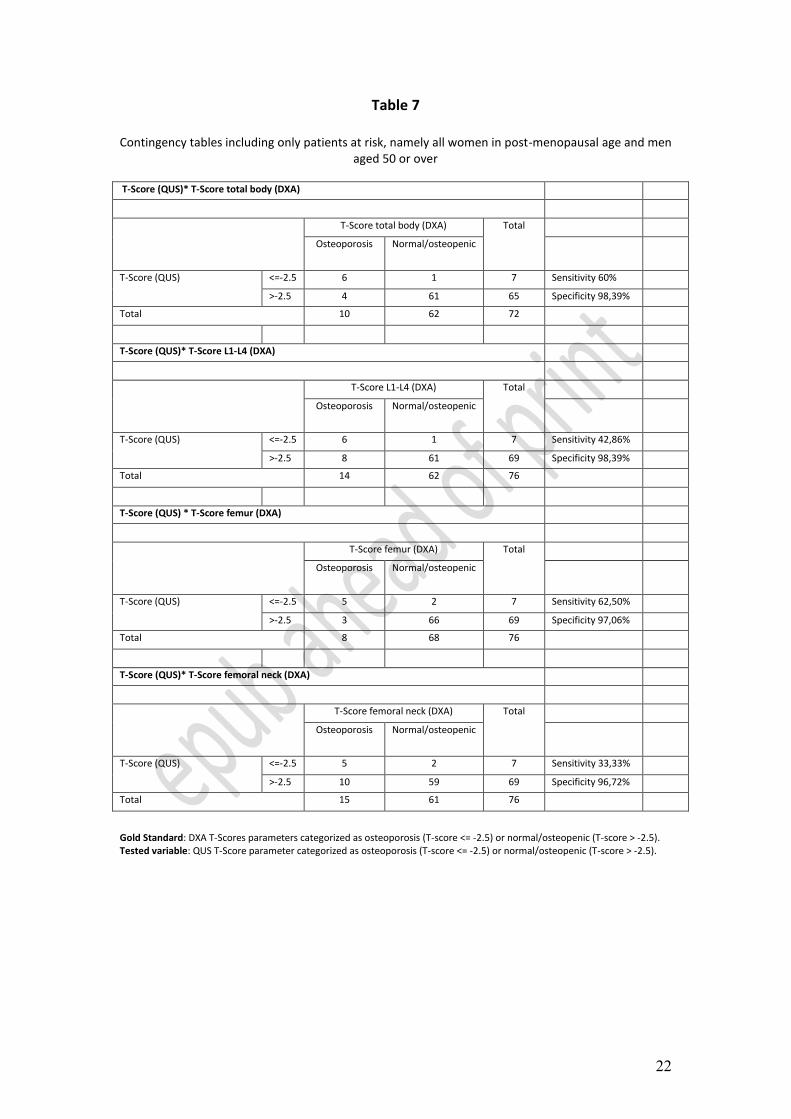
total-body DXA T-scores. In parallel, we generated the contingency table to indicate
the values of sensitivity and specificity (Tables 6 and 7).
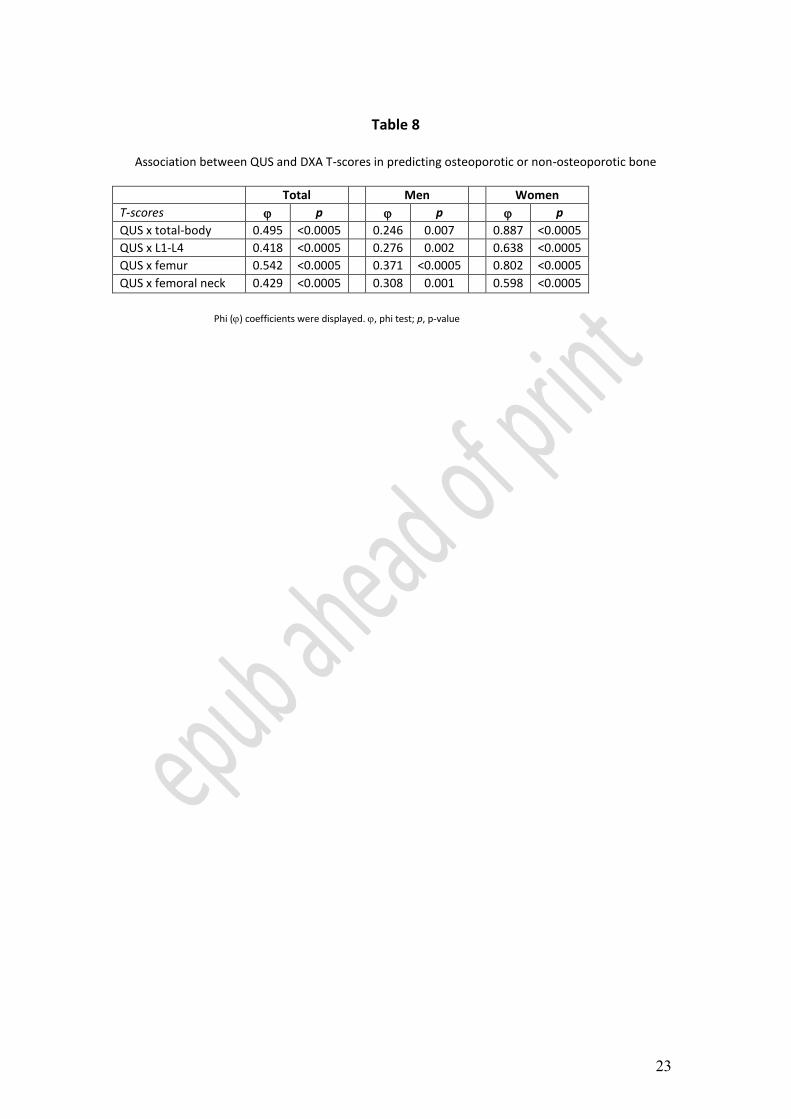
To assess the association between two variables, namely the QUS T-scores and the
DXA T-scores, in predicting osteoporotic or normal/osteopenic bone, these variables
were dichotomized, with a cut-off of -2.5 SD (i.e. T-scores ≤-2.5 SD for osteoporotic
bone, T-scores >-2.5 SD for normal/osteopenic bone). Subsequently, a Phi () test
was performed to quantify the strength of association between these variables (Table
8). All the variables showed a strong association when the entire study population was
considered (QUS x total-body DXA: =0.495, QUS x L1-L4 DXA: =0.418, QUS x
femur DXA: =0.542, QUS x femoral neck DXA: =0.429, all values were
significant at p<0.0005). When stratified by sex, all four combinations showed a
minor but significant correlation in men: it is noteworthy that the QUS T-score
association with the DXA T-scores resulted in a substantial increase in the Phi
coefficient (QUS x total-body DXA: =0.887, QUS x L1-L4 DXA: =0.638, QUS x
femur (TOTAL HIP) DXA: =0.802, QUS x femoral neck DXA: =0.598, all values
were significant at p<0.0005).
DISCUSSION
This study compared the calcaneal QUS with total-body, femur, femoral neck and L1-
L4 vertebral DXA analyses for a group of adult HIV-positive patients. Because DXA
is widely considered the gold standard for the measurement of BMD and in the
diagnosis of osteoporosis, our first aim was to statistically evaluate QUS parameters
(SOS, BUA, stiffness, T-score and Z-score) with respect to DXA parameters (BMD,
T-score and Z-score) in the entire HIV-positive study population. Interestingly, the
QUS parameters (SOS, BUA, stiffness and T-score) showed a moderate correlation
with the DXA parameters. In particular, this correlation (calculated by the r
coefficient) was more consistent when the QUS parameters were compared with the
DXA, BMD and DXA T-score. Following stratification by sex and correlation with
10
age, women showed a higher r coefficient than the entire study population. The
analysis of the QUS data collected with Sahara Hologic device from HIV-positive
women showed that this subgroup has lower QUS parameter values than those of
uninfected women, suggesting a more rapid decrease in bone strength correlated with
HIV-infection and/or cART treatment. Interestingly, higher r coefficients were
detected when total-body DXA BMD was compared with the calcaneal QUS
parameters (SOS, BUA and stiffness), whereas the lowest r coefficients were obtained
when those QUS parameters were compared with L1-L4 DXA BMD.
Bone properties (cortical or trabecular structure), patient characteristics (gender) and,
most likely, HIV/cART features (i.e., infection length and different antiretroviral
regimens) elicit different correlations between DXA and QUS specific parameters.
These data are in accordance with the r coefficient observed in other studies, in which
comparative analyses between QUS and DXA data were performed on healthy
individuals, even when different QUS devices were used (Ikeda et al., 2004; Steward
et al., 2000). However, the correlations between QUS parameters (SOS, BUA and
stiffness) and DXA Z-scores and T-scores in the different body regions are not
sufficient to support the hypothesis that calcaneal QUS can be considered an
alternative technique to DXA for diagnosing osteopenia/osteoporosis in HIV-positive
patients. This confirms the official guidelines of the Osteoporosis Society that still
indicate that DXA is the gold standard for osteoporosis diagnosis in healthy donors
(National Osteoporosis Foundation, 2010). In fact, discordant results between
calcaneal QUS and central DXA have been obtained and are not necessarily an
indication of methodological error (Pisani et al., 2013). QUS and DXA scans simply
measure different bone characteristics, (bone quality and bone quantity, respectively),
and therefore both can return useful integrative information. The DXA technique is
able to identify the variations in BMD by analyzing both cortical and trabecular bone.
By contrast, DXA is not able to determine the strength of bone architecture, and a
normal BMD could be associated with impaired bone structure that has a higher risk
of fractures (Stagi et al., 2014). The QUS approach has been introduced as a new tool
for bone analysis because it can effectively investigate the bone micro-architecture as
well as BMD (Flöter et al., 2011). For example, BUA is dependent on bone trabecular
orientation (at least during in vitro testing) and BUA and BMD are also related,
suggesting that ultrasound attenuation could represent a parametric synthesis of the
bone micro-architecture and bone mass density (Grimal et al., 2013). Every QUS
11
parameter provides specific and different information (for example, 99% of SOS
variabilty depends on density+elasticity+anisotrophy at 99% whereas BUA variability
depends on density+trabecular dimensions+connectivity at 68%).
ìIt is noteworthy that QUS shows good performance even on the metabolically active
trabecular metabolic bone compared with cortical structural bone, suggesting a more
rapid detection of bone impairment (Navarro et al., 2012). Furthermore, QUS can be
used as a test for screening patients who undergo DXA scans, especially when DXA
is not available. Because QUS devices are portable and easy to use and carry no
radiation-exposure risk, QUS is a useful technique for assessing bone characteristics
in resource-limited settings where the more expensive DXA cannot be employed. A
recent study of a cohort of African HIV-positive patients performed using only with
QUS confirmed the BMD reduction and bone impairment in these patients in
comparison with sex- and age-matched healthy individuals. In addition, QUS can be a
valuable test in any setting for screening patients who undergo the DXA scan, and for
providing specific information that can be usefully integrated with DXA results.
QUS measurements of the calcaneus discriminate effectively between cases and
controls with vertebral crush fractures and non-spinal fractures (Liu et al., 2012).
Several studies performed in large groups of healthy subjects have shown that QUS is
as effective as DXA in the prediction of fracture risk (Pines, 2013). The ability of
QUS to identify the risk of fractures was compared with that of DXA in our group of
HIV-positive patients. We compared the QUS and DXA results for the 53 patients
who were studied with spinal X-rays. The multivariate analysis data for QUS, L1-L4
DXA, sex and age showed that the QUS variables showed a higher and strongly
significant F when compared with L1-L4 DXA, especially when we analyzed the age
x spinal fracture group. This observation indicates that QUS is preferable to DXA as a
method for predicting fractures in adult HIV-positive individuals, although this
analysis was performed in a small number of cases. Monitoring changes in bone
structure and mineral density is important in the management of HIV-infected patients
because HIV infection and certain combinations of antiretroviral treatments elicit
progressive bone loss in these patients (Gibellini et al., 2012; Ofotokun &
Weitzmann, 2010; Rothman et al., 2012). HIV proteins and some antiretrovirals
interfere with bone homeostasis, osteoblast/osteoclasts cross-talk and differentiation
(Cotter et al., 2007; Cotter et al., 2008; Gibellini et al., 2008; Gibellini et al., 2010).
The decrease in osteoblast activity, the opposing increase in osteoclast-driven bone
12
resorption and the derangement of cytokines related to bone homeostasis such as
RANKL and OPG (Fakruddin & Lawrence, 2005; Konishi et al., 2005; Gibellini et
al., 2007; Mora et al., 2007), lead to a reduction in BMD and an increase in fractures
in HIV-positive patients (Peters et al., 2013; Womack et al., 2013). To the best of our
knowledge, this paper is the first report on the comparative application of QUS and
DXA to adult HIV-positive patients. A previous study by Mora and coworkers
analyzed the relationship between QUS and DXA in a pediatric cohort achieving a
similar correlation between DXA and QUS parameters (Mora et al., 2009).
In conclusion, the correlation observed especially between by DXA and QUS
parameters in determining total-body BMD suggests that QUS can be used as an
additional diagnostic technique in HIV-positive patients for fracture prediction, a
principal clinical endpoint correlated with osteoporosis.
ACKNOWLEDGEMENTS
This work was supported by funds from the University of Bologna (selected topics)
and MURST 60%.
REFERENCES
Baim S., Binkley N., Bilezikian J.P., Kendler D.L., Hans D.B., Lewiecki E.M.,
Silverman S. (2008). Official Positions of the International Society for Clinical
Densitometry and executive summary of the 2007 ISCD Position Development
Conference. J. Clin. Densitom. 11, 75-91.
Bauer D.C., Glüer C.C., Genant H.K., Stone K. (1995). Quantitative ultrasound and
vertebral fracture in postmenopausal women. J. Bone Miner. Res. 10, 353-358.
Bauer D.C, Glüer C.C., Cauley J.A., Vogt T.M., Ensrud K.E., Genant H.K., Black
D.M. (1997). Broadband ultrasound attenuation predicts fractures strongly and
independently of densitometry in older women. A prospective study. Study of
Osteoporotic Fractures Research Group. Arch. Intern. Med. 157, 629-634.
Bauer D.C., Ewing S.K., Cauley J.A., Ensrud K.E., Cummings S.R., Orwoll E.S.
(2007). Quantitative ultrasound predicts hip and non-spine fracture in men: the MrOS
study. Osteoporos Int. 18, 771-777.
Borderi M., Gibellini D., Vescini F., De Crignis E., Cimatti L., Biagetti C.,
Tampellini L., Re M.C. (2009). Metabolic bone disease in HIV infection. AIDS. 23,
1297-1310.
Brown T.T., McComsey G.A. (2006). Osteopenia and osteoporosis in patients with
HIV: a review of current concepts. Curr. Inf. Dis. Reports 8, 162-170.
Brown T.T., Qaqish R.B. (2006). Antiretroviral therapy and the prevalence of
osteopenia and osteoporosis: a meta-analytic review. AIDS. 20, 2165-2174.
Chappard C., Laugier P., Fournier B., Roux C., Berger G. (1997). Assessment of the
13
relationship between broadband ultrasound attenuation and bone mineral density at
the calcaneus using BUA Imaging and DXA. Osteoporos Int. 7, 316-322.
Cotter E.J., Malizia A.P., Chew N., Powderly W.G., Doran P.P. (2007). HIV proteins
regulate bone marker secretion and transcription factor activity in cultured human
osteoblasts with consequent potential implications for osteoblast function and
development. AIDS Res. Hum. Retrovir. 23, 1521-1530.
Cotter E.J., Ip H.S., Powderly W.G., Doran P.P. (2008). Mechanism of HIV protein
induced modulation of mesenchymal stem cell osteogenic differentiation. BMC
Musculoskel. Disord. 9, 33.
Cournil A., Eymard-Duvernay S., Diouf A., Moquet C., Coutherut J., Ngom Gueye
N.F., Cames C., Taverne B., Bork K., Sow P.S., Delaporte E. ANRS 1215 Study
Group (2012). Reduced quantitative ultrasound bone mineral density in HIV-infected
patients on antiretroviral therapy in Senegal. PLoS One. 7: e31726.
Fakruddin J.M., Laurence J. (2005). HIV-1 Vpr enhances production of receptor of
activated NF-kB ligand (RANKL) via potentiation of glucocorticoid receptor activity.
Arch. Virol. 150, 67-78. Flöter M., Bittar C.K., Zabeu J.L., Carneiro A.C. (2011). Review of comparative studies between bone densitometry and quantitative ultrasound of the calcaneus in osteoporosis. Acta Reumatol. Port. 36, 327-335. Frost M.L., Blake G.M., Fogelman I. (1999). Contact quantitative ultrasound: An
evaluation of precision, fracture discrimination, age-related bone loss and
applicability of the WHO Criteria. Osteoporos Int. 10, 441-449.
Frost M.L., Blake G.M., Fogelman I. (2000). Does quantitative ultrasound imaging
enhance precision and discrimination? Osteoporos. Int. 11, 425-433.
Gibellini D., Borderi M., De Crignis E., Cicola R., Vescini F., Caudarella R., Chiodo
F., Re M.C. (2007). RANKL/OPG/TRAIL plasma levels and bone mass loss
evaluation in antiretroviral naive HIV-1-positive men. J. Med. Virol. 79, 1446-1454.
Gibellini D., De Crignis E., Ponti C., Cimatti L., Borderi M., Tschon M., Giardino R,.
Re M.C. (2008). HIV-1 triggers apoptosis in primary osteoblasts and HOBIT cells
through TNFalpha activation. J. Med. Virol. 80, 1507-1514.
Gibellini D., De Crignis E., Ponti C., Borderi M., Clò A., Miserocchi A., Viale P., Re
M.C. (2010). HIV-1 Tat protein enhances RANKL/M-CSF-mediated osteoclast
differentiation. Biochem. Biophys. Res. Commun. 401, 429-434.
Gibellini D., Borderi M., Vanino E., Clò A., Morini S., Calza L., Re M.C., Viale P.
(2012). Molecular bases of osteoporosis in HIV: The role of the virus and
antiretroviral therapy. Clin. Rev. Bone Mineral. Metabol. 10, 236-245.
Glüer C., Wu C.Y., Genant H.K. (1993). Broadband ultrasound attenuation signals
depend on trabecular orientation: An in-vitro study. Osteoporos. Int. 3, 185-191.
Grimal Q., Grondin J., Guérard S., Barkmann R., Engelke K., Glüer C.C., Laugier P.
(2013). Quantitative ultrasound of cortical bone in the femoral neck predicts femur
strength: results of a pilot study. J. Bone Miner. Res. 28, 302-312.
Hans D., Dargent-Molina P., Schott A.M. Sebert J.L., Cormier C., Kotzki P.O.,
Delmas P.D., Pouilles J.M., Breart G., Meunier P.J. (1996). Ultrasonographic heel
measurements to predict hip fracture in elderly women: the EPIDOS prospective
study. Lancet. 24, 511-514.
Ikeda Y., Iki M., Morita A., Aihara H., Kagamimori S., Kagawa Y., Matsuzaki T.,
Yoneshima H., Marumo F. (2004). JPOS Study Group. Ultrasound bone densitometry
of the calcaneus, determined with Sahara, in healthy Japanese adolescents: Japanese
Population-based Osteoporosis (JPOS) Study. J. Bone Miner. Metab. 22, 248-253.
Kanis J.A., McCloskey E.V., Johansson H., Oden A,. Melton L.J., Khaltaev N.
14
(2008). A reference standard for the description of osteoporosis. Bone 42, 467-475.
Konishi M., Takahashi K., Yoshimoto E., Uno K., Kasahara K., Mikasa K. (2005).
Association between osteopenia/osteoporosis and the serum RANKL in HIV-infected
patients. AIDS. 19, 1240-1241.
Khaw K.T., Reeve J., Luben R., Bingham S., Welch A., Wareham N., Oakes S,. Day
N. (2004). Prediction of total and hip fracture risk in men and women by quantitative
ultrasound of the calcaneus: EPIC-Norfolk prospective population study. Lancet. 363,
197-202.
Laugier P., Droin P., Laval-Jeantet A.M., Berger G. (1997). In-vitro assessment of the
relationship between acoustic properties and bone mass density of the calcaneus by
comparison of ultrasound parametric imaging and quantitative computed tomography.
Bone. 20, 157-165.
Liu J.M., Ma L.Y., Bi Y.F., Xu Y., Huang Y., Xu M., Zhao H.Y., Sun L.H., Tao B.,
Li X.Y., Wang W.Q., Ning G. (2012). A population-based study examining calcaneus
quantitative ultrasound and its optimal cut-points to discriminate osteoporotic
fractures among 9352 Chinese women and men. J. Clin. Endocrinol. Metab. 97, 800-
809.
McComsey G.A., Tebas P., Shane E., Yin M.T., Overton E.T., Huang J.S.,
Aldrovandi G.M., Cardoso S.W., Santana J.L., Brown T.T. (2010). Bone disease in
HIV infection: a practical review and recommendations for HIV care providers. Clin.
Infect. Dis. 51, 937-946.
Mora S., Zamproni I., Cafarelli L., Giacomet V., Erba P., Zuccotti G., Viganò A.
(2007). Alterations in circulating osteoimmune factors may be responsible for high
bone resorption rate in HIV-infected children and adolescents. AIDS. 21, 1129-1135.
Mora S., Viganò A., Cafarelli L., Pattarino G., Giacomet V., Gabiano C., Mignone F.,
Zuccotti G. (2009). Applicability of quantitative ultrasonography of the radius and
tibia in HIV-infected children and adolescents. J. Acquir. Immune Defic. Syndr. 51,
588-592.
National Osteoporosis Foundation: Clinician’s guide to prevention and treatment of
osteoporosis n 01/2010.
Navarro M. del C., Saavedra P., Gómez-de-Tejada M.J., Suárez M., Hernández D.,
Sosa M. (2012). Discriminative ability of heel quantitative ultrasound in
postmenopausal women with prevalent vertebral fractures: application of optimal
threshold cutoff values using classification and regression tree models. Calcif. Tissue
Int. 91, 114-120.
NIH Consensus Development Panel on Osteoporosis Prevention, Diagnosis, and
Therapy. Osteoporosis prevention, diagnosis, and therapy (2001). JAMA. 285, 785-
795.
Ofotokun I., Weitzmann M.N. (2010). HIV-1 infection and antiretroviral therapies:
risk factors for osteoporosis and bone fracture. Curr. Opin. Endocrinol. Diabetes
Obes. 17, 523-529.
Peters B.S., Perry M., Wierzbicki A.S., Wolber L.E., Blake G.M., Patel N., Hoile R.,
Duncan A., Kulasegaram R., Williams F.M. (2013). A Cross-Sectional Randomised
Study of Fracture Risk in People with HIV Infection in the Probono 1 Study. PLoS.
One 8, e78048.
Pines A. (2013). DXA vs. QUS to predict fracture risk. Climacteric. 16, 199-200.
Pisani P., Renna M.D., Conversano F., Casciaro E., Muratore M., Quarta E., Paola
M.D., Casciaro S. (2013). Screening and early diagnosis of osteoporosis through X-
ray and ultrasound based techniques. World J. Radiol. 5, 398-410.
Rothman M.S., Bessesen M.T. (2012). HIV infection and osteoporosis:
15
pathophysiology, diagnosis, and treatment options. Curr. Osteoporos. Rep. 10, 270-
277.
Stagi S., Cavalli L., Bertini F,. Cerinic M.M., Brandi M.L., Falcini F. (2014). Cross-
sectional and longitudinal evaluation of bone mass and quality in children and young
adults with juvenile onset systemic lupus erythematosus (JSLE): role of bone mass
determinants analyzed by DXA, PQCT and QUS. Lupus. 23, 57-68.
Steward A., Kumar V., Reid D.M. (2006). Long-Term Fracture Prediction by DXA
and QUS: A 10-Year Prospective Study. J. Bone Miner. Res. 21, 413-418.
Stewart A., Reid D.M. (2000). Precision of quantitative ultrasound: comparison of
three commercial scanners. Bone. 27, 139-143.
Womack J.A., Goulet J.L., Gibert C., Brandt C., Chang CC., Gulanski B., Fraenkel
L., Mattocks K., Rimland D., Rodriguez-Barradas M.C., Tate J., Yin M.T., Justice
A.C.; Veterans Aging Cohort Study Project Team (2011). Increased risk of fragility
fractures among HIV-infected compared to uninfected male veterans. PLoS One. 6,
e17217.
Womack J.A., Goulet J.L., Gibert C., Brandt C.A., Skanderson M., Gulanski B.,
Rimland D., Rodriguez-Barradas M.C., Tate J., Yin M.T., Justice A.C.; Veterans
Aging Cohort Study Project Team (2013). Physiologic frailty and fragility fracture in
HIV-infected male veterans. Clin. Infect. Dis. 56, 1498-1504.
Wu C., Glüer C., Lu Y., Fuerst T., Hans D., Genant H.K. (1998). Ultrasound
characterisation of bone demineralisation. Calcif. Tissue Int. 62, 133-139.
16
Table 1
General parameters of patients with QUS and DXA data
Parameters Number of patients (%) Mean (+SD)
Sex 224
Men 152 (67.9%)
Women 72 (32.1%)
Age (years) 224 47.02 (+9.26)
BMI (kg/m2) 224 23.73 (+3.45)
Ethnicity 224
Caucasian 213 (95,1%)
Other 11 (4.9%)
QUS
SOS (m/sec) 224 1538.78 (+26.03)
BUA (dB/MHz) 224 63.22 (+14.29)
Stiffness 224 85.82 (+15.79)
T-Score 224 -1.208 (+0.946)
Z-Score 224 -0.596 (+0.919)
DXA
BMD total body 183 1.124 (+ 0.106)
T-Score total body 183 -0.645 (+1.238)
Z-Score total body 183 -0.284 (+1.13)
BMD L1-L4 187 1.050 (+0.180)
T-Score L1-L4 187 -1.041 (+1.464)
Z-Score L1-L4 187 -0.721 (+1.427)
BMD femur 186 0.912 (+0.144)
T-Score femur 186 -1.092 (+1.076)
Z-Score femur 186 -0.666 (+0.982)
BMD femoral neck 185 0.858 (+0.148)
T-Score femoral neck 185 -1.275 (+1.093)
Z-Score femoral neck 185 -0.657 (+0.964)
Fracture (spine Rx) 53
Yes 12 (22.6 %)
Men 8
Women 4
No 41 (77.4 %)
Men 26
Women 15
17
Table 2
DXA and QUS parameters with their correlation coefficients
SOS BUA Stiffness T-score Z-score
Total-body BMD 0.380 0.426 0.415 0.361 0.336
Total-body T-score 0.386 0.403 0.411 0.415 0.402
Total-body Z-score 0.322 0.300 0.329 0.352 0.371
L1-L4 BMD 0.282 0.330 0.313 0.293 0.281
L1-L4 T-score 0.309 0.349 0.338 0.337 0.331
L1-L4 Z-score 0.219 0.222 0.231 0.254 0.295
Femur BMD 0.350 0.402 0.386 0.346 0.318
Femur T-score 0.375 0.395 0.400 0.400 0.378
Femur Z-score 0.309 0.335 0.334 0.327 0.360
Femoral-neck BMD 0.303 0.376 0.345 0.304 0.254
Femoral-neck T-score 0.347 0.389 0.379 0.374 0.328
Femoral-neck Z-score 0.265 0.324 0.300 0.289 0.322
Pearson’s coefficients calculated between DXA and QUS parameters were indicated. All parameters showed a significant correlation (p-values <0.001). QUS, quantitative ultrasound; SOS, speed of sound; BUA, broadband ultrasound attenuation; DXA, dual energy X-ray absorbptiometry; BMD, bone mineral density.
18
Table 3
Correlation coefficients calculated between age and QUS/DXA data
Total Men Women
SOS (m/sec) -0.228 ** -0.162 * -0.377 **
BUA (dB/MHz) -0.142 * -0.016 -0.414 **
Stiffness -0.207 ** -0.117 -0.403 **
T-score (QUS) -0.207 ** -0.116 -0.393 **
Z-score (QUS) 0.006 0.075 -0.140
Total-body BMD (DXA) -0.143 -0.045 -0.332 **
Total-body T-score (DXA) -0.123 -0.026 -0.328 **
Total-body Z-score (DXA) 0.011 0.058 -0.108
L1-L4 BMD (DXA) -0.054 0.055 -0.281 *
L1-L4 T-score (DXA) -0.034 0.092 -0.312 *
L1-L4 Z-score (DXA) 0.146 * 0.187 * 0.032
Femur BMD (DXA) -0.134 -0.031 -0.337 **
Femur T-score (DXA) -0.137 -0.029 -0.353 **
Femur Z-score (DXA) 0.117 0.234 ** -0.122
Femoral neck BMD (DXA) -0.244 ** -0.184 * -0.369 **
Femoral neck T-score (DXA) -0.242 ** -0.163 -0.409 **
Femoral neck Z-score (DXA) 0.116 0.207 * -0.078
Pearson’s coefficients (r) were displayed. * p-value<0.05. ** p-value<0.01.
19
Table 4
Multiple regression analysis
F r p p
Total-body BMD 27.60 0.618 <0.0005
Age -0.125 0.045
QUS Stiffness 0.332 <0.0005
Sex -0.186 0.003
BMI 0.380 <0.0005
Total-body T-score 17.11 0.527 <0.0005
Age -0.088 0.188
QUS Stiffness 0.372 <0.0005
Sex 0.157 0.017
BMI 0.329 <0.0005
Total-body Z-score 9.77 0.424 <0.0005
Age 0.063 0.381
QUS Stiffness 0.351 <0.0005
Sex 0.230 0.001
BMI 0.160 0.025
L1-L4 BMD 7.19 0.369 <0.0005
Age -0.017 0.819
QUS Stiffness 0.286 <0.0005
Sex -0.039 0.581
BMI 0.188 0.010
L1-L4 T-score 8.40 0.395 <0.0005
Age 0.007 0.919
QUS Stiffness 0.327 <0.0005
Sex 0.081 0.250
BMI 0.202 0.005
L1-L4 Z-score 7.22 0.370 <0.0005
Age 0.194 0.008
QUS Stiffness 0.288 <0.0005
Sex 0.208 0.004
BMI 0.072 0.317
Femur BMD 22.06 0.572 <0.0005
Age -0.120 0.062
QUS Stiffness 0.306 <0.0005
Sex -0.124 0.050
BMI 0.387 <0.0005
Femur T-score 20.02 0.554 <0.0005
Age -0.127 0.052
QUS Stiffness 0.345 <0.0005
Sex 0.143 0.026
BMI 0.391 <0.0005
Femur Z-score 13.19 0.475 <0.0005
Age 0.147 0.033
QUS Stiffness 0.344 <0.0005
Sex 0.060 0.374
BMI 0.286 <0.0005
Femoral neck BMD 21.93 0.572 <0.0005
Age -0.258 <0.0005
20
QUS Stiffness 0.241 <0.0005
Sex -0.081 0.204
BMI 0.406 <0.0005
Femoral neck T-score
22.68 0.579 <0.0005
Age -0.258 <0.0005
QUS Stiffness 0.300 <0.0005
Sex 0.165 0.010
BMI 0.429 <0.0005
Femoral neck Z-score
12.79 0.470 <0.0005
Age 0.124 0.076
QUS Stiffness 0.308 <0.0005
Sex 0.081 0.241
BMI 0.328 <0.0005
Multiple regression analysis on relationship between DXA parameters and four predictive factors: QUS stiffness, BMI, age and sex. r -coefficient; p, p-value
Table 5
Fracture (spine Rx)
No (41) Yes (12)
Sex Age
(years)
BMI
(kg/m2)
Sex Age
(years)
BMI
(kg/m2)
Men Women Mean
(SD)
Mean
(SD)
Men Women Mean
(SD)
Mean
(SD)
26 15 48 (9.9) 24.3
(2.7)
8 4 54 (7.3) 24.3
(3.3)
21
Table 6
Contingency tables including all patients
T-Score (QUS) * T-Score total body (DXA)
T-Score total body (DXA) Total
Osteoporosis Normal/osteopenic
T-Score (QUS) <=-2.5 6 2 8 Sensitivity 46,15%
>-2.5 7 168 175 Specificity 98,82%
Total 13 170 183
T-Score (QUS) * T-Score L1-L4 (DXA)
T-Score L1-L4 (DXA) Total
Osteoporosis Normal/osteopenic
T-Score (QUS) <=-2.5 7 1 8 Sensitivity 30,43%
>-2.5 16 163 179 Specificity 99,39%
Total 23 164 187
T-Score (QUS) * T-Score femur (DXA)
T-Score femur (DXA) Total
Osteoporosis Normal/osteopenic
T-Score (QUS) <=-2.5 6 2 8 Sensitivity 40%
>-2.5 9 169 178 Specificity 98,83%
Total 15 171 186
T-Score (QUS) * T-Score femoral neck (DXA)
T-Score femoral neck (DXA) Total
Osteoporosis Normal/osteopenic
T-Score (QUS) <=-2.5 6 2 8 Sensitivity 27,27%
>-2.5 16 161 177 Specificity 98,77%
Total 22 163 185
Gold Standard: DXA T-Scores parameters categorized as osteoporosis (T-score <= -2.5) or normal/osteopenic (T-score > -2.5). Tested variable: QUS T-Score parameter categorized as osteoporosis (T-score <= -2.5) or normal/osteopenic (T-score > -2.5).
22
Table 7
Contingency tables including only patients at risk, namely all women in post-menopausal age and men aged 50 or over
T-Score (QUS)* T-Score total body (DXA)
T-Score total body (DXA) Total
Osteoporosis Normal/osteopenic
T-Score (QUS) <=-2.5 6 1 7 Sensitivity 60%
>-2.5 4 61 65 Specificity 98,39%
Total 10 62 72
T-Score (QUS)* T-Score L1-L4 (DXA)
T-Score L1-L4 (DXA) Total
Osteoporosis Normal/osteopenic
T-Score (QUS) <=-2.5 6 1 7 Sensitivity 42,86%
>-2.5 8 61 69 Specificity 98,39%
Total 14 62 76
T-Score (QUS) * T-Score femur (DXA)
T-Score femur (DXA) Total
Osteoporosis Normal/osteopenic
T-Score (QUS) <=-2.5 5 2 7 Sensitivity 62,50%
>-2.5 3 66 69 Specificity 97,06%
Total 8 68 76
T-Score (QUS)* T-Score femoral neck (DXA)
T-Score femoral neck (DXA) Total
Osteoporosis Normal/osteopenic
T-Score (QUS) <=-2.5 5 2 7 Sensitivity 33,33%
>-2.5 10 59 69 Specificity 96,72%
Total 15 61 76
Gold Standard: DXA T-Scores parameters categorized as osteoporosis (T-score <= -2.5) or normal/osteopenic (T-score > -2.5). Tested variable: QUS T-Score parameter categorized as osteoporosis (T-score <= -2.5) or normal/osteopenic (T-score > -2.5).
23
Table 8
Association between QUS and DXA T-scores in predicting osteoporotic or non-osteoporotic bone
Total Men Women
T-scores p p p
QUS x total-body 0.495 <0.0005 0.246 0.007 0.887 <0.0005
QUS x L1-L4 0.418 <0.0005 0.276 0.002 0.638 <0.0005
QUS x femur 0.542 <0.0005 0.371 <0.0005 0.802 <0.0005
QUS x femoral neck 0.429 <0.0005 0.308 0.001 0.598 <0.0005
Phi () coefficients were displayed. , phi test; p, p-value
24
FIGURE 1: ROC curves for QUS parameters from HIV-positive patients with or without a diagnosis of
osteoporosis, based on total-body DXA T-scores. The threshold was set at -2.5, with osteoporotic
patients having T-scores ≤-2.5 and non- osteoporotic patients having T-scores >-2.5.


![Quantitative ultrasound applied to metacarpal bone in infants · mass index (BMI) was calculated (weight in kilograms divided by height in square meters [kg/m2]). QUS assessment The](https://static.fdocuments.in/doc/165x107/5e7b3d021d1be547ae655505/quantitative-ultrasound-applied-to-metacarpal-bone-in-infants-mass-index-bmi-was.jpg)