
Cal-Maine Foods, Inc · 3 C AL-MAINE FOODS PROFILE We are the largest producer and marketer of...
38
1 CAL-MAINE FOODS, INC. Investor Presentation January 2018
-
Upload
duonghuong -
Category
Documents
-
view
214 -
download
0
Transcript of Cal-Maine Foods, Inc · 3 C AL-MAINE FOODS PROFILE We are the largest producer and marketer of...
1
CAL-MAINE FOODS, INC.
Investor Presentation
January 2018
2
FORWARD-LOOKING STATEMENTS
This presentation includes forward-looking statements, which are all
statements other than historical facts, can be identified by use of words
such as “expect,” “will,” and “anticipate,” and include statements
regarding expected operating results, acquisition transactions and
potential effects of industry events or trends on our business. Important
factors that can cause our results to differ materially from those
anticipated in the forward-looking statements include egg prices and
feed costs; changes in consumer demand or requirements of major
customers; unanticipated results of acquisitions or joint ventures; ability
to obtain eggs from outside producers; agricultural, regulatory and
litigation risks; and other factors described in the cautionary language
included in our filings with the Securities and Exchange Commission,
including in the “Risk Factors” section of our annual report on Form 10-
K and subsequent filings. We undertake no obligation to update any
forward-looking statements.

3
CAL-MAINE FOODS PROFILE
We are the largest producer and marketer of
shell eggs in the United States
Founded in 1957 in Jackson, Mississippi
Acquired Ralston-Purina egg operations in 1972
Completed 20 acquisitions since 1989
Fully-integrated egg producer
Since 1996, publicly traded on NASDAQ under symbol “CALM”
FY 2017 U.S. fresh shell egg market share - 20 percent
Achieved record sales of $1.9 billion in FY 2016
FY 2017 sales $1.1 billion, down 43.7% from prior year
4
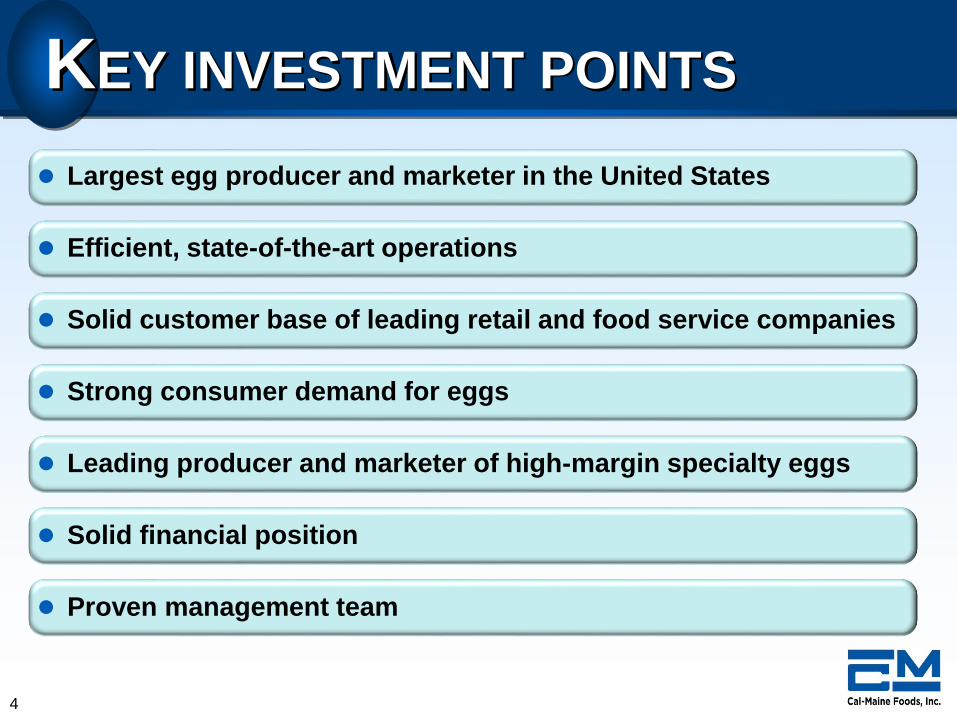
KEY INVESTMENT POINTS
Largest egg producer and marketer in the United States
Efficient, state-of-the-art operations
Solid customer base of leading retail and food service companies
Strong consumer demand for eggs
Leading producer and marketer of high-margin specialty eggs
Solid financial position
Proven management team

5
THE U.S. EGG INDUSTRY
In calendar year 2016, the United States produced
about 89 billion eggs.
66%3%
31%
Shell Eggs to
Foodservice &
Consumers
Egg Products
(Liquid, Frozen)
Exports
6
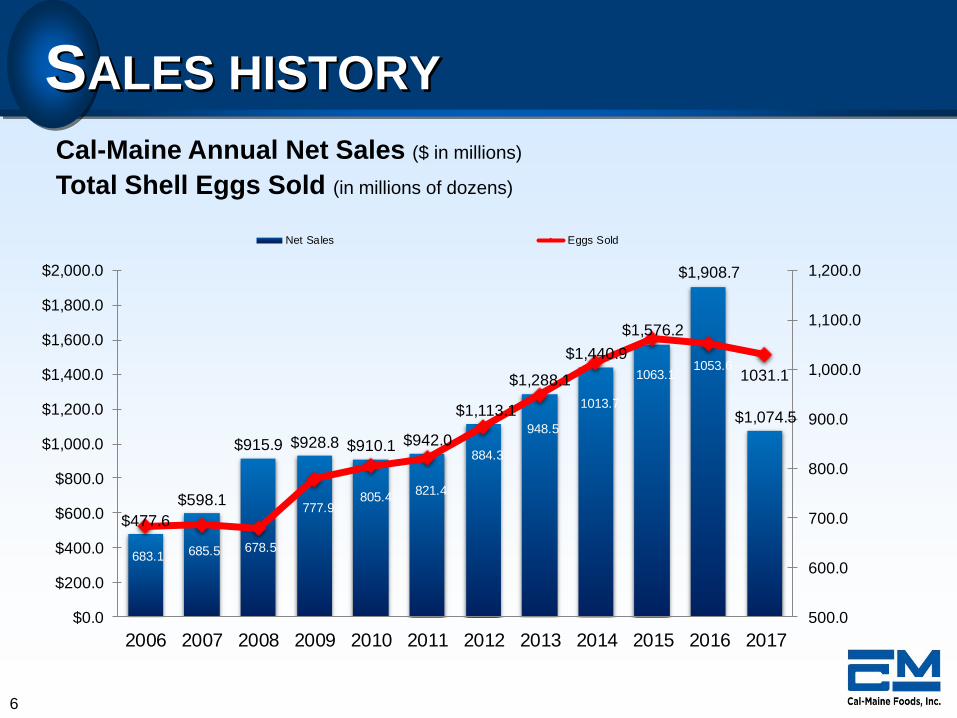
$477.6
$598.1
$915.9 $928.8 $910.1 $942.0
$1,113.1
$1,288.1
$1,440.9
$1,576.2
$1,908.7
$1,074.5
683.1 685.5 678.5
777.9805.4
821.4
884.3
948.5
1013.7
1063.11053.6
1031.1
500.0
600.0
700.0
800.0
900.0
1,000.0
1,100.0
1,200.0
$0.0
$200.0
$400.0
$600.0
$800.0
$1,000.0
$1,200.0
$1,400.0
$1,600.0
$1,800.0
$2,000.0
2006 2007 2008 2009 2010 2011 2012 2013 2014 2015 2016 2017
Net Sales Eggs Sold
SALES HISTORY
Cal-Maine Annual Net Sales ($ in millions)
Total Shell Eggs Sold (in millions of dozens)

7
CAL-MAINE LOCATIONS
Cal-Maine Locations
8
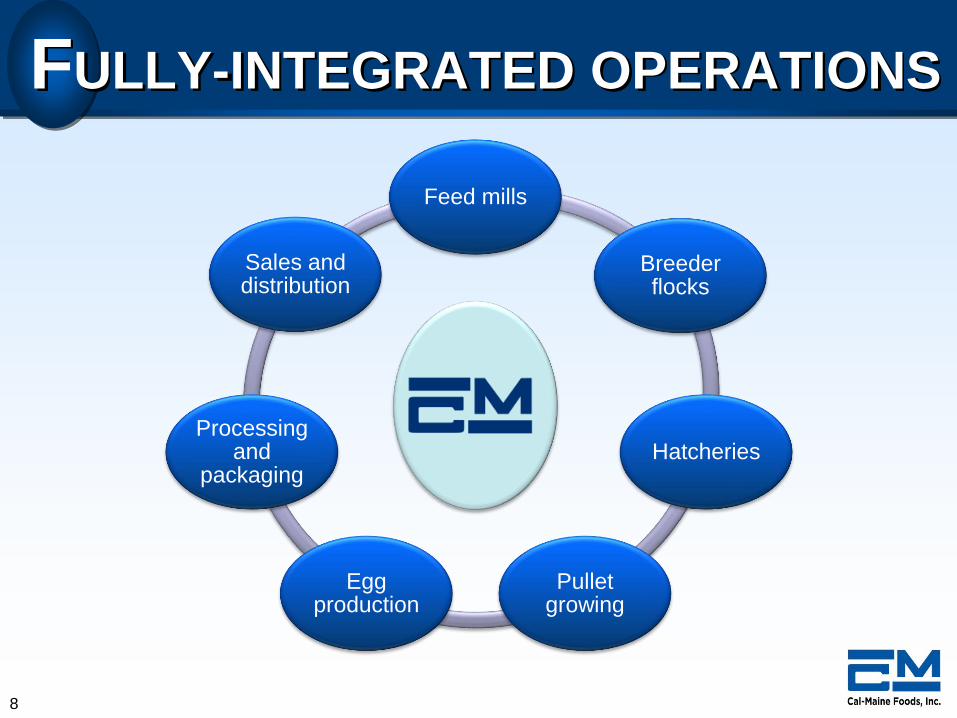
FULLY-INTEGRATED OPERATIONS
Feed mills
Breeder flocks
Hatcheries
Pullet growing
Egg production
Processing and
packaging
Sales and distribution

9
EGG PRODUCTION FACILITIES
92%
8%
Contract production
Company-owned

10
COMPANY-OWNED FACILITIES
State-of–the-art
Fully-automated
Temperature
controlled
Labor efficient
Located near our customers
11
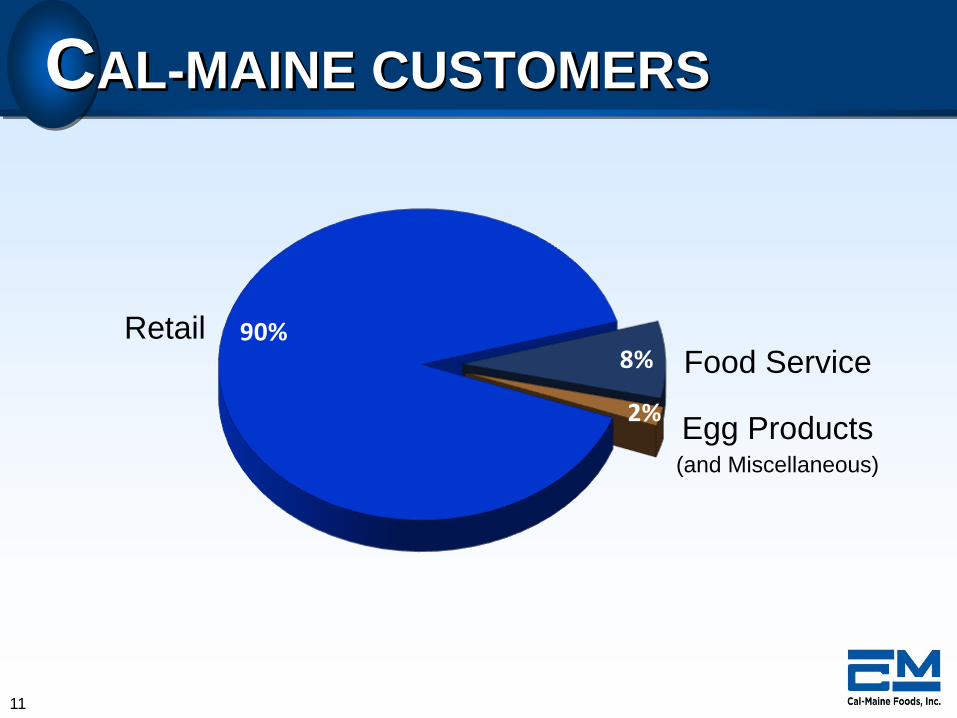
90%8%
2%
CAL-MAINE CUSTOMERS
RetailFood Service
Egg Products(and Miscellaneous)
12
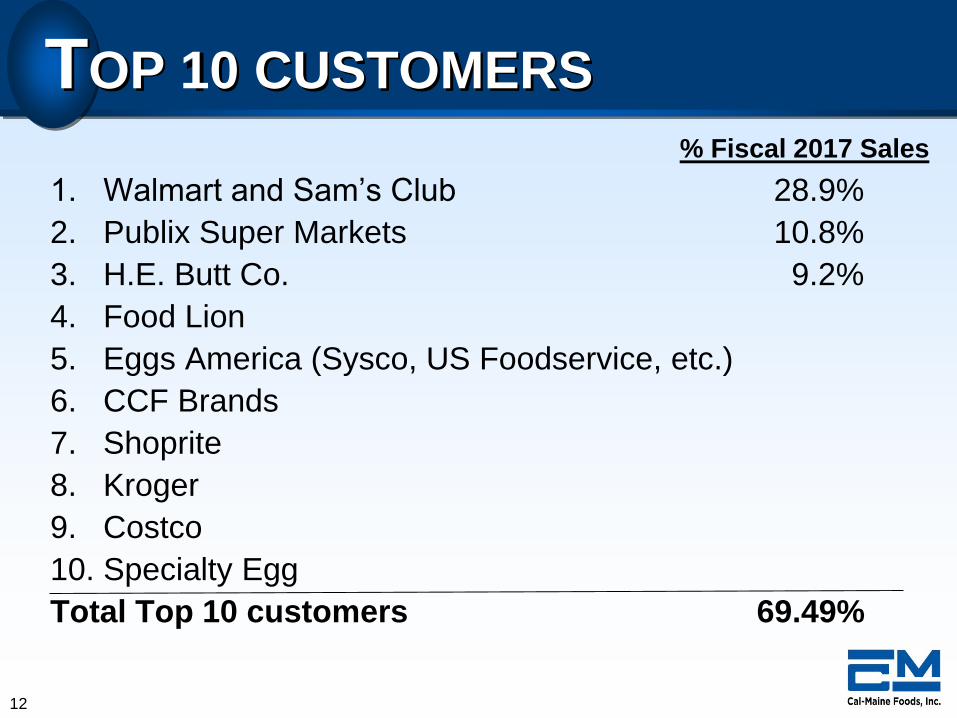
TOP 10 CUSTOMERS
1. Walmart and Sam’s Club 28.9%
2. Publix Super Markets 10.8%
3. H.E. Butt Co. 9.2%
4. Food Lion
5. Eggs America (Sysco, US Foodservice, etc.)
6. CCF Brands
7. Shoprite
8. Kroger
9. Costco
10. Specialty Egg
Total Top 10 customers 69.49%
% Fiscal 2017 Sales
13
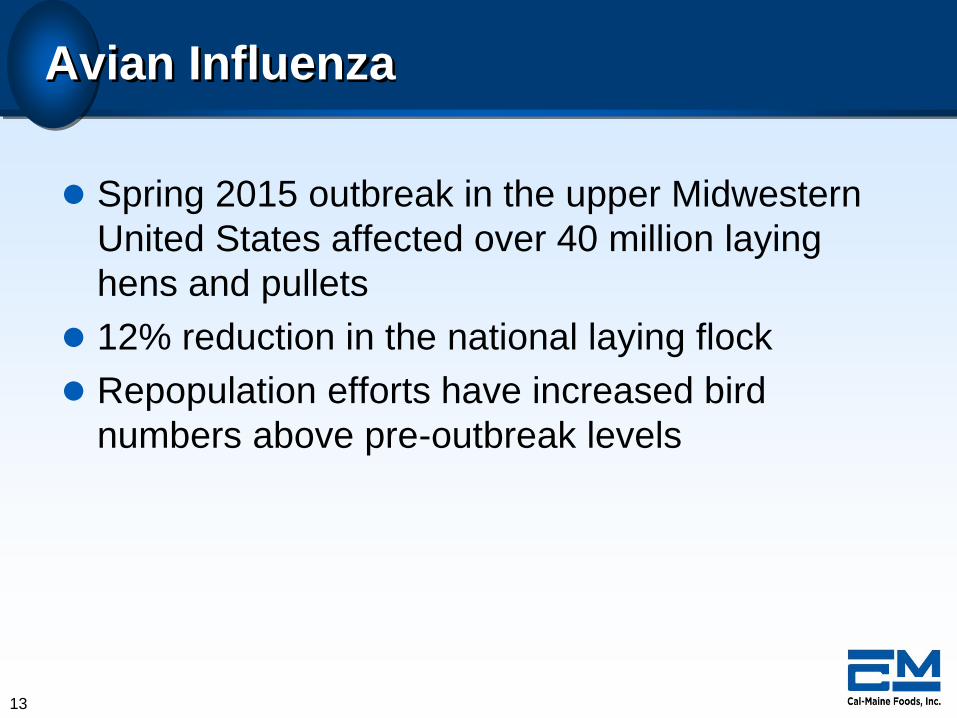
Avian Influenza
Spring 2015 outbreak in the upper Midwestern
United States affected over 40 million laying
hens and pullets
12% reduction in the national laying flock
Repopulation efforts have increased bird
numbers above pre-outbreak levels

14
MONTHLY HEN INVENTORY
Million Hens First Day of Month
Source: USDA Chicken and Egg Report as Revised December 2017
265.0
275.0
285.0
295.0
305.0
315.0
325.0
Jan Feb Mar Apr May June July Aug Sept Oct Nov Dec
2013
2014
2015
2016
2017
15
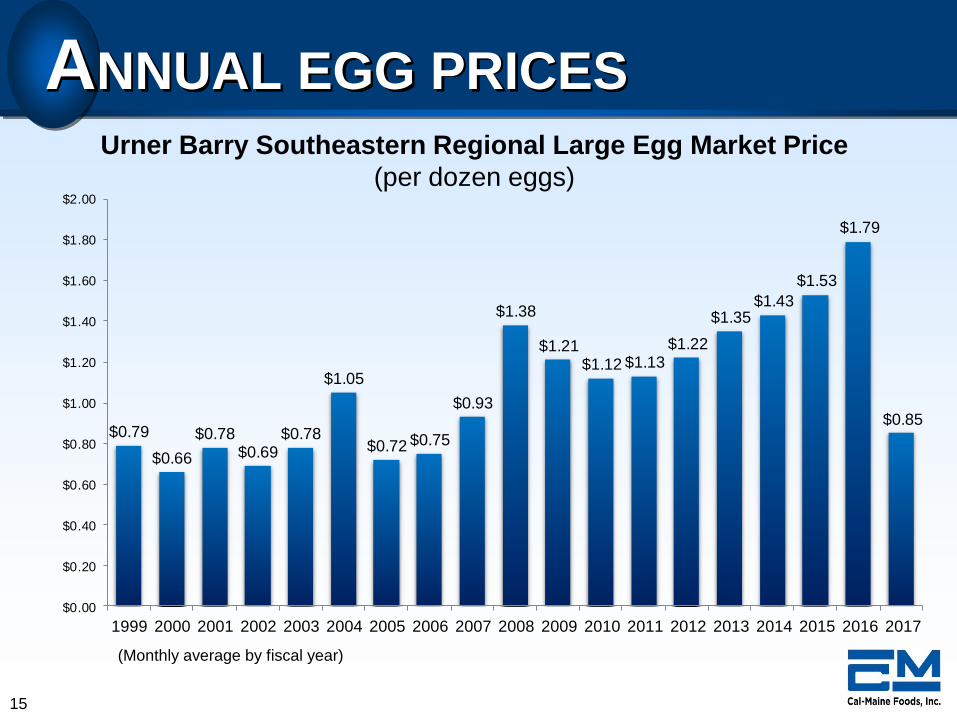
ANNUAL EGG PRICES
(Monthly average by fiscal year)
Urner Barry Southeastern Regional Large Egg Market Price
(per dozen eggs)
$0.79
$0.66
$0.78$0.69
$0.78
$1.05
$0.72 $0.75
$0.93
$1.38
$1.21$1.12 $1.13
$1.22
$1.35$1.43
$1.53
$1.79
$0.85
$0.00
$0.20
$0.40
$0.60
$0.80
$1.00
$1.20
$1.40
$1.60
$1.80
$2.00
1999 2000 2001 2002 2003 2004 2005 2006 2007 2008 2009 2010 2011 2012 2013 2014 2015 2016 2017

16
VOLATILE FEED INGREDIENT PRICES
(Monthly average)
Corn
$/bushel
Soy Meal
$/ton
Soy Bean Meal Dollars per Ton Corn Dollars per Bushel
9
8
7
6
5
4
3
2
1
00.00
100.00
200.00
300.00
400.00
500.00
600.00
700.00
800.00
900.00

17
FEED COSTS
29
30
35
42
46
39
3738
3635 35
3333
39
40
45
48
47
45
48
51
57
55
53
54
49
46
49 48
43 44
41
42 4341
40
43
39 40
38 3839
20
25
30
35
40
45
50
55
60
1Q
08
2Q
08
3Q
08
4Q
08
1Q
09
2Q
09
3Q
09
4Q
09
1Q
10
2Q
10
3Q
10
4Q
10
1Q
11
2Q
11
3Q
11
4Q
11
1Q
12
2Q
12
3Q
12
4Q
12
1Q
13
2Q
13
3Q
13
4Q
13
1Q
14
2Q
14
3Q
14
4Q
14
1Q
15
2Q
15
3Q
15
4Q
15
1Q
16
2Q
16
3Q
16
4Q
16
1Q
17
2Q
17
3Q
17
4Q
17
1Q
18
2Q
18
Cents per Dozen Eggs Produced

18
Pursue acquisitions of existing shell egg production
and processing facilities
Enhance production capacity and efficiency
Increase value-added specialty egg business
GROWTH STRATEGY
19
GROWTH STRATEGY
Pursue acquisition opportunities
Leverage solid track record with completion of 20
acquisitions since 1989
Extend ability to identify, execute and integrate additional
operations
Expand capabilities in existing markets and broaden
geographic reach
Enhance national presence and strengthen customer
relationships

20
ACQUISITION OPPORTUNITIES
Layers in Production, December 31, 2016, in thousands Source: Egg Industry Magazine – February 2017
Top U.S. Egg Producers
21
FOODONICS INTERNATIONAL, INC.
Cal-Maine Foods acquired substantially all of the assets of
Foodonics International, Inc. and its related entities doing
business as Dixie Egg Company.
Includes capacity for 1.6 million laying hens and related feed
production, milling and distribution facilities in Georgia and
Florida as well as contract grower arrangements for an
additional 1.5 million laying hens.
Acquired Egg-Land’s Best franchise with licensing rights for
portions of certain markets in Alabama, Florida and Georgia
as well as Puerto Rico, Bahamas and Cuba.

22
HAPPY HEN EGG FARMS, INC.
Cal-Maine Foods acquired substantially all of the assets of
Happy Hen Egg Farms, Inc.
Includes capacity for 350,000 laying hens and distribution
facilities near Harwood and Wharton, Texas.
Site is designed for capacity of up to 1.2 million laying hens.

23
Enhance production capacity and efficiency
GROWTH STRATEGY
• Over the last five years we have spent over $310 million to expand
and upgrade our facilities
• Projects in Kentucky, Texas, Arkansas, and Florida will increase
Cage-Free and Organic capacity
24
RED RIVER VALLEY EGG FARM, LLC
Cal-Maine Foods and Rose Acre Farms have entered a
production joint venture to build a cage-free shell egg
production complex near Bogata, Red River County, Texas
Provides for capacity of approximately 1.8 million laying hens, with
permits for up to 2.9 million hens
Creates 80-100 new jobs in local community
Fully online in 2017
Enhances ability to meet growing demand for cage-free and other
specialty eggs

25
GROWTH STRATEGY
Offer nutritionally enhanced eggs,
cage-free and organic eggs
Meet consumer demand in rapidly
growing segment
Benefit from higher and less cyclical
selling prices
Through Q2 FY 2018, represented
22.6 percent of dozens sold and
32.3 percent of sales revenue
Increase value-added specialty egg business

26
SPECIALTY EGG SALES
679778
805 821884
9481,014
1,063 1,054 1,031
81 107 116 132 144 156 174211 242 236
0
200
400
600
800
1000
1200
FY2008 FY2009 FY2010 FY2011 FY2012 FY2013 FY2014 FY2015 FY2016 FY2017
Total
Dozen Eggs Sold (in millions)
Specialty

27
KEY STRENGTHS
Fully-integrated operations located in 16 states
Focused on automation throughout the supply chain
Eggs taste great and provide an affordable and
convenient source of protein
Solid track record of internal growth and acquisitions
Increasing sales of high-margin specialty eggs
Leading names of retail and institutional food service
customers
Solid financial position supports future growth
Low Cost
Producer
Favorable Consumer
Demand Trends
Attractive Growth
Profile
Solid Customer
Base
Strong Balance
Sheet
28
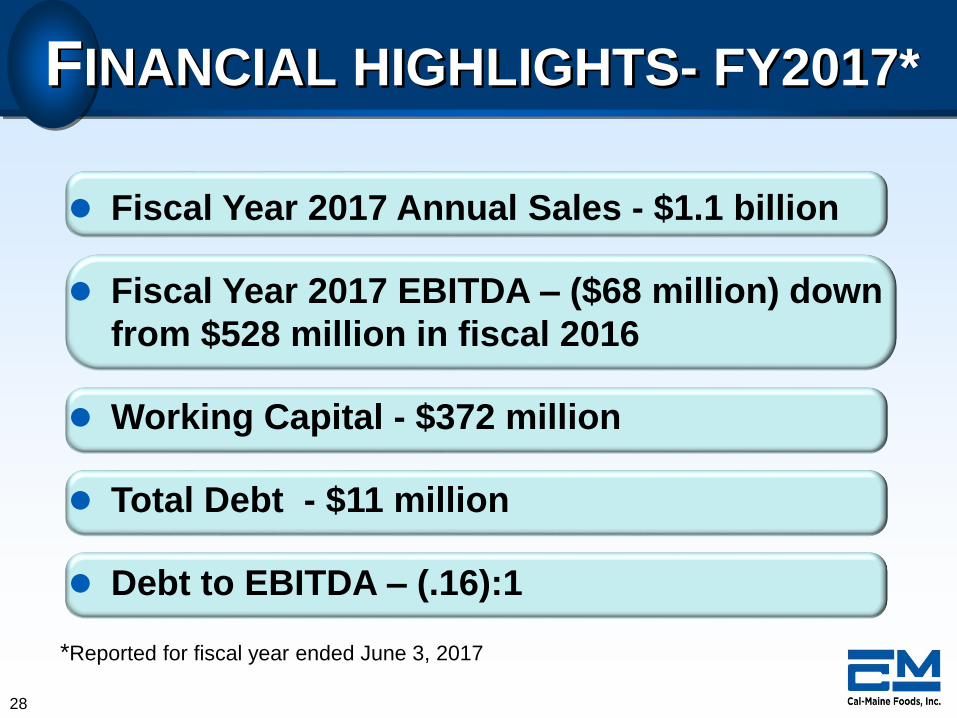
FINANCIAL HIGHLIGHTS- FY2017*
Fiscal Year 2017 Annual Sales - $1.1 billion
Fiscal Year 2017 EBITDA – ($68 million) down
from $528 million in fiscal 2016
Working Capital - $372 million
Total Debt - $11 million
Debt to EBITDA – (.16):1
*Reported for fiscal year ended June 3, 2017
29
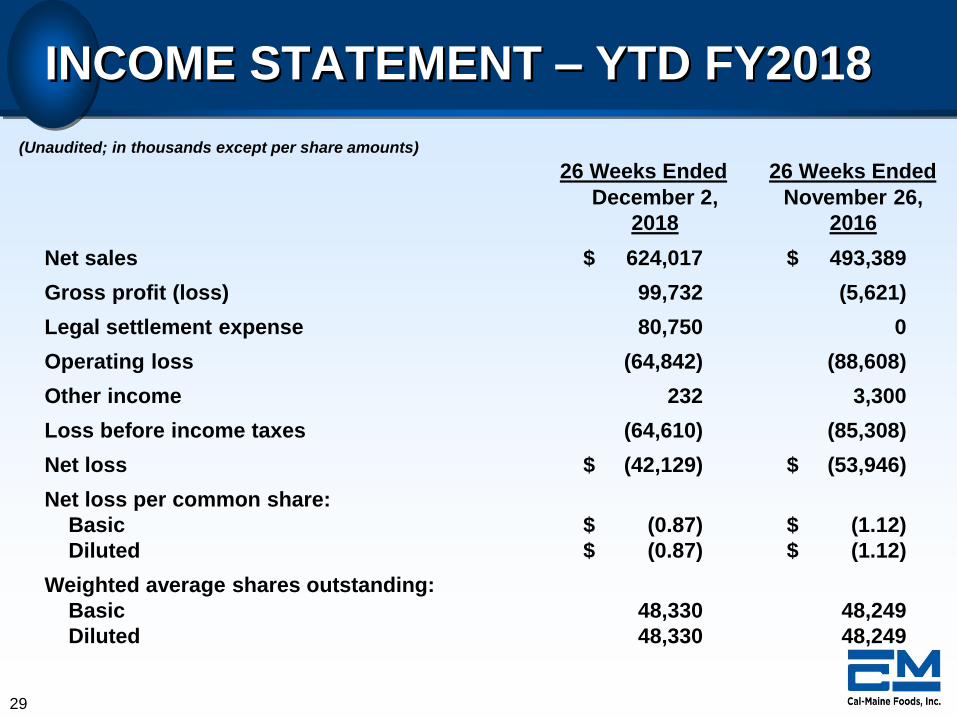
INCOME STATEMENT – YTD FY2018
26 Weeks Ended 26 Weeks Ended
December 2, November 26,
2018 2016
Net sales $ 624,017 $ 493,389
Gross profit (loss) 99,732 (5,621)
Legal settlement expense 80,750 0
Operating loss (64,842) (88,608)
Other income 232 3,300
Loss before income taxes (64,610) (85,308)
Net loss $ (42,129) $ (53,946)
Net loss per common share:
Basic $ (0.87) $ (1.12)
Diluted $ (0.87) $ (1.12)
Weighted average shares outstanding:
Basic 48,330 48,249
Diluted 48,330 48,249
(Unaudited; in thousands except per share amounts)
30
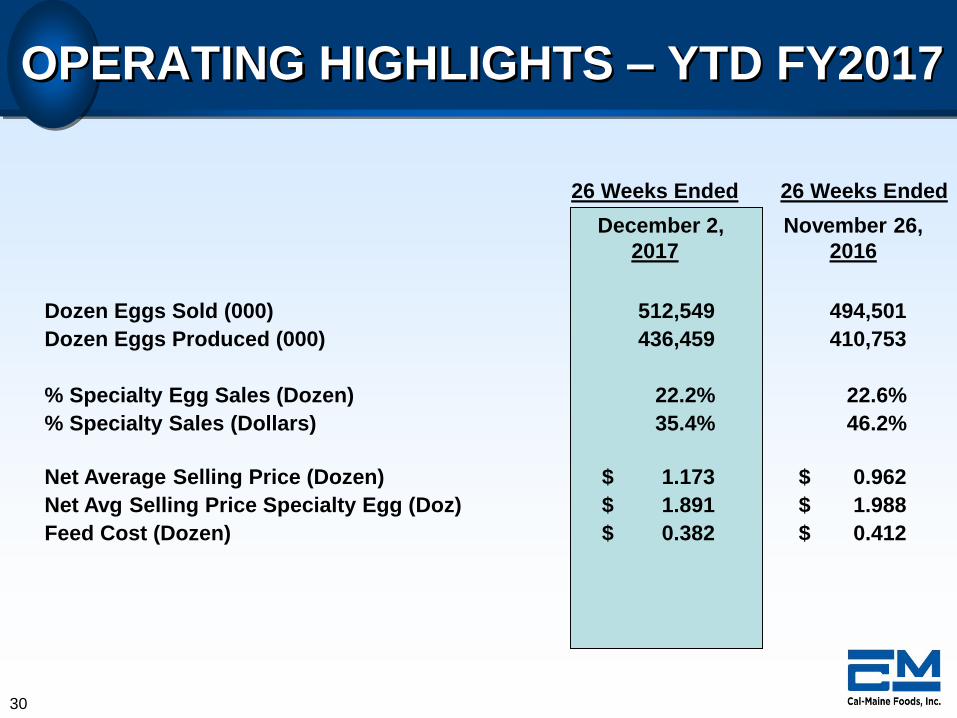
OPERATING HIGHLIGHTS – YTD FY2017
26 Weeks Ended 26 Weeks Ended
December 2, November 26,
2017 2016
Dozen Eggs Sold (000) 512,549 494,501
Dozen Eggs Produced (000) 436,459 410,753
% Specialty Egg Sales (Dozen) 22.2% 22.6%
% Specialty Sales (Dollars) 35.4% 46.2%
Net Average Selling Price (Dozen) $ 1.173 $ 0.962
Net Avg Selling Price Specialty Egg (Doz) $ 1.891 $ 1.988
Feed Cost (Dozen) $ 0.382 $ 0.412

31
BALANCE SHEET HIGHLIGHTS
December 2, June 3,
2017 2017
Cash and short-term investments $ 209,300 $ 156,026
Total assets $ 1,066,131 $1,033,094
Long-term debt, less current maturities $ 4,204 $ 6,113
Shareholders' equity $ 803,954 $ 844,493
Working capital $ 311,238 $ 371,527
Debt to Capital .01:1 .01:1
(Unaudited; in thousands)

32
CASH USE PRIORITIES
Variable Dividend
1/3 of Net Income Paid Quarterly
(after recovery of losses)
Acquisition of Existing Capacity

33
CASH DIVIDENDS PAID*
7.9
19.1 21.6
7.1
0.0
8.6
24.0
14.7
3.4
10.6
23.5
5.1 2.2
16.3 18.2
26.0
6.6 10.0
21.2
0.0 3.4
18.1
29.6
21.7 19.1
25.2
35.0 31.7
98.3
75.1
44.1
0.0 0.0 0.0 0.0 0.0 0.0 0.0
*Cents per share, as adjusted for October 31, 2014, two-for-one stock split

34
STOCK OWNERSHIP & FLOAT
Holdings as of July 21, 2017
Shares % of
Ownership Outstanding TotalShares Owned by Adams/Baker Family
(Excludes ESOP) 16,828,942 34.6%
Shares Owned by Other Insiders
(Excludes ESOP) 221,576 0.5%
Shares Owned by ESOP 2,280,818 4.7%
Public Float 29,242,716 60.2%
Total Outstanding Shares 48,574,052 100.0%

35
KEY INVESTMENT POINTS
Largest egg producer and marketer in the United States
Efficient, state-of-the-art operations
Solid customer base of leading retail and food service companies
Strong consumer demand for eggs
Growing market for high-margin specialty eggs
Solid financial position
Proven management team

36
FINANCIAL SUMMARY
$477.6 $598.1 $915.9 $928.8 $910.1 $942.0 $1,113 $1,288 $1,441 $1,576 $1,909 $1,075-$200.0
-$100.0
$0.0
$100.0
$200.0
$300.0
$400.0
$500.0
$0.0
$200.0
$400.0
$600.0
$800.0
$1,000.0
$1,200.0
$1,400.0
$1,600.0
$1,800.0
$2,000.0
2006 2007 2008 2009 2010 2011 2012 2013 2014 2015 2016 2017
Net Sales Operating Income
Annual Net Sales and Operating Income($ in millions)
Dozen
Eggs Sold(In millions)
685 778 805 821 884 948 1,014 1,063
FY 2013 Operating Income of $87.6 million excluding litigation settlement
679683 1,054 1,031
37
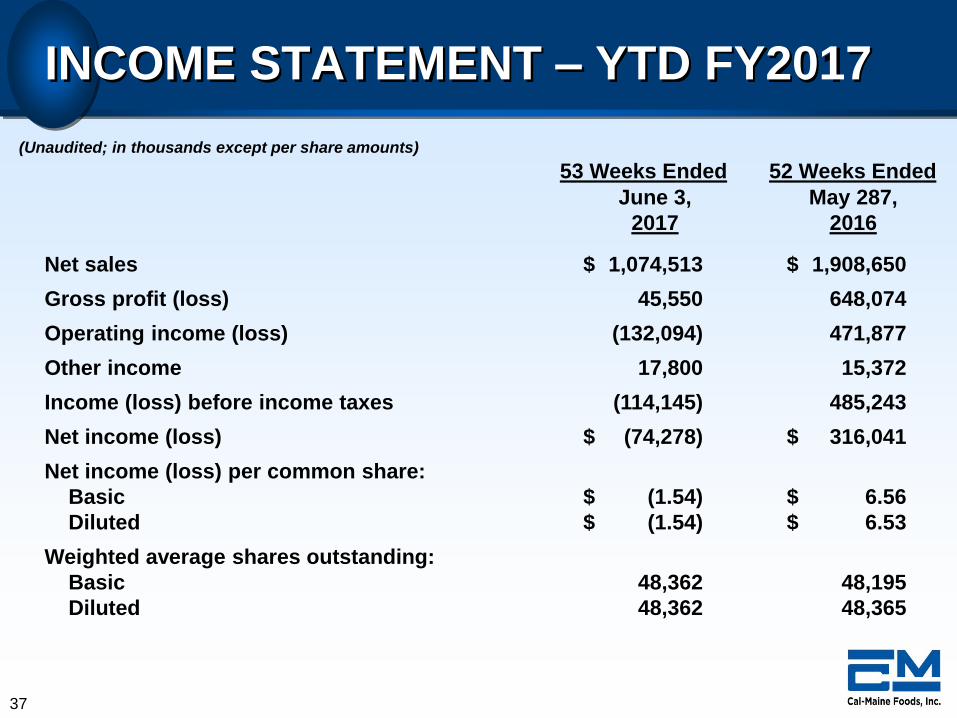
INCOME STATEMENT – YTD FY2017
53 Weeks Ended 52 Weeks Ended
June 3, May 287,
2017 2016
Net sales $ 1,074,513 $ 1,908,650
Gross profit (loss) 45,550 648,074
Operating income (loss) (132,094) 471,877
Other income 17,800 15,372
Income (loss) before income taxes (114,145) 485,243
Net income (loss) $ (74,278) $ 316,041
Net income (loss) per common share:
Basic $ (1.54) $ 6.56
Diluted $ (1.54) $ 6.53
Weighted average shares outstanding:
Basic 48,362 48,195
Diluted 48,362 48,365
(Unaudited; in thousands except per share amounts)
38
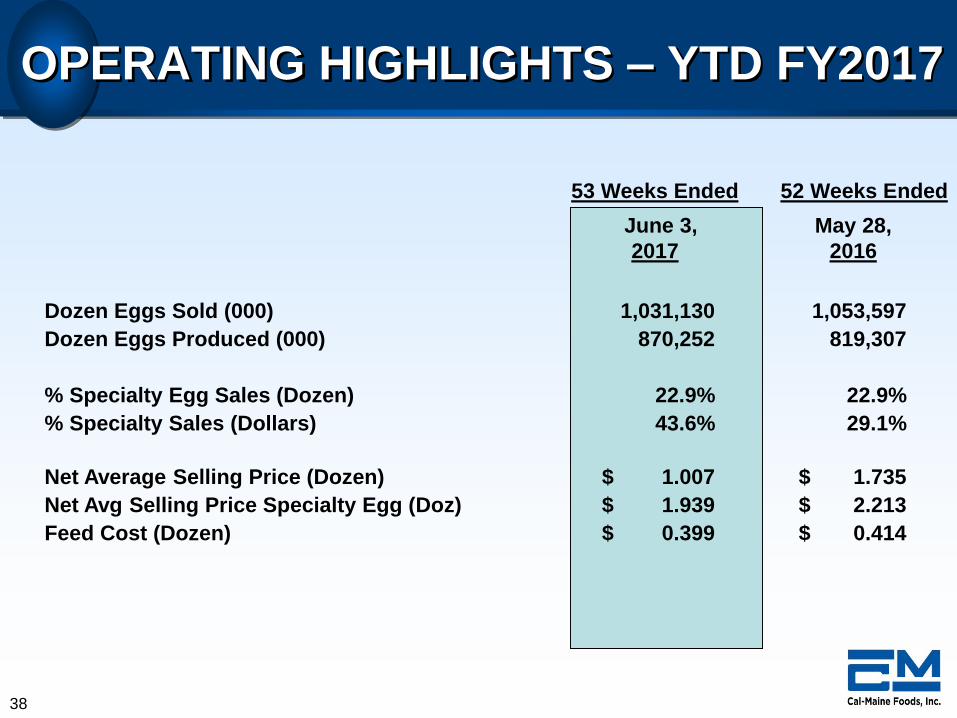
OPERATING HIGHLIGHTS – YTD FY2017
53 Weeks Ended 52 Weeks Ended
June 3, May 28,
2017 2016
Dozen Eggs Sold (000) 1,031,130 1,053,597
Dozen Eggs Produced (000) 870,252 819,307
% Specialty Egg Sales (Dozen) 22.9% 22.9%
% Specialty Sales (Dollars) 43.6% 29.1%
Net Average Selling Price (Dozen) $ 1.007 $ 1.735
Net Avg Selling Price Specialty Egg (Doz) $ 1.939 $ 2.213
Feed Cost (Dozen) $ 0.399 $ 0.414