CAISSE D DPT D B - Gestionnaire d’actif · FL Th d dpt t plnt d b ttll tn fnnl ntttn n t nvtnt...
54
CAISSE DE DEPOT ET PLACEMENT DU QUEBEC ANNUAL REPORT 1991
Transcript of CAISSE D DPT D B - Gestionnaire d’actif · FL Th d dpt t plnt d b ttll tn fnnl ntttn n t nvtnt...

CAISSEDE DEPOT
ET PLACEMENTDU QUEBEC
ANNUAL REPORT 1991

IFILE
The Caisse de depot et placementdu Québec is a totally autono-mous financial institution in itsinvestment management opera-
tions. It was formed in 1965 by an act ofthe National Assembly to manage the fundsarising from various Quebec public pensionand insurance plans. Its dual mandate con-sists in achieving an optimum financialreturn and making a sustained and durablecontribution to the Québec economy. Toachieve these objectives, it uses a variedand broad range of traditional and innova-tive financial instruments: bonds, shares
SUMMARY
HIGHLIGHTS
MESSAGE FROM THE CHAIRMAN
OF THE BOARD AND CHIEF
EXECUTIVE OFFICER
2
MESSAGE FROM THE PRESIDENT
AND CHIEF OF OPERATIONS
ECONOMIC REVIEW
8
ASSET MIX
12
DEPOSITORS' FUNDS
18
ADM IN ISTRATION
24
INVESTMENT OPERATIONS
26
FINANCIAL STATEMENTS
39
and convertible securities, mortgages, realestate and short-term securities, money mar-ket derivative and synthetic products. Thishealthy diversification, which is applied tothe Quebec, Canadian and foreign markets,is combined with active management andan astute choice of investments. The Caisse,whose principal place of business is lo-cated in the heart of Montreal, a first-classfinancial centre, is one of North America'smajor financial institutions.

1111H 1 HLIGHTS. L
19911990'(ni millions of dollars)
ASSETS UNDER MANAGEMENTInvestments
BondsShares and convertible securitiesMortgagesReal estate investments - net'Short-term investments
18,50213,4802,0201,7951,811
17,73112,4232,0121,6041,825
Total investments at book value - net 37,608 35,595Other assets and liabilities 498 73
Total assets under management at book value 38,106 35,668Excess market value over book %Aim
of investments 3,026 591
Total market value of assets under management 41.132 36,259
DEPOSITORS' HOLDINGS
Regie des rentes du Quebec 15,887 14,649Commission administrative des regimes
de retraite et d'assurances - RREGOP 11,973 9,970Societe' de l'assurance automobile du Quebec 5,393 4,886Commission de la sante et de la securite du travail 3,986 3,594Commission de la construction du Quebec 3,643 3,013Other depositors 250 147
Total depositors' holdings 41,132 36,259
NET DEPOSITORS' INCOME 3,675 2,777
NET DEPOSITORS' WITHDRAWALS 1,237 450
RATE OF RETURN' 17.2% 0.5%
I restated to conform with the presentation of 19912 reduced since 1990 by related hank and mortgage loans
calculated at market value using the time-weighted method

pi SAGE FROM THE CHAIRMAN OF THE BOARD
CHIEF EXECUTIVE OFFICER
The Caisses 25th anniversary in 1991 wasan occasion to call attention to the role it hasplayed since its founding, as well as to ac-knowledge the confidence Quebecers haveplaced in it and to measure their expectations.Thus the past year further encouraged andmotivated both Management and personnelin actively pursuing the Caisses mandate.
Anniversaries afford indeed an opportunityto review the past, and 1991 could not haveprovided a more opportune time for such reflec-tion. The economic slowdown which emergedduring the second half of 1990 continued,however, to darken the horizon. A few signsof recovery appeared at the beginning of 1991,
and some observers were quick to interpretthem as proof that the recession was over.However, their optimism was short-lived aseconomic activity slumped again, dashinghopes of a quick recovery.
The weakness of the recovery intensified thefeeling of gloom among the business commu-nity and the general public, especially in themonths that followed. Many industries restruc-tured and rationalized their operations, resultingin numerous layoffs. Companies which hadposted exceptional growth in previous yearsfound themselves struggling.
The slowdown was not, however, limitedto Québec. It affected the entire industrializedworld, eloquent proof of the increasing inter-dependency of global economies.
The recession spread throughout Canada, andalso sparked a major downturn in the UnitedStates, thereby depriving the Quebec exportmarkets of an important stimulus. Even thosecountries which until then had enjoyed unprec-edented growth saw their economies lose steam.
Coming on the heels of the Canadian reces-sion, this slowdown threatens to persist andthus put a damper on the recovery of NorthAmerican economies. Japanese markets, whichhad seemed immune to economic fluctuations,showed signs of weakness; and for their part,Western European economies, including thoseof the European Community, experienced simi-lar difficulties after a period of tremendousvitality.
Although Canadian gross domestic product didnot rebound as strongly as hoped, it nonethelessrecorded modest but sustained growth duringthe second half of 1991. Several sectors of theeconomy continued to decline, however, in-dicating that this was not an across-the-boardimprovement. But the drop in interest rates,the Canadian dollar and inflation all point to astronger recovery. Furthermore, these factors,which can only restore confidence in the econ-omy and encourage consumer and investmentspending, have already begun to leave theirmark on bond and equity markets, whichrallied in the final weeks of 1991.
In spite of tough economic times, the Caisseachieved a most impressive overall return of17.2%. Beyond this very positive performance,it must be noted that the Caisse is first andforemost a long-term investor, and structuresits investment strategies accordingly; in thisperspective, then, the institution's averageannual return over the past 10 years has been14.4%, or almost 10% higher than the 4.8%average annual inflation rate for the sameperiod.
The past year was also marked by events inboth the political and military arenas whichrekindled uncertainty over the economic future.At the start of 1991, the outbreak of war in the
2
Persian Gulf region mobilized the resourcesof the industrialized countries for a short butintense period. Although the war temporarilydiverted attention away from the economy, itcontributed to the atmosphere of general uncer-tainty and more specifically to the erosion of anumber of economic sectors.
In the political arena, the delicate balanceachieved in recent years by certain CentralEuropean countries and the republics of theformer USSR was suddenly upset, bringingabout the collapse of a political entity thatplayed a major role in shaping the West'sforeign policy for so many decades. While theeconomic outlook for the countries of the newCommonwealth of Independent States was atbest not very promising, despite their shift toa market economy, their present situation iscause for the gravest concern, given the politicaland social instability which could conceivablyemerge in these countries in the foreseeablefuture.
Although less spectacular than the changes thatrocked Eastern Europe, the treaty of Maastrichtmarked a decisive stage in the development ofthe European Community. The treaty definesobjectives and outlines a specific timetable fornegotiating, by January 1, 1999, the terms andconditions of the third phase of economic andmonetary union, under which a single Europeancurrency will be created. The treaty transcendsstrictly economic and monetary concerns sinceit also deals with implementation of a commonforeign and defence policy. It can therefore besaid that this treaty is both the culmination of along and gradual movement towards a Europeanunion of a federal type, and the beginning of anegotiating process that will take many years.The progress made so far in reinforcing existingties among EC members has, in some respects,exceeded the more modest objectives manysceptics had thought feasible in so short a time.However, extensive and inevitably arduous ne-gotiations will be required before the variousprovisions of the treaty can be translated intoreality. These will therefore test the membercountries' ability to reconcile their trade andeconomic objectives with the political impera-tives of the EC's various regions. Even thoughthis historic treaty has yet to be ratified by eachcountry's parliament, it nonetheless clearlyshows the signatories' desire for cohesion andtheir will to join together, in the perspective ofthe challenges that trade liberalization willpresent for their economies and industries inthe foreseeable future.
Similar concerns in fact prompted Canada andthe U.S. to conclude the Free Trade Agreement,and later to begin negotiation of a similar agree-ment with Mexico. For its part, the internationalcommunity was encouraged to continue theUruguay Round of GATI. talks, which willno doubt soon reach a conclusion despite theformidable obstacles that still lie in its path.
The outlines of three colossal economic blocsare therefore clearly discernable, around whichwill revolve the economic activity of the coun-tries and industries comprising them. Oneither side of the Atlantic will be the Europeanbloc and the North American bloc, Across thePacific, a third group, formed of Asian countriesconceivably with Japan as its hub, could soonspring into existence, whose dynamics wouldundoubtedly influence those of the other two.
Until now, the concept of globalization whichhas emerged in recent decades may well haveseemed more theoretical than real, but its exist-ence can no longer be denied, nor can itsirrevocable repercussions, given the concretesteps governments and businesses everywhereare taking in preparation.
These shifts in the economic map, accompa-nied as they are by far-reaching and systematicchanges in the rules that have traditionallygoverned trade, are nothing less than a preludeto a new world order which will affect everynation on earth. It is vital to prepare for it.Even though the challenge of this new worldorder is undeniably now upon us, one cannothope to meet it effectively by adopting short-term measures; on the contrary, the adjustmentprocess must be placed in a longer-termperspective. It must begin at the very heart ofeconomies and businesses with the goal ofsecuring lasting profitability, a goal that cannotbe reached other than by constantly seekingoptimal levels of productivity that will ensureand sustain competitiveness. Expedient solu-tions and quick fixes are not enough. Thecomplexity of the problems posed by global-ization requires that priorities be defined in astrategic perspective, and that investments bemade in job training, in research and devel-opment and in new production technologies,especially in the manufacturing sector, which isstill operating far short of its potential. Is not thesuccess of certain foreign economies which arenow reaping the benefits of strategies they pa-tiently and systematically applied withoutexpecting concrete short-term results explainedby their willingness to adopt this kind of
3
strategic orientation and make this kind ofinvestment?
Every economy faces the inexorable challengeof the new world order, although to differingdegrees. But the problems are the same and arecause for concern everywhere, not just inQuébec. It is a formidable challenge, and meet-ing it successfully will demand considerableeffort. Nonetheless, we must remain confidentand not allow ourselves to be unduly discour-aged by the economic gloom brought on by therecession, especially when a number of signspoint to the recovery strengthening in 1992.For some time now, the business communityhas gradually become more aware of the needto adopt urgent measures to face the challengesof the future; it is this realization that willinspire growth strategies. Since its economicand industrial base is still comparatively youngand in the process of being consolidated,Quebec has the advantage of greater flexibility,even though it may lack the size and strengthof older economies. The dynamism so charac-teristic of Quebec in the past few decadestherefore augurs well for its future ability toadapt and innovate, and ultimately to meet itschallenges and its commitments.
The Caisses objectives of excellence a: d inno-vation must thus be placed in the context ofmaking a lasting contribution to Quebec's eco-nomic development and performing its dutiesas a portfolio manager; in this way, it seeks topromote the expansion of Quebec financialmarkets and the development of innovativeinvestment instruments and vehicles. However,ensuring the vitality of the Quebec economymust be a shared objective; it does not dependon any single person or institution. Only byharnessing all of Quebec's energies will theeconomy receive the boost it requires to meetthe challenges of the 21st century,
In conclusion, on behalf of the Board ofDirectors and on my uwn behalf, I wouldlike to thank the management team and thepersonnel of the Caisse for their tireless effortsin 1991. It is during difficult times like thesethat the quality and professionalism of thepersonnel of an institution like the Caisse aremost apparent. They deserve our sincerestgratitude.
I also wish to thank the members of the Boardof Directors for their support of Management,and for assuming their duties with both skilland dedication.
It is with regret that I announce the departureof Mr. Gaston Pelletier after 13 years on theBoard. His colleagues and the managementteam had ample opportunity during his tenureto appreciate both his wisdom and his soundfinancial judgement; we express to him ourwarmest thanks.
In 1991, we had the pleasure of welcomingthree new members to the Board of Directors:Messrs. Jacques O'Bready, Gabriel Savard andRaymond Sirois. We are certain that they willgive the activities of the Caisse their fullestconsideration, and share with it the benefitsof their experience.
Jean-Claude DelormeChairman of the Board andChief Executive Officer
Montréal, February 21, 1992
4

AND
SAGE FROM THE PRESIDENT
CHIEF OF OPERATIONS
During the past year, the Caisse faced a fairlydifficult economic environment, one which wasnonetheless favourable for investment activities,given the significant yield spreads among thevarious investment vehicles offered on NorthAmerican markets. The year was characterizedmore by the recession than by the anemic re-covery which succeeded it. Despite this, theCaisses active management of investments, itspolicy of wide diversification and its timelyselection of asset categories that delivered thehighest returns enabled it to achieve mostsatisfactory results and add $6.1 billion to thevalue of the depositors' portfolios, whichrepresents the strongest growth in the Caisseshistory. This increase consists of $3.7 billionin net investment income and $2.4 billionresulting from the appreciation in the marketvalue of portfolios. These results pushed themarket value of the Caisse's net assets pastthe $40 billion mark to $41.1 billion.
The bond portfolio, which amounted to$19.7 billion at market value, is the Caisse'smain investment vehicle. It represented 48.4%of total investments and includes Quebec,Canadian and U.S. securities, as well as secu-rities issued by the French, German and Britishgovernments. It generated a return of 22.9%,compared to 22.1% for the Universe index,which more closely reflects the yield curvefor two- to 30-year bonds in which the Caisseinvests.
During the year, the Caisse capitalized onthe positive Canadian yield curve and theoverweighting of Québec securities in its port-folio. Investors were drawn to the secondarymarket for Quebec public sector securities.The Caisse traded close to $22 billion ofthese securities in 1991, or almost triple theamount in 1990.
The resulting additional cash generated enabictthe Caisse to increase its new investments onthe primary market for Québec public sectorsecurities by $689 million over 1990, bringinginvestments on this market to $2.2 billion in1991.
Equities, which at 37.5% represented the second-largest component of the Caisse's total portfolio,made a slightly less significant, but nonethelessvery appreciable contribution to the overallreturn. This contribution was derived from theweighting of Québec, Canadian and foreignsecurities in the stocks and corporate equityinvestment portfolios as well as from hedgingagainst currency fluctuations.
The Québec and Canadian securities portfolio,which totalled $11.5 billion at market value,generated an 11.6% return compared to 12% forthe TSE 300 index. This reflects the weaker per-formance of large-capitalization stocks, in whichthe Caisse traditionally invests most of its equityfunds.
On the international scene, foreign equities, atalmost 9.2% versus 8.6% in 1990, continued toaccount for an increasingly larger proportion ofthe Caisse's total investments. The portfolioyielded a return of 20.2%, surpassing the 18.3%posted by the Morgan Stanley Capital Inter-national world index. This positive spreadreflected the exceptional performance of U.S.equities, which were overweighted in theCaisses total foreign equities portfolios.
With respect to corporate investments, theCaisse is committed to being a medium- andlong-term partner. The close collaborationbetween the Caisse, other shareholders andcorporate management helped the Caissespartners to weather the more difficult economic
5
conditions that prevailed during 1991, withmore than encouraging results. The year'shighlights included the consolidation and saleof certain investments, participation in certainindustry restructuring efforts and in expandingthe network of venture capital funds to provideseed money for small business development, aswell as increase its network of partners abroad.As at December 31, 1991, the Caisse's corporateinvestments portfolio amounted to $1.8 billionat market value.
Mortgages generated an 18% return versusthe reference index's 19,3%. However, thereference index is comprised exclusively ofresidential mortgages, whereas the Caisse'sdiversified portfolio includes residential, com-mercial and industrial mortgages, making thecomparison difficult. Despite unfavourableconditions, the Caisse granted $278.8 millionof mortgage loans in 1991. The institutionalso took part, through its representatives, inthe gouvernement du Québec Mon taux,mon toit program. The mortgage portfolio,which represented 5.2% of total investments,amounted to $2.1 billion at market value atDecember 31, 1991.
As for short-term investments, the drop ininterest rates which affected the money marketprompted the Caisse to take portfolio positionsthat generated significant gains. The portfoliothus posted a 10.2% return, compared to 9.8%for the index of 91-day Canada Treasury bills.The volume of the Caisse's currency operationsincreased by 66.6% as a result of the internatio-nal diversification of the bond and equityportfolios and the application of the exchangerisk hedging policy to all its foreign investments.At year-end, the short-term investments port-folio stood at $1.80 billion, or 4.4% of totalinvestments.
In the real estate sector, several major acquisi-tions brought the Caisses total net real estateinvestments to $1.83 billion at market value, orclose to 4.5% of total investments. The returnon the specific real estate investments portfoliowas -3.8% in 1991, as a result of the decline inrental income and in certain property values dueto the sluggish market. For the past 10 years,however, real estate investments posted a 13%annualized return, outperforming such assetcategories as equities and short-term investments.
During 1991, the Caisse increased its use of bas-kets of Canadian equities, in the form of equitiesindexed to the TSE 35, as well as of futuresindexed to the Standard and Poor's 500 indexand of other derivative products available toinstitutional investors. Asset-mix managers'timely execution of transactions in relativelybetter performing markets contributed to theCaisses success in the past year.
The Caisse pursues first and foremost medium-and long-term objectives. An analysis of resultsfor the past 10 years shows that returns for thetwo principal asset categories at the Caissesurpassed those of the reference index: 16.6%versus 15.1% for the ScotiaMcLeod - Universebond index, and 11.2% versus 10% for theTSE 300 index of Canadian equities.
These results attest to the expertise andefficiency of the Caisse, and, in particular, itsstaff. With a view to maintaining these qualitiesin its pursuit of excellence and innovation, theCaisse will continue equipping itself withleading-edge investment and support tools. Itwill also continue to invest in staff training so asto provide its employees with dynamic growthand career fulfillment opportunities, and to keepitself at the forefront of the rapidly-changinginvestment industry.
6

In seeking ways to contribute to Quebec'seconomic development, the Caisse will placemore emphasis on harmonizing its actions andefforts with those of the main economic agentsin Quebec. It will share its expertise withprivate, public and cooperative sector repre-sentatives and work with them to further definegrowth objectives, identify key sectors, reducemarket inefficiencies, support development ofregional activities and promote joint invest-ments with financial and industrial partners.
In conclusion, I would like to thank all ofthe Caisse's personnel for their effective andsustained contribution, Their support and theirleadership enabled the Caisse to achieve itshighly satisfactory overall results in 1991. It ismy hope that their contribution will, in the longrun, directly or indirectly also help to enhancethe standard of living of all Quebecers.
,47/1Guy SavardPresident andChief of Operations
Montréal, February 21, 1992
7

Their key element
was light.NOM IC
I EW
4
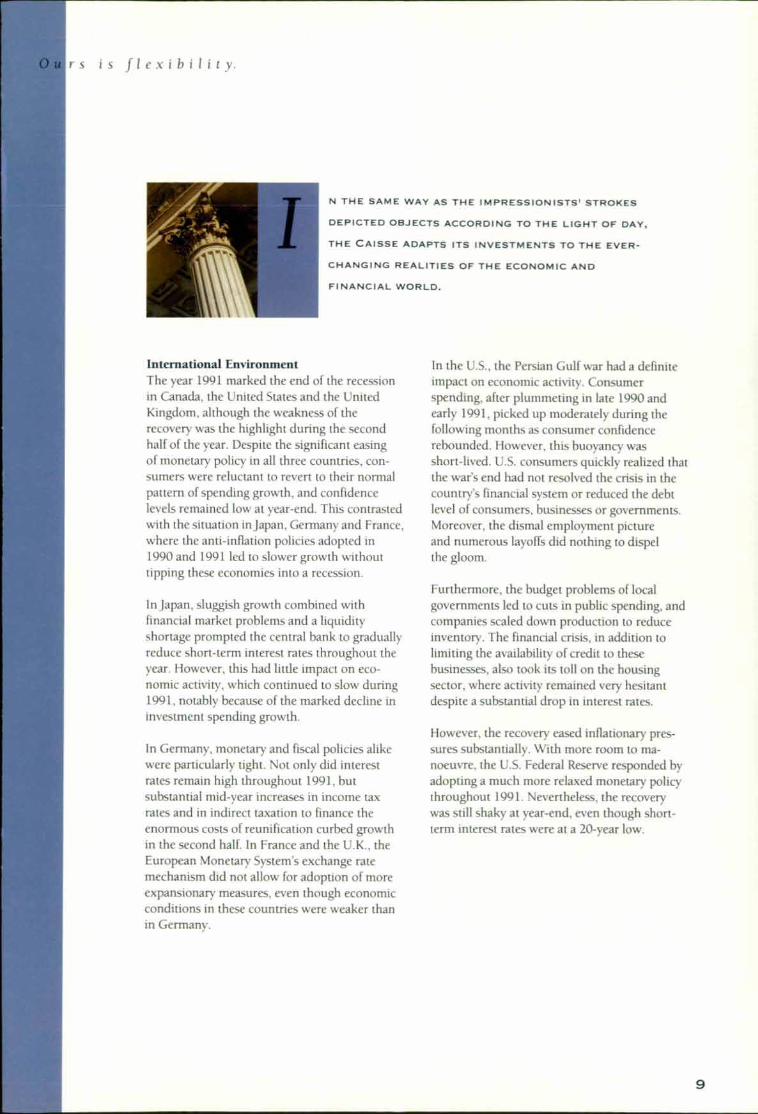
i s is flexib fit y.
N THE SAME WAY AS THE IMPRESSIONISTS' STROKES
DEPICTED OBJECTS ACCORDING TO THE LIGHT OF DAY,
THE CAISSE ADAPTS ITS INVESTMENTS TO THE EVER-
CHANGING REALITIES OF THE ECONOMIC AND
FINANCIAL WORLD.
International EnvironmentThe year 1991 marked the end of the recessionin Canada, the United States and the UnitedKingdom, although the weakness of therecovery was the highlight during the secondhalf of the year. Despite the significant easingof monetary policy in all three countries, con-sumers were reluctant to revert to their normalpattern of spending growth, and confidencelevels remained low at year-end. This contrastedwith the situation in Japan, Germany and France,where the anti-inflation policies adopted in1990 and 1991 led to slower growth withouttipping these economies into a recession.
In Japan, sluggish growth combined withfinancial market problems and a liquidityshortage prompted the central bank to graduallyreduce short-term interest rates throughout theyear. However, this had little impact on eco-nomic activity, which continued to slow during1991, notably because of the marked decline ininvestment spending growth.
In Germany, monetary and fiscal policies alikewere particularly tight. Not only did interestrates remain high throughout 1991, butsubstantial mid-year increases in income taxrates and in indirect taxation to finance theenormous costs of reunification curbed growthin the second half. In France and the U.K., theEuropean Monetary System's exchange ratemechanism did not allow for adoption of moreexpansionary measures, even though economicconditions in these countries were weaker thanin Germany.
In the U.S., the Persian Gulf war had a definiteimpact on economic activity. Consumerspending, after plummeting in late 1990 andearly 1991, picked up moderately during thefollowing months as consumer confidencerebounded. However, this buoyancy wasshort-lived. U.S. consumers quickly realized thatthe war's end had not resolved the crisis in thecountry's financial system or reduced the debtlevel of consumers, businesses or governments.Moreover, the dismal employment pictureand numerous layoffs did nothing to dispelthe gloom.
Furthermore, the budget problems of localgovernments led to cuts in public spending, andcompanies scaled down production to reduceinventory. The financial crisis, in addition tolimiting the availability of credit to thesebusinesses, also took its toll on the housingsector, where activity remained very hesitantdespite a substantial drop in interest rates.
However, the recovery eased inflationary pres-sures substantially. With more room to ma-noeuvre, the U.S. Federal Reserve responded byadopting a much more relaxed monetary policythroughout 1991. Nevertheless, the recoverywas still shaky at year-end, even though short-term interest rates were at a 20-year low.

In this context, the U.S. dollar was extremelyvolatile in 1991, characterized by marked highsand lows. After recording strong 21% growthin the first half of the year, the U.S. dollar tooka nosedive, closing the year at DM 1.5, downroughly 17% from its July high. This spectac-ular decline was touched off by the substantialreduction in interest rates as a result of theanemic recovery. The downward movementwas further intensified by the joint interventionof the central banks in July.
One of the characteristics of the recession inCanada was its disproportionate impact oncorporate profits, which had not been as low asa percentage of national income since the 1930s.Sagging profits led to more layoffs than thedecline in output might have suggested, pointingto a slow recovery in employment. However,the relatively high level of investment spendingfor machinery and equipment which accom-panied this weak recovery augurs well for themedium term.
111 EVOLUTION OF EMPLOYMENT IN THE U.S. -
EXCLUDING AGRICULTURE
110
109
108
107
106
105
104
1988 1989 1990 1991
in millionsSource.U.S. Department of Labor
CanadaCanada experienced a more conventionalrecession than did the United States, sincethe economic slowdown came in response tothe earlier tightening of fiscal and monetarypolicies. However, the Gulf war, the U.S. re-cession and, above all, the implementation ofthe goods and services tax (GST) accentuatedthe fluctuations.
The downturn, the second worst since WorldWar II, ended in the spring with an unexpected,and unexpectedly strong, growth spurt. How-ever, it turned out to be only temporary, andgrowth slumped again in the second half, inspite of continued gains in the housing sector.Precarious job market conditions, high con-sumer debt, the tight federal fiscal policy andthe psychological effects of the GST on consu-mer confidence and purchasing power allinhibited economic activity in the second halfof 1991.
The marked easing of inflationary pressureswas another highlight of 1991. Implementationof the GST did inflate the January consumerprice index, but subsequent price increaseswere minimal. In this context, the Bank ofCanada's target inflation rate of 3% by theend of 1992 seemed realistic, and Canadianinterest rates therefore declined significantlyduring 1991.
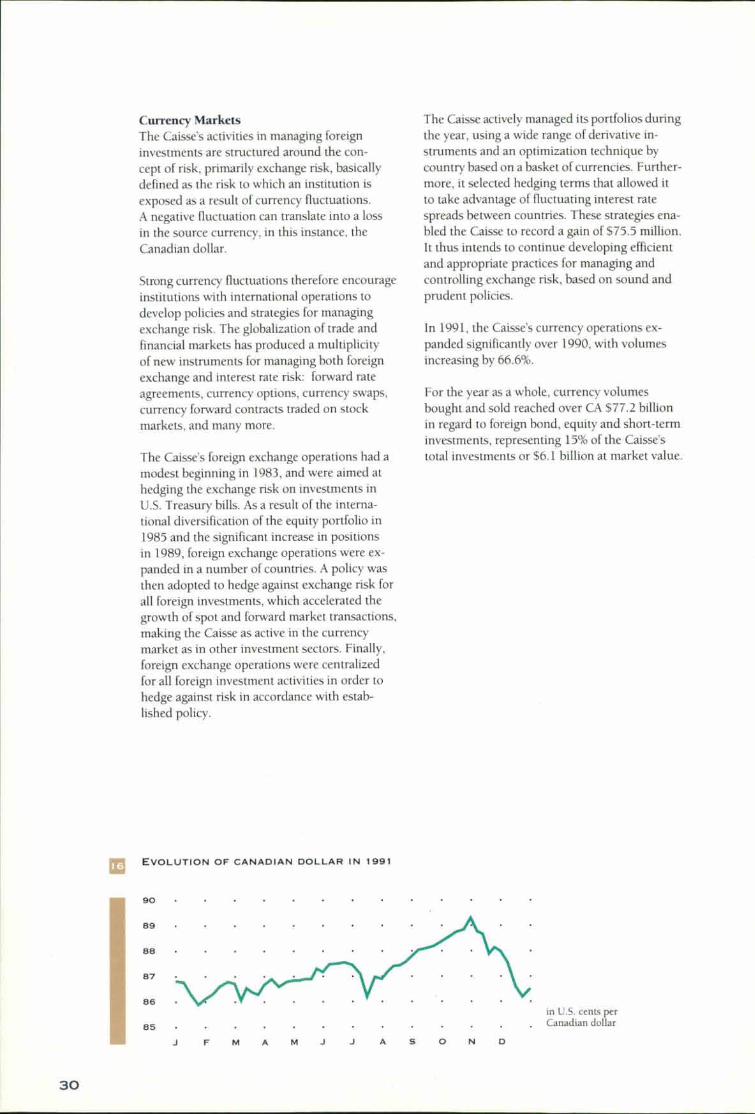
Between January and October, the Canadiandollar rose from U.S. 86.8 cents to 89.3 cents.After providing a safe haven for foreign in-vestors during the Gulf crisis, it was in strongdemand following massive international issuesby Canadian provinces, municipalities andcorporations. Canadian interest rate spreads,though narrower, were therefore still inCanada's favour, while the inflation rate hadimproved significantly, enhancing the credibilityof the monetary authorities in their commit-ment to contain inflation. However, betweenNovember and December of 1991, the Canadiandollar depreciated by 3.1%, again reachingU.S. 86.5 cents, its early-1991 level.
10
13
12
11
10
9
8
7
6
5
4
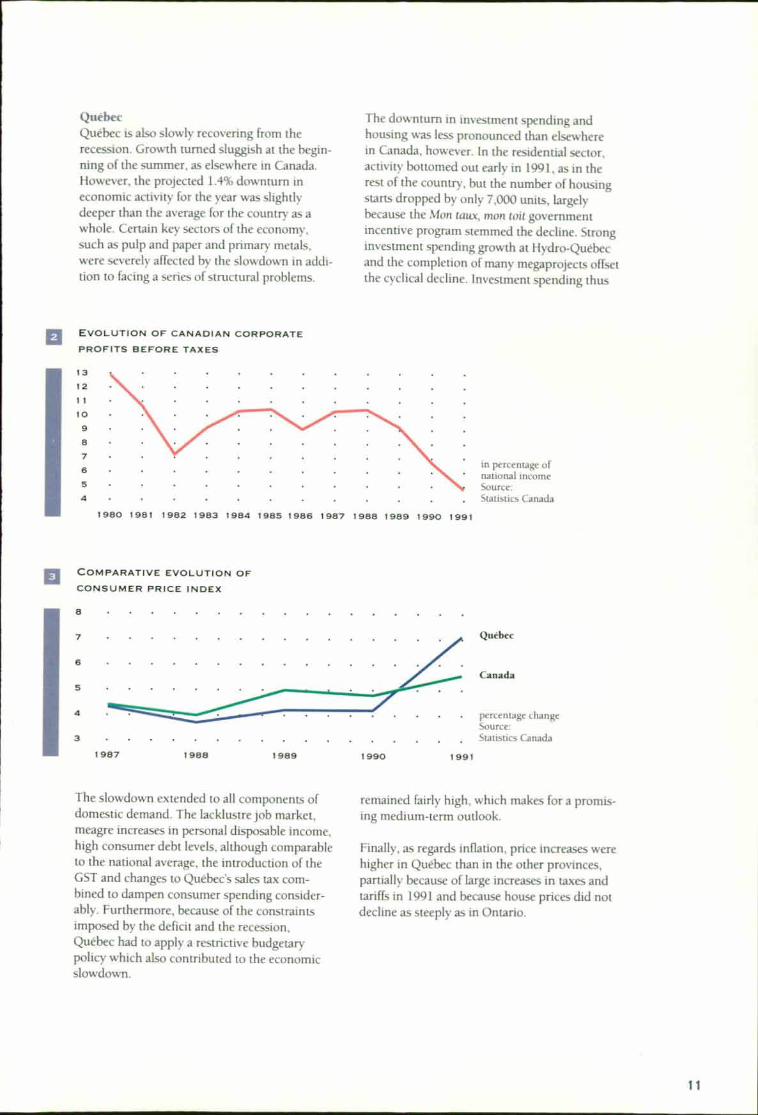
QuébecQuébec is also slowly recovering from therecession. Growth turned sluggish at the begin-ning of the summer, as elsewhere in Canada.However, the projected 1.4% downturn ineconomic activity for the year was slightlydeeper than the average for the country as awhole. Certain key sectors of the economy,such as pulp and paper and primary metals,were severely affected by the slowdown in addi-tion to facing a series of structural problems.
The downturn in investment spending andhousing was less pronounced than elsewherein Canada, however. In the residential sector,activity bottomed out early in 1991, as in therest of the country, but the number of housingstarts dropped by only 7,000 units, largelybecause the Mon taux, mon toit governmentincentive program stemmed the decline. Stronginvestment spending growth at Hydro-Quebecand the completion of many megaprojects offsetthe cyclical decline. Investment spending thus
O EVOLUTION OF CANADIAN CORPORATE
PROFITS BEFORE TAXES
in percentage ofnational incomeSource:Statistics Canada
198 0 1981 1982 1983 1984 1985 1986 1987 1988 1989 1990 1991
Fa COMPARATIVE EVOLUTION OF
CONSUMER PRICE INDEX
4
5
7
6
8
percentage change1991 Source:
3 Statistics Canada
1987 1988 1989 1990
Quebec
Canada
The slowdown extended to all components ofdomestic demand. The lacklustre job market,meagre increases in personal disposable income,high consumer debt levels, although comparableto the national average, the introduction of theGST and changes to Quebec's sales tax com-bined to dampen consumer spending consider-ably. Furthermore, because of the constraintsimposed by the deficit and the recession,Québec had to apply a restrictive budgetarypolicy which also contributed to the economicslowdown.
remained fairly high, which makes for a promis-ing medium-term outlook.
Finally, as regards inflation, price increases werehigher in Quebec than in the other provinces,partially because of large increases in taxes andtariffs in 1991 and because house prices did notdecline as steeply as in Ontario.
I'
Ass
4
ET MIX By harmonizing volume and colour,
they recreated reality.

I combining financial vehicles andthe Caisse achieves
•
B y strategies,
prosperity.
N THE SAME WAY AS THE CUBISTS ILLUSTRATED
ALL ASPECTS OF THE SAME OBJECT SO AS TO BETTER
DISPLAY ITS COHESIVE STRUCTURE, THE CAISSE
ANALYZES EVERY ANGLE OF FINANCIAL MARKETS
SO AS TO MAKE MANAGEMENT DECISIONS DESIGNED
TO OPTIMIZE THE RETURN ON INVESTMENTS.
The returns generated by funds under Caissemanagement depend on long-term asset mixstrategy by investment vehicle and active man-agement of the various asset categories.
It is therefore important to stress that the Caissedoes not simply manage the funds entrusted to it,but it is also actively involved in the developmentof investment policies and reviews them everythree years, defining, more specifically, the long-term benchmark portfolios which correspond tothe various depositors' risk-return profile.
In 1991, the Caisse therefore helped formulatean investment policy for the Regime de re-traite des techniciens ambulanciers œuvrantau Quebec. It also took pan in reviewing theinvestment policies of the government andpublic employees' retirement plans adminis-tered by the Commission administrative desregimes de retraite et d'assurances (CARRA).The collaboration between the Caisse and themanagement and union representatives on theretirement plan committees produced consid-erable synergy.
a EVOLUTION OF INVESTMENTS FOR TOTAL ASSETS
UNDER MANAGEMENT
59.4 58.0
60.6 5" _111164.1 58 . 8 EMI
68.1 64.1 35.9.
... . .....68.7 65.6
1979 . 11 .9111=16•=116. . 82 . 2 —1MM 17 - 8
1974 1941111M 17.6
141MMIMPim,MI .3 -11.1 18- 71969...... . • • ...
as at December 31 as at December 31at book value - in percentage at market value - in percentage
• Variable-income securities
(shares, convertible securities, real estate investments - net)
• Fixed-income securities(bonds, mortgages, short-term investments)
' restated to conform with the presentation of 1991
1991 40.6
1990 39.4
1989 35.9
1988
1987 31.3
42.0
41.4
01.2
13
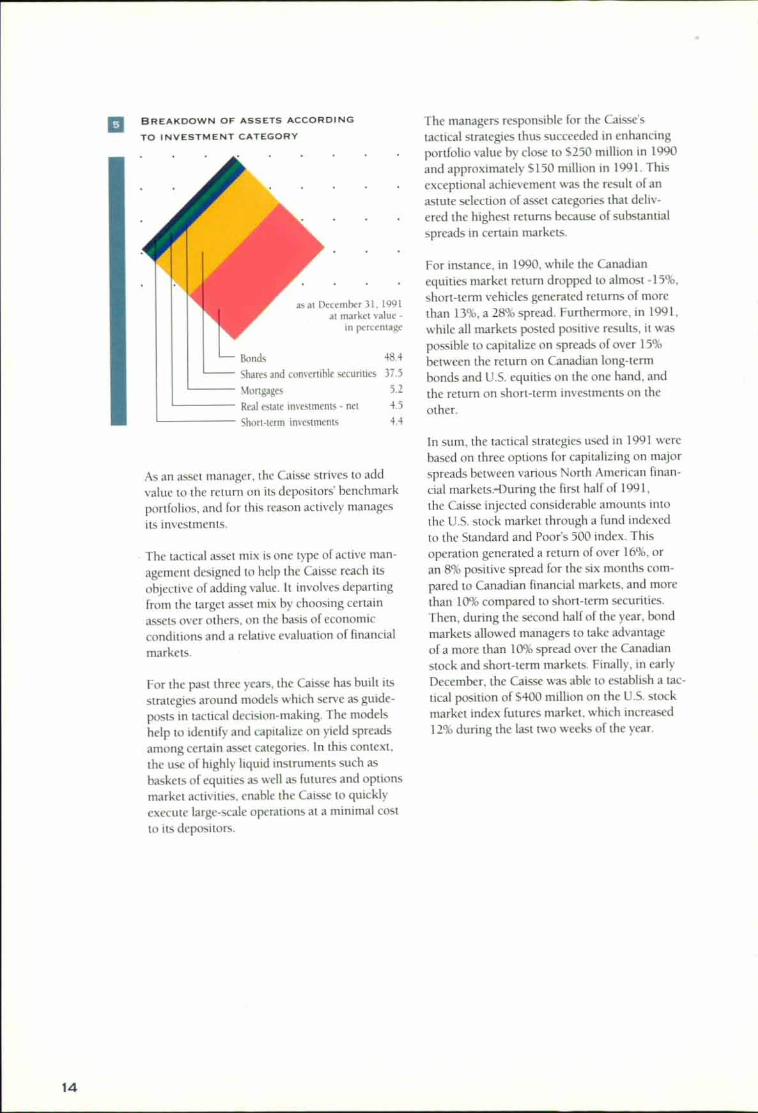
as at December 31, 1991at market value -
)n percentage
Bonds
Shares and convertible securities
Mortgages
Real estate investments - net
Short-term investments
48.4
37.5
5.2
4.5
4.4
El BREAKDOWN OF ASSETS ACCORDING
TO INVESTMENT CATEGORY
The managers responsible for the Caisse's
tactical strategies thus succeeded in enhancing
portfolio value by close to $250 million in 1990
and approximately $150 million in 1991. Thisexceptional achievement was the result of anastute selection of asset categories that deliv-ered the highest returns because of substantialspreads in certain markets.
For instance, in 1990, while the Canadianequities market return dropped to almost -15%,short-term vehicles generated returns of more
than 13%, a 28% spread. Furthermore, in 1991,
while all markets posted positive results, it was
possible to capitalize on spreads of over 15%
between the return on Canadian long-termbonds and U.S. equities on the one hand, and
the return on short-term investments on theother.
As an asset manager, the Caisse strives to add
value to the return on its depositors' benchmarkportfolios, and for this reason actively manages
its investments.
The tactical asset mix is one type of active man-agement designed to help the Caisse reach itsobjective of adding value. It involves departingfrom the target asset mix by choosing certainassets over others, on the basis of economicconditions and a relative evaluation of financialmarkets.
For the past three years, the Caisse has built itsstrategies around models which serve as guide-
posts in tactical decision-making. The modelshelp to identify and capitalize on yield spreadsamong certain asset categories. In this context,
the use of highly liquid instruments such as
baskets of equities as well as futures and optionsmarket activities, enable the Caisse to quicklyexecute large-scale operations at a minimal cost
to its depositors.
In sum, the tactical strategies used in 1991 werebased on three options for capitalizing on majorspreads between various North American finan-cial markets.-During the first half of 1991,
the Caisse injected considerable amounts intothe U.S. stock market through a fund indexedto the Standard and Poor's 500 index. Thisoperation generated a return of over 16%, oran 8% positive spread for the six months com-pared to Canadian financial markets, and more
than 10% compared to short-term securities.Then, during the second half of the year, bondmarkets allowed managers to take advantageof a more than 10% spread over the Canadian
stock and short-term markets. Finally, in earlyDecember, the Caisse was able to establish a tac-
tical position of $400 million on the U.S. stockmarket index futures market, which increased12% during the last two weeks of the year.
14
ReturnsIn 1990, despite difficult financial marketconditions, the Caisse succeeded in preservingthe capital of its depositors. In 1991, it produceda remarkable 17.2% return. For the past five and10 years, the results of 9.7% and 14.4% respec-tively compare favourably with the average ofthe Canadian investment industry. Adjusted forinflation, the return achieved by the Caissesmanagers over the past decade was 9.6% inreal terms.
These results are chiefly attributable to a carefulselection of main asset categories in the bench-mark portfolios. The Caisse has always chosenhigh-quality bonds for its portfolio. In the past10 years, bonds generated an average return of16.6%, while the Canadian equities marketexpanded an average of only 11.2% annually.Moreover, as part of the tactical operations,substituting more profitable vehicles for oneswith less attractive prospective returns alsohelped add value. Finally, in every investmentsector, the Caisse's managers outperformedthe reference indices on numerous occasions.
In 1991, the bond portfolio generated a 22.9%return, surpassing the 22.1% return of theScotiaMcLeod - Universe index, and comingclose to the 23.6% of the ScotiaMcLeod -
Medium-Term index. The narrow spreads aredue to the fact that the mix of the referenceindices is different from that of the Caisse'sportfolio. While reference indices are comprisedexclusively of Canadian securities, the Caissesportfolio contains a certain proportion of for-eign securities to ensure healthy diversification.
However, the Australian and Canadian bondmarkets generated the highest returns in 1991.The Universe index has become the standardreference for the industry. It also provides amore appropriate basis for comparison fromthe standpoint of the Caisses managementmethod and the range of securities in whichit invests. The Universe index reflects all partsof the bond curve, that is, maturities of two to30 years, while the Medium-Term index con-centrates on maturities of five to 10 years.
The short-term investments portfolio yielded a10.2% return, compared to 9.8% for the indexof 91-day Canada Treasury bills. This excellentperformance reflects a very dynamic strategy inmanaging positions along the yield curve formaturities of less than one year.
As for equities, the Canadian portfolio generatedan 11.6% return, compared to 12% for theTSE 300 index after dividend payout. This isthe result of a poorer showing among large-capitalization stocks, such as those included inthe TSE 35 index, compared to stocks overall.The block of shares indexed to the TSE 35which is held by the Caisse generated a returnof 11.2%, close to the return for the referenceindex.
15
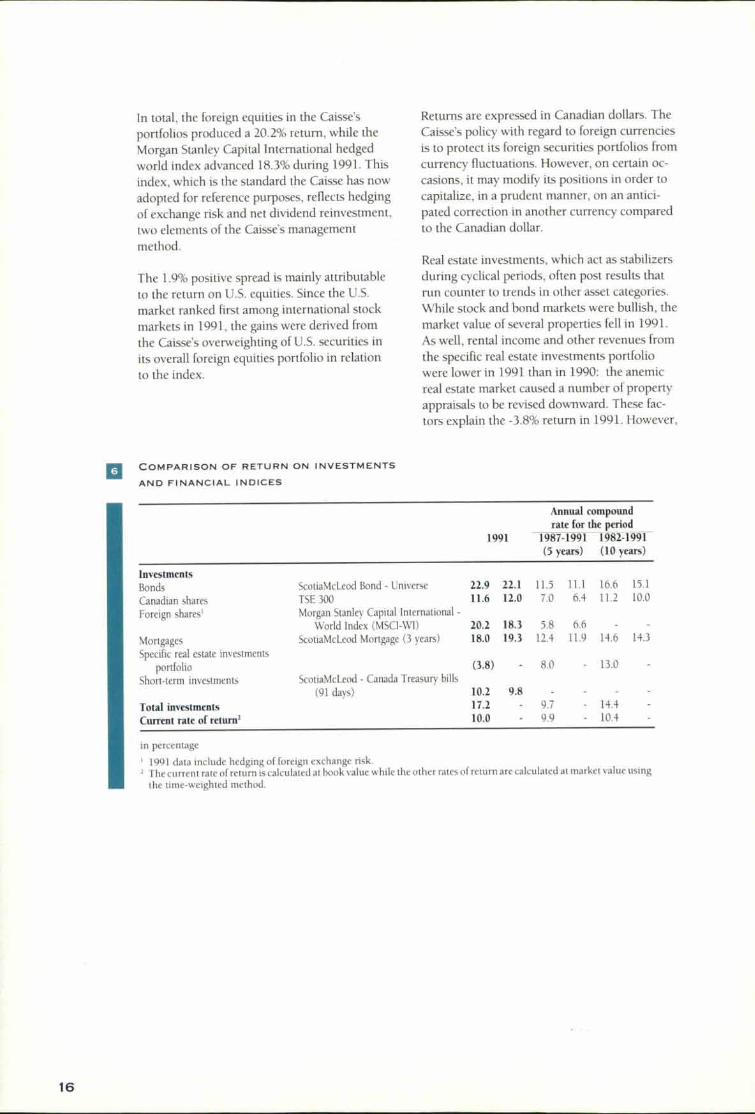
In total, the foreign equities in the Caisse's
portfolios produced a 20.2% return, while theMorgan Stanley Capital International hedgedworld index advanced 18.3% during 1991. Thisindex, which is the standard the Caisse has nowadopted for reference purposes, reflects hedgingof exchange risk and net dividend reinvestment,two elements of the Caisse's managementmethod.
The 1.9% positive spread is mainly attributableto the return on U.S. equities. Since the U.S.market ranked first among international stockmarkets in 1991, the gains were derived fromthe Caisse's overweighting of U.S. securities inits overall foreign equities portfolio in relationto the index.
Returns are expressed in Canadian dollars. TheCaisse's policy with regard to foreign currenciesis to protect its foreign securities portfolios fromcurrency fluctuations. However, on certain oc-casions, it may modify its positions in order tocapitalize, in a prudent manner, on an antici-pated correction in another currency comparedto the Canadian dollar.
Real estate investments, which act as stabilizersduring cyclical periods, often post results thatrun counter to trends in other asset categories.While stock and bond markets were bullish, themarket value of several properties fell in 1991.
As well, rental income and other revenues fromthe specific real estate investments portfoliowere lower in 1991 than in 1990: the anemicreal estate market caused a number of propertyappraisals to be revised downward. These fac-tors explain the -3.8% return in 1991. However,
13 COMPARISON OF RETURN ON INVESTMENTS
AND FINANCIAL INDICES
1991rateAnnual compound
for the period1987-1991(5 years)
1982-1991(10 years)
InvestmentsBonds ScotiaMcLeod Bond - Universe 22.9 22.1 11.5 11.1 16.6 15.1
Canadian shares TSE 300 11.6 12.0 7.0 6.4 11.2 10.0
Foreign shares' Morgan Stanley Capital International -World Index (MSCI-W1) 20.2 18.3 5.8 6.6
Mortgages ScotiaMcleod Mortgage (3 years) 18.0 19.3 12.4 11.9 14.6 14.3
Specific real estate investmentsportfolio (3.8) 8.0 - 13.0
Short-term investments ScotiaMcLeod - Canada Treasury hills(91 days) 10.2 9.8
Total investments 17.2 9.7 - 14.4
Current rate of return' 10.0 9.9 - 10.4
in percentage
' 1991 data include hedging of foreign exchange risk.2 The current rate of return is calculated at book value while the other rates of return are calculated at market value using
the time-weighted method.
16
the specific real estate investments portfolioposted a 13% return for the past decade, outper-forming such asset categories as equities andshort-term investments.
Lastly, the 18% return on the mortgage portfoliois below the 19.3% of the reference index. How-.ever, the reference index is comprised exclusivelyof three-year residential mortgages, whereas theCaisse's diversified portfolio includes residential,commercial and industrial mortgages. In thiscontext, a residential index would have beendifficult to beat, yielding as it did the highestreturn in 1991.
The year's results aside, it must be rememberedthat for the Caisse and its depositors, the long-term return is of even greater importance. Ananalysis of results for the past 10 years showsthat returns for three of the Caisse's asset cat-egories surpassed those of the reference indices.These returns were 16.6% versus 15. I% forbonds, 11.2% versus 10% for Canadian equities,and 14.6% versus 14.3% for mortgages.
17
DEP
kFuN
They created art
out of everyday objects.OSITORS'
DS

e Caisse makes finance
a daily art.
IKE THE POP ART MOVEMENT, THE CAISSE MAKES
THE DAY-TO-DAY LIFE OF THE PEOPLE OF QUEBEC
THE FOCAL POINT OF ITS CONCERNS BY FULFILLING
ITS RESPONSIBILITY OF MAKING PROFITABLE
INVESTMENTS.
Under legislation adopted by the QuebecNational Assembly, the Caisse is entrustedwith the funds contributed to various publicpension and insurance plans by almost fourmillion Quebecers. Although the organizationsconcerned administer these plans, the Caissehas the legal responsibility and the mandate toensure the investment, protection and growthof their respective assets.
The Caisse offers depositors the benefit of itsexpertise in finance, portfolio managementand real estate. Through regular meetings, de-positors are informed of the economic scenarioswhich guide the Caisse in its decision-making,the overall direction of its investment strategyand its returns on investments. Depositorsreceive complete status reports on theirportfolios and a detailed analysis of results.
The Caisse receives funds in the form ofdemand, term or participation deposits.Demand and term deposits constitute indebt-edness toward depositors and bear interest.Participation deposits give the holder a sharein the net equity and net income of a particularfund, and so their value depends on the valueof the fund to which they are allocated.
As at December 31, 1991, the book value ofdepositors' holdings with the Caisse was$38.1 billion, up $2.4 billion during the year.The increase is chiefly attributable to netincome of close to S3.7 billion, less net with-drawals of over $1.2 billion. At market value,depositors' holdings were $41.1 billion, or53 billion over book value.
In addition to reinvesting their investmentincome, certain depositors made contributionsin 1991. The Commission administrative desregimes de retraite et d'assurances (CARRA)made a contribution of $461 million throughthe Government and Public Employees Retire-ment Plan (RREGOP), and the SupplementalPension Plan for Employees of the QuebecConstruction I ndustry contributed $77 million.However, other depositors made withdrawalsfrom their investment income in order to satisfytheir liquidity requirements: the Régie desrentes du Quebec withdrew $1.2 billion; theSociete de l'assurance automobile du Quebec,$328 million; and the Commission de ta santéet de la sécurité du travail, $226 million.
The Caisse has 10 funds: the General Fundand nine Individual Funds. The General Fund isa pooled fund with several depositors, whereaseach individual Fund has only one depositor.
19

1988 10.11410.114 9,433
1987 16111.as at December 31at book value -in millions of dollars
8.448
The Caisse's principal depositor is the Régiedes rentes du Quebec (R.R.Q.) which wasfounded at the same time as the Caisse. It man-ages the public pension plan for Quebecers, andthe number of its beneficiaries has risen from3,000 in 1967 to over 800,000 today, and is ex-pected to exceed 1,600,000 by the beginning ofthe 21st century. In 1991, even though the bookvalue of its holdings increased by $281 million,the R.R.Q. had to withdraw $1.2 billion of its$1.5 billion income in order to satisfy currentobligations.
The Government and Public EmployeesRetirement Plan (RREGOP) is the Caisse'ssecond-largest depositor, but has posted thehighest growth since 1987, and now accountsfor 29.1% of total depositors' holdings at mar-ket value. The plan is managed by CARRAand covers public sector employees, includinggovernment employees as well as those of theeducation and social services sectors. Sincethe plan's creation, its book value has risen toS11.1 billion, or close to $12 billion at marketvalue. In 1991, the plan's holdings increased by
111 EVOLUTION OF INVESTMENTS
1991 likaami 15,275
14,027
12,073
1990 '
1989
- Variable-income securities(shares, convertible securities, real estate investments - net)
• Fixed-income securities(bonds, mortgages, short-term investments)
' restated to conform with the presentation of 1991
In 1990, it withdrew $820 million, represent-ing 71% utilization of its investment income,versus 82% in 1991. At year-end, its holdingsamounted to $14.7 billion at book value and$15.9 billion at market value, or 38.6% of totaldepositors' holdings at market value. The 0.2%annual increase in the contribution rate, imple-mented in 1987, will bring the 1992 rate of4.8% to 5.6% in 1996. Surplus investmentincome will thus slow the R.R.Q.'s rate of pro-jected withdrawals and increase its holdings,albeit modestly, in future years.
$1.4 billion; $461 million in new contributionswas added to reinvested income. The RREGOPcomprises two accounts: one for unionized em-ployees, and one for non-unionized employeeswhich also includes employers' contributionsand supplemental pension plan transfers.
CARRA also administers other plans, includingthe Individual Plans, the General RetirementPlan for Mayors and Councillors of Munici-palities and the Pension Plan for ElectedMunicipal Officers. Their assets total $40 mil-lion, $14 million and $55 million respectivelyat book value.
20

The Caisse's third-largest depositor is theSociete de l'assurance automobile du Quebec(SAAQ). it administers the general plan thatprovides insurance against bodily injuriescaused by traffic accidents. Its principal man-date is to reduce the risk of traffic accidents byimproving control of access to the road system,to promote road safety and to compensatevictims of traffic accidents. In 1991, the SAAQhad to withdraw $329 million of its investmentincome of approximately $515 million, com-pared to a withdrawal of $275 million in 1990.The withdrawal is chiefly attributable to theSAAQ's five-year capital expenditure programto improve road safety. At December 31, 1991,the book value of the SAAQ's holdings was
$4.9 billion, or $5.4 billion at market value. Itsholdings represented 13.1% of total depositors'holdings and 25% of the General Fund atmarket value.
The Commission de la santé et de la securitedu travail (C.S.S.T.) deposits with the Caisse allthe funds it accumulates to pay out industrial-accident and occupational-disease benefits. Itcollects contributions from all employers pro-viding insurance coverage against risks in theirsectors of activity. As at December 31, 1991, theC.S.S.T. had assets of $3.7 billion at book value.The market value of its holdings increased by$427 million to a total of almost $4 billion,representing 9.7% of depositors' holdings.
a DEPOSITORS
AbbreviationFirst
deposit
\ umber of
contributors 'Depositors'
holdings'
Regie des rentes du Quebec R.R.Q. 1960 3,127,000 I 5,887.3Commission administrative des regimes
de retraite et d'assurances CARRAGovernment and Public
Employees Retirement Plan RREGOP 1973 485,000 11,973.2General Retirement Plan for Mayors and
Councillors of Municipalities 1975 14.7Individual Plans 1977 100 40.8Pension Plan for Elected Municipal Officers 1989 1,700 57.1
Societe de l'assurance automobile du Quebec SAAQ 1978 4,118,000 5,392.9Commission de la santé et de la sécurite du travail C.S.S.T. 1973 175,532 3,985.5Commission de la construction du Quebec C.C.Q.
Supplemental Pension Plan for Employees of the
Quebec Construction industry 1970 105,000 3,642.9Fonds d'assurance-préts agricoles et forestiers FA PAP 1978 t 19,4Régie des assurances agricoles du Quebec 1968 42,235 7.6Régie des marchés agricoles et alimentaires du Quebec R.M.A.A.Q. 1967 60 2.8Regie de l'assurance-dépôts du Quebec 1969 1,387 94.1La Federation des producteurs de bovins du Quebec 1989 26,000 0.5Regime complémentaire de rentes des techniciens
ambulanciers œuvrant au Quebec 1990 2,951 12.9
as at December 31, 1991
' estimate
at market value - in millions of dollars
21
in order to fulfill its commitments, the C.S.S.T.
withdrew $226 million of its $394 million in-come in 1991, partially because of the highercost of compensation programs, the resultmainly of longer benefit periods, and because
of the lower contribution rate, which decreasedfrom $2.75 in 1989, to $2.50 in 1990 and $2.32
in 1991.
The Caisse also manages the funds of certainother supplemental pension plans, including
that of workers subject to the decree of die
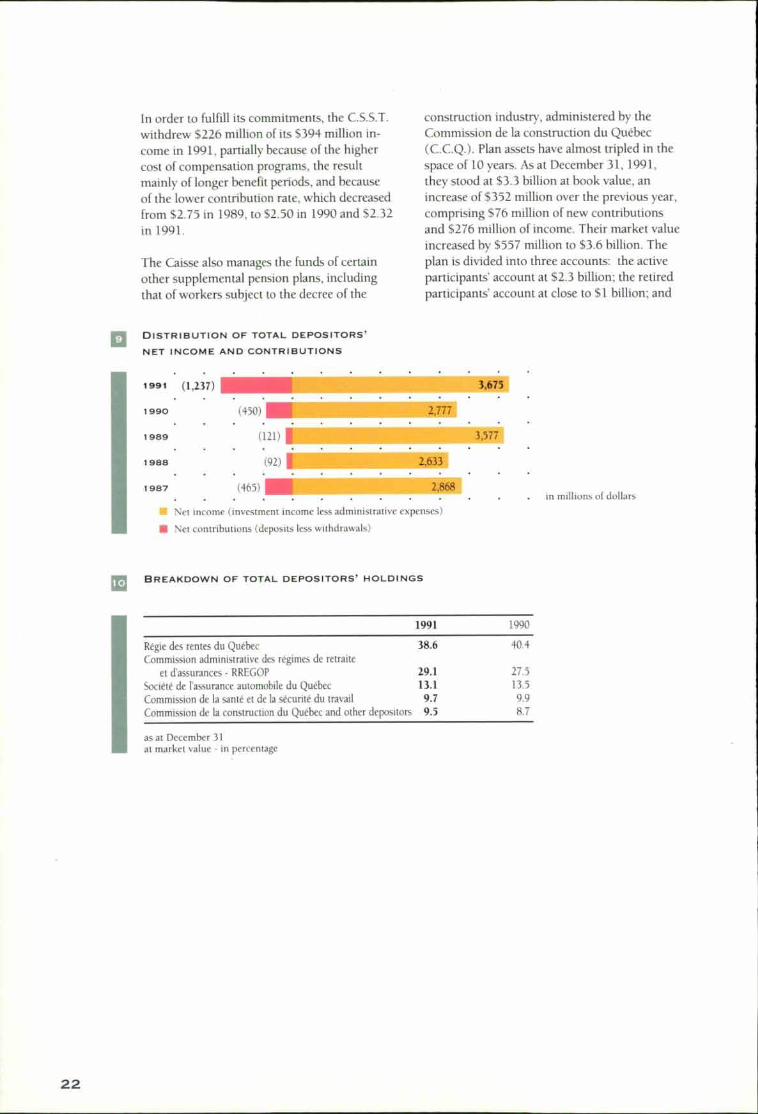
construction industry, administered by theCommission de la construction du Québec(C.C.Q.). Plan assets have almost tripled in thespace of 10 years. As at December 31, 1991,they stood at $3.3 billion at book value, anincrease of $352 million over the previous year,comprising $76 million of new contributionsand $276 million of income. Their market valueincreased by $557 million to $3.6 billion. Theplan is divided into three accounts: the activeparticipants' account at $2.3 billion; the retiredparticipants' account at close to $1 billion; and
El DISTRIBUTION OF TOTAL DEPOSITORS'
NET INCOME AND CONTRIBUTIONS
(1,237)
1990 (450)(450)
1989 (121)
(92 )
1987 (465)(465)
3,675
421113,577
2,633
).„868. in millions of dollars
1991
1988
• Net income (investment income less administrative expenses)
• Net contributions (deposits less withdrawals)
BREAKDOWN OF TOTAL DEPOSITORS' HOLDINGS10
1991 1990
Régie des rentes du Québec 38.6 40.4Commission administrative des régimes de retraite
et d'assurances - RREGOP 29.1 27.3
Société de l'assurance automobile du Québec 13.1 13.5
Commission de la sanie et de la sécurité du travail 9.7 9.9
Commission de la construction du Québec and other depositors 9.5 8.7
as at December 31at market value - in percentage
22

r- .1,521.0..
(328.5)...
1226.0/
280.8514,5
186,0. 4nNi 3.94.2 .n 168.2
R .R .0. (1,240.2)
SAAO
C.S.S.T.
in millions of dollars
944.71.405.4
CARRA
RREGOP
C.C.Q.
460.7
76.5 =755632.1
the additional contributions account of certainworkers at $0.3 billion.
The Fonds d'assurance-préts agricoles et fores-tiers (FAPAF), the Regime complémentaire derentes des techniciens ambulanciers œuvrant auQuebec (RR.T.A.Q.) and the Régie des marchesagricoles et alimentaires du Quebec (R. M.A.A.Q.)maintain a reserve of $24 million in the form of
units in the General Fund, and their holdingstotal $35.1 million. The other depositors arethe Régie des assurances agricoles du Quebec,the Regie de l'assurance-depots du Quebecand La Federation des producteurs de bovinsdu Quebec. Their funds consist exclusivelyof liquid assets in the form of demand or termdeposits in the General Fund which total$102 million.
mu DISTRIBUTION or MAJOR DEPOSITORS' NET INCOME
AND CONTRIBUTIONS IN 1991
III Net income (investment income less administrative expenses)
• Net contributions (deposits less withdrawals)
• Total
23
ADMINISTRATION
Administrative ExpensesIn 1991, an audit program was performed withthe goal of optimizing resources, with its recom-mendations to be phased into the Caisses or-ganizational structure over a number of years.
The Caisse continued and even accelerated thedevelopment of automated management andinvestment systems, which, combined withhigher business volumes and product and mar-ket diversification, led to an increase in person-nel and operating expenses.
Thus in 1991, administrative expenses were$31.4 million, or 0.08% of assets under man-agement, versus 0.07% in 1990. Expenses breakdown as follows: salaries, 58.9%; professionalfees, 11.2%; rent, 9.8%; depreciation of fixedassets, 5.2%; and other expenses, 14.9%. Underthe rules governing distribution of the Caissesadministrative expenses, the latter are allocatedamong the various funds on a pro rata basis,according to the market value of each fund'sweighted assets.
In addition, the sum of $8.1 million was paidout. to various financial institutions for directinvestment management, processing and custo-dial services. Of this amount, 52.5 million waspaid to Canadian financial institutions and55.6 million to foreign institutions. These ex-penses are deducted from investment income.
Human ResourcesThe Caisse reviewed and updated certainmanagement policies, including its trainingpolicy, to enable it to achieve excellence in allits activities. It also adopted a more flexiblepolicy on working hours aimed at enhancingwork quality and staff motivation.
The Caisse also revised the job descriptions ofits technical and support staff and began evalua-tion of management and professional positionsto ensure that the Caisse is competitive in termsof overall compensation.
During the year, it carried out various organiza-tional studies dealing, among other things, withresource optimization, performance manage-ment, revision of the bonus program andanalysis and selection of an automated humanresources management system. It also launcheda study on evaluation of potential and starteddrawing up a strategic plan to ensure successionfor key positions and the continuation of itsinvestment activities.
The Caisse has a total staff of 302: 40 manage-ment personnel, 150 professionals and 112technical and support staff.
24
Information ResourcesGiven the importance of information manage-ment and the need for leading-edge processingcapacity in today's competitive world, the Caissecontinued to implement its three-year informa-tion systems master plan in 1991. The maincomponents of the plan are administration ofderivative products, portfolio managementinstruments and access to in-house and externalinvestment data.
A number of information systems were installedduring the year, including a program for manag-ing derivative products such as swaps, forwardrate agreements, options and other financial fu-tures contracts. The Caisse also carried out stud-ies to identify appropriate solutions in the areaof tools for managing mortgage and real estateinvestments. Furthermore, it selected both thetechnological environment and software for itsbond and short-term investment trading rooms.
In the area of technology, the Caisse continuedsetting up its local area network, and installed amore powerful mainframe.
Material ResourcesDuring 1991, the Caisse demonstrated itsconcern for the environment by introducinga paper recycling program, with the goal ofreducing paper consumption and promotingreuse. Throughout the year, it therefore en-couraged the purchase of recycled paper forits various needs.
During the year, the Caisse also continued tomonitor application of An Act respecting theprotection of non -smokers in certain public placesby following up on requests relating to compli-ance with the Act.
Public Affairs:The Caisse's First Quarter-CenturyIn 1991, the Caisse commemorated the 25thanniversary of its founding in its communica-tions, advertising, sponsorships, business andfinancial publications and press kits, amongothers.
It also organized special events for businesspartners and staff. On February 14, 1991,some 550 active and retired employees andtheir spouses gathered to celebrate the anniver-sary of the Caisses first financial transactionexactly 25 years earlier, the purchase of a$500,000 bond from the International Bankfor Reconstruction and Development.
The guests of honour, invited by Messrs. Jean-Claude Delorme and Guy Savard, were thosepeople who had guided the Caisse through itsfirst quarter-century: Mrs. Anne Prieur, repre-senting her husband Mr. Claude Prieur, whodied during his term of office; Mr. MarcelCazavan; and Mr. Jean Campeau.
A second event was held on October 22, 1991at the Montreal Convention Centre. More than1,500 businesspeople from both inside and out-side Quebec gathered to celebrate the C.aisse's25th anniversary with prominent figures from agreat many sectors.
In 1991, the Caisse also sponsored variousorganizations active in economics and finance,continuing its relationship with the Savingsand Investment Marketplace in Montreal andQuebec City to promote consumer educationof the economy, sustaining job creation throughits contribution to the Forum pour l'emploi,joining forces with the National Bank in theNouveaux Performants program to encourage
management development and excellence,and sponsoring the annual convention of theFondation de l'Entrepreneurship to supportentrepreneurs and their activities.
25

INVESTMENT
They aimed to be as accurate
OPERATIONS as a compass' needle.
Th L. Caisse's vision is as far-reaching
as the compass' circle.
HROUGH ITS MEDIUM- AND LONG-TERM STRATEGIES
AND ITS DIVERSIFIED INVESTMENT VEHICLES, THE
CAISSE EVOKES THE SPIRIT OF CONSTRUCTIVISM
WHERE NOTHING IS LEFT UNCHECKED AND EVERY
PLANE IS FORMALLY ORGANIZED.
BondsThe weak economy caused interest rates to fallsubstantially during 1991. By year-end, rateson 10-year Canadian bonds reached their low-est level since the first quarter of 1975. Onefavourable consequence of the lower rates,however, was that the profile of the Canadianyield curve shifted from negative to positive.The Bank of Canada's policies on interest ratesand the dollar served to enhance the Canadianbond market's appeal, and of all the marketsin which the Caisse is active, it was the bondmarket that by far yielded the best resultsin 1991.
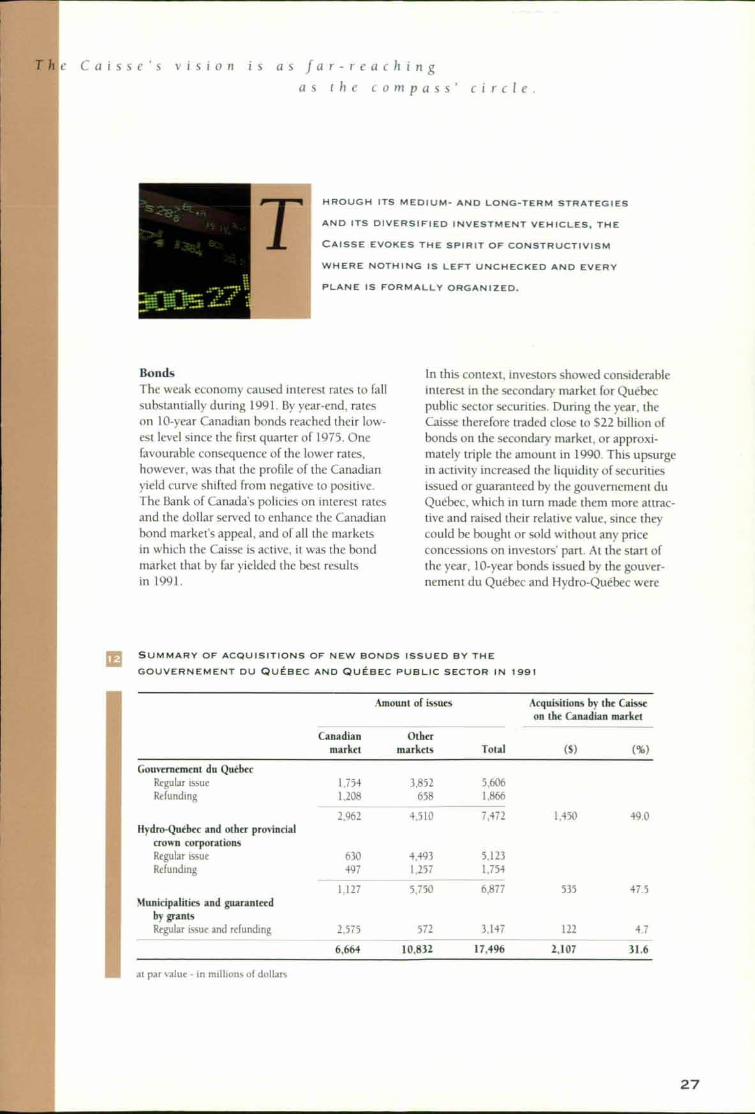
ln this context, investors showed considerableinterest in the secondary market for Quebecpublic sector securities. During the year, theCaisse therefore traded close to $22 billion ofbonds on the secondary market, or approxi-mately triple the amount in 1990. This upsurgein activity increased the liquidity of securitiesissued or guaranteed by the gouvernement duQuebec, which in turn made them more attrac-tive and raised their relative value, since theycould be bought or sold without any priceconcessions on investors' part. At the start ofthe year, 10-year bonds issued by the gouver-nement du Quebec and Hydro-Québec were
SUMMARY OF ACQUISITIONS OF NEW BONDS ISSUED BY THE
GOUVERNEMENT DU QUEBEC AND QUEBEC PUBLIC SECTOR IN 1991
Amount of issues
Total
Acquisitions by the Caisseon the Canadian market
Canadianmarket
Othermarkets (S) (%)
Gouvernement du QuebecRegular issue 1,754 3,852 5,606Refunding 1,208 658 1,866
2,962 4,510 7,472 1,450 49,0Hydro-Quebec and other provincial
crown corporationsRegular issue 630 4,493 5,123Refunding 497 1,257 1,754
1,127 5,750 6,877 535 47.5Municipalities and guaranteed
by grantsRegular issue and refunding 2,575 572 3,147 122 4.7
6,664 10,832 17,496 2,107 3L6
at par value - in millions of dollars
27
trading 112 basis points above Governmentof Canada bonds. However, at year-end, themargin had narrowed to 84 basis points. Thischange resulted in a $1.85 premium per $100invested. Responding to heightened demand,the Caisse made significant gains on net salesof more than $2.5 billion of Quebec publicsector securities during the year.
These cash resources enabled the Caisse toincrease its new investments on the primarymarket by $689 million over 1990. The invest-ments, made in the form of Quebec publicsector bonds, amounted to almost $2.2 billionin 1991: approximately $1.5 billion was in-vested in bonds issued by the gouvernement
du Quebec, $500 million in Hydro-Quebecbonds and $132 million in bonds of otherissuers in this sector, such as the Corporationd'hébergement du Quebec and the Commu-naute urbaine de Montréal.
On the international front, the Caisse continuedto be represented on European markets. Ittraded the equivalent of CA $11.6 billion ofEuropean securities on the French, German and
British markets, compared to $11.5 billion in1990. In addition to being an active player onthe Canadian bond futures market of TheMontréal Exchange, the Caisse began tradingU.S. Treasury bill futures in order to enhancethe flexibility of its portfolio management.
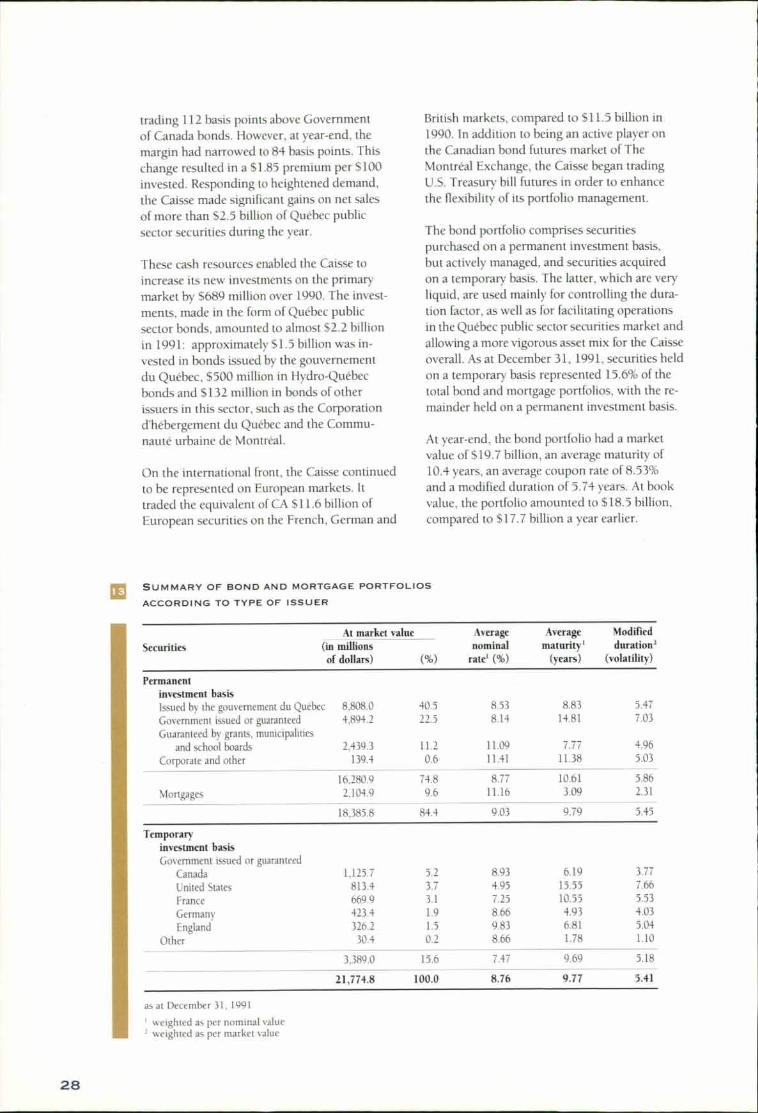
The bond portfolio comprises securitiespurchased on a permanent investment basis,but actively managed, and securities acquiredon a temporary basis. The latter, which are veryliquid, are used mainly for controlling the dura-tion factor, as well as for facilitating operationsin the Quebec public sector securities market andallowing a more vigorous asset mix for the Caisse
overall. As at December 31, 1991, securities heldon a temporary basis represented 15.6% of thetotal bond and mortgage portfolios, with the re-mainder held on a permanent investment basis.
At year-end, the bond portfolio had a marketvalue of $19.7 billion, an average maturity of10.4 years, an average coupon rate of 8.53%and a modified duration of 5.74 years. At bookvalue, the portfolio amounted to $18.5 billion,compared to $17.7 billion a year earlier.
al SUMMARY OF BOND AND MORTGAGE PORTFOLIOS
ACCORDING TO TYPE OF ISSUER
At market value Averagenominal
rate' (%)
Averagematurity'
(years)
Modifiedduration=
(volatility)Securities (in millions
of dollars) (%)
Permanentinvestment basisIssued by the gouvernement du Quebec 8,808.0 40.5 8.53 8.83 5.47Government issued or guaranteed 4,894.2 22.5 8.14 14.81 7.03Guaranteed by grants, municipalities
and school boards 2,439.3 11.2 11,09 7.77 4.96
Corporate and other 139.4 0.6 11.41 11.38 5.03
16,280.9 74.8 8.77 10.61 5.86Mortgages 2,104.9 9.6 11.16 3.09 2.31
18,385.8 84.4 9.03 9.79 5.45
Temporaryinvestment basisGovernment issued or guaranteed
Canada 1,125.7 5.2 8.93 6.19 3.77
United States 813.4 3.7 4.95 15.55 7.66
France 669.9 3.1 7.25 10.55 5.53
Germany 423.4 1.9 8.66 4.93 4.03England 326.2 1.5 9.83 6.81 5.04
Other 30.4 0.2 8.66 1.78 1.10
3,389.0 15.6 7,47 9.69 5.18
21.774.8 100.0 8.76 9.77 5.41
as at December 31, 1991
weighted as per nominal value= weighted as per market value
2 8
12
11
10
9
7
6
5
4
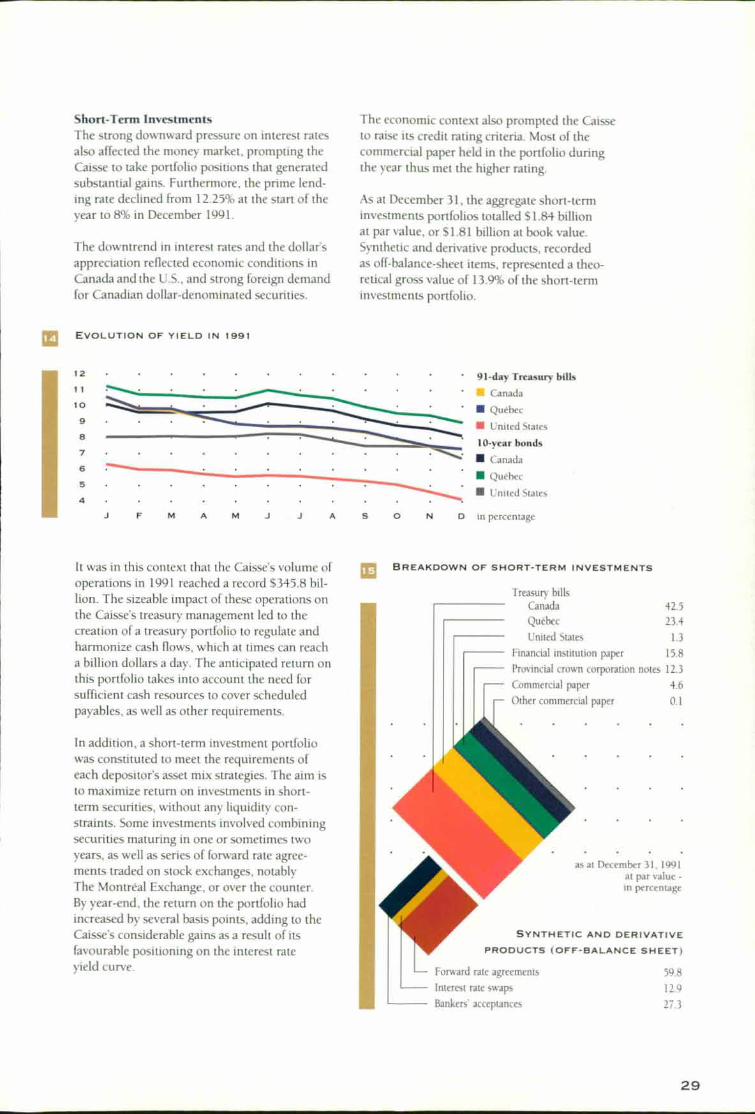
Short-Term InvestmentsThe strong downward pressure on interest ratesalso affected the money market, prompting theCaisse to take portfolio positions that generatedsubstantial gains. Furthermore, the prime lend-ing rate declined from 12.25% at the start of theyear to 8% in December 1991.
The downtrend in interest rates and the dollar'sappreciation reflected economic conditions inCanada and the U.S., and strong foreign demandfor Canadian dollar-denominated securities.
The economic context also prompted the Caisseto raise its credit rating criteria. Most of thecommercial paper held in the portfolio duringthe year thus met the higher rating.
As at December 31, the aggregate short-terminvestments portfolios totalled $1.84 billionat par value, or $1.81 billion at book value.Synthetic and derivative products, recordedas off-balance-sheet items, represented a theo-retical gross value of 119% of the short-terminvestments portfolio.
II EVOLUTION OF YIELD IN 1991
91-day Treasury bills
• Canada
• Québec
• United States
1O-year bonds
• Canada
• Quebec
• United States
A
A S 0 N D in percentage
33 BREAKDOWN OF SHORT-TERM INVESTMENTS
Treasury bills42.5Canada
23.4Québec
1.3United States
15.8Financial institution paper
Provincial crown corporation notes 12.3Commercial paper 4.6Other commercial paper 0.1
. .
IIIIIIIIIIIIII' PRODUCTS (OFF-BALANCE SHEET)
Forward rate agreements 59.8
as at December 31, 1991at par value -in percentage
SYNTHETIC AND DERIVATIVE
Interest rate swaps 12.9Bankers acceptances 27.3
It was in this context that the Caisse's volume ofoperations in 1991 reached a record $345.8 bil-lion. The sizeable impact of these operations onthe Caisse's treasury management led to thecreation of a treasury portfolio to regulate andharmonize cash flows, which at times can reacha billion dollars a day. The anticipated return onthis portfolio takes into account the need forsufficient cash resources to cover scheduledpayables, as well as other requirements.
In addition, a short-term investment portfoliowas constituted to meet the requirements ofeach depositor's asset mix strategies. The aim isto maximize return on investments in short-term securities, without any liquidity con-straints. Some investments involved combiningsecurities maturing in one or sometimes twoyears, as well as series of forward rate agree-ments traded on stock exchanges, notablyThe Montreal Exchange, or over the counter.By year-end, the return on the portfolio hadincreased by several basis points, adding to theCaisses considerable gains as a result of itsfavourable positioning on the interest rateyield curve.
29
Currency MarketsThe Caisses activities in managing foreigninvestments are structured around the con-cept of risk, primarily exchange risk, basicallydefined as the risk to which an institution isexposed as a result of currency fluctuations.A negative fluctuation can translate into a lossin the source currency, in this instance, theCanadian dollar.
Strong currency fluctuations therefore encourageinstitutions with international operations todevelop policies and strategies for managingexchange risk. The globalization of trade andfinancial markets has produced a multiplicityof new instruments for managing both foreignexchange and interest rate risk: forward rateagreements, currency options, currency swaps,currency forward contracts traded on stockmarkets, and many more.
The Caisses foreign exchange operations had amodest beginning in 1983, and were aimed athedging the exchange risk on investments inU.S. Treasury bills. As a result of the interna-tional diversification of the equity portfolio in1985 and the significant increase in positionsin 1989, foreign exchange operations were ex-panded in a number of countries. A policy wasthen adopted to hedge against exchange risk forall foreign investments, which accelerated thegrowth of spot and forward market transactions,making the Caisse as active in the currencymarket as in other investment sectors. Finally,foreign exchange operations were centralizedfor all foreign investment activities in order tohedge against risk in accordance with estab-lished policy.
The Caisse actively managed its portfolios duringthe year, using a wide range of derivative in-struments and an optimization technique bycountry based on a basket of currencies. Further-more, it selected hedging terms that allowed itto take advantage of fluctuating interest ratespreads between countries. These strategies ena-bled the Caisse to record a gain of $75.5 million.It thus intends to continue developing efficientand appropriate practices for managing andcontrolling exchange risk, based on sound andprudent policies.
In 1991, the Caisse's currency operations ex-panded significantly over 1990, with volumesincreasing by 66.6%.
For the year as a whole, currency volumesbought and sold reached over CA $77.2 billionin regard to foreign bond, equity and short-terminvestments, representing 15% of the Caissestotal investments or $6.1 billion at market value.
11:1 EVOLUTION OF CANADIAN DOLLAR IN 1991
90
89
88
87
88
85
in U.S. cents perCanadian dollar
A M J J A
0
30
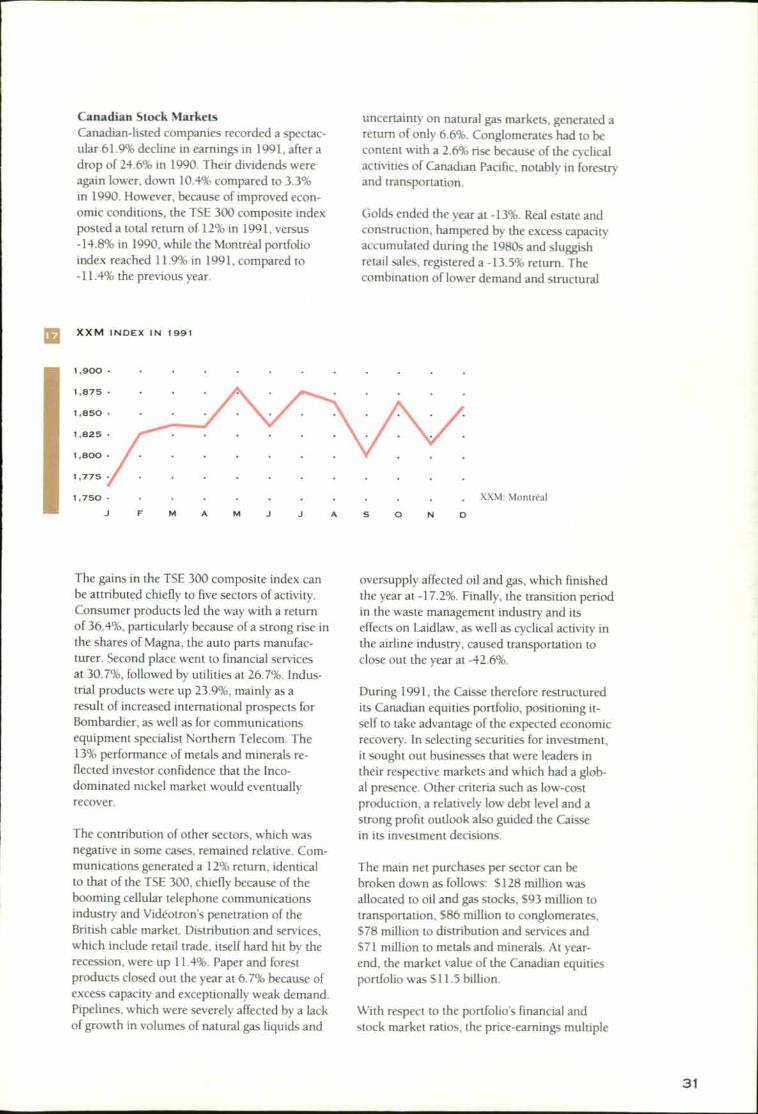
Canadian Stock MarketsCanadian-listed companies recorded a spectac-ular 61.9% decline in earnings in 1991, after adrop of 24.6% in 1990. Their dividends wereagain lower, down 10.4% compared to 3.3%in 1990. However, because of improved econ-omic conditions, the TSF 300 composite indexposted a total return of 12% in 1991, versus-14.8% in 1990, while the Montreal portfolioindex reached 11.9% in 1991, compared to-11.4% the previous year.
uncertainty on natural gas markets, generated areturn of only 6.6%. Conglomerates had to becontent with a 2.6% rise because of the cyclicalactivities of Canadian Pacific, notably in forestryand transportation.
Golds ended the year at -13%. Real estate andconstruction, hampered by the excess capacityaccumulated during the 1980s and sluggishretail sales, registered a -13.5% return. Thecombination of lower demand and structural
XX M INDEX IN 1991
1,900 •
1,875 •
1,850 •
1,825 •
1,800 •
1,775
1,750 • XXM: MontrealA
A S 0
The gains in the TSE 300 composite index canbe attributed chiefly to five sectors of activity.Consumer products led the way with a returnof 36.4%, particularly because of a strong rise inthe shares of Magna, the auto parts manufac-turer. Second place went to financial servicesat 30.7%, followed by utilities at 26.7%. Indus-trial products were up 23.9%, mainly as aresult of increased international prospects forBombardier, as well as for communicationsequipment specialist Northern Telecom. The13% performance of metals and minerals re-flected investor confidence that the Inco-dominated nickel market would eventuallyrecover.
The contribution of other sectors, which wasnegative in some cases, remained relative. Com-munications generated a 12% return, identicalto that of the TSE 300, chiefly because of thebooming cellular telephone communicationsindustry and Vidéotron's penetration of theBritish cable market. Distribution and services,which include retail trade, itself hard hit by therecession, were up 11.4%. Paper and forestproducts closed out the year at 6.7% because ofexcess capacity and exceptionally weak demand.Pipelines, which were severely affected by a lackof growth in volumes of natural gas liquids and
oversupply affected oil and gas, which finishedthe year at -17.2%. Finally, the transition periodin the waste management industry and itseffects on Laidlaw, as well as cyclical activity inthe airline industry, caused transportation toclose out the year at -42.6%.
During 1991, the Caisse therefore restructuredits Canadian equities portfolio, positioning it-self to take advantage of the expected economicrecovery. In selecting securities for investment,it sought out businesses that were leaders intheir respective markets and which had a glob-al presence. Other criteria such as low-costproduction, a relatively low debt level and astrong profit outlook also guided the Caissein its investment decisions.
The main net purchases per sector can bebroken down as follows: $128 million wasallocated to oil and gas stocks, $93 million totransportation, 586 million to conglomerates,$78 million to distribution and services and$71 million to metals and minerals. At year-end, the market value of the Canadian equitiesportfolio was $11.5 billion.
With respect to the portfolio's financial andstock market ratios, the price-earnings multiple
31
was 28.1, the price-book value ratio was 1.69,
the dividend yield was 3.05% and the debt ratio(debt-common shareholders' equity) was 0.60.
It should also be noted that risk exposure forthe total portfolio was evaluated at 180 basispoints above or below its average long-termreturn, with a 66,7% probability, or two yearsout of three.
The Caisse's investments on Canadian stock
markets also include a block of equities indexedto the TSE 35, which comprises the securities of
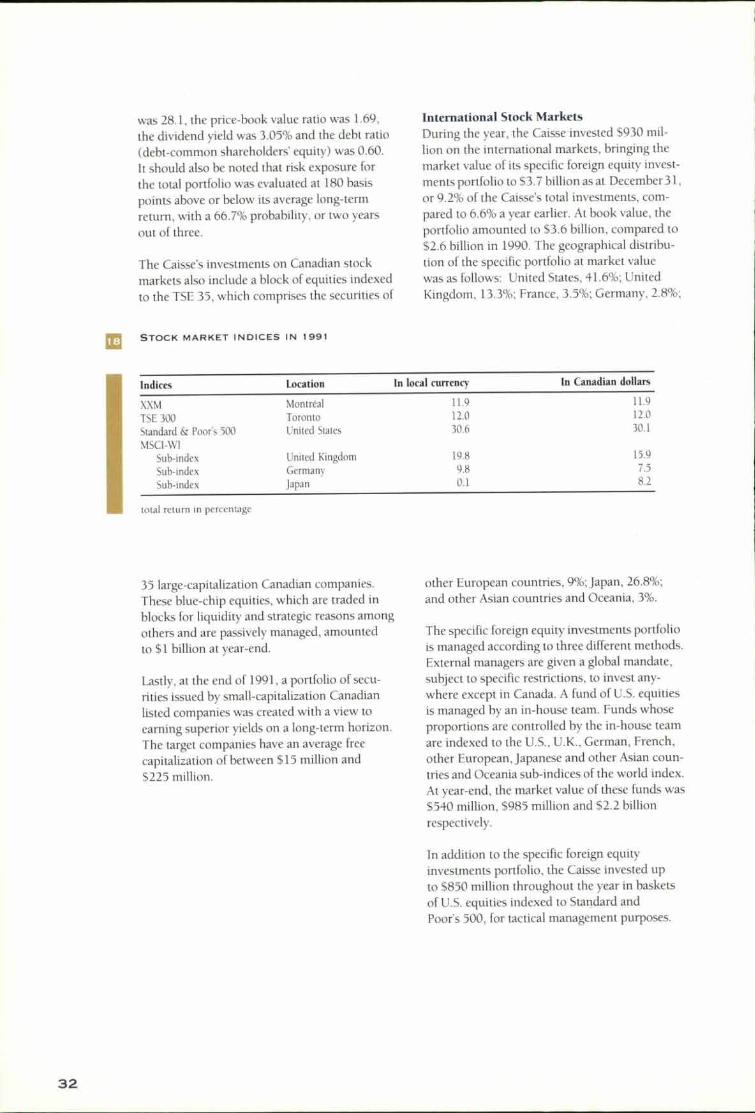
International Stock MarketsDuring the year, the Caisse invested $930 mil-lion on the international markets, bringing themarket value of its specific foreign equity invest-ments portfolio to $3.7 billion as at December 31,
or 9.2% of the Caisses total investments, com-pared to 6.6% a year earlier. At book value, theportfolio amounted to $3.6 billion, compared to$2.6 billion in 1990. The geographical distribu-tion of the specific portfolio at market valuewas as follows: United States, 41.6%; UnitedKingdom, 13.3%; France, 3.5%; Germany, 2.8%;
Mi STOCK MARKET INDICES IN 1991
Indices Location In local currency In Canadian dollars
XXM Montreal 11.9 11.9
TSE 300 Toronto 12.0 12,0
Standard & Poofs 500 United States 30.6 30.1
MSCI-WISub-index United Kingdom 19.8 15.9
Sub-index Germany 9.8 7.5
Sub-index Japan 0.1 8.2
total return in percentage
35 large-capitalization Canadian companies.These blue-chip equities, which are traded inblocks for liquidity and strategic reasons amongothers and are passively managed, amountedto $1 billion at year-end.
Lastly, at the end of 1991, a portfolio of secu-rities issued by small-capitalization Canadianlisted companies was created with a view toearning superior yields on a long-term horizon.The target companies have an average freecapitalization of between $15 million and$225 million.
other European countries, 9%; Japan, 26.8%;
and other Asian countries and Oceania, 3%.
The specific foreign equity investments portfoliois managed according to three different methods.External managers are given a global mandate,subject to specific restrictions, to invest any-where except in Canada. A fund of U.S. equitiesis managed by an in-house team. Funds whoseproportions are controlled by the in-house teamare indexed to the U.S., U.K., German, French,other European, Japanese and other Asian coun-tries and Oceania sub-indices of the world index.At year-end, the market value of these funds was$540 million, $985 million and $2.2 billion
respectively.
In addition to the specific foreign equityinvestments portfolio, the Caisse invested upto $850 million throughout the year in basketsof U.S. equities indexed to Standard andPoor's 500, for tactical management purposes.
32

20
L
A currency forward contracts portfolio createdin 1989 is used in conjunction with the geo-graphical allocation to improve the efficiency ofthe a set mix selection process as well as en-hance returns. This currency forward contractsportfolio, also called the tactical hedging portfo-lio, is managed by the in-house team, and itsperformance is included in that of the specificforeign equity investments portfolio.
As a result of studies on the advantages for aCanadian investor of diversifying into foreignequities, the Caisse concluded that a portfolioof foreign equities hedged against exchange riskcould offer a better risk-return profile than anunhedged portfolio. It therefore decided to fullyhedge its specific foreign equity portfolio againstsuch risk from the beginning of 1991. This stra-tegic hedging is performed automatically andprotects the entire portfolio against currencyfl uctuations. It is independent from the tacticalhedging which enables the manager to take ad-vantage of currency fluctuations while assuminga reasonable risk.
GEOGRAPHICAL BREAKDOWN OF THE SPECIFIC
FOREIGN EQUITY INVESTMENTS PORTFOLIO
as at December 31, 1991at market value -
in percentage
United States 41.6United Kingdom 13.3France 3.5Germany 2.8Other European countries 9.0Japan 26.8Other Asian countriesand Oceania 10
EVOLUTION OF INVESTMENTS IN FOREIGN SHARES
AS PART OF TOTAL INVESTMENTS
1991 3,757 40,634
•
1990 1.1 3,116 36,186'as at December 31at market value -in millions of dollars
• Foreign shares
• Total investments
' restated to conform with the presentation of 1991
33
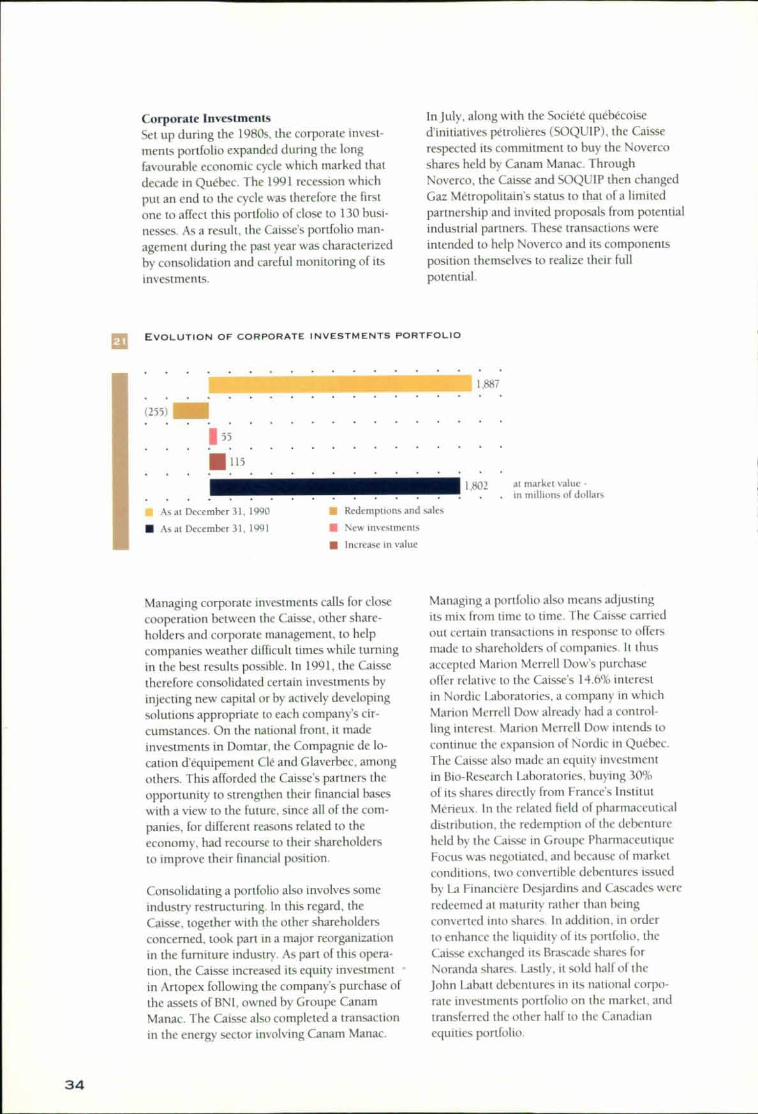
Corporate InvestmentsSet up during the 1980s, the corporate invest-ments portfolio expanded during the longfavourable economic cycle which marked thatdecade in Quebec. The 1991 recession whichput an end to the cycle was therefore the firstone to affect this portfolio of close to 130 busi-
nesses. As a result, the Caisses portfolio man-agement during the past year was characterizedby consolidation and careful monitoring of itsinvestments.
ln July, along with the Societe québécoised'initiatives pétrolières (SOQUIP), the Caisserespected its commitment to buy the Noverco
shares held by Canam Manac. ThroughNoverco, the Caisse and SOQUIP then changedGaz Métropolitain's status to that of a limitedpartnership and invited proposals from potentialindustrial partners. These transactions wereintended to help Noverco and its componentsposition themselves to realize their full
potential.
111 EVOLUTION OF CORPORATE INVESTMENTS PORTFOLIO
IL _AMR._ 4111.116___ 1,887
(255)
I"
al As at December 31, 1990 • Redemptions and sales
• Mat December 31, 1991 • New investments
111 Increase in value
1 802 at market value -
in millions of dollars
Managing corporate investments calls for close
cooperation between the Caisse, other share-holders and corporate management, to helpcompanies weather difficult times while turningin the best results possible. In 1991, the Caissetherefore consolidated certain investments byinjecting new capital or by actively developingsolutions appropriate to each company's cir-cumstances. On the national front, it made
investments in Dom tar, the Compagnie de lo-cation d'équipement Clé and Glaverbec, amongothers. This afforded the Caisse's partners theopportunity to strengthen their financial baseswith a view to the future, since all of the com-panies, for different reasons related to theeconomy, had recourse to their shareholdersto improve their financial position.
Consolidating a portfolio also involves someindustry restructuring. In this regard, the
Caisse, together with the other shareholdersconcerned, took part in a major reorganizationin the furniture industry. As part of this opera-tion, the Caisse increased its equity investment -in Artopex following the company's purchase ofthe assets of BNI, owned by Groupe Canam
Manac. The Caisse also completed a transactionin the energy sector involving Canam Manac.
Managing a portfolio also means adjustingits mix from time to time. The Caisse carriedout certain transactions in response to offersmade to shareholders of companies. It thusaccepted Marion Merrell Dow's purchaseoffer relative to the Caisses 14.6% interest
in Nordic Laboratories, a company in whichMarion Merrell Dow already had a control-ling interest. Marion Merrell Dow intends tocontinue the expansion of Nordic in Quebec.The Caisse also made an equity investmentin Bio-Research Laboratories, buying 30%
of its shares directly from France's Institut
Mérieux. ln the related field of pharmaceuticaldistribution, the redemption of the debentureheld by the Caisse in Groupe PharmaceutiqueFocus was negotiated, and because of marketconditions, two convertible debentures issuedby La Financière Desjardins and Cascades wereredeemed at maturity rather than beingconverted into shares. In addition, in orderto enhance the liquidity of its portfolio, the
Caisse exchanged its Brascade shares for
Noranda shares. Lastly, it sold half of the
John Labatt debentures in its national corpo-rate investments portfolio on the market, and
transferred the other half to the Canadianequities portfolio.
34

Furthermore, the Caisse took advantage ofmarket conditions to increase its ownershipof Cambior to almost 6%. h also subscribed fora private offering of Videotron shares in orderto participate in its international expansion, rais-ing its stake in the company by $37.5 million.
With respect to regional funds, the Caisse,together with other financial partners, createdInvestissements Gaspesie-les-fies-de-la-Madeleine, a venture capital enterprise thatwill help provide the region with seed moneyfor business development. The Caisse also hada role in forming the new joint-venture limitedpartnership Canadian Pension Equity andCompany Ill.
At year-end, the market value of the nationalcorporate investments portfolio amounted to$1.23 billion compared to $1.15 billion in1990, and its book value was $1.08 billionversus $1.12 billion in 1990.
The Caisse continued to enhance its interna-tional presence by joining forces with a Quebecpartner, Corporation financiere Interrnedia, toinvest $1.2 million of a $2.5 million aggregatecommitment in Corn 2i, a European communi-cations investment company. This investmentincreased the market value of the internationalcorporate investments portfolio to $32 million.
As at December 31, 1991, the market valueof the aggregate corporate investments port-folio, which represents 4.4% of the Caisse'stotal investments, amounted to $1.80 billion,compared to almost $1.89 billion in 1990.The reduction in the portfolio is further toredemptions and sales of investments total-ling $255 million, while the total value ofthe portfolios grew by $115 million and newinvestments amounted to $55 million.
MortgagesMortgage rates tumbled in 1991 as monetarypolicy eased. Their decline was most evident inthe residential loans sector, with five-year mort-gage rates dropping below 10% at year-end.
In spite of favourable rates, mortgage lendingoperations slowed considerably. In the resi-dential loans sector, housing starts were signif-icantly down. Statistics on the resale market aswell as credit demand revealed a similar trend.Demand for commercial and industrial mort-gages was also down, reflecting the difficulteconomic times, and vacancy rates were high.
Despite these conditions, the Caisse granted$278.8 million of mortgage loans in 1991, ofwhich $169.6 million was earmarked forproperties outside Montreal and Quebec City.
The Caisse's main achievements in 1991included the financing of two shoppingcentres, one for $5.7 million in Magog andthe other for $5.3 million in Trois-Rivieres-Ouest, as well as the refinancing of three othercentres for $28 million in Granby, $11.2 millionin Valleyfield and $9.5 million in Cap-de-la-Madeleine. The Caisse also financed two officebuildings, one in Sainte-Foy and the other inVanier, for $7.5 million and $5 million respec-tively, and refinanced an office building inMontréal for $5 million.
With regard to multi-unit residential buildings,the Caisse refinanced a 121-unit apartmentbuilding in Charlesbourg for $3.5 million andFinanced a 120-unit housing complex in Lasalle
MI BREAKDOWN OF MORTGAGES
1 as ai DeceMbCr 31, 1991al market value -
in percentage
44.4
42.313.3
35
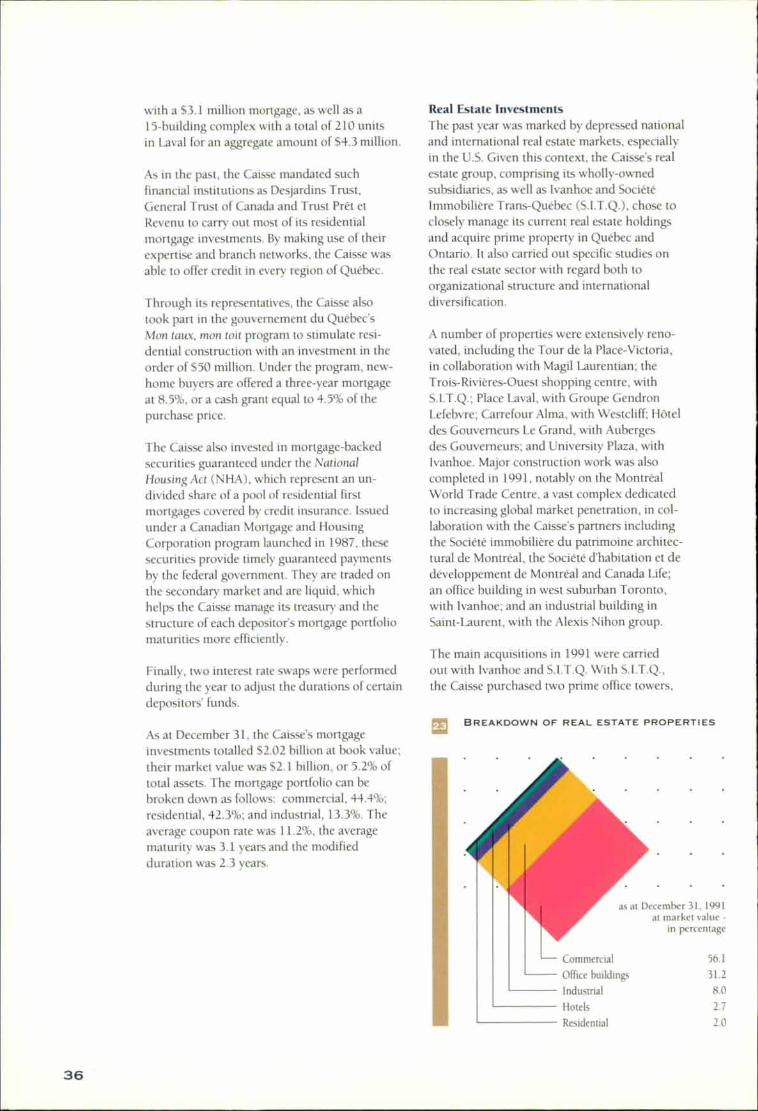
Commercial
Office buildings
Industrial
Hotels
Residential
56.1
31.2
8,02.7
2.0
as at December 31, 1991at market value -
in percentage
with a $3.1 million mortgage, as well as a15-building complex with a total of 210 unitsin Laval for an aggregate amount of $4.3 million.
As in the past, the Caisse mandated suchfinancial institutions as Desjardins Trust,General Trust of Canada and Trust Prêt etRevenu to carry out most of its residentialmortgage investments. By making use of theirexpertise and branch networks, the Caisse wasable to offer credit in every region of Quebec.
Through its representatives, the Caisse alsotook part in the gouvernement du Quebec'sMon taux, mon toit program to stimulate resi-dential construction with an investment in theorder of $50 million. Under the program, new-home buyers are offered a three-year mortgageat 8.5%, or a cash grant equal to 4.5% of thepurchase price.
The Caisse also invested in mortgage-backedsecurities guaranteed under the National
Housing Act (NHA), which represent an un-divided share of a pool of residential firstmortgages covered by credit insurance. Issuedunder a Canadian Mortgage and HousingCorporation program launched in 1987, thesesecurities provide timely guaranteed paymentsby the federal government. They are traded onthe secondary market and are liquid, whichhelps the Caisse manage its treasury and thestructure of each depositor's mortgage portfoliomaturities more efficiently.
Finally, two interest rate swaps were performedduring the year to adjust the durations of certaindepositors' funds.
As at December 31, the Caisse's mortgageinvestments totalled $2.02 billion at book value;their market value was S21 billion, or 5.2% oftotal assets. The mortgage portfolio can bebroken down as follows: commercial, 44.4%;residential, 42.3%; and industrial, 13.3%. Theaverage coupon rate was 11.2%, the averagematurity was 3.1 years and the modifiedduration was 2.3 years.
Real Estate InvestmentsThe past year was marked by depressed nationaland international real estate markets, especiallyin the U.S. Given this context, the Caisse's realestate group, comprising its wholly-ownedsubsidiaries, as well as Ivanhoe and SocieteImmobilière Trans-Quebec (S.I.T.Q.), chose toclosely manage its current real estate holdingsand acquire prime property in Quebec andOntario. It also carried out specific studies onthe real estate sector with regard both toorganizational structure and internationaldiversification.
A number of properties were extensively reno-vated, including the Tour de la Place-Victoria,in collaboration with Magil Laurentian; theTrois-Rivières-Ouest shopping centre, withS.I.T.Q.; Place Laval, with Groupe GendronLefebvre; Carrefour Alma, with Westcliff; Hôteldes Gouverneurs Le Grand, with Aubergesdes Gouverneurs; and University Plaza, withIvanhoe. Major construction work was alsocompleted in 1991, notably on the MontrealWorld Trade Centre, a vast complex dedicatedto increasing global market penetration, in col-laboration with the Caisses partners includingthe Societe immobilière du patrimoine architec-tural de Montreal, the Societe d'habitation et dedéveloppement de Montreal and Canada Life;an office building in west suburban Toronto,with Ivanhoe; and an industrial building inSaint-Laurent, with the Alexis Nihon group.
The main acquisitions in 1991 were carriedout with Ivanhoe and S.I.T.Q. With S.I.T.Q.,the Caisse purchased two prime office towers,
EE BREAKDOWN OF REAL ESTATE PROPERTIES
36
located on downtown Montreal's most presti-
gious avenue. The two properties were Place
Mercantile, in which the Caisse has a 74%interest, and 1981 McGill College, in which the
Caisse has an 80% interest. Other acquisitions
included 55 University in Toronto, wholly-
owned by Ivanhoe; the Cobourg shopping
centre, in Ontario and the Galeries Rive-Nord
shopping centre in Repentigny, both 50% owned
by Ivanhoe. The real estate group also increased
its stake in the Mail Champlain shopping mall,
in which Ivanhoe has a 76% interest.
Aggregate capital expenditures and acquisitions
for the year totalled $480 million, less sales of
$15.6 million.
As at December 31, 1991, total real estate
investments were $1.83 billion at market value,
representing close to 4.5% of the Caisses total
assets. Net holdings in the specific real estate
investments portfolio, which amounted to
$1.9 billion at market value, were the result
of investments which totalled $2.80 billion at
book value, and $2,77 billion at market value,
less third-party minority interests as well as
related bank and mortgage loans totalling
$905.5 million.
Pursuant to the Caisses policy, the market value
of the specific portfolio is determined through
an independent assessment of a strict and pru-
dent valuation of real estate investments.
Overall, real estate values declined in 1991,reflecting prevailing economic conditions inQuebec and Ontario, where most of the invest-ments of the real estate group are located, theglut on Montreal and Toronto markets andexpectations of high returns on the part of realestate investors.
The underlying quality of the portfolio has notchanged despite economic factors, and returnsare anticipated to be high in the medium term,which is characteristic of the real estate sector.Current income stood at 5.2%, at market value.
Apart from properties held by the companies
whose assets are consolidated in the portfolio,and which account for 92.3% of the marketvalue of the specific real estate investments
portfolio, the portfolio breaks down as follows:bonds of real estate companies, 1.8%; stocks,3.8%; mortgages, 1.6%; and short-term
investments, 0.5%.
As at December 31, 1991, the breakdown of realestate holdings at market value was as follows:
office buildings, 31.2%; commercial, 56.1%;industrial, 896; residential, 2%; and hotels, 2.7%.
37

aIII BOARD OF DIRECTORS
* Jean-Claude DelormeChairman of the Boardand Chief Executive Officer
Guy SavardPresident and Chief of Operations
*Claude LegaultDeputy Chairman of the Boardand PresidentRegie des rentes du Quebec
* Claude BelandPresidentLa Confederation des caisses populaires etd'économie Desjardins du Québec
Gisèle DesrochersDeputy MinisterMinistère du Loisir, de la Chasse et de la Pèche
Louis LabergeChairman of the BoardFonds de solidarité des travailleurs du Quebec(FTQ)
* Pierre MichaudChairman of the Board and Chief Executive OfficerGroupe Val Royal Inc.
Jacques O'BreadyPresidentCommission municipale du Quebec
Gabriel SavardPresident and General ManagerSociété de développement industriel du Quebec
Claude SeguinDeputy MinisterMinistère des Finances
Raymond SiroisChairman of the Board and Chief Executive OfficerQuébec-Téléphone
Andre TrudeauDeputy MinisterMinistère de l'Environnement
* also a member of the audit committee
1
SENIOR MANAGEMENT
Jean-Claude DelormeChairman of the Boardand Chief Executive Officer
Guy SavardPresident and Chief of Operations
Carmen CrepinCorporate Secretary
Senior Vice-Presidents:
Claude FerlandFixed-Income Investments and Strategic Affairs
Michel NadeauStock Markets and Investment Planning
Serge RemillardAdministration and Control
Jean-Claude ScraireLegal and Corporate Affairsand Real Estate Investments
VICE-PRESIDENTS
Hubert Lapierre - Canadian Stock Markets
Richard Lesage - Economics
Jacques Malenfant - Human Resources
Germain Mathieu - Real Estate Investments
Yves Magnin - Asset Mix
Walter Murkens - Depositors' Affairs
Normand Provost - National Corporate Investments
Add Samat - International Stock Markets
Alain Tessier - Finance
Yves Benoit - Data Processing
Pierre Bouvier - Bond Investments
serge Desjardins - Internal Audit
Réal Desrochers - International CorporateInvestments
Andre Duchesne - Money Market Investments
Pierre Fortier - Corporate Investments -Special Projects
Philippe Gabelier - Public Affairs
Ghislaine Laberge - Mortgage Investments
38

FINANCIAL
STA1TEMENTS
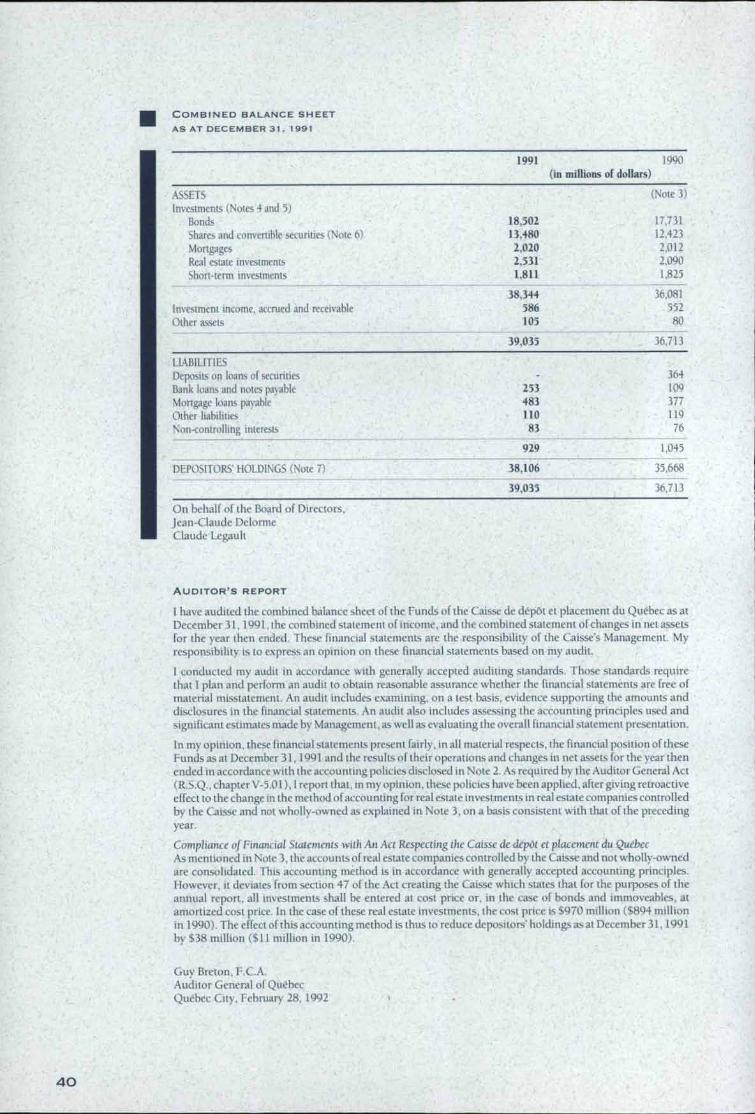
COMBINED BALANCE SHEET
AS AT DECEMBER 31 , 1991
1991(in millions of dollars)
1990
ASSETS (Note 3)Investments (Notes 4 and 5)
Bonds 18,502 17,731Shares and convertible securities (Note 6) 13,480 12,423Mortgages 2,020 2,012Real estate investments 2,531 2,090Short-term investments 1,811 1,825
38,344 36,081Investment income, accrued and receivable 586 552Other assets 105 80
39,035 36,713
LIABILITIESDeposits on loans of securities 364Bank loans and notes payable 253 109Mortgage loans payable 483 377Other liabilities 110 119Non-controlling interests 83 76
929 1,045
DEPOSITORS' HOLDINGS (Note 7) 38,106 35,668
39,035 36,713
On behalf of the Board of Directors,Jean-Claude DelormeClaude Legault
AUDITOR'S REPORT
I have audited the combined balance sheet of the Funds of the Caisse de dépôt et placement du Quebec as atDecember 31, 1991, the combined statement of income, and the combined statement of changes in net assetsfor the year then ended. These financial statements are the responsibility of the Caisse's Management. Myresponsibility is to express an opinion on these financial statements based on my audit.
1 conducted my audit in accordance with generally accepted auditing standards. Those standards requirethat 1 plan and perform an audit to obtain reasonable assurance whether the financial statements are free ofmaterial misstatement. An audit includes examining, on a test basis, evidence supporting the amounts anddisclosures in the financial statements. An audit also includes assessing the accounting principles used andsignificant estimates made by Management, as well as evaluating the overall financial statement presentation.
In my opinion, these financial statements present fairly, in all material respects, the financial position of theseFunds as at December 31, 1991 and the results of their operations and changes in net assets for the year thenended in accordance with the accounting policies disclosed in Note 2. As required by the Auditor General Act(R.S.Q., chapter V-5.01), I report that, in my opinion, these policies have been applied, after giving retroactiveeffect to the change in the method of accounting for real estate investments in real estate companies controlledby the Caisse and not wholly-owned as explained in Note 3, on a basis consistent with that of the precedingyear.
Compliance of Financial Statements with An Act Respecting the Caisse de dépôt et placement du QuebecAs mentioned in Note 3, the accounts of real estate companies controlled by the Caisse and not wholly-ownedare consolidated. This accounting method is in accordance with generally, accepted accounting principles.However, it deviates from section 47 of the Act creating the Caisse which states that for the purposes of theannual report, all investments shall be entered at cost price or, in the case of bonds and immoveables, atamortized cost price. In the case of these real estate investments, the cost price is $970 million ($894 millionin 1990). The effect of this accounting method is thus to reduce depositors' holdings as at December 31, 1991by $38 million (Si! million in 1990).
Guy Breton, F.C.A.Auditor General of QuebecQuebec City, February 28, 1992
40
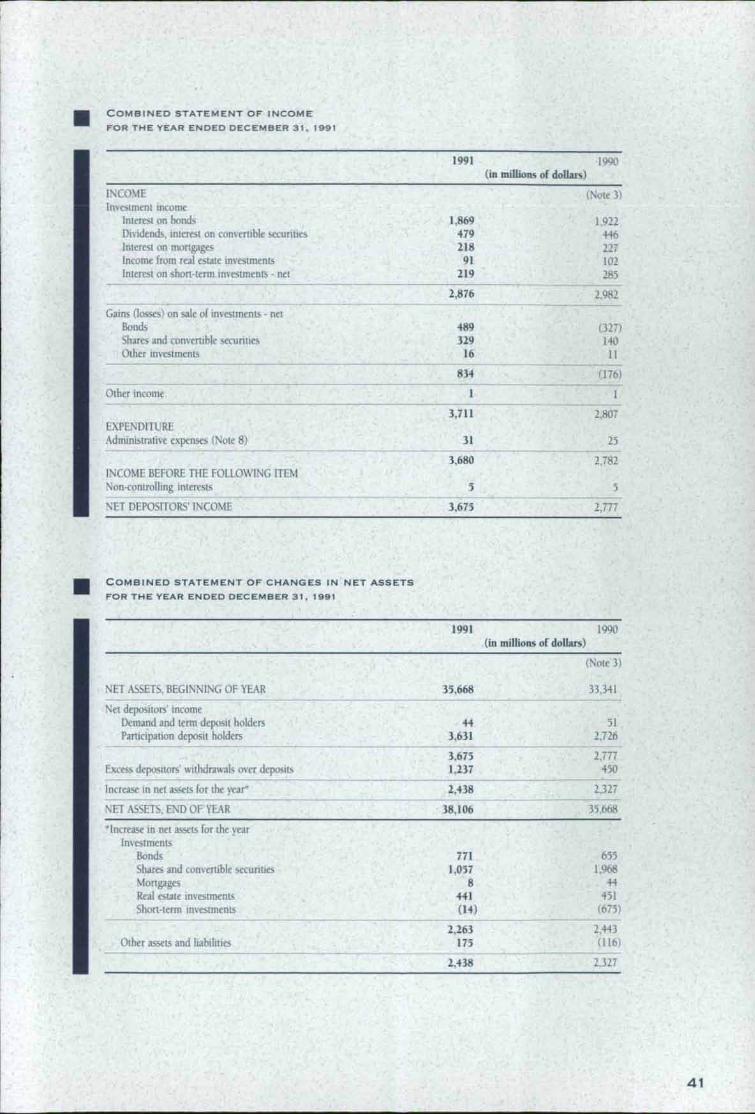
III COMBINED STATEMENT OF INCOME
FOR THE YEAR ENDED DECEMBER 31, 1991
1991 1990(in minions of dollars)
INCOME (Note 3)Investment income
Interest on bonds 1,869 1,922Dividends, interest on convertible securities 479 446Interest on mortgages 218 227Income from real estate investments 91 102Interest on short-term investments - net 219 285
2,876 2,982
Gains (losses) on sale of investments - net
Bonds 489 (327)Shares and convertible securities 329 140Other investments 16 11
834 (176)
Other income 1_
3,711 2,807EXPENDITURE
Administrative expenses (Note 8) 31 25
3,680 2,782INCOME BEFORE THE FOLLOWING ITEMNon-controlling interests 5 5
NET DEPOSITORS' INCOME 3,675 2,777
COMBINED STATEMENT OF CHANGES IN NET ASSETS
FOR THE YEAR ENDED DECEMBER 31, 1991
1991 1990(in millions of dollars)
(Note 3)
NET ASSETS, BEGINNING OF YEAR 35,668 33,341
Net depositors' income
Demand and term deposit holders 44 51Participation deposit holders 3,631 2,726
3,675 2,777Excess depositors' withdrawals over deposits 1,237 450
Increase in net assets for the year* 2,438 2,321
NET ASSETS, END OF YEAR 38,106 35,668
'Increase in net assets for the year
Investments
Bonds 771 655Shares and convertible securities 1,057 1.968Mortgages 8 44Real estate investments 441 451Short-terni investments (14) (675)
2,263 2,443Other assets and liabilities 175 (116)
2,438 2,327
41

NOTES TO FINANCIAL STATEMENTS
DECEMBER 31, 1991
CONSTITUTION AND OPERATIONS
The Caisse de depot et placement du Québec is a corporation within the meaning of the Civil Code, createdby a special act (R.S.Q., chapter C-2 and amendments). It receives funds, the deposit of which is provided forunder a particular act.
GENERAL FUNDThe General Fund is a pooled fund for demand, term and participation deposits. The General Funds netequity and net income as at December 31 were shared among participation deposit holders as follows:
1991 1990
Number ofunits
Number ofunits
Régie des rentes du Quebec 18,321,906 74.5 18,189,689 75.0Société de l'assurance automobile du Québec 6,259,256 25.4 6,037,050 24.9Fonds d'assurance-préts agricoles et forestiers 12,871 0.1 12,871 0.1Régime complémentaire de rentes des
techniciens ambulanciers œuvrant au Québec 12,052 7,711Régie des marchés agricoles et
alimentaires du Québec 3,103 2,693
24,609,188 100.0 24,250,014 100.0
INDIVIDUAL FUNDS
The Individual Funds each have only one depositor who exclusively makes participation deposits therein.The various Individual Funds are:
Fund 301For the Government and Public Employees Retirement Plan - contributions from unionized employees -administered by the Commission administrative des régimes de retraite et d'assurances.
Fund 302For the Government and Public Employees Retirement Plan - contributions from non-unionized employees,contributions from employers and transfers from supplemental pension plans - administered by theCommission administrative des régimes de retraite et d'assurances.
Fund 303For the Individual Plans, administered by the Commission administrative des régimes de retraite etd'assurances.
Fund 304For the General Retirement Plan for Mayors and Councillors of Municipalities, administered by theCommission administrative des régimes de retraite et d'assurances.
Fund 305For the Pension Plan for Elected Municipal Officers, administered by the Commission administrative desrégimes de retraite et d'assurances.
Fund 311For the Supplemental Pension Plan for Employees of the Québec Construction Industry active participants -administered by the Commission de la construction du Québec.
Fund 312For the Supplemental Pension Plan for Employees of the Québec Construction Industry - retired participants -administered by the Commission de la construction du Québec.
Fund 313For the Supplemental Pension Plan for Employees of the Québec Construction Industry - additionalcontributions - administered by the Commission de la construction du Québec.
Fund 330For the Commission de la santé et de la sécurité du travail,
42
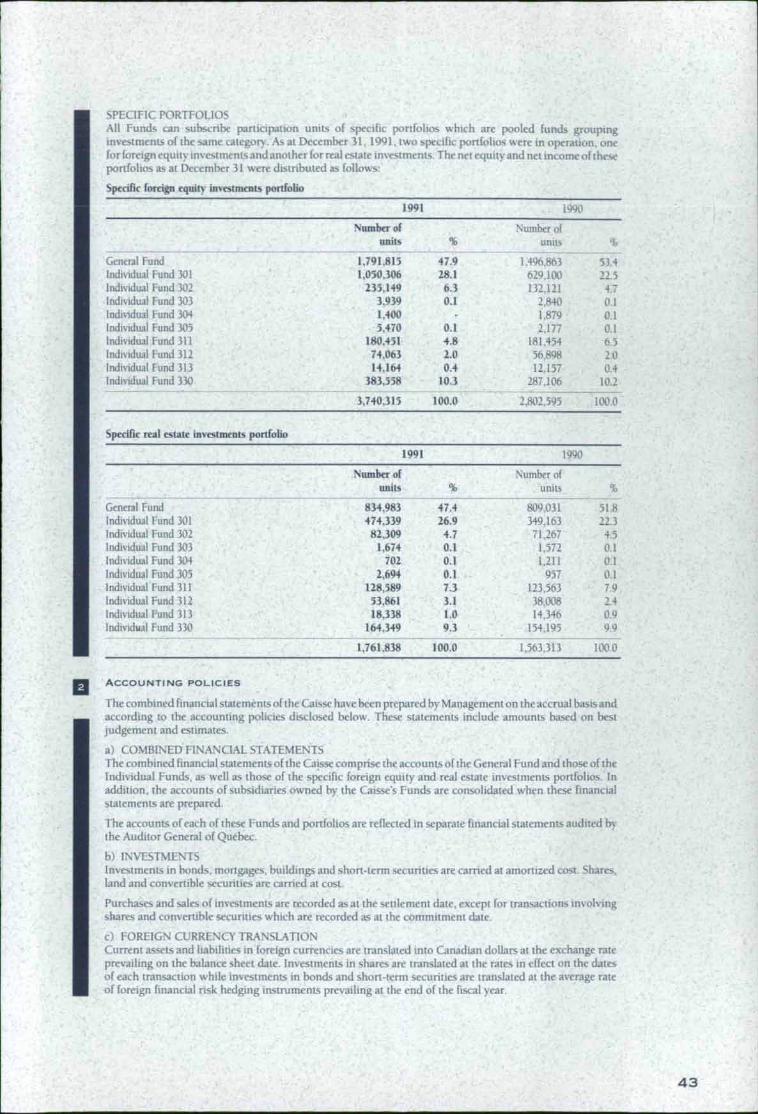
SPECIFIC PORTFOLIOSAll Funds can subscribe participation units of specific portfolios which are pooled funds groupinginvestments of the same category. As at December 31. 1991, two specific portfolios were in operation, oneFor foreign equity investments and another for real estate investments. The net equity and net income of theseportfolios as at December 31 were distributed as follows:
Specific foreign equity investments portfolio
1991 1990
Number ofUnits
Number ofunits
General Fund 1,791,815 47.9 1,496,863 53.4Individual Fund 301 1,050,306 18.1 629,100 22.5Individual Fund 302 235,149 6.3 132,121 4.7individual Fund 303 3,939 0.1 2,840 0.1individual Fund 304 1,400 1,879 0.1Individual Fund 305 5,470 0.1 2,177 0.1Individual Fund 311 180,451 4.8 181,454 6.5Individual Fund 312 74,063 2.0 56,898 2.0Individual Fund 313 14,164 0.4 12,137 0,4Individual Fund 330 383,558 10.3 287,106 10.2
3,740,315 100.0 2,802,595 100.0
Specific real estate investments portfolio
1991 1990
Number of Number ofunits units
General Fund 834,983 47.4 809,031 51.8Individual Fund 301 474,339 26.9 349,163 22.3Individual Fund 302 82,309 4.7 71,267 4.5Individual Fund 303 1,674 0.1 1,572 0.1Individual Fund 304 702 0.1 1,211 0.1Individual Fund 305 2,694 0.1 957 0.1Individual Fund 311 128,589 7.3 123,563 7,9individual Fund 312 53,861 3.1 38,008 2.4Individual Fund 313 18,338 1.0 14,346 0,9Individual Fund 330 164,349 9.3 154,195 9.9
1,761,838 100.0 1,563,313 100.0
o ACCOUNTING POLICIES
The combined financial statements of the Caisse have been prepared by Management on the accrual basis andaccording to the accounting policies disclosed below. These statements include amounts based on hestjudgement and estimates.
a) COMBINED FINANCIAL STATEMENTSThe combined financial statements of the Caisse comprise the accounts of the General Fund and those of theIndividual Funds, as well as those of the specific foreign equity and real estate investments portfolios. Inaddition, the accounts of subsidiaries owned by the Caisses Funds are consolidated when these financialstatements are prepared.
The accounts of each of these Funds and portfolios are reflected in separate financial statements audited bythe Auditor General of Quebec.
I)) INVESTMENTSInvestments in bonds, mortgages, buildings and short-term securities are carried at amortized cost. Shares,land and convertible securities are carried at cost.
Purchases and sales of investments are recorded as at the settlement date, except for transactions involvingshares and convertible securities which are recorded as at the commitment date.
c) FOREIGN CURRENCY TRANSLATIONCurrent assets and liabilities in foreign currencies are translated into Canadian dollars at the exchange rateprevailing on the balance sheet date. Investments in shares are translated at the rates in effect on the datesof each transaction while investments in bonds and short-term securities are translated at the average rateof foreign financial risk hedging instruments prevailing at the end of the fiscal year.
43

D
Income is translated at the average rate prevailing in each of the fiscal periods of the various Funds. Foreignexchange gains and losses are included in investment income, except those gains and losses relating toshares, which are deferred and included in gains and losses on the sale of shares when these investments arerealized. Deferred gains and losses are disclosed under Investments - shares and convertible securities.
d) FINANCIAL FOREIGN EXCHANGE AND INTEREST RATE RISK HEDGING INSTRUMENTSVarious financial instruments such as foreign exchange contracts and forward rate agreements, futures andoptions as well as foreign currency and interest rate swaps are used to hedge against risks associated withfluctuations in exchange and interest rates. The market value of these financial instruments at year-end isincluded in the market value of each hedged investment category.
Gains and losses from foreign exchange risk hedging operations are accounted for as indicated in Note c)while gains and losses resulting from interest rate risk hedging operations are included in the income of eachhedged investment category.
e) DIVIDEND INCOMEDividend income is accounted for on the record date.
0 INTEREST ON SHORT-TERM INVESTMENTS - NETThis item includes interest earned on short-term investments and interest expenses on loans.
g) FIXED ASSETSMaterial and equipment purchases are charged to administrative expenses, except those costs related to thepurchase of telephone, computer and office automation equipment, which are capitalized and depreciatedover their useful lives. Set-up costs for the premises and other leasehold improvement costs are amortizedover the term of the lease. These fixed assets are presented under the item Other assets.
h) ADMINISTRATIVE EXPENSESAdministrative expenses are paid out of the General Fund and charged to the various Funds on a pro rata basisaccording to the market value of the weighted assets of each.
CHANGE IN ACCOUNTING POLICY
The accounts of real estate companies controlled by the Caisse and not wholly-owned are now consolidated.Previously, these companies' accounts were accounted for using the equity method or the proportionateconsolidation method.
The effect of this change, which was applied retroactively, is to increase the amount of the following itemsin the financial statements:
1991 1990(in millions of dollars)
ASSETSInvestments 561 412
Other assets 74 56LIABILITIES 635 468
This change has no impact on depositors' holdings as at December 31, 1991 and 1990 or on depositors' netincome for the years then ended.
INVESTMENTS - AT MARKET VALUE
The market value of investments at year-end represents the amount the Caisse could obtain from the sale ofall of its investments under normal market conditions, without taking into account the impact of a sale of thismateriality. Closing prices of the major stock exchanges as well as those provided by recognized brokeragefirms, specific independent valuations, comparative analyses and any other commonly used valuationmethod can be used to evaluate the different investment categories presented below:
1991(in millions of dollars)
1990
Bonds 19,670 17,392Shares and convertible securities 15,229 13,231Mortgages 2,105 1,984Real estate investments 2,563 2,240Short-term investments 1,803 1,825
41,370 36.672
4 4

El INVESTMENTS - FOREIGN SECURITIES
1991 1990(in millions of dollars)
At At At Atbook market book marketvalue value value value
Bonds 2,240 2,282 1,830 1,834Shares 3,670 3,757 3,336 3,116Short-terni investments 74 70 416 416
5,984 6,109 5,582 5,366
The foreign exchange position for investments in foreign securities, excluding transactions under secu-rities loan agreements, is hedged by financial instruments whose net total maturity value was $6,079 millionas at December 31, 1991 ($4,739 million in 1990).
SHARES AND CONVERTIBLE SECURITIES
1991(in millions of dollars)
1990
Shares and convertible securities helddirectly by the Funds 9,855 9,799
Shares held through the specificforeign equity investments portfolio 3,625 2,624
13,480 12,423
DEPOSITORS' HOLDINGS
Demand and term deposits constitute the Caisse's indebtedness toward the depositors and bear interest.
Participation deposits are expressed in units and each unit gives its holder a proportionate share in the netequity and net income of a particular Fund. At the end of the fiscal period of a Fund, the net income isdistributed to participation deposit holders. At the beginning of the following period, this net income is paidout to the depositors' demand deposit accounts. The fiscal period of the General Fund is one month andthat of the other Funds is three months.
1991 1990(in millions of dollars)
Indebtedness toward depositorsDemand deposits . 242 153Term deposits 121 50Interest on demand and term deposits 3 3Net income to be paid out 647 468
1,013 674
Participation deposit holden' holdingsParticipation deposits
Balance, beginning of year 34,994 32,590Units issued 2,582 2,412Units cancelled (481) (8)
Balance, end of year 37,093 34,994
18,106 35,668
1:1 ADMINISTRATIVE EXPENSES
1991 1990(in millions of dollars)
salaries and employee benefitsProfessional fees 4 2Premises and material 4 4Depreciation of fix assets 2 1Other
18
3
31
15
fixed3
25
a COMPARATIVE FIGURES
Certain figures from the 1990 financial statements have been restated to conform with the presentationof 1991.
45

• SUPPLEMENTARY INFORMATION
SUMMARY FINANCIAL STATEMENTS FOR THE FUNDS
BALANCE SHEET
AS AT DECEMBER 31. 1991
GENERAL
1991
FUND
1990
of dollars)
3011991 1990
(in millions
ASSETSInvestments
Bonds 10,438.7 10,651.5 4,300.1 3,458.5Shares and convertible securities 6,2233 6,111.3 3,652.3 3,354.5Mortgages . 702.5 677.1 274.8 355.8Real estate investments 882.7 852.2 550.6 +03.0Short-term investments 1,538.3 1,297.6 183.9 255.6Demand deposits in the General Fund - - 97.9 153.3
19,785.5 19,589.7 9,059.6 7,980.7Investment income, accrued and receivable 305.2 . 297.9 142.8 117.1Other assets 11.1 6.2
20,101.8 19,893.8 9,202.4 8,097.8
LIABILITIESDemand deposits 486.4 478.2Term deposits 120.5 49.9Income to be paid out to depositors 188.0 156.7 241.9 150.2Deposits on loans of securities 213.0 65.8Other liabilities 19.8 6.5 5.8 2.4
814.7 906.3 247.7 218.4
PARTICIPATION DEPOSITHOLDERS' HOLDINGS 19,287.1 18,987.5 8,954.7 7,879.4
20,101.8 19,893.8 9,202.4 8,097.8
STATEMENT OF INCOME
FOR THE YEAR ENDED DECEMBER 31, 1991
INCOMEInvestment income
Interest on bonds 1,088.3 1,171.2 390.1 377.4Dividends, interest on convertible securities 234.6 221.9 132.7 124.4Interest on mortgages 75.5 73.8 37.9 38.0Income from real estate investments 46.7 63.0 24.5 25,0Interest on short-term investments - net 157.2 197.2 33.2 33.4Interest on deposits in the General Fund . - - 10.7 5.2
1,602.5 1,727.1 629.1 603.4Gains (losses) on sale of investments - net 497.2 (122.3) 163.4 (21.3)Other income 0.6 0.4 0.1 0.1
Total income 2,100.3 1,603.2 792.6 582.2EXPENDITUREAdministrative expenses 16.1 13.5 7.6 5.8Interest on demand and term deposits - net 75.6 71.4
NET INCOME 2,008.6 1,520.3 785.0 576.4
MARKET VALUE OF INVESTMENTS
AS AT DECEMBER 31, 1991
Bonds 11,081.3 10,417.4 4,577.5 3,416.4Shares and convertible securities 7,208.4 6,637.6 4,136.6 3,561.2Mortgages 732.5 670.6 288.1 350.9Real estate investments 901.9 9573 512.4 413.2Short-term investments 1,532.0 1,2983 184.0 255.7Demand deposits in the General Fund - 97.9 153.3
21,456.1 19,981,2 9,7965 8,150.7
46

ENDIN1DUAL FUNDS
302 303 304 3051991 1990 1991 1990 1991 1990 1991 1990
(in millions of dollars)
798.1 757.6 12.8 12.5 5.6 10.6 21.7 10.4800.3 653.7 12.9 11.0 4.6 7.9 24.9 2.0
55.0 74.6 6.0 5.3 1.5 2.5 2.0 -94.8 81.7 1.9 1.8 0.8 1.4 3.2 1.247.2 62.5 4.0 .3.1 0.5 1.1 1.0 8.064.1 8.0 1.4 29 0.8 0.8 1.5 6.5
1,859.5 1,638.1 39.0 36.6 13.8 24.3 54.3 28.129.1 25.2 0.5 0.4 0.2 0.3 0.7 0.3
- -
1,888.6 1,663.3 39.5 37.0 14.0 24.6 55.0 28.4
-50.3 33.3 1.0 0.8 0.4 0.5 1.3 0.8
17.6 0.1 0.1 - 0.12.5 0.5 0.1 0.4
52.8 51.4 1.0 1.0 0.4 0.6 1.7 0.9
1,835.8 1,611.9 38.5 36.0 13.6 24.0 533 27.5
1,888.6 1,663.3 39.5 37.0 14.0 24.6 55.0 28.4
80.5 79.0 1.4 1.4 0.7 1.2 1.9 0.426.7 23.0 0.4 0.4 0.2 0.2 0.7
7.8 8.3 0.6 0.5 0.2 0.2 0.24.5 5.3 0.1 0.1 - 0.1 0.16.1 11.0 0.1 0.5 0.2 0.3 0.32.6 2.1 0.3 0.3 0.1 0.1 0.3 0.3
128.2 128.7 2.9 3.2 1.2 2.0 3.5 1..031.9 (6.4) 0.5 (0.1) 0.3 0.8
0.1
160.2 122.3 3.4 3.1 1.5 2.0 4.3 1.0
1.5 1.2 0.1
138.7 121.1 3.4 3,1 1.5 2 0 4.2 1.0
860.0 745.7 13.8 12.4 6.1 10.5 23.6 10.5884.9 686.3 13.5 10.6 4.7 7.6 25.5 1.9
58.3 73.6 5.9 5.3 1.5 2.5 2.0 -88.9 84.4 1.8 1.8 0.8 1.4 2.9 1.246.7 615 .3.9 3.1 0.5 1.1 1.0 8.064.1 8.0 1.4 2.9 0.8 0.8 1.5 6.5
2,002.9 1,660.5 403 36.1 14.4 23.9 56.5 28.1
_
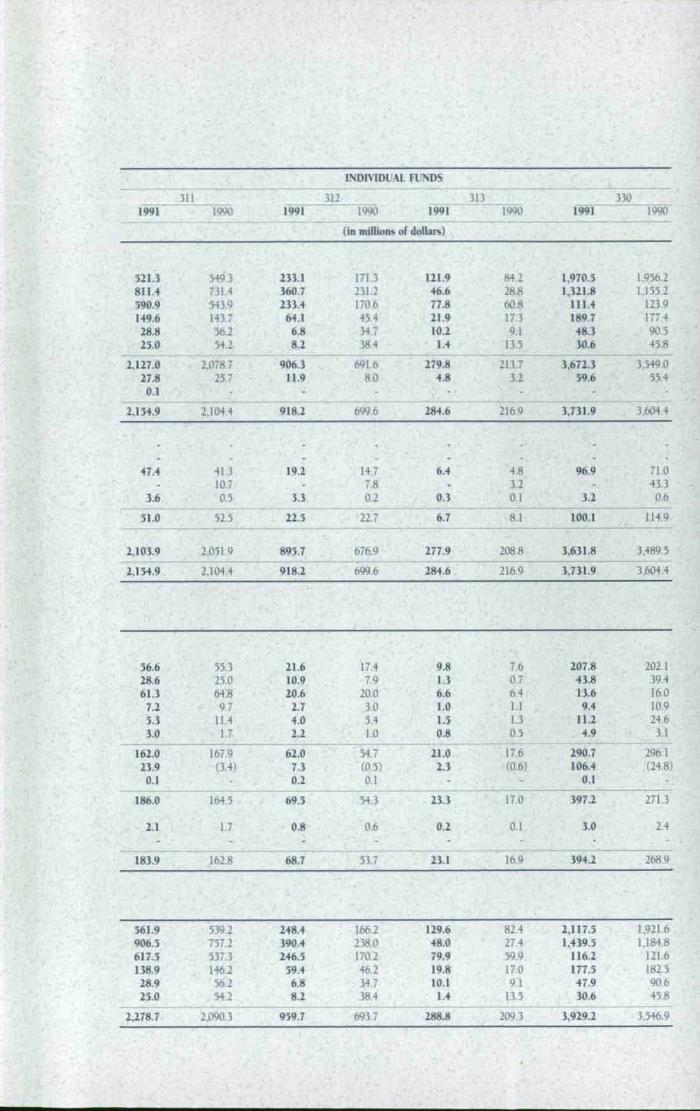
INDIVIDUAL FUNDS
311 312 313 3301991 1990 1991 1990 1991 1990 1991 1990
(in millions of dollars)
521.3 544.3 233.1 171.3 121.9 84.2 1,970.5 1,956.2811.4 731.4 360.7 231.2 46.6 28.8 1,321.8 1,155.2590.9 543.9 233.4 170.6 77.8 60.8 111.4 12.3.9149.6 143.7 64.1 45.4 21.9 17.3 189.7 177.4
28.8 56.2 6.8 34.7 10.2 9.1 48.3 90.525.0
_54.2. 8.2 38.4 1.4 13.5 30.6 45.8
2,127.0 2,078.7 906.3 691.6 279.8 213.7 3,672.3 3,549.027.8 25.7 11.9 8.0 4.8 3.2 59.6 55.4
0.1 -
2,154.9 2,104.4 918.2 699.6 284.6 216.9 3,731.9 3,604,4
- - - - -47.4 41.3 19.2 14.7 6.4 4.8 96.9 71.0
10.7 7.8 - 3.2 43.33.6 0.5 3.3 0.2 0.3 0.1 3.2 0.6
51.0 52.5 22.5 -22.7 6.7 8.1 100.1 114.9
2,103.9 2,051.9 895.7 676.9 277.9 208.8 3,631.8 3,489.5
2,154,9 2,104.4 918.2 699.6 284.6 216.9 3,731.9 3,604.4
56.6 55.3 21.6 17.4 9.8 7.6 207.8 202.128.6 25.0 10.9 7.9 1.3 0.7 43.8 39.461.3 64.8 20.6 20.0 6.6 6.4 13.6 16.0
7.2 9.7 2.7 3.0 1.0 1.1 9.4 10.95.3 11.4 4.0 5.4 1.5 1.3 11.2 24.63.0 1.7 2.2 1.0 0.8 0.5 4.9 3.1
162.0 167.9 62.0 54.7 21.0 17.6 290.7 296.123.9 (3.4) 73 (0.5) 2.3 (0.6) 106.4 (24.8)
0.1 0.2 0.1 - 0.1
186.0 164.5 69.5 54.3 23.3 17.0 397.2 271.3
2.1 1.7 0.8 0.6 0.2 0.1 3.0 2.4_
183.9 162.8 68.7 53.7 23.1 16.9 394.2 268.9
361.9 539.2 248.4 166.2 129.6 82.4 2,117.5 1,921.6906.5 757.2 390.4 238.0 48.0 27.4 1,439.5 1,184.8617.5 537.3 246.5 170.2 79.9 59.9 116.2 121.6138.9 146.2 39.4 46.2 19.8 17.0 177.5 182.5
28.9 56.2 6.8 34.7 10.1 9.1 47.9 90.625.0 54.2 38.4 1.4 13.5 30.6 45.8
2,278.7 2,090.3 959.7 693.7 2138.8 209.3 3,929.2 3,546.9

The following employees appearin the photographs:
From left to right
Front coverHelene &langer and Robert Coal lier,Managers, National Corporate Investments
Page 8Line Boisvert,Consulting Analyst, Chairman of the Boardand Chief Executive Officer's OfficeCaroline Verge,Economist, EconomicsRichard Lesage,Vice-President, Economics
Page 12Achille Desmarais,Analyst and Investment Manager,Canadian Stock MarketsYves Moquin,Vice-President, Asset MixSerge Beugre,Financial Analyst, Asset Mix
Page 18Ursule La Rocque,Internal Auditor, Internal AuditJacques Trudel,Analyst, Depositors' Affairs
Page 26Ernest Bastien,Assistant Vice-President, Bond InvestmentsAnne Quintal,Trader-Analyst, Money Market InvestmentsJennifer Gruner,Financial Analyst, Canadian Stock Markets
For information: (514) 842-3261
Should you wish to obtain an additionalcopy of this report, please contact theDirection des affaires publiques.
Ce rapport peut aussi ttre obtenu en françaissur demande.
Legal Deposit - 1992Biblioth0.que nationale du Quebec
ISBN 2-550-22762-XISSN 0835-2143
Design and production:Le Groupe Studio Bi
0 Printed on recycled paper


1981, AVENUE McG1LL COLLEGE
MONTREAL !QUEBEC) H3A 3C7
t 514I 842-3261 TELEX: 055-61874
TELECOPIER: 15141847-2498
•—