CAGNY 2018 - Investiscoca-cola-ir.prod-use1.investis.com/~/media/Files/C/Coca...Consumer-Centric...
32
Kathy Waller Chief Financial Officer CAGNY 2018 James Quincey President & CEO The fairlife® brand is owned by fairlife, LLC, our joint venture with Select Milk Producers, Inc., and fairlife’s products are distributed by our Company and certain of our bottling partners.
Transcript of CAGNY 2018 - Investiscoca-cola-ir.prod-use1.investis.com/~/media/Files/C/Coca...Consumer-Centric...

Kathy WallerChief Financial Officer
CAGNY 2018
James QuinceyPresident & CEO
The fairlife® brand is owned by fairlife, LLC, our joint venture with Select Milk Producers, Inc., and fairlife’s products are distributed by our Company and certain of our bottling partners.

The following presentation may include certain "non-GAAP financial measures" as defined in Regulation G under the Securities Exchange Act of 1934. A schedule which reconciles our results as
reported under Generally Accepted Accounting Principles and the non-GAAP financial measures included in the following presentation can be found here and is also posted on the Company's
website at www.coca-colacompany.com (in the “Investors” section).
This presentation may contain statements, estimates or projections that constitute “forward-looking statements” as defined under U.S. federal securities laws. Generally, the words “believe,” “expect,” “intend,”
“estimate,” “anticipate,” “project,” “will” and similar expressions identify forward-looking statements, which generally are not historical in nature. Forward-looking statements are subject to certain risks and
uncertainties that could cause actual results to differ materially from The Coca-Cola Company’s historical experience and our present expectations or projections. These risks include, but are not limited to, obesity
and other health-related concerns; water scarcity and poor quality; evolving consumer preferences; increased competition and capabilities in the marketplace; product safety and quality concerns; perceived
negative health consequences of certain ingredients, such as non-nutritive sweeteners and biotechnology-derived substances, and of other substances present in our beverage products or packaging materials; an
inability to be successful in our innovation activities; increased demand for food products and decreased agricultural productivity; changes in the retail landscape or the loss of key retail or foodservice customers; an
inability to expand operations in emerging and developing markets; fluctuations in foreign currency exchange rates; interest rate increases; an inability to maintain good relationships with our bottling partners; a
deterioration in our bottling partners' financial condition; increases in income tax rates, changes in income tax laws or unfavorable resolution of tax matters; increased or new indirect taxes in the United States and
throughout the world; increased cost, disruption of supply or shortage of energy or fuels; increased cost, disruption of supply or shortage of ingredients, other raw materials or packaging materials; changes in laws
and regulations relating to beverage containers and packaging; significant additional labeling or warning requirements or limitations on the marketing or sale of our products; an inability to protect our information
systems against service interruption, misappropriation of data or breaches of security; unfavorable general economic conditions in the United States; unfavorable economic and political conditions in international
markets; litigation or legal proceedings; failure to adequately protect, or disputes relating to, trademarks, formulae and other intellectual property rights; adverse weather conditions; climate change; damage to our
brand image and corporate reputation from negative publicity, even if unwarranted, related to product safety or quality, human and workplace rights, obesity or other issues; changes in, or failure to comply with, the
laws and regulations applicable to our products or our business operations; changes in accounting standards; an inability to achieve our overall long-term growth objectives; deterioration of global credit market
conditions; default by or failure of one or more of our counterparty financial institutions; an inability to renew collective bargaining agreements on satisfactory terms, or we or our bottling partners experience strikes,
work stoppages or labor unrest; future impairment charges; multi-employer pension plan withdrawal liabilities in the future; an inability to successfully integrate and manage our Company-owned or -controlled
bottling operations; an inability to successfully manage our refranchising activities; failure to realize the economic benefits from or an inability to successfully manage the possible negative consequences of our
productivity initiatives; failure to realize a significant portion of the anticipated benefits of our strategic relationship with Monster; inability to attract or retain a highly skilled workforce; global or regional catastrophic
events, including terrorist acts, cyber-strikes and radiological attacks; and other risks discussed in our Company’s filings with the Securities and Exchange Commission (SEC), including our Annual Report on Form
10-K for the year ended December 31, 2016, and our subsequently filed Quarterly Reports on Form 10-Q, which filings are available from the SEC. You should not place undue reliance on forward-looking
statements, which speak only as of the date they are made. The Coca-Cola Company undertakes no obligation to publicly update or revise any forward-looking statements.
RECONCILIATION TO U.S. GAAP FINANCIAL INFORMATION
FORWARD-LOOKING STATEMENTS
2

• Reaching the Inflection Point
• Positioned for Disciplined Growth
• Delivering Shareowner Value
3

Carrying Momentum into 2018
Value Share
Organic Revenue
Underlying Profit*
EPS**
3%
7 to 8%
(1) to (4)%
3%
9%
0%
* Comparable currency neutral income from continuing operations before income taxes (structurally adjusted) (non-GAAP)** Comparable EPS from continuing operations (non-GAAP)Note: Organic revenue is a non-GAAP financial measures.
DELIVERED AGAINST OUR 2017 GUIDANCE
4
✓
✓
✓
✓
Metric Guidance Actual

…with more to come
WE MOVED FAST IN 2017 TO IMPLEMENT CHANGE…
• Introduced Coca-Cola Zero Sugar
• Launched 500+ new products
• “Test and Learn” approach to the portfolio
• +3% FY17 price/mix
• Revenue Growth Management (RGM) acceleration
• Premium opportunity
• Deprioritizationof low-margin water
• U.S. refranchising completed
• Japan bottler merger
• Temporarily acquired controlling interest in CCBA
• China refranchising completed
• eCommerce acceleration
• Workday implementation
• SAP implementation work begins
• New Group Presidents
• New operating model
• Lean Center
• Updated incentive structure
Accelerate Growth of Leading
Consumer-Centric Brand Portfolio
Drive Revenue Growth Algorithm
Strengthen Our System’s
Value-Creation Advantage
Digitize the System – ‘Click’s Reach
of Desire’
Unlock the Power ofOur People
5

2014 2015 2016 2017 2018E
Operating Income* 6% 7% 10% 9% 8 to 9%
• FX Impact** (6)% (11)% (7)% (2)% (1) to 0%
• Structural Impact** (3)% (1)% (6)% (9)% (2)%
Comparable EPS (2)% (2)% (4)% 0% 8 to 10%
2018 WILL BE THE INFLECTION YEAR
6
Note: Comparable currency neutral operating income (structurally adjusted) and comparable EPS are non-GAAP measures. For 2014 - 2017, comparable EPS growth included a 1 point benefit from net share repurchases. For 2017 and 2018E, comparable EPS growth is for continuing operations.
* Comparable currency neutral operating income (structurally adjusted) (non-GAAP)** Impact to comparable operating income
CURRENCY AND STRUCTURAL HEADWINDS ABATING, UNDERLYING PERFORMANCE WILL NOW BE VISIBLE
$2.04 $2.00
$1.91 $1.91
Focus on what we can control
FX improving
Refranchising largely complete

• Reaching the Inflection Point
• Positioned for Disciplined Growth
• Delivering Shareowner Value
7

Consumer-Centric Portfolio
Best-In-Class Brand Builder
Pervasive Distribution
Geographic Diversity
World’s largest nonalcoholic beverage company
>20 Channels
200+ Markets
~250 Bottling Partners
16 Million Cold Drink Assets
27 Million Customer Outlets
21 Billion-Dollar Brands
Doubled since 2007
#1 Share Position in:
Total NARTD
Sparkling Soft Drinks
Juice, Dairy & Plant
Hydration
Tea & Coffee
2017 Operating Income Composition*
Europe, Middle East & Africa
North America
Asia Pacific
Latin America
BIG
* Comparable (non-GAAP), excluding corporate expense
STRONG FOUNDATION
8
Note: Based on 2016 estimated retail sales

Industry Retail Value Growth
2013-2016 CAGR
Industry Retail Value Growth
2017-2020
% Sales by Channel
Source: GlobalData for channel data. GlobalData and Euromonitor for historical industry retail value growth. Internal Estimates for future retail value growth.Note: Industry growth for nonalcoholic ready-to-drink excludes white milk and bulk water.
+$150B4% CAGR
0 50 100
HouseholdProducts
PackagedFood
NARTD
Modern
Traditional
Eating & Drinking Out
Strong Relative Growth Solid Growth ProspectsHighly Diversified
2.2%
3.8%
4.4%
HouseholdProducts
PackagedFood
NARTD
NONALCOHOLIC BEVERAGES IS A GREAT INDUSTRY
9
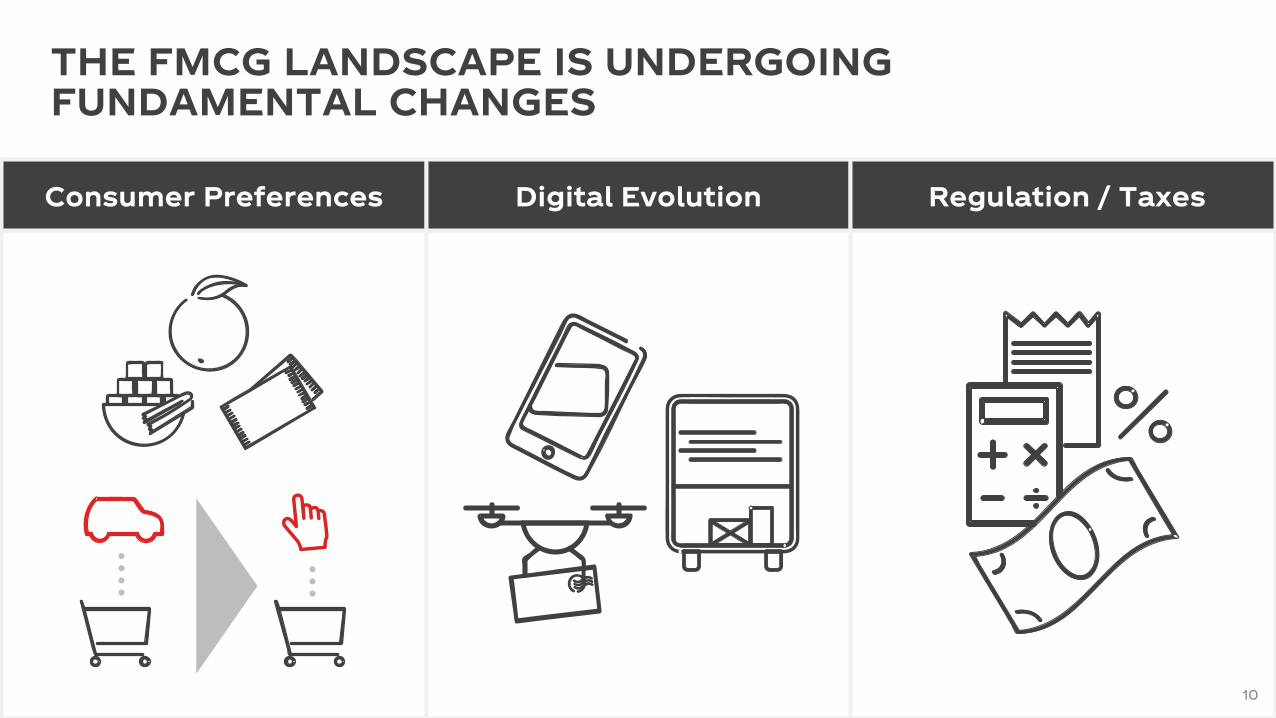
Consumer Preferences Digital Evolution Regulation / Taxes
THE FMCG LANDSCAPE IS UNDERGOING FUNDAMENTAL CHANGES
10

WE HAVE THE RIGHT STRATEGIES
Making the Right Choices and Investing for Growth
Accelerate Growth of Leading
Consumer-Centric Brand Portfolio
Drive Revenue Growth Algorithm
Strengthen Our System’s
Value-Creation Advantage
Digitize the System – ‘Click’s Reach
of Desire’
Unlock the Power ofOur People
11

Global Industry Retail Value Growth (2017-2020)$ Billions
We expect the industry to grow ~$150B by 2020 at a ~4% CAGR
KO Share2016
CAGR
$14
$16
$36
$36
$50
Tea & Coffee
Energy
SparklingSoft Drinks
Hydration
Juice, Dairy& Plant
4-5%
5-6%
3-4%
7-8%
3-4%
<10%
~15%
>50%
~15%*
~15%
*Energy brands are owned by Monster Beverage Corporation, in which TCCC has a minority investment.
WE SEE TREMENDOUS OPPORTUNITY TO BUILD QUALITY LEADERSHIP POSITIONS
12

TC
CC
Sy
ste
m O
pe
rati
ng
Ma
rgin
Leadership Ratio (TCCC Value Share vs. Nearest Competitor)
Market 32
QUALITY LEADERSHIP DRIVES MARGINS SYSTEM OPERATING MARGINS GREATER WITH HIGHER LEADERSHIP RATIO
Countries with LEADERSHIP RATIO higher than 1.5 deliver 2.3 times Operating Margin
Market 1
Source: GlobalData, Company Estimates; using logarithmic scale
1.5x
13
Dots represent markets

BUILDING QUALITY LEADERSHIP REQUIRES 3 DIFFERENT DISCIPLINES
– +
+
Brand Edge
Pro
fit
Po
ols
RISK
• Disrupt existing habits
• Scale / kill
• Learn as build
• Exploit the edge
• Obsessive segmentation
• Persistent investment
• Expand headroom for growth
• Capture value
• Nurture the edge
Disruptive
EXPLORER
Patient
CHALLENGER
Purposeful
LEADER
Entrepreneurial Audacity
Marathon Endurance
Wisdom & Courage
–
14

World-ClassInnovation
“Lift and Shift” –Scale Globally
Bolt-OnM&A
Accelerating growth in our consumer-centric portfolio
CLEAR PATH TO QUALITY LEADERSHIP
15

Leveraging the Power of Winning Brands
Creating Premium Experiences
Pursuing On-TrendNutrition
INNOVATION BY FOLLOWING CONSUMER TRENDS
16
Finely Crafted & Naturally Flavored
ACROSS OUR EXPANDING PORTFOLIO

MONSTER is a trademark and product of Monster Beverage Corporation, a partner of TCCC. AdeS expansion into Europe planned for 2018. CHI is a trademark of Tropical General Investments Limited, a minority investee of TCCC. Rani is a trademark owned by Aujan, a joint venture.
LIFT & SHIFT BEST IDEAS TO RAPIDLY SCALE GLOBALLY
17
®

MARGINVALUE
5xSince Acquisition
EBITDA
18
DRIVING VALUE THROUGH BOLT-ON M&AJUGOS DEL VALLE: THE POWER OF QUALITY LEADERSHIP
+750bps(2007 – 2017)
Present in Mexico & Brazil Present in all major markets in LatAm
17%10-year CAGR*
One brand… …a catalyst for growth outside of sparkling
Juice Dairy Plant Tea Prem. Juice
Note: Value multiple, EBITDA growth, and EBITDA margin expansion include brands acquired and/or launched under Jugos del Valle S.A. de C.V.* CAGR for 10-year period ending 2017
Leadership Ratio Greater
Than
1.5x

Entrepreneurial
Super Smoothies
Smoothies
Juice
Coconut Water
#1Chilled juice
brand in Europe
Bubbles
Kids
#1in Switzerland,U.K., Germany,
Austria
REVENUE
SuperJuice
Protein
2009
#1Smoothie
brand in U.K.
TODAY
3x
REPEATING THE PLAY WITH INNOCENT
19
ON THE JOURNEY FROM CHALLENGER TO LEADER
Entrepreneurial

Rebuilding Execution
Fundamentals for Quality Leadership
A WinningCulture
Volumeto ValueGrowth
System Refranchising for
Scale & Investment
Healthier Core Funds Aggressive Challenger /
Explorer Activity
RE-ENERGIZED SYSTEM ENGAGED FOR FUTURE GROWTH
20

Structure Compensation Culture
Lean, Efficient
Enterprise
Corporate Center
EnablingServices
Field
r e l e v a n t
V1.0, 2.0, 3.0
accountable
fast, 1.0, 2.0…
transparentvalue
creation
innovative
CURIOUS
INCLUSIVE“SMART” RISKS
EMPOWERED
new customer outlets
incentives
compensation
externally focused
performance
long-term
building
a t t e n t i o n
expansion
focus
attention
Support the Strategy
Updated Metrics
Market-Based Pay
M&A Lookback
TRANSFORMING THE CULTURE OF THE ORGANIZATION
21

• Total Beverage Company
• Accountable, Performance-Driven Growth Culture
• Brand-Focused Organization
• Asset-Light, High-Margin and High-Return Business
CLEAR DESTINATION
22

• Reaching the Inflection Point
• Positioned for Disciplined Growth
• Delivering Shareowner Value
23

• Increased earnings
• Disciplined capital spending
• Working capital efficiencies
• Disciplined approach for Leader, Challenger and Explorer
• Broaden portfolio through premium innovation and reapplication
• Enhanced pricing strategies
• Bolt-on M&A
• Stronger execution across global system
Revenue
• Portfolio choices
• Deliver outpaced productivity near-term
• Benefit from scale long-term
Operating Margin
• Increased earnings
• Capital-light organization
• Tax reform impact
Cash Flow &
Capital Structure
CLEAR GROWTH DRIVERS
24

2017 vs. 2015
WE HAVE MADE PROGRESS RETURNING TO OUR CORE
25
Net Revenues*
Operating Margin*
Operating Income*
Intangible Assets**
Net PP&E
Facilities
Key Drivers
• Refranchising activities reduced revenue and operating capital:
– North America
– China
– Germany
– Africa
• Underlying performance driving margin expansion
• Reduced complexity
* Comparable (non-GAAP)** Intangibles Assets is composed of Trademarks With Indefinite Lives, Bottlers' Franchise Rights With Indefinite Lives, Goodwill, and Other Intangible AssetsNote: Facilities include manufacturing, bottling and distribution.
$35.4B
27.4%
$9.7B
$16.6B
$8.2B
160
$(8.8)B
+400bps
$(0.7)B
$(7.5)B
$(4.4)B
~70% Reduction

* Comparable (non-GAAP)** Comparable currency neutral (non-GAAP); target is currency neutralized based on 2017 foreign currency exchange rates
27%
2017* AccountingChanges
Refranchising Underlying 2020Target**
34%+
• Refranchising bottling assets
• Driving profitability in sparkling
• Making disciplined portfolio choices
• Benefiting from scale long-term
• Delivering outpaced productivity near-term
DRIVING SIGNIFICANT MARGIN EXPANSION BY 2020
26
• Accounting changes resulting in margin compression due to reclass – no significant impact to profit before tax
More than offset by...
~(150)bps
~500bps
Operating Margin

Capital Expenditures($ Billion and % of Revenue)
Working Capital Initiatives
0
0.5
1
1.5
2
2.5
3
2015 2016 2017 2018E Long-TermExpectation
)
$2.6
4.5 to 5%$1.7
$2.3
$1.9
Digital productivity investments
• Extended payable terms, starting in Japan and United States
• Resulted in $1.5 billion in savings
• Looking at other markets around the world
REDUCING CAPITAL INTENSITY
27

Return On Invested Capital* Return Focused
2015 2016 2017 Long-Term
16.9%17.4%
19.0%
+50bps
+160bps
AS WE RETURN TO AN ASSET-LIGHT, HIGH-MARGIN AND HIGH-RETURN BUSINESS
• Focused on disciplined growth
• Driving margin expansion
• Leveraging our strengths in a capital-light model
RESULTING IN ACCELERATING RETURNS
28
* ROIC = NOPAT divided by two-year average of invested capital; ROIC is a non-GAAP measure
Note: 2015 and 2016 invested capital is calculated as follows: Total debt plus total equity minus total cash, cash equivalents and short-term investments minus marketable securities. 2017 invested capital is calculated as follows: Total debt plus total equity minus total cash, cash equivalents and short-term investments minus marketable securities minus net assets held for sale – discontinued operations

Consistent & Disciplined Capital Priorities Capital Structure Framework
Grow DividendContinue to grow dividend as a function of free cash flow, with 75% payout ratio over time
ReinvestInvestments within marketing, innovation, productivity, and capital expenditures
Net Share RepurchasesAt least offset dilution
M&AClear performance accountability & lookback
1
2
3
4
Balancing Financial Flexibility & Efficient Capital Structure
CAPITAL ALLOCATION PRIORITIES
29
Target2 to 2.5x Net Debt Leverage*
Current2.2x Net Debt Leverage*
*Non-GAAP

Carrying Momentum into 2018
Metric 2017 2018E
Organic Revenue*
Comparable EPS**
Cash from Operations
3%
0%
$7.0B
4%
8 to 10%
At Least
$8.5B
CONFIDENT IN OUR 2018 GUIDANCE
30
* Non-GAAP
** Comparable EPS from continuing operations (non-GAAP)

Long-Term Targets
4 to 6%
Organic Revenue Growth*
6 to 8%
Operating Income
Growth**
7 to 9%
EPS Growth**
90 to 95%
Adjusted Free Cash Flow Conversion
Ratio*
Global leader in growth industry
Strong foundation
Clear destination
New culture aligning for growth
Accelerating returns
Strengths
* Non-GAAP** Comparable currency neutral (non-GAAP)
ATTRACTIVE LONG-TERM INVESTMENT
31

Q&A