CAFR 15 Cover southport top - North...
7
State of North Carolina June 30, 2015 NONMAJOR ENTERPRISE FUNDS Enterprise funds are used to account for and report activities for which a fee is charged to external users for goods or services. The following activities are included in the nonmajor enterprise funds: Public School Insurance North Carolina State Fair USS North Carolina Battleship Commission Agricultural Farmers Market Workers’ Compensation Utilities Commission State Banking Commission ABC Commission Occupational Licensing Boards Departmental Funds 239
Transcript of CAFR 15 Cover southport top - North...

State of North Carolina June 30, 2015
NONMAJOR ENTERPRISE FUNDS
Enterprise funds are used to account for and report activities for which a fee is charged to external users for goods or services.
The following activities are included in the nonmajor enterprise funds:
Public School Insurance
North Carolina State Fair
USS North Carolina Battleship Commission
Agricultural Farmers Market
Workers’ Compensation
Utilities Commission
State Banking Commission
ABC Commission
Occupational Licensing Boards
Departmental Funds
239

State of North Carolina
COMBINING STATEMENT OF NET POSITION
NONMAJOR ENTERPRISE FUNDSJune 30, 2015
(Dollars in Thousands) North USS North
Public Carolina Carolina Agricultural
School State Battleship Farmers Workers' Utilities
Insurance Fair Commission Market Compensation Commission
Assets
Current Assets
Cash and cash equivalents........................... 20,465 $ 5,049 $ 4,997 $ 2,339 $ 12,059 $ 5,036 $
Investments.................................................. 76,655 — — — 12,159 —
Securities lending collateral........................... 8,759 — 171 — 2,003 224
Receivables:
Accounts receivable, net............................ — 338 340 5 — 15
Intergovernmental receivable..................... — — — — — —
Interest receivable...................................... 9 — — — 3 —
Premiums receivable................................. 2,417 — — — 338 —
Inventories.................................................... — 105 248 15 — 32
Prepaid items................................................ 2,691 — 171 — — —
Restricted cash and cash equivalents........... — — 180 — — —
Total current assets................................ 110,996 5,492 6,107 2,359 26,562 5,307
Noncurrent Assets
Investments.................................................. — — 1,545 — — —
Notes receivable........................................... — — — — — —
Prepaid items................................................ — — — — — —
Capital assets-nondepreciable...................... — 1,378 452 3,755 — —
Capital assets-depreciable, net..................... — 15,595 2,353 7,778 — 132
Total noncurrent assets........................... — 16,973 4,350 11,533 — 132
Total Assets............................................ 110,996 22,465 10,457 13,892 26,562 5,439
Deferred Outflows of Resources
Deferred outflows for pensions...................... 48 293 — 98 — 919
Liabilities
Current Liabilities
Accounts payable and accrued liabilities:
Accounts payable....................................... 14 205 88 48 — 37
Accrued payroll.......................................... — 18 48 3 — —
Intergovernmental payable......................... — — — — — —
Claims payable.......................................... 10,176 — — — 21,625 —
Obligations under securities lending.............. 8,759 — 171 — 2,003 224
Due to other funds........................................ 5 7 — 1 — 13
Unearned revenue........................................ 4,506 715 30 — 3,952 —
Deposits payable.......................................... — 21 — — — —
Notes payable............................................... — — — — — —
Compensated absences............................... 11 34 1 14 — 228
Total current liabilities............................. 23,471 1,000 338 66 27,580 502
Noncurrent Liabilities
Accounts payable.......................................... — — — — — —
Notes payable............................................... — — — — — —
Compensated absences............................... 88 370 135 156 — 1,386
Net pension liability....................................... 36 211 — 75 — 674
Total noncurrent liabilities....................... 124 581 135 231 — 2,060
Total Liabilities........................................ 23,595 1,581 473 297 27,580 2,562
Deferred Inflows of Resources
Deferred inflows for pensions........................ 132 760 — 270 — 2,434
Net Position
Net investment in capital assets....................... — 16,973 2,805 11,533 — 132
Restricted for:
Capital outlay................................................ — — 180 — — —
Other purposes............................................. — — — — — —
Unrestricted..................................................... 87,317 3,444 6,999 1,890 (1,018) 1,230
Total Net Position.................................... 87,317 $ 20,417 $ 9,984 $ 13,423 $ (1,018)$ 1,362 $
240

State of North Carolina
Exhibit D-1
Total
State Occupational Nonmajor
Banking ABC Licensing Departmental Enterprise
Commission Commission Boards Funds Funds
2,432 $ 4,092 $ 28,472 $ 5,147 $ 90,088 $
— — 12,962 — 101,776
— — 41 414 11,612
— 231 388 62 1,379
— 1,478 — — 1,478
— — 51 — 63
— — — — 2,755
— 3 26 140 569
— — 513 — 3,375
— — — — 180
2,432 5,804 42,453 5,763 213,275
— — 12,008 — 13,553
— — 157 — 157
— — 97 — 97
— 551 5,272 339 11,747
69 2,048 38,862 6,635 73,472
69 2,599 56,396 6,974 99,026
2,501 8,403 98,849 12,737 312,301
756 203 73 245 2,635
65 70 2,307 102 2,936
— — — 9 78
— — — 5 5
— — — — 31,801
— — 41 414 11,612
22 33 46 5 132
— — 22,433 75 31,711
— — — — 21
— — 998 — 998
184 28 582 54 1,136
271 131 26,407 664 80,430
— — 249 — 249
— — 16,943 — 16,943
1,115 280 1,178 400 5,108
563 1,657 845 178 4,239
1,678 1,937 19,215 578 26,539
1,949 2,068 45,622 1,242 106,969
2,032 6,104 3,112 643 15,487
69 2,599 26,193 6,974 67,278
— — — — 180
— — 1,076 — 1,076
(793) (2,165) 22,919 4,123 123,946
(724)$ 434 $ 50,188 $ 11,097 $ 192,480 $
241

State of North Carolina
COMBINING STATEMENT OF REVENUES, EXPENSES
AND CHANGES IN FUND NET POSITION
NONMAJOR ENTERPRISE FUNDSFor the Fiscal Year Ended June 30, 2015
(Dollars in Thousands)
North USS North
Public Carolina Carolina Agricultural
School State Battleship Farmers Workers' Utilities
Insurance Fair Commission Market Compensation Commission
Operating Revenues
Sales and services.............................................. — $ 276 $ 744 $ 48 $ — $ 8 $
Student tuition and fees, net................................ — — — — — —
Rental and lease earnings................................... — 5,523 245 985 — —
Fees, licenses, and fines..................................... — 9,185 2,068 1,968 — 16,159
Insurance premiums............................................ 12,645 — — — 5,996 —
Miscellaneous...................................................... — 1 13 — — 99
Total operating revenues.............................. 12,645 14,985 3,070 3,001 5,996 16,266
Operating Expenses
Personal services................................................ 572 5,956 1,553 1,392 — 12,304
Supplies and materials........................................ 2 1,232 118 158 — 196
Services............................................................... 59 5,229 830 705 1,340 593
Cost of goods sold............................................... — — 288 — — —
Depreciation........................................................ — 1,106 118 494 — 11
Claims.................................................................. 8,625 93 — — 7,472 —
Insurance and bonding........................................ 3,545 166 23 78 — 2
Other.................................................................... 2 1,168 184 27 — 826
Total operating expenses............................. 12,805 14,950 3,114 2,854 8,812 13,932
Operating income (loss)............................... (160) 35 (44) 147 (2,816) 2,334
Nonoperating Revenues (Expenses)
Noncapital grants................................................. — — — — — 466
Noncapital gifts, net............................................. — 904 289 — — —
Investment earnings............................................ 2,087 — 70 — 292 2
Interest and fees.................................................. — — — — — —
(Loss) on sale of equipment................................ — (25) — — — (40)
Miscellaneous...................................................... (12) 22 (1) — (3) 1
Total nonoperating
revenues (expenses).......................... 2,075 901 358 — 289 429
Income (loss) before contributions
and transfers........................................ 1,915 936 314 147 (2,527) 2,763
Capital contributions................................................ — 11,462 56 — — —
Transfers in............................................................. — — — — 6,420 —
Transfers out........................................................... — (515) — (43) — (282)
Change in net position.................................. 1,915 11,883 370 104 3,893 2,481
Net position — July 1, as restated.......................... 85,402 8,534 9,614 13,319 (4,911) (1,119)
Net position — June 30........................................... 87,317 $ 20,417 $ 9,984 $ 13,423 $ (1,018)$ 1,362 $
242

State of North Carolina
Exhibit D-2
Total
State Occupational Nonmajor
Banking ABC Licensing Departmental Enterprise
Commission Commission Boards Funds Funds
— $ 23 $ 526 $ 163 $ 1,788 $
— — 15 — 15
— — 29 1,484 8,266
13,377 15,633 49,158 3,502 111,050
— — — — 18,641
381 — 747 19 1,260
13,758 15,656 50,475 5,168 141,020
10,012 3,462 33,458 3,941 72,650
32 111 1,166 307 3,322
1,698 10,990 8,876 1,381 31,701
— — — 77 365
6 115 2,333 235 4,418
— — 371 — 16,561
2 17 107 116 4,056
704 237 2,080 336 5,564
12,454 14,932 48,391 6,393 138,637
1,304 724 2,084 (1,225) 2,383
— 20 — — 486
— — — 773 1,966
— — 584 34 3,069
— — (613) — (613)
— (8) (18) — (91)
— — (8) 11 10
— 12 (55) 818 4,827
1,304 736 2,029 (407) 7,210
— — — — 11,518
— — 60 508 6,988
(154) (18) — (47) (1,059)
1,150 718 2,089 54 24,657
(1,874) (284) 48,099 11,043 167,823
(724)$ 434 $ 50,188 $ 11,097 $ 192,480 $
243
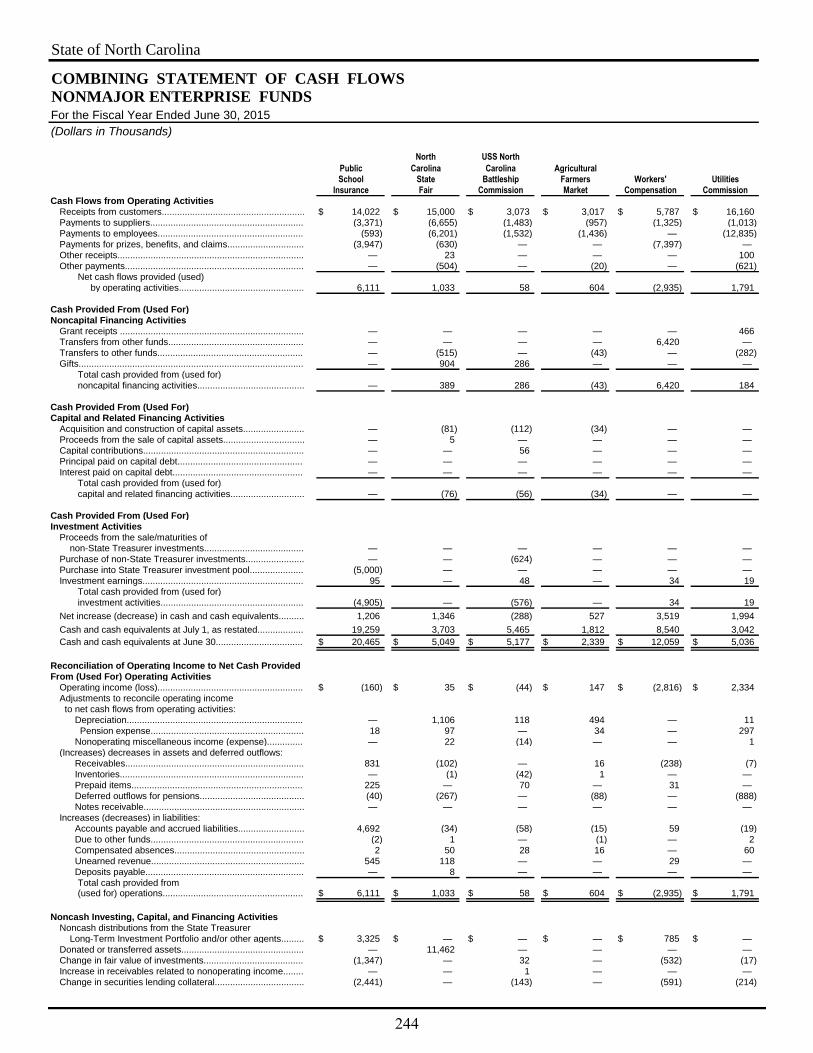
State of North Carolina
COMBINING STATEMENT OF CASH FLOWS
NONMAJOR ENTERPRISE FUNDSFor the Fiscal Year Ended June 30, 2015
(Dollars in Thousands)
North USS North
Public Carolina Carolina AgriculturalSchool State Battleship Farmers Workers' Utilities
Insurance Fair Commission Market Compensation CommissionCash Flows from Operating Activities
Receipts from customers........................................................ 14,022 $ 15,000 $ 3,073 $ 3,017 $ 5,787 $ 16,160 $ Payments to suppliers............................................................ (3,371) (6,655) (1,483) (957) (1,325) (1,013) Payments to employees......................................................... (593) (6,201) (1,532) (1,436) — (12,835) Payments for prizes, benefits, and claims.............................. (3,947) (630) — — (7,397) — Other receipts......................................................................... — 23 — — — 100 Other payments...................................................................... — (504) — (20) — (621)
Net cash flows provided (used) by operating activities................................................. 6,111 1,033 58 604 (2,935) 1,791
Cash Provided From (Used For)Noncapital Financing Activities
Grant receipts ........................................................................ — — — — — 466 Transfers from other funds..................................................... — — — — 6,420 — Transfers to other funds......................................................... — (515) — (43) — (282) Gifts........................................................................................ — 904 286 — — —
Total cash provided from (used for)noncapital financing activities.......................................... — 389 286 (43) 6,420 184
Cash Provided From (Used For)Capital and Related Financing Activities
Acquisition and construction of capital assets........................ — (81) (112) (34) — — Proceeds from the sale of capital assets................................ — 5 — — — — Capital contributions............................................................... — — 56 — — — Principal paid on capital debt................................................. — — — — — — Interest paid on capital debt................................................... — — — — — —
Total cash provided from (used for) capital and related financing activities............................. — (76) (56) (34) — —
Cash Provided From (Used For)Investment Activities
Proceeds from the sale/maturities of non-State Treasurer investments....................................... — — — — — —
Purchase of non-State Treasurer investments....................... — — (624) — — — Purchase into State Treasurer investment pool..................... (5,000) — — — — — Investment earnings............................................................... 95 — 48 — 34 19
Total cash provided from (used for) investment activities........................................................ (4,905) — (576) — 34 19
Net increase (decrease) in cash and cash equivalents.......... 1,206 1,346 (288) 527 3,519 1,994
Cash and cash equivalents at July 1, as restated.................. 19,259 3,703 5,465 1,812 8,540 3,042
Cash and cash equivalents at June 30.................................. 20,465 $ 5,049 $ 5,177 $ 2,339 $ 12,059 $ 5,036 $
Reconciliation of Operating Income to Net Cash Provided From (Used For) Operating Activities
Operating income (loss)......................................................... (160)$ 35 $ (44)$ 147 $ (2,816)$ 2,334 $ Adjustments to reconcile operating income to net cash flows from operating activities: Depreciation..................................................................... — 1,106 118 494 — 11 Pension expense............................................................ 18 97 — 34 — 297
Nonoperating miscellaneous income (expense).............. — 22 (14) — — 1 (Increases) decreases in assets and deferred outflows: Receivables...................................................................... 831 (102) — 16 (238) (7) Inventories........................................................................ — (1) (42) 1 — — Prepaid items................................................................... 225 — 70 — 31 — Deferred outflows for pensions......................................... (40) (267) — (88) — (888) Notes receivable............................................................... — — — — — — Increases (decreases) in liabilities: Accounts payable and accrued liabilities.......................... 4,692 (34) (58) (15) 59 (19) Due to other funds............................................................ (2) 1 — (1) — 2 Compensated absences................................................... 2 50 28 16 — 60 Unearned revenue............................................................ 545 118 — — 29 — Deposits payable.............................................................. — 8 — — — —
Total cash provided from(used for) operations....................................................... 6,111 $ 1,033 $ 58 $ 604 $ (2,935)$ 1,791 $
Noncash Investing, Capital, and Financing ActivitiesNoncash distributions from the State Treasurer Long-Term Investment Portfolio and/or other agents......... 3,325 $ — $ — $ — $ 785 $ — $ Donated or transferred assets................................................ — 11,462 — — — — Change in fair value of investments....................................... (1,347) — 32 — (532) (17) Increase in receivables related to nonoperating income........ — — 1 — — — Change in securities lending collateral................................... (2,441) — (143) — (591) (214)
244

State of North Carolina
Exhibit D-3
Total
State Occupational NonmajorBanking ABC Licensing Departmental Enterprise
Commission Commission Boards Funds Funds
13,377 $ 13,952 $ 50,646 $ 5,091 $ 140,125 $ (1,877) (11,076) (2,829) (2,031) (32,617)
(10,345) (2,965) (30,387) (4,044) (70,338) — — — (105) (12,079)
381 — 289 13 806 (537) (215) (12,459) (179) (14,535)
999 (304) 5,260 (1,255) 11,362
— 20 — — 486 — — 60 508 6,988
(154) (18) — (47) (1,059) — — — 773 1,963
(154) 2 60 1,234 8,378
— (7) (1,130) — (1,364) — — 23 — 28 — — — — 56 — — (1,774) — (1,774) — — (613) — (613)
— (7) (3,494) — (3,667)
— — 8,772 — 8,772
— — (9,085) — (9,709) — — — — (5,000) — — 368 23 587
— — 55 23 (5,350)
845 (309) 1,881 2 10,723
1,587 4,401 26,591 5,145 79,545
2,432 $ 4,092 $ 28,472 $ 5,147 $ 90,268 $
1,304 $ 724 $ 2,084 $ (1,225)$ 2,383 $
6 115 2,333 235 4,418 248 677 346 79 1,796
— — (8) 11 12
— (1,704) 66 (27) (1,165) — 13 54 (84) (59) — — (252) — 74
(730) (203) (73) (231) (2,520) — — 4 — 4
23 44 449 (22) 5,119 (1) 7 44 (1) 49
149 23 (99) 60 289 — — 312 (50) 954 — — — — 8
999 $ (304)$ 5,260 $ (1,255)$ 11,362 $
— $ — $ — $ — $ 4,110 $ (154) — — — 11,308
— — 119 11 (1,734) — — — — 1 — — (231) (106) (3,726)
245