Measuring the PMI Modeling Capability in CAD Systems: Report 2 ...
Upload
david-coombesCategory
view
221download
0description

USER CONSOLE DESIGN
Computer Aided Design
08MMC300
David Coombes
A575990

MMC300 – Computer Aided Design David Coombes – A575990
2
Objectives
The overall objective of the activities carried out, along with this accompanying report, was gain a practical
understanding when it comes to using a wide range of software across various design and manufacture
activities of a consumer product. This was completed through the medium of NX Unigraphics and
accompanying additional programs. This leads to a detailed understanding of the important issues
encountered.
Introduction
A control console for a treadmill training machine was chosen as the customer product for the purpose of this
project.
The report will detail the full process taken from initial design all the way to the rendering of the final product.
Firstly the report will concentrate on the design and the shape analysis included in the design. This will include
the analysis of the radii and the surfaces within the design and corrective measures taken as a result of the
analysis. Next the assembly will be assessed, giving details to how it took place and how any problems were
overcome. The next discussion will orientate around the obtaining of the CNC manufacturing information and
the analysis post process. This will be completed through ‘Vericut’, which simulated and verifies the
manufacturing data. The report will then look at how the model was ergonomically tested using a human
modeller from within NX. Finally the report will display the rendering images that can be achieved using NX.
In order to cover all the above sections, the report will be broken down into the following sections;
Design and Analysis
Manufacture Analysis
Ergonomic Analysis
Structural Analysis
Data Transfer
Design Illustration
Design Specification
1. Must fit and attach to the provided treadmill
2. Must have a flat bottomed surface
3. Must be a single casing and designed using freeform features in NX
4. Must include the following features
a. Speed Control
b. Incline Control
c. Start Control
d. Stop Control
e. Emergency Stop
f. Programme Selection
g. LCD Data Display
5. May also include optional extras such as heart rate monitor, drinks holder, ipod/mp3 connection etc
6. Should be aesthetically attractive and ergonomically sound.

MMC300 – Computer Aided Design David Coombes – A575990
3
Following the design specification, figure 1 shows the finished model.
Figure 1
The model has combined the stop and emergency stop buttons. Alongside this, the start button has been
combined with the select button within the programme selection controls.
Design and Shape Analysis
1. Demonstrate the casting is consistent and without small radii and/or unwanted inflections
2. Use the dace analysis tools to test the reflective aesthetics of the casing
The first stage in the design was to establish the basic shape; this was completed by using freeform features in
the sketching function of NX. The part was designed in two halves; initially the hand side was fully modelled
and then mirrored to produce the left hand side. This meant there was a need to ensure that the join between
the two parts was smooth, this involved ensuring the curved outer edge was perpendicular to the mirror line
(figure 2).
Figure 2

MMC300 – Computer Aided Design David Coombes – A575990
4
After the outer shape was perpendicular to the mirrored line, analysis of the curves was performed. This
involved creating combs on the curves; this gave a visual aid to show any areas where curves occurred that
didn’t flow or any areas where small radii occurred. Figure 3 shows an uneven curve and figure 4 shows the
same curve rectified.
Figure 3
Figure 4

MMC300 – Computer Aided Design David Coombes – A575990
5
Following this shape analysis, the first half was extruded and altered using freeform features. Initially a swept
was completed, this is a three dimensional curved surface applied to the component. For this to be completed,
two sketches need to be created, on different planes that dictate the shape of the curve (YC-ZC and XC-ZC
planes, i.e. perpendicular to each other). Figure 5 shows the two sketches, the sketch running away from the
mirror line needs to be perpendicular to vertical again, to ensure that when the components is mirrored there
are no inflections and the part has a smooth surface.
These two curves were then analysed in the same way as the curves which dictated the overall shape. These
two curves provided the swept shown in figures 6 and 7.
Figure 5
Figure 6

MMC300 – Computer Aided Design David Coombes – A575990
6
Analysis of the face was then completed, this entailed producing a rendered surface which gives a visual guide
to the radii on the surface and indicates any errors of form which may have been produced. Figure 8 shows
this analysis.
Alongside the image above, other methods of rendering the surface can produce methods of finding any issues
with the surface. Hedgehog method shown in figure 8 and contour lines method shown in figure 9
Figure 7
Figure 7

MMC300 – Computer Aided Design David Coombes – A575990
7
After this analysis, the reflections tool can be used to ensure there are no inflections are errors of form. The
model can be rotated with this rendered surface still applied, showing any problems. Different images can be
applied to the surface to aid this analysis, figure 10 shows this reflections tool in use.
Figure 8
Figure 9

MMC300 – Computer Aided Design David Coombes – A575990
8
Finally, section analysis tool provides curvature comb which indicates any uneven curves. Figure 11 shows the
swept with an uneven curve, this is corrected in figure 12.
Figure 10
Figure 11
MMC300 – Computer Aided Design David Coombes – A575990
9
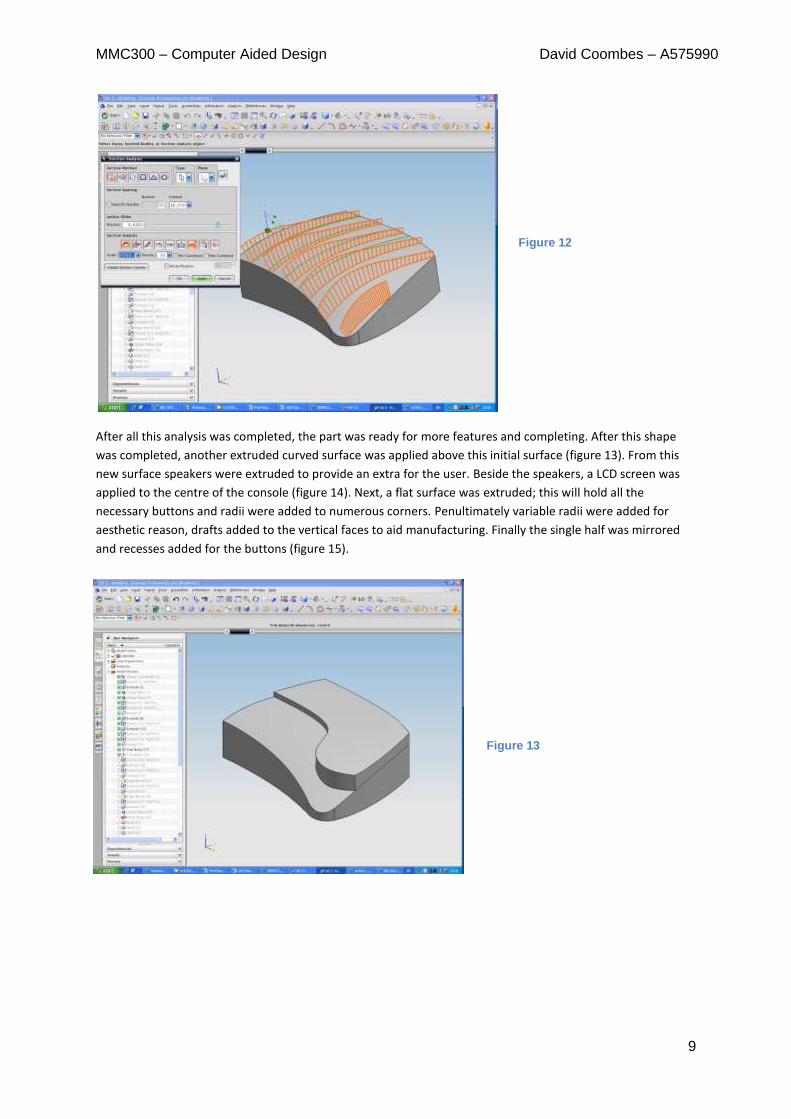
After all this analysis was completed, the part was ready for more features and completing. After this shape
was completed, another extruded curved surface was applied above this initial surface (figure 13). From this
new surface speakers were extruded to provide an extra for the user. Beside the speakers, a LCD screen was
applied to the centre of the console (figure 14). Next, a flat surface was extruded; this will hold all the
necessary buttons and radii were added to numerous corners. Penultimately variable radii were added for
aesthetic reason, drafts added to the vertical faces to aid manufacturing. Finally the single half was mirrored
and recesses added for the buttons (figure 15).
Figure 12
Figure 13

MMC300 – Computer Aided Design David Coombes – A575990
10
Once the basic model was created, assembly of the buttons took place. This involved modeling the buttons to
the exact size of the recess created and constraining them into the designated recesses.
Manufacturing Preparation
Once the design was completed, manufacturing processes need to be completed in order to verify the design.
Before any manufacturing can take place, there are numerous stages of preparation that needs to take place.
Actions that need to be completed include;
1. Use the casing design to generate a cavity for a mould tool
2. Adjust the cavity geometry to resolve any problem features
The first stage was to simplify the casing in order to produce the cavity. An over complex cavity would increase
manufacturing time and make the process too expensive and the product not economically viable. Then a
Figure 14
Figure 15

MMC300 – Computer Aided Design David Coombes – A575990
11
block is extruded around this simplified model, and the model subtracted from the block. This produces a
negative of the current mould (figure 16).
Then a blank is produced matching this cavity, this will act as the stock material that will be removed in order
to produce the cavity. This is changed to a different colour so it is easy to define between the part and stock
material. Also numerous parameters are set, such as; clearance planes, lower level, start and finish points.
Figure 17 shows the difference in colours and the parameters set up.
Figure 16
Figure 17

MMC300 – Computer Aided Design David Coombes – A575990
12
The next step was to ensure that no over small features were in the cavity, making it impossible to
manufacture. This was completed by another analysis tool. Figure 18 shows the analysis of the radii; it shows
that no radii are lower than 5mm which is suitable for manufacturing.
Manufacturing Data
Once all the analysis is completed, the next stage is to produce the manufacturing data.
1. Use appropriate machining methods using NX manufacturing to produce the cavity
2. Tool selection and assignment of speeds and feeds.
3. Process plan and shop floor documentation.
The first stage of this would be set up the tools. With the smallest radii being 5mm, the smallest tool would
need to mimic this radii, it was decided from here the other tool sizes would be 20mm diameter for semi
rough cut and a 30 mm diameter for all rough cuts. Figure 19 shows the set up of the tools and all parameters
that accompany them.
Figure 18
Figure 19

MMC300 – Computer Aided Design David Coombes – A575990
13
The first step was to produce an overall rough cut for the part. This was completed using a cavity mill
technique. Figure 20 shows the cutting path the tool will take when run.
Secondly, all steep walls were finished. This included 4 processes; the first was a semi cut for the walls in the x
direction, followed by a semi cut for the walls in the y direction. Then 2 finishing cuts were applied, one for
each set of walls on each the x and y axis. Figure 21 shows one of the finishing cuts. Alongside this, the cutting
paths were altered in the final cut, to ensure that no excess material was left. This was also ensured by
changing the stock levels left. In the rough cut, the process left 0.5mm of stock, the semi rough left 0.25mm of
stock and the finishing cut left 0mm of the stock.
The final step was to repeat the semi and final cut, but this time for non-steep walls; this included the floor.
Similar steps were taken to ensure all the stock was removed; this included changing the tool paths and
removing stock levels left. Figure 22 shows the final non steep wall pass.
Figure 20
Figure 21

MMC300 – Computer Aided Design David Coombes – A575990
14
After every process was set-up, it would be beneficial to group all processes that use the same tool together;
this would reduce the tool changes and directly reduce the production time. The meant that the rough cut was
followed by all semi rough cuts and the whole process was finished with all finishing cuts. Finally all the
processes can be generated and run simultaneously to produce the full manufacturing process. Figures 23 to
29 show the results after each process.
Figure 22
Figure 23
Figure 24

MMC300 – Computer Aided Design David Coombes – A575990
15
Figure 25
Figure 26
Figure 27

MMC300 – Computer Aided Design David Coombes – A575990
16
Once this was completed, it was a case of adjusting all speed and spindle rates. For this the table below gave
all the information required. All rough cuts were completed with a 30mm cutter, all semi cuts with a 20mm
and all finish cuts with a 10 mm cutter.
Table 1
Figure 28
Figure 29

MMC300 – Computer Aided Design David Coombes – A575990
17
Verification of Manufacturing Data
After the process was completed within the NX program, an add-on program was used to verify the entire
process, “Vericut”. This program allows for accurate verification, as well as highlighting any errors within the
manufacturing.
1. Use Vericut to verify the CNC data
2. Compare machined model with the design model
3. Measure data on machining time and metal removed.
The CNC data was imported into “Vericut” and the process was run. This gave a real 3D of the process taking
place. Table 2 shows progressive images of the “Vericut” simulation. Once completed it was easy to see where,
if any problem occur. Figure 30 shows that the manufacturing had zero errors.
Rough Cut
Semi Rough Steep 1
Semi Steep 2
Semi Non-Steep
Finishing Steep 1

MMC300 – Computer Aided Design David Coombes – A575990
18
Table 2
This figure also shows that the process took 2239 seconds, almost 40 minutes. Initially there were two errors
within the process, by consulting the log it was easy to identify the errors and correct them. Both the initial
errors occurred when the semi cut on the steep walls initiated. The tool came in at sharp an angle, this was
corrected within NX and the result was the figure shown above. After all errors are removed, it is possible to
compare volumes between the produced part and the pattern. Figure 31 shows the difference between the
two parts, as nothing is visible on the screen, there is no difference between the two parts (to 0.05mm, which
is what the tolerance is set to).
Finishing Steep 2
Finishing Non-Steep
Figure 30

MMC300 – Computer Aided Design David Coombes – A575990
19
Ergonomic Analysis
With this being a consumer product, and directly used by the user. It is vital that all parts are accessible during
use. This was verified by inserting a human model into NX and showing the reach zone of different sized users.
The ergonomic testing included;
1. Add a human model to the treadmill assembly
2. Set an appropriate posture
3. Evaluate the hand reach conditions for the console for a selection of different body types
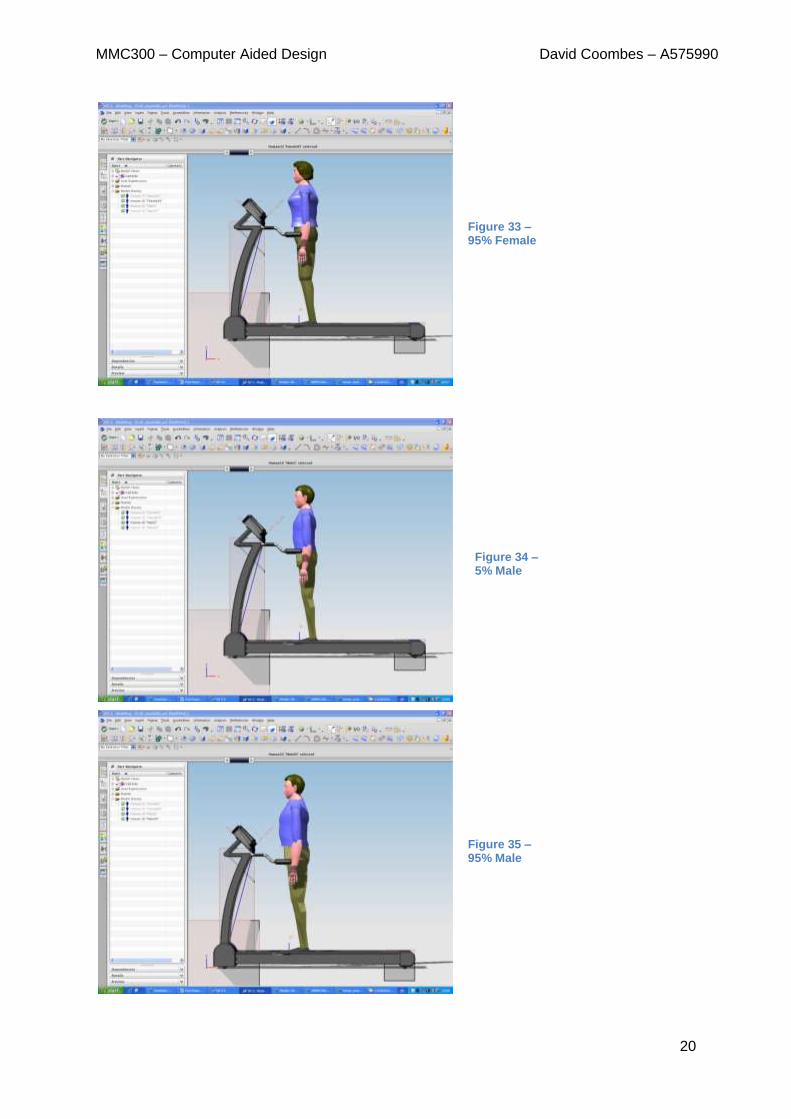
For this analysis, four models were used. A male at the 5th
percentile, one at the 95th
percentile and two
females using the same percentiles. Figures 32 to 35 show their natural stance.
Figure 31
Figure 32 – 5% Female
MMC300 – Computer Aided Design David Coombes – A575990
20
Figure 33 – 95% Female
Figure 34 – 5% Male
Figure 35 – 95% Male

MMC300 – Computer Aided Design David Coombes – A575990
21
This shows the users in their neutral stance on the machine. Figure 36 shows the reach zone for the smallest
user (5% female). This shows that all areas of the console are accessible to this user, and thus, all users while
not using the equipment.
When using the equipment, the user may move away from the console down the treadmill. This movement
may make the console inaccessible. This combined with a different posture for running may make it
considerably harder to access the console controls. Figures 37 to 40 show the reach zone for four models
whilst using the treadmill.
Figure 36
Figure 37 – 5% Female

MMC300 – Computer Aided Design David Coombes – A575990
22
Figure 38 – 95% Female
Figure 39 – 5% Male
Figure 40 – 95% Male

MMC300 – Computer Aided Design David Coombes – A575990
23
The four figures above show, that whilst running, all the console controls are fully accessible.
Design Stress Analysis
The next stage was to complete stress analysis on the part. This involved launching the wizard within NX to
produce numerous results regarding stress, yield stress and displacement. The stress analysis involved;
1. Using NX structures assess the handle structure for the default maximum loading given the
appropriate BS.
2. Select a material and tube diameter which will perform satisfactorily with the given maximum load.
The British Standard regarding the strength of treadmill handle dictates that the handrails/front handle bar
must withstand a force of 1000N vertically at the most onerous point without failure or permanent
deformation. This should also be completed using a horizontal force of 500N at the same point, again
producing no permanent deformation and resulting in no failure. Images 41 and 42 show the displacement and
the stresses imparted onto the handles.
Figure 42
Figure 41

MMC300 – Computer Aided Design David Coombes – A575990
24
Figure 41 shows the displacement of the handles. This image shows a maximum displacement of 19.05mm. As
figure 42 shows, the stresses on the handles with this vertical force exceed the yield stress of the material; this
will result in permanent deformation of failure. The yield stress of the material is 241.6MPa; the maximum
stress that occurs within the handles is 247.2MPa. This means that the handles do not conform to BS when
receiving load in the vertical direction. The same horizontal analysis is shown in figures 43 and 44.
Figure 43 shows the maximum displacement of 5.73mm, when 500N are exerted horizontally on the handles.
The second image (figure 44) shows that the yield stress is not reached when this horizontal force is applied. A
maximum of 117.4MPa is reached. The horizontal loading conforms to the BS. With the handles failing under
vertical loading, design alterations need to take place in order for the treadmill to conform to BS. The handles
need to be made stronger in order for them to abide by British Standards regulations. The diameter of the
tube was increased from 25mm to 35mm to try and improve the strength of the handles. The same vertical
analysis was completed on these stronger handles and the results are shown below.
Figure 44
Figure 43

MMC300 – Computer Aided Design David Coombes – A575990
25
Figure 45 shows that maximum displacement has been reduced from 19.05mm to 4.71mm. The second image
is where the main improvements in strength lie. This shows that the yield stress is again 241.6MPa, but this
time the maximum stress that the handle undergoes is 85.18MPa. This results, in no failure and zero
deformation, meaning it fits within the BS regulations.
Data Transfer
Data transfer between CAD systems is extremely relevant in the industry today. There is a need to transfer
CAD model between companies, these companies may not be using the same software, and this can cause
numerous problems. From personal experience it is imperative that this transfer of information is completed
as it vital to the success of the project and hence product.
The following images (figures 47 to 54) show the reflective shape analysis applied to the data transferred and
how it compares between software; the software is shown below each figure. Alongside this a small amount of
analysis of the part has been completed below each diagram.
Figure 45
Figure 46

MMC300 – Computer Aided Design David Coombes – A575990
26
Parasolid file import. This model was imported easily and provided an editable model, as the figure above
show it gave a surface finish to model also. The volume for this model was 226722.671119592mm2.
IGES file import. Again the surface finish on this file import was relatively good. The difference came in editing
the model. Once the part was imported, the parts list becomes two bodies once the sew faces are selected.
The volume for this part was 226667.586108155mm2
Figure 47
Figure 48

MMC300 – Computer Aided Design David Coombes – A575990
27
STEP file import. This created a model that could not be edited as the part list for this model was under one
body. Despite this the surface is good again and the volume is 226753.792005957mm2
JT file import. This produced a part with good surface finish, but with numerous other problems. There were
no parts in the part navigator to edit and it was impossible to determine volume. This makes this model only
suitable for a visual representation and with it impossible to select edges it cannot be added to an assembly
and constrained.
Figure 49
Figure 50

MMC300 – Computer Aided Design David Coombes – A575990
28
VRML file import. This import produces a model which has 80 topologies and 10892 facets, this large number
of facets produces a poor surface finish as it comprises of numerous small flat surfaces. This part is also un-
editable and provides no information regarding volume.
Catia file import. This file is imported in the form of one large body. This body is shown in the parts list but
cannot be edited. The volume for this model is 226575.542480758mm2
Figure 51
Figure 52

MMC300 – Computer Aided Design David Coombes – A575990
29
Solid Edge file import. This imported model has a good surface finish but is under one body and can’t be edited.
The volume analysis for this shows 226722.6686mm2
STL file import. This produces one topology with 14126 facets. This large number of facets led to a poor
surface finish. There are no parts within the parts navigator making it unable to be edited and the volume
cannot be found.
There are issues that arise from data transfer; the main one being that is very difficult to keep the model up to
date. From personal experience I encountered models, from a third party, that were months out of date. This
is where metadata management comes in to allow better life cycle management of a product.
Design Illustration
The final stage of this project was to produce rendered images that can give an accurate visual representation
of the product in working conditions. Within the visualize shape tool, there are many variable which can be
Figure 53
Figure 54

MMC300 – Computer Aided Design David Coombes – A575990
30
altered. These include: materials for the part, colors, lighting, backgrounds, reflections, shadows and sceneries.
The images below show the rendered console with some of these variables changed.
Figure 55
Figure 56

MMC300 – Computer Aided Design David Coombes – A575990
31
Figure 58
Figure 57
Figure 59

MMC300 – Computer Aided Design David Coombes – A575990
32
Conclusion
This project has shown that are numerous relevant issues when designing a user based product. The analysis
has shown that there are a number of relevant issues within the activities that have been carried out through
the project work applied to the treadmill console design that are naturally transferable to industry. The initial
modelling analysis shows and flaws in the design and problems that may be encountered later on can be
captured here and rectified before the process continues further. The manufacturing stage can give
organisations an idea of the time scale needed to produce the product and will also highlight any problems
that may be encountered during the production. The strength and ergonomic analysis should take place before
the manufacturing stage ideally. This would mean that any fundamental problems within the design can be
rectified before manufacturing simulation is completed. The strength analysis will hopefully eradicate any
problems the product may encounter while in use and the ergonomic analysis will capture any fundamental
design flaws while in use. The rendering is for purely aesthetic purposes but could be used heavily within the
marketing of the product. For each there are advantages and drawbacks; it is evident that it is impossible to
cater for the needs of everybody when creating software for such applications, what is important is that the
tools enable improvements to design activities which in turn allow more accurate cost effective manufacture
to take place, which is the aim of all companies in industry.
Figure 60