Cable Bolt Optimisation at Mine Bousquet-paper
25
BARRICK BOUSQUET CABLE BOLT OPTIMISATION AT MINE BOUSQUET Paul Gauthier Chief Engineer Mines Bousquet Presented at 15 th AMQ Ground Control Colloque March 2000 (Translated by J. Nantel)
-
Upload
kevin-marroquin -
Category
Documents
-
view
40 -
download
1
Transcript of Cable Bolt Optimisation at Mine Bousquet-paper
BARRICK BOUSQUET
CABLE BOLT OPTIMISATION
AT
MINE BOUSQUET
Paul Gauthier Chief Engineer Mines Bousquet
Presented at 15th AMQ Ground Control Colloque
March 2000
(Translated by J. Nantel)

ABSTRACT Ground support with cable bolts at mine Bousquet represents an important part of production costs. Cable bolt pattern optimization becomes essential in an effort to reduce costs without lowering personnel safety and increasing dilution in stopes. With instrumented cable bolts, it now possible to measure the loads taken by cables and to determine the optimum cable bolting pattern. This presentation is a summary of work done at Bousquet No.2 to optimize the cable bolts in the stopes of Zone 3-1. 1. INTRODUCTION The stability of stopes at mine Bousquet No.2 is a constant concern. The dynamic nature of the mining process, accompanied by a high stress level, means that ground control using cemented cable bolts plays an essential role. The underground operators and technical services would like to know the answers to the following questions:
1. Is the cable bolting pattern adequate? 2. Are we using the right length of cables? 3. Are the cables doing the intended work?
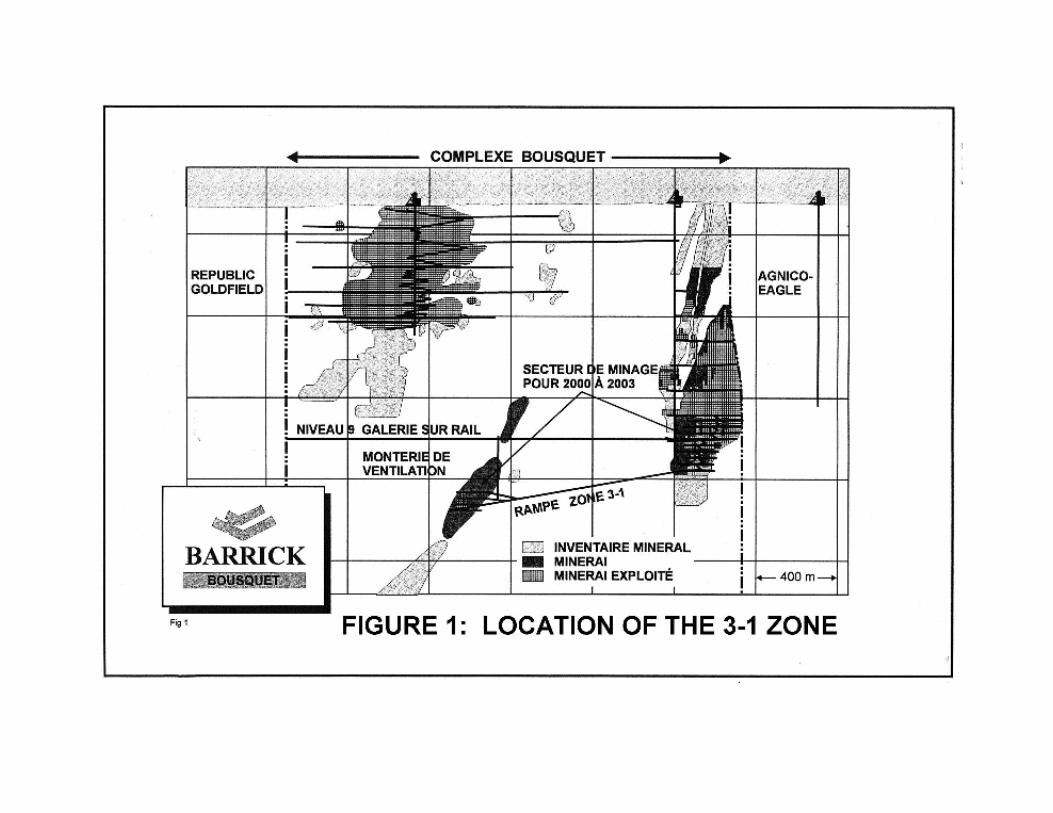
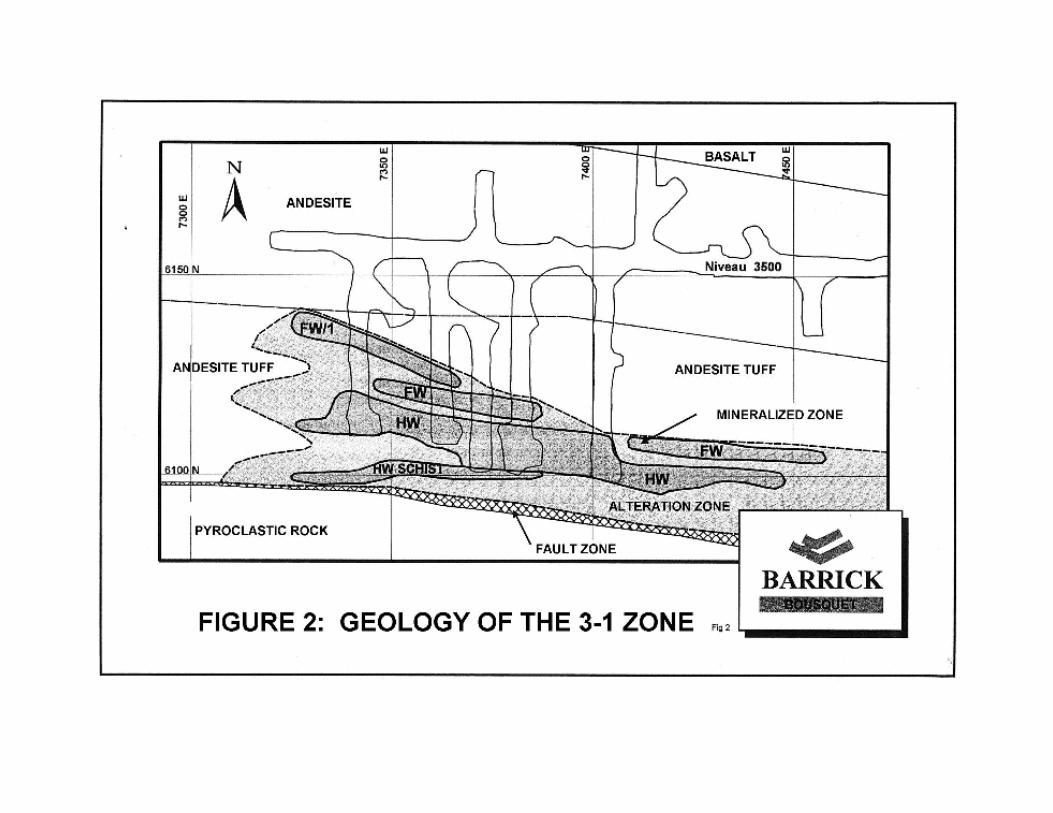
Recent technological improvements make it possible to answer many of these questions. For example, the introduction of SMART cables to the mining market, allows for the measurement of loads on cables. This presentation is a summary of tests done at mine Bousquet No.2 before the implementation of smart cables in the No. 3-1 mining zone. 2. GEOLOGY OF No. 3-1 ZONE No. 3-1 Zone is located between Bousquet 1 and 2 at a depth of 1500 m below surface. The 1.2 km access ramp was started in 1987 and the first stope was mined at the beginning of 1990. Figure 1 shows the location of this zone. The zone is comprised of four parallel mineralized lenses, the most important of which is 120 m long, 350 m high and has a thickness varying between 3 and 12 m. Its orientation is N95° with a dip of 85° to the south and a rake of 65° to the west. The zone contains 750,000 tonnes with a grade of 8.5 g/tonne. Mineralization is within a highly serecitized andesitic tuff. The zone is made up of between 5 and 15% disseminated pyrite with veinlets of pyrite and chalcopyrite ranging from 1 to 5 cm in thickness. The hanging wall contains a fault zone 3 to 5 m thick. The footwall is composed of a series of mafic rocks varying from basalt to andesite. The ramp and main access drifts are driven in these footwall rock formations.

3. GROUND SUPPORT PATTERN The ground support pattern in Zone 3-1 was based on the pattern used in the Main Zone at mine Bousquet, where good results had been obtained in the past. The question raised was: is the pattern overdone given a 10 m stope width? To help evaluate the load assumed by the secondary support, we have used “SMART Cable technology”. This work was done in collaboration with Mine Design Technologies of Kingston, Ontario. In the following chapters, the original primary and secondary ground control will be described, followed by a description of the support optimization based on the results of in-situ testing. At mine Bousquet, ground control in the stopes is accomplished in two stages. The first stage of support, the primary support, is installed by development crews; the second stage of support installation is performed by cable bolting crews.
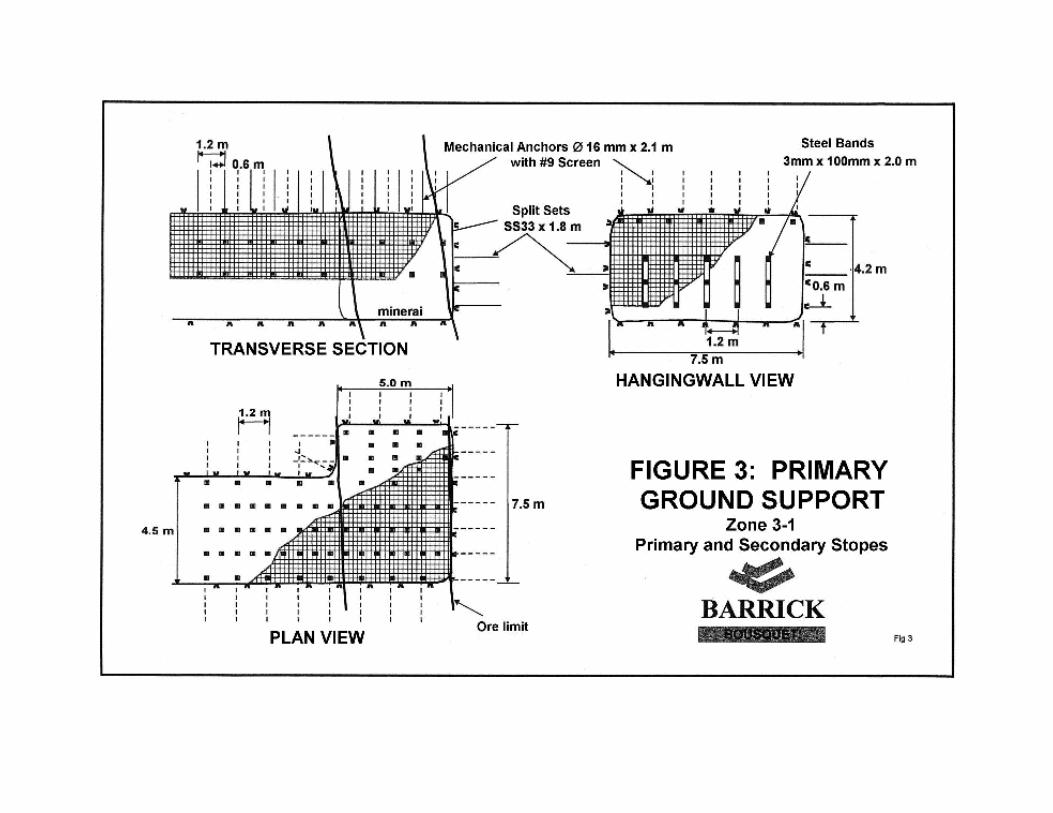
3.1 Primary support
The primary support in stopes can be described as follows:
Back: #9 - 100 by 100 mm steel wire mesh, and 2.1 m anchor bolts on a staggered pattern of 5 – 3 – 5, etc
South wall ( top level): #9 – 100 by 100 mm steel wire mesh with 1.8 m split sets and vertical straps on a 1.2 by 1.2 m pattern 0.6 m from the floor
East and west walls: #9 – 100 by 100 mm steel wire mesh with 1.8 split sets on a 1.2 by 1.2 m pattern down to 2 m from floor
Figure 3 shows the primary ground support for transverse stopes.
3.2 Secondary support with cable bolts
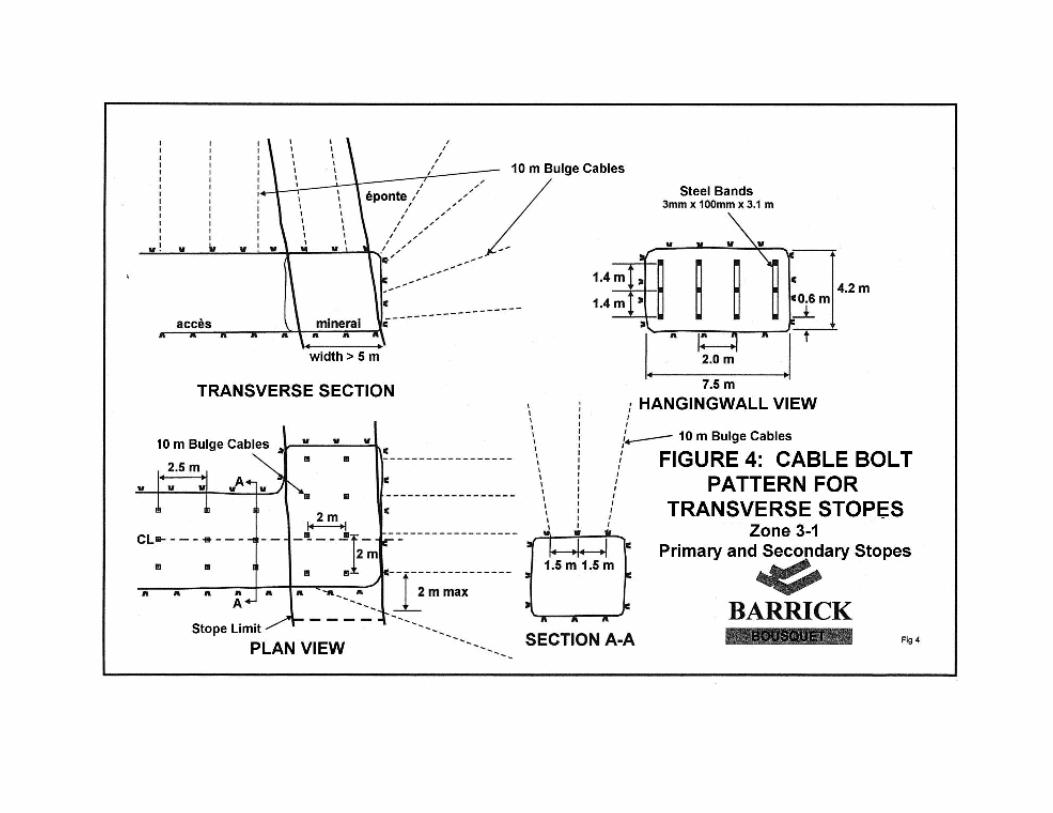
Secondary support in primary and secondary stopes is used to prevent ground mass displacements. All cables are of the “Garford” type and only one cable is installed per borehole. The cable bolt patterns in primary and secondary stopes can be described as follows:
Back: Single cables 10 m long on a 2 by 2 m pattern
Top sill: Rows of 4 cables each, 10 m long with a fan at a 2 m spacing
Lower sill: Rows of 5 - 10 m cables in the hanging wall. In primary stopes the holes are drilled from the drawpoints
Brow: 3 rows of 3 - 10 m cables 2.5 m apart Figure 4 shows the cable bolting arrangements for primary and secondary stopes.
4. INSTRUMENTATION PROJECT The instrumentation project was conducted in two phases: the first phase dealt with the instrumentation of a primary stope; the second phase looked at instrumenting a secondary stope. The objective of the project was to measure the loads in cable bolts as per the support arrangements described in Sections 3.1 and 3.2, with the following goals in mind:
• to better understand the stress distribution during the primary mining cycle,
• to adjust the cable bolting pattern in the stopes,
• to adjust the lengths of the cable bolts,
• to analyze the cables installed in the brows, and
• to evaluate the benefits of installing plates on cable bolts.
4.1 TESTS IN THE PRIMARY STOPE
4.1.1 Instrumentation
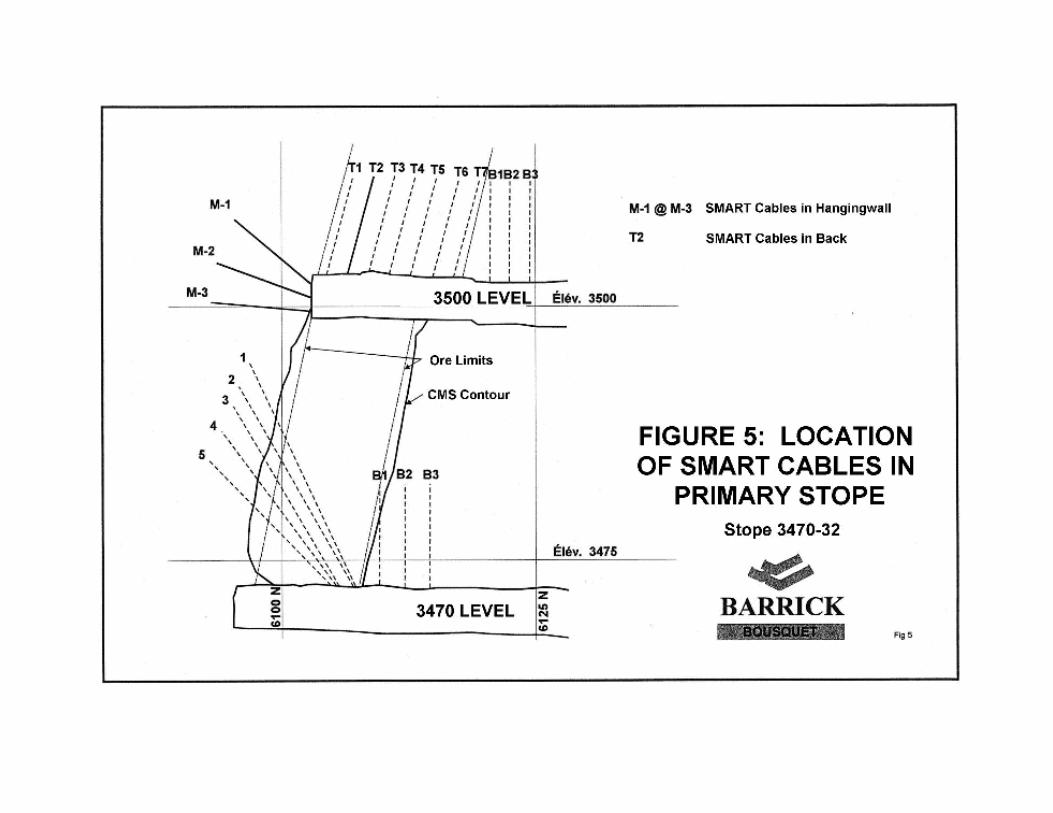
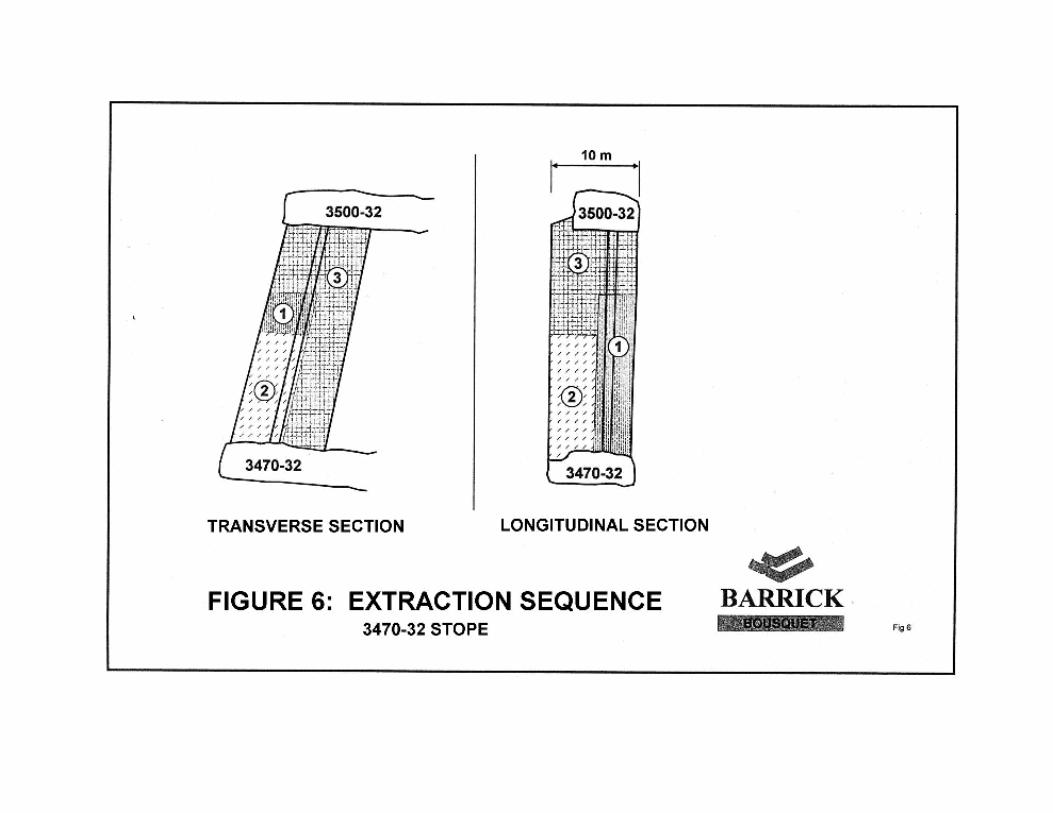
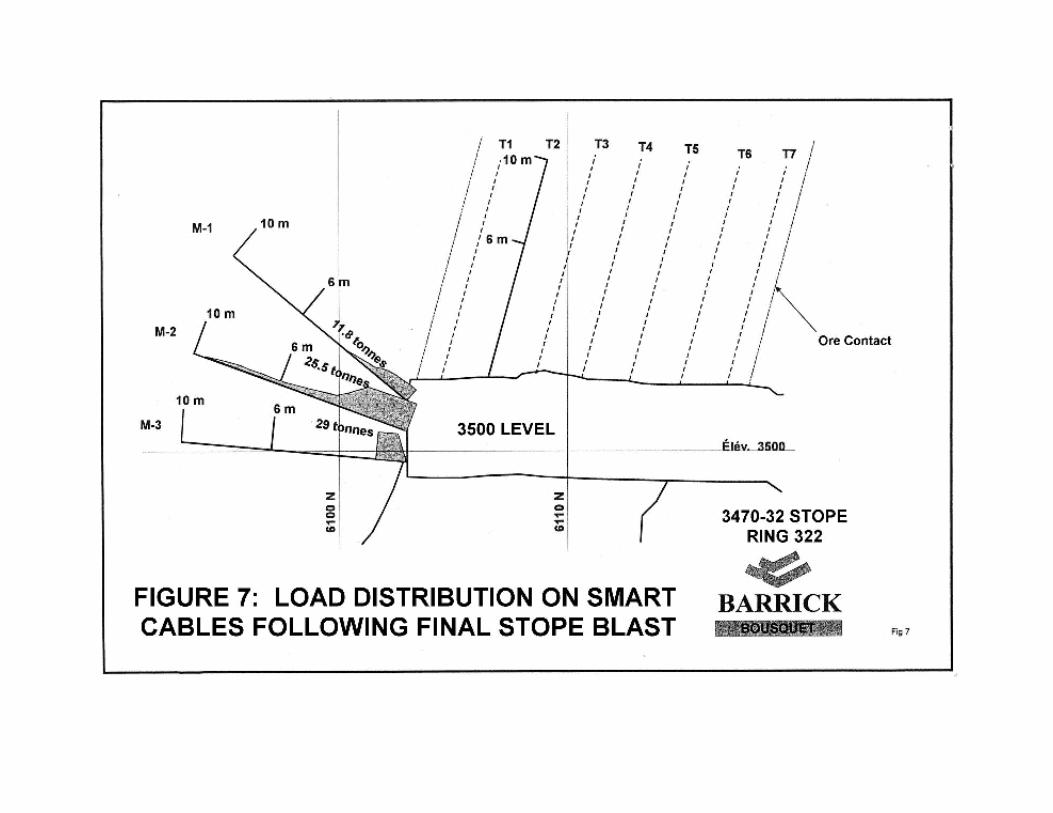
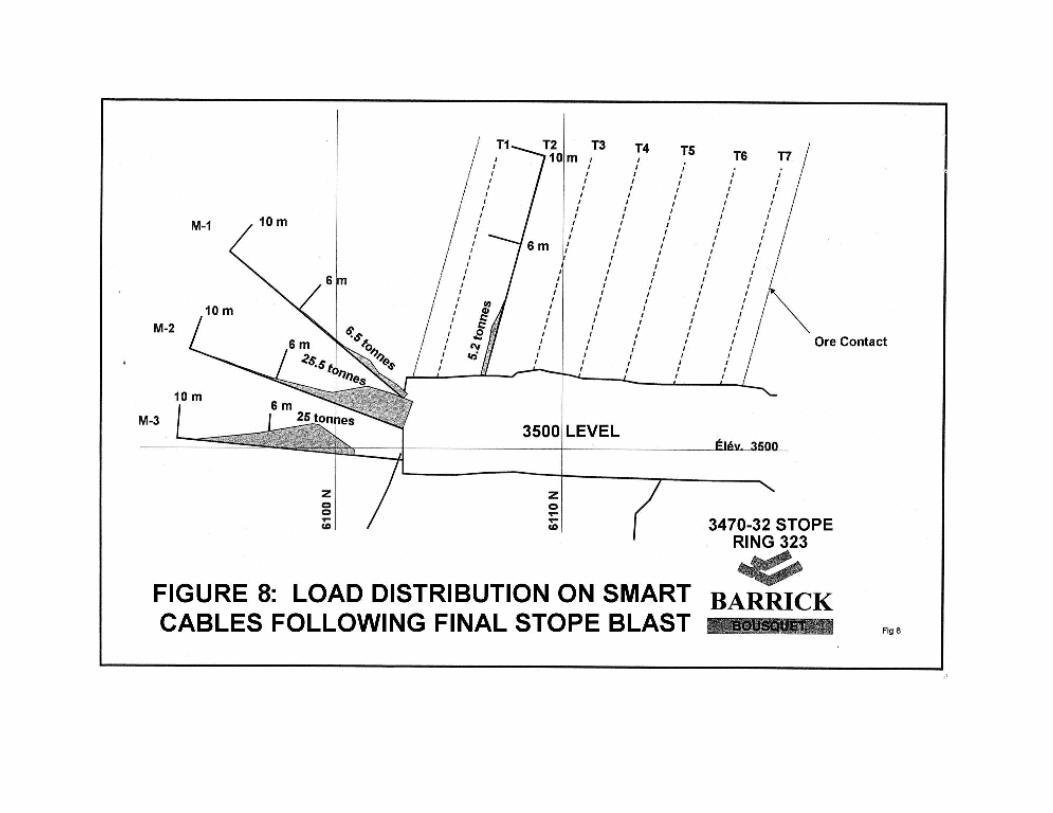
The first instrumentation phase took place in primary stope 3470-32. This stope is 10 m wide, 8 m thick and 30 m high, and containing 8000 tonnes of ore. A total of 8 SMART Cables and 1 SMART Multi-Point Borehole Extensometer (MPBX) were installed in the stope. Six of the SMART cables were installed in the wall of the top sill, and two were installed in the back. The MPBX was also installed in the stope back. All of the lead wires from the instruments were covered with PVC pipe and shotcrete, and were connected to the mine monitoring system. Figure 5 illustrates a section of the instrumented stope. The stope was mined in three blasts. During the first two blasts, the cables did not indicate any loads. The majority of movement was registered after the final blast. Figure 6 shows the blasting sequence of Stope 3470-32; Figures 7 and 8 illustrate the loads on wall and back cables. Based on the measurements taken during the stope extraction, the following conclusions were made:
Back: • One SMART Cable registered only 5.2 tonnes at a distance of 2.1 m, • One SMART Cable showed a greater then normal elongation, indicating a
poor installation (poor grout quality).
Top Sill: • The loads measured in the SMART cables indicate that the cable bolts offer adequate ground support.
• Considering that no significant load was measured beyond 6 m; the cable bolt lengths can be cut from 10 to 6 m.
• It will be necessary to reorient the cable bolts to afford a better solution for convergence.
• No difference was noticed between plated and unplated cable bolts. • Cables M2 and M3 were over stretched, indicating that it would be
preferable to install 2 cables per hole instead of one.
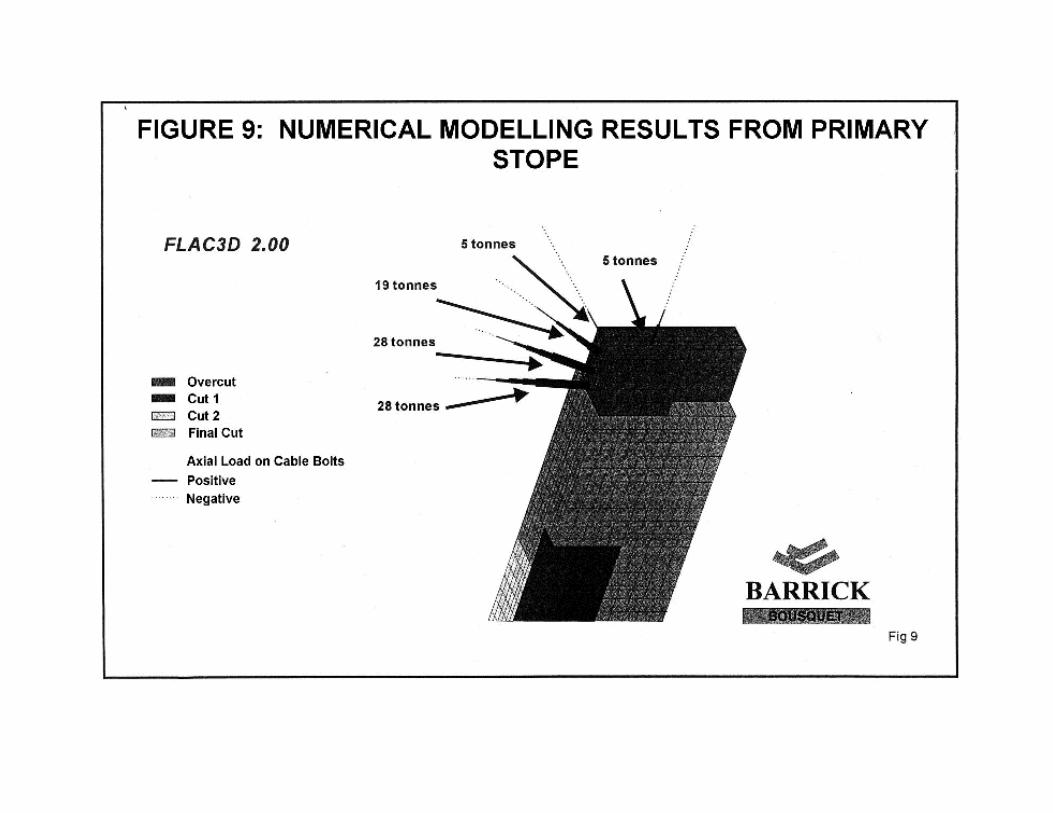
For Stope 3470-32, it was demonstrated that cables installed in the back were not required and therefore could be eliminated. However, for larger top sill openings, it would be advisable to evaluate the stopes using numerical modeling before proceeding with the final design. 4.1.2 Numerical Modeling for Primary Stopes The results obtained from the in-situ tests were used to calibrate the FLAC 3D numerical model. Simulations were made using various sizes of stope openings. We also had some doubts concerning the effectiveness of the cables installed in the hanging wall to reduce sloughing. It was possible to verify the effectiveness of these cables based on the data obtained from a study on the cable behavior in the Main lens B-2. From the numerical analysis made, the following conclusions can be made:
Back: • For stopes less than 10 m wide, no cables in the back are required. • The length of the primary support installed during mine
development can be shortened from 2.7m to 2.1m.
Top sill: • The modeling results confirm the lengths of cables can be shortened to 6 m.
Hanging wall: • For an RQD lower than 20%, it is not necessary to install long
cables. Too great a wall movement can rupture these cables and therefore negates their installation.
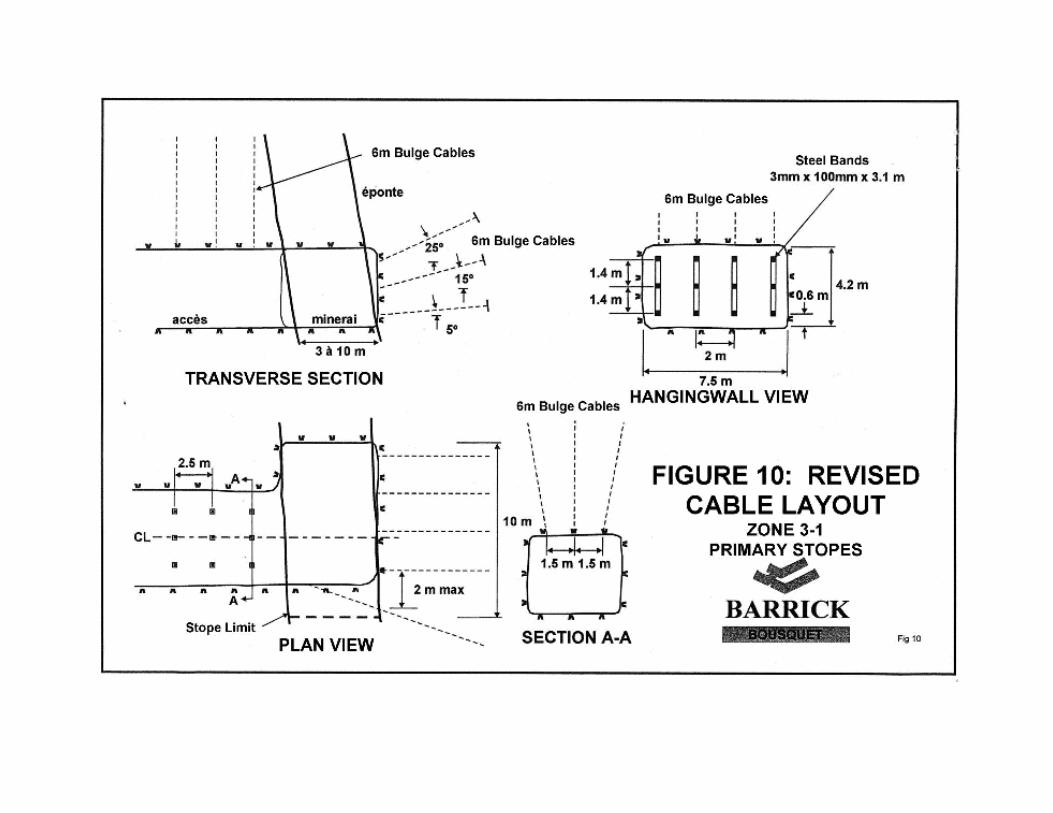
The results of the FLAC 3D analyses are shown in Figure 9. 4.1.3 New Cable Bolting Pattern for Primary Stopes The new cable bolting patterns for primary stopes can be described as follows:
Back: • No cables required if the thickness of stope is less than 10 m
unless major structures are present.
Top sill: • Row of three 6 m - cables fanned and 2 m apart, angled optimally to offer the best resistance to wall movements.
Hanging wall: • No cables required if RQD is below 20%.
Brow: • Three rows of three 6 m cables spaced 2.5 m apart
Figure 10 illustrate the new cable bolting pattern for primary stopes.
4.2 TESTS IN A SECONDARY STOPE
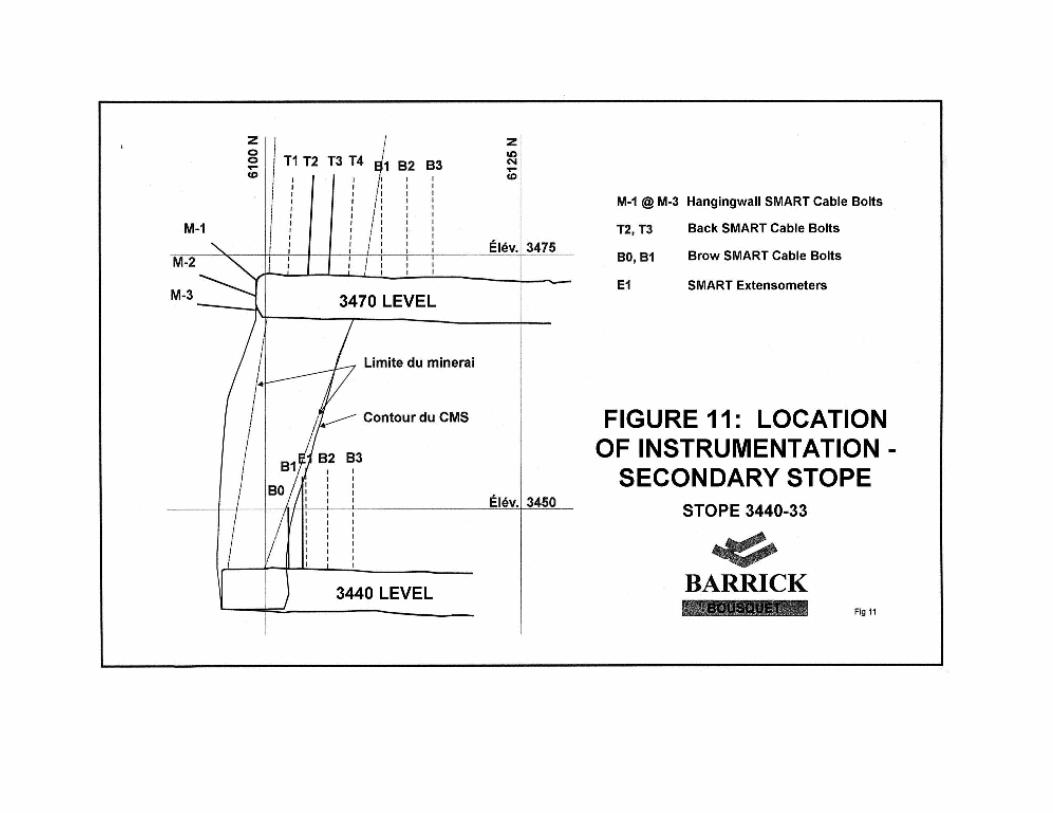
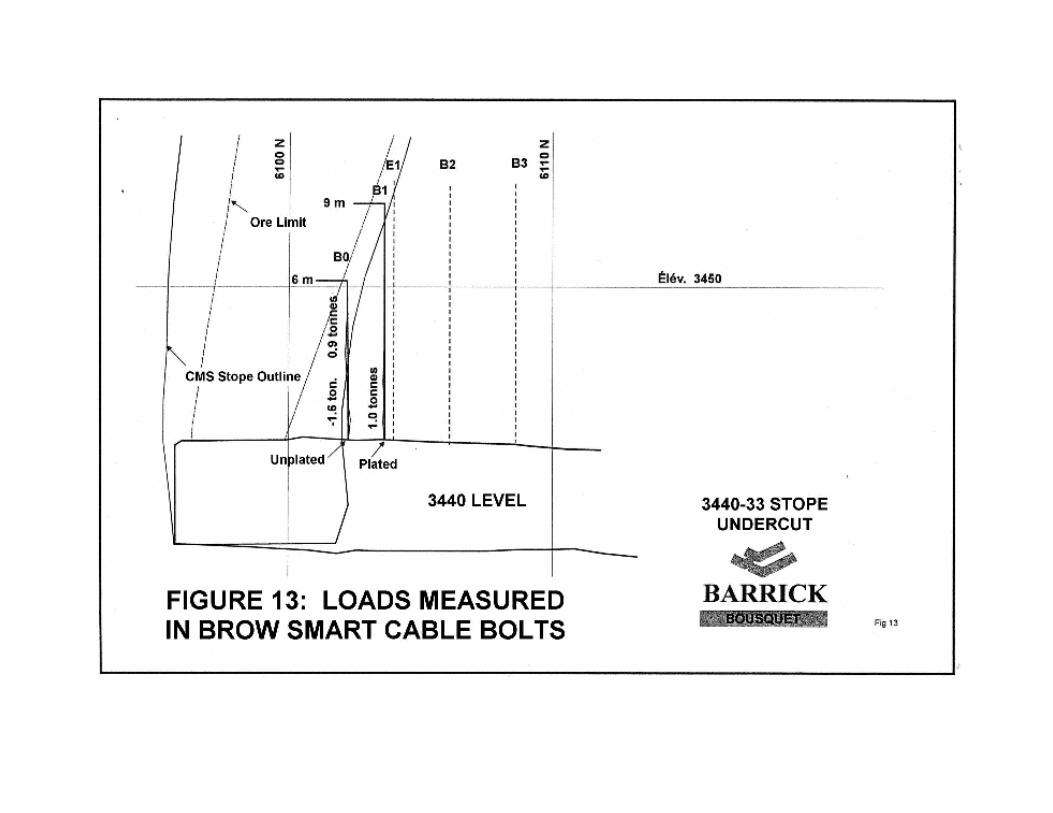
4.2.1 Summary of Work Done in a Secondary Stope The stability of secondary stopes is different from primary stopes. In these stopes, it was important to measure the loads applied on the cables. It was also considered important to test the effectiveness of the brow cables. A total of 9 SMART Cables and 2 SMART MPBX’s were installed in the top and lower sills of Stope 3440-33. The location of these instruments is shown on Figure 11. Figures 12 and 13 show the loads measured by the cables. From the results of the instrumentation of the secondary stopes, it is possible to draw the following conclusions:
Back: • No loads above 7 tonnes were recorded in the cables at a distance over 4 m.
• Steel face plates do not appear to improve the cable set up. • The present cable bolting pattern could be enlarged, resulting in a
greater load in the remaining cables.
Top sill: • The maximum load recorded on instrumented cables was 10.7 tonnes at 2 m. It would be realistic to shorten the lengths of cables from 10 to 6 m.
• The behavior of cables is highly dependent on their location and orientation. The convergence increases the more we move away from the uppermost corner of the stope.
• Cable M-1, located in the upper corner of the stope, could be removed as it does not take on any load. However, it may be beneficial to leave it in the pattern as it prevents sloughing in the top level.
Brow: • Some of the instruments were destroyed during the second and
third blasts. • The instrumented cable closest to the footwall did not indicate any
load. As this cable is located in a relaxation zone, there may be a lack of confinement between grout and cable. Consequently, this cable would not take any load.
• This series of tests at the brow was not judged conclusive; another test should be done.
• Even though we are lacking conclusive data for the brow cables, it was decided to shorten the cables to 6 m given the size of the opening at the brow.
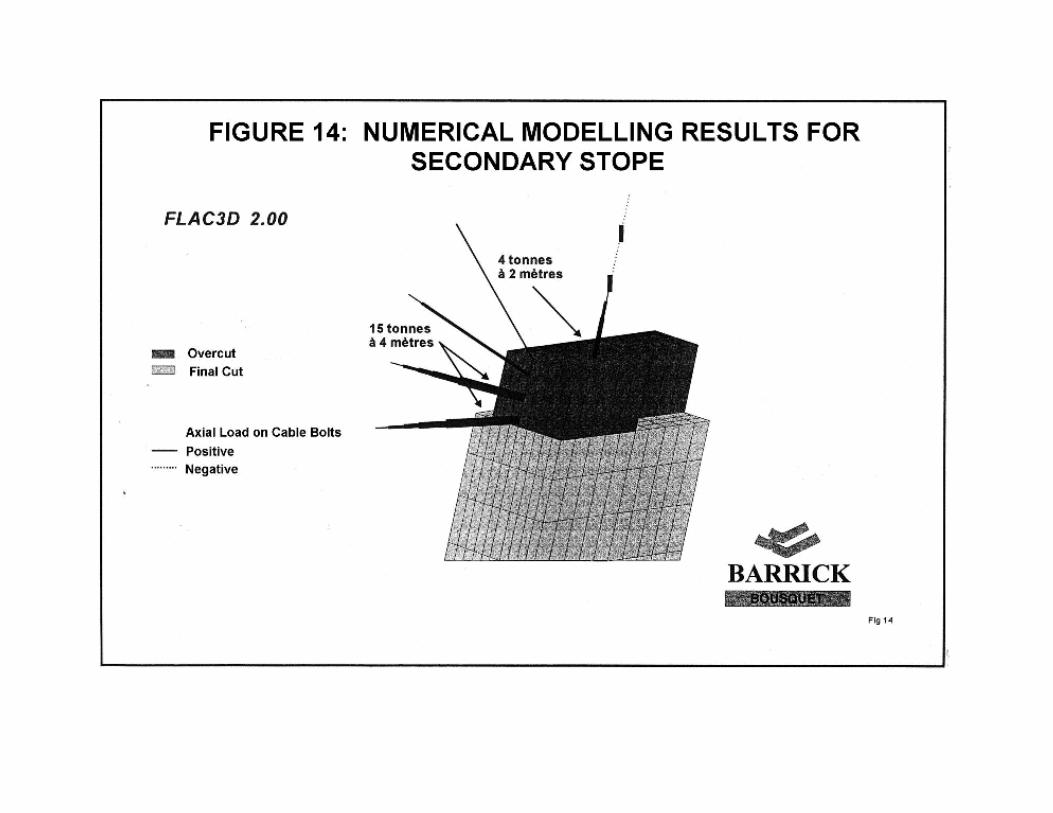
Modeling for the secondary stopes give essentially the same results as for the primary stopes. However, the correlation between the numerical modeling and the loads measured by the instrumented cables is different. The modeling results indicate higher loads in the back than those measured by the cables installed in the stopes. Therefore the decision to shorten the cables to 6 m can be justified. Figure 14 illustrates the numerical modeling results of the secondary stopes.

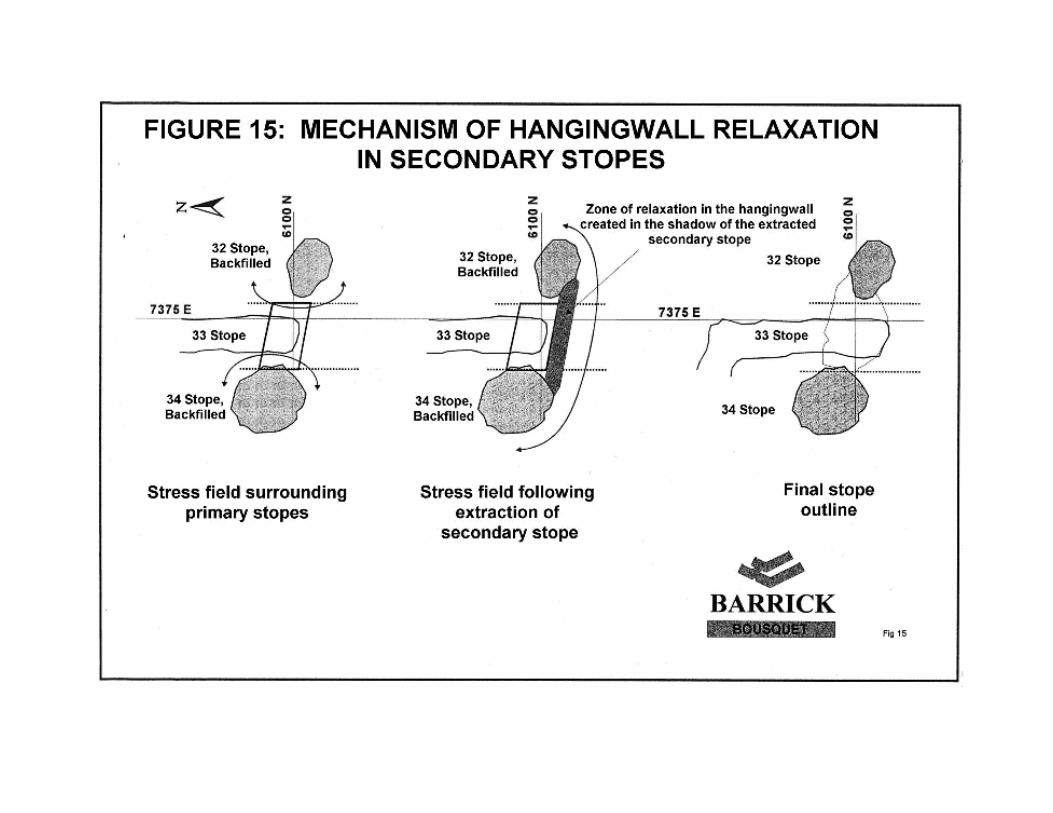
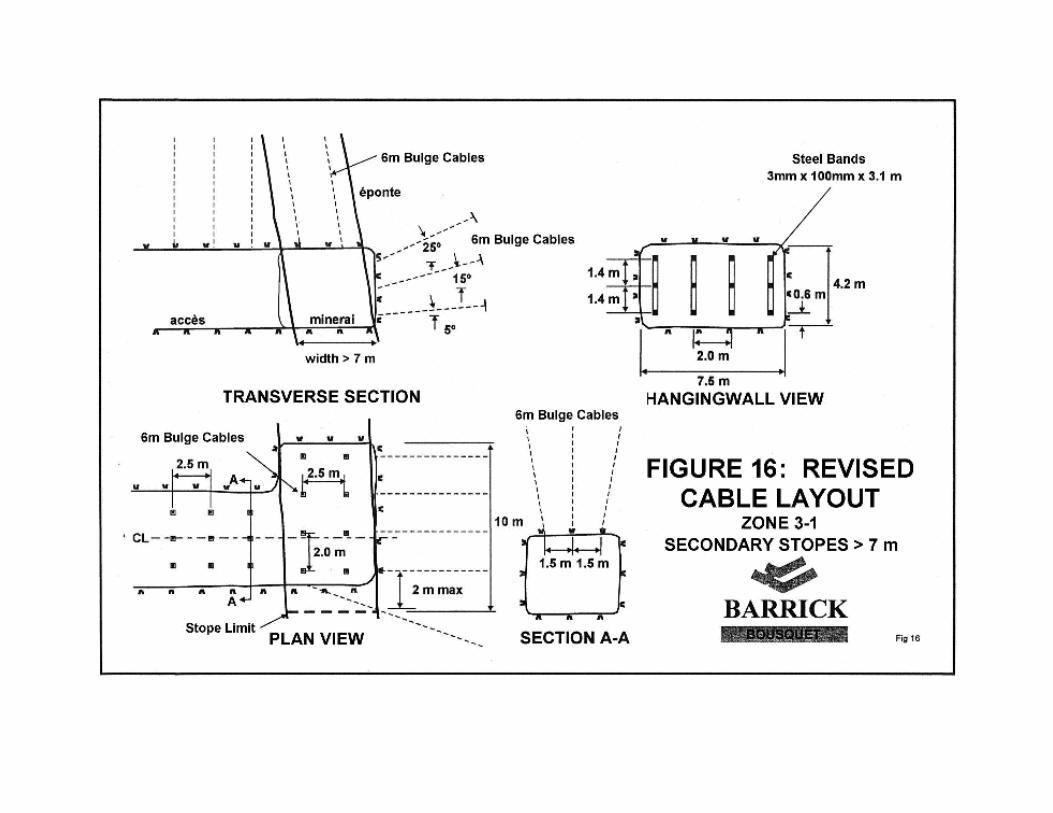
4.2.2 Hanging Wall Caving Process Based on the results of this study, the caving process of the hanging wall can be described as follows. The amount of dilution in the secondary stopes is a function of the caving profile in the primary stopes. The high levels of stresses in the primary stopes bring about important displacements, which in turn cause the cables in the primary stopes to rupture. In the secondary stopes, the displacements are associated with stress relaxation caused by the shadowing effect of the mined out primaries. This relaxation creates a situation of non-compression in the secondary stopes, and results in caving caused by gravity. The stress redistribution around stopes is shown in Figure 15. 4.2.3 New Cable Bolting Pattern for Secondary Stopes Based on the results of these analyses, the cable bolting pattern for secondary stopes becomes:
Back: • 6 m cables on a 2.0 by 2.5 pattern. • Steel plates are not removed yet. A more definitive study will be
required before they can be removed.
Top sill: • Rows of three 6 m Garford cables fanned and spaced 2 m apart.
Brow: • Three rows of 6 m long cables every 2.5 m.
Figure 16 illustrates the new cable bolting pattern for secondary stopes.
5. DRILLING AND CABLE INSTALLATION COSTS Ground support with cables is an important cost at mine Bousquet. During 1999, 43,500 m of cable bolts were installed at a cost of $1.5 million (i.e. $1.90 per tonne of ore mined). Details of installation costs are as follows:
Drilling: • Labour • Materials • maintenance
$ 5.65 $ 7.58 $ 8.61
Subtotal: $ 21.84
Installation: • Labour • Materials (cables, cement, etc.) • maintenance
$ 6.91 $ 5.12 $ 0.56
Subtotal: $ 12.59
TOTAL: $ 34.43
6. COST REDUCTIONS Cable bolting at Mine Bousquet is standard practice for the B-2 Main Zone and Zone 3-1. Enlargement of bolting patterns in the stopes, hanging walls and brows prescribed for Zone 3-1 will also be used in the Main Zone. The optimization of the cable bolting patterns for Zone 3-1 is presented in the following tables:
Cable Bolting Pattern for Primary Stopes in Zone 3-1 (orebody thickness < 10 m)
Description
Initial Pattern
(length of cable in m) Optimized Pattern
(length of cable in m) Difference
Back 140 0 100 % Top sill 200 90 55 % Hanging wall 200 200 0 % Brow 90
54 40 %
TOTAL: 630 344 45 %
Cable Bolting Pattern for Secondary Stopes in Zone 3-1 (orebody thickness < 10 m)
Description
Initial Pattern
(length of cable in m) Optimized Pattern
(length of cable in m) Difference
Back 140 66 53 % Top sill 200 90 55 % Hanging wall 0 0 0 % Brow 90
54 40 %
TOTAL: 430 210 51 %
For 1999 it is forecasted that a savings of $0.40 per tonne mined will be saved, based on a reduction of 9,300 m in cables. 7. CONCLUSIONS
Primary and secondary stopes in Zone 3-1 were instrumented in order to evaluate their cable needs. Based on the instrumentation data, it was discovered that a reduction strategy could be used to reduce costs without jeopardizing personnel safety, and without increasing dilution. The field tests were done in conjunction with numerical modelling to determine critical opening sizes for stope stability

8. ACKNOWLEDGEMENTS We would like to thank Barrick – Complexe Bousquet and the Ground Control Organizing Committee for the opportunity to make this presentation. We also thank the consultants of Mine Design Technologies for the tabulation and analysis of field test results, Itasca for the numerical modelling and the entire Technical Services team at Bousquet No. 2. 9. REFERENCES Dennison, S., Lausch, P. , and Bawden, W., 1999. Cable bolt performance in the 3-1 zone determined using smart cable bolts Phase II: The 3440-33 Secondary Stope, Mine Design Technologies Inc., Kingston, Ontario. Diederichs, M., Hutchison, D. J., and Kaiser, P.K., 1999. Cable layouts using the modified stability graph, CIM Bulletin, Vol. 92, No. 1035, pp. 81-85. Henning, J. G., and Mitri, H. S., 1999. Examination of hanging-wall stability in a weak rock mass, CIM Bulletin, Vol. 92, No. 1032, pp. 40-44. Hyett, A. J., Lausch, P., and Dennison, S., 1999. Cable bolt performance in the 3-1 zone determined using smart cable bolts. Phase I: he 3470-32 Primary Stope, Mine Design Technologies Inc., Kingston, Ontario. Ruest, Marc, 1999. Investigation sur l’efficacité des câbles cimentés de chantier au Complexe Bousquet, Itasca Consulting Group Inc., Minneapolis, Minnesota. Ruest, Marc, 1998. Dimensionnement des chantiers – Zone 3-1, Rapport interne, Bousquet No. 2, Priessac, Quebec.


![Properties of the Lightning Activity at Storm Scale during ......Météo France operational radar observations [Bousquet et al., 2014a; Bousquet et al., 2014b]. Additionally several](https://static.fdocuments.in/doc/165x107/5f9dbc724283787d5612e94d/properties-of-the-lightning-activity-at-storm-scale-during-mto-france.jpg)