
Ca world monograph ca world 2011
46
Digital Celerity LL All Rights Reserved Sponsored by DC Education CA Clarity PPM™ Community Knowledge Share Monograph Sharing Knowledge, Exchanging Ideas and Building the CA Clarity PPM Global Community There are essentially two (2) core objectives in releasing this free and informative booklet (monograph) on CA Clarity PPM™: To share the collective knowledge of representative CA Clarity PPM subject matter experts with the global CA Clarity PPM user community and; To provide an informative vehicle for sharing knowledge, exchanging ideas and industry best practices, while fostering the CA Clarity PPM community. This being our inaugural annual edition, we are delighted to recognize significant contributions from many of the CA Clarity PPM Global User Group Board members; including Steve VanArsdale, Michael Thibault, Jeff Bloom, and Richard Shapiro. In addition to the innovative white papers, blogs and presentations contributed by representative members of Digital Celerity’s Clarity PPM Expert Services and Training Practice, we’re also pleased to include an informative article on PPM by ITG Evangelist and Principal of Romero Consulting, Steven Romero. We plan to release our second edition at CA World in April, 2013 and hope to include content from innovative thought leaders like you, who have achieved their PPM objectives leveraging CA Clarity PPM and wish to share your knowledge, exchange ideas and build the CA Clarity PPM Community. Appreciatively, Sharing Knowledge, Exchanging Ideas, Building Community
Transcript of Ca world monograph ca world 2011
Digital Celerity LL All Rights Reserved Sponsored by DC Education
CA Clarity PPM™ Community Knowledge Share Monograph
Sharing Knowledge, Exchanging Ideas and Building the CA Clarity PPM Global Community
There are essentially two (2) core objectives in releasing this free and informative booklet (monograph)
on CA Clarity PPM™:
To share the collective knowledge of representative CA Clarity
PPM subject matter experts with the global CA Clarity PPM
user community and;
To provide an informative vehicle for sharing knowledge, exchanging ideas and industry best
practices, while fostering the CA Clarity PPM community.
This being our inaugural annual edition, we are delighted to recognize
significant contributions from many of the CA Clarity PPM Global User Group
Board members; including Steve VanArsdale, Michael Thibault, Jeff Bloom,
and Richard Shapiro.
In addition to the innovative white papers, blogs and presentations
contributed by representative members of Digital Celerity’s Clarity PPM Expert Services and Training
Practice, we’re also pleased to include an informative article on PPM by ITG Evangelist and Principal of
Romero Consulting, Steven Romero.
We plan to release our second edition at CA World in April, 2013 and hope to include content from
innovative thought leaders like you, who have achieved their PPM objectives leveraging CA Clarity PPM
and wish to share your knowledge, exchange ideas and build the CA Clarity PPM Community.
Appreciatively,
Sharing Knowledge, Exchanging Ideas, Building Community

Digital Celerity LL All Rights Reserved Sponsored by DC Education
CA Clarity PPM™ Community Knowledge Share Monograph
Doing PPM Right
Most organizations are “doing PPM,” but are they doing PPM right?
By: Steve Romero, IT Business Value Activist and IT Governance Evangelist
A recent analyst study found that 75% of organizations are “doing Project and Portfolio Management (PPM).” This is a reassuring statistic for the countless analysts, researchers, academics, and pundits who rightfully view PPM as a critical business process that is essential to the success of every enterprise. Though encouraging, the statistic is also potentially misleading. The study did not validate that respondents had a consistent or even a correct view of PPM. The statistic should have read, “75% of organizations are doing something they are calling PPM.”
Ask members of your business leadership team and your IT leadership team to write down the meaning of those three letters – PPM – or even members of your PMO or project management ranks. You are quite likely to see disparate and even contrasting views. I spent the past five years traveling around the world visiting one PPM-challenged organization after another. Amongst those companies and government agencies, I encountered countless variations and approaches to PPM. Though the differences in this critical enterprise discipline were all over the map, there were some common circumstances. PPM processes were
almost always driven/sponsored by IT/CIO
addressing only a subset of PPM capabilities
addressing only a subset of Enterprise investments
spotty, with business unit-specific implementations
almost always “relegated” to IT
not thoughtfully and thoroughly implemented
devoid of passionate process ownership and management
Given these circumstances, PPM processes varied greatly from one organization to the next. This would not necessarily be a bad thing if it was based on a sound understanding of the discipline resulting in reasoned and rational PPM process design and thoughtful and thorough PPM process implementation. Though almost every organization will lay claim to doing PPM, few are actually doing it right. PPM is the means for the enterprise to achieve its goals and realize its strategy. PPM steers the ship. But for many organizations PPM is primarily if not solely devoted to managing demand and allocating resources. Expensive and potentially powerful automated PPM solutions are often little more than overpriced time accounting systems.
Study after study shows PPM is still generally immature in enterprises today. PPM processes will continue to be immature and enterprises will continue to miss out on incredible opportunities until these organizations understand what PPM is and how to do it right.
There are many authorities and some really good books on the topic of PPM. The Project Management Institute (PMI) published an excellent but seldom read “Standard for Portfolio Management.” The IT Governance Institute (ITGI) developed a fantastic PPM framework called “ValIT.” Executive leadership, directors, managers and program and project managers must all have an understanding and appreciation of the discipline if there is to be any chance of PPM success. The problem with many of the great PPM treatises is their length and complexity. The challenge is getting each PPM stakeholder to take the time and effort to read these resources to gain a solid understanding of this essential enterprise discipline.

Digital Celerity LL All Rights Reserved Sponsored by DC Education
CA Clarity PPM™ Community Knowledge Share Monograph
To help overcome the barriers to sufficient and collective PPM understanding I developed the PPM “SCAD” model. To do PPM right, there are four questions the business process must ask and answer:
Should we?
Can we?
Are we?
Did we?
Should we? Is the investment in the best interest of realizing our strategy and meeting enterprise goals?
Can we? Does our organization have the capacity, capability, and resiliency to undertake the investment?
Are we? Once approved, are we making the progress required to realize the projected value of the investment, and if not, should we spend the money to fix it or accept a loss and kill it?
Did we? Once completed, did the investment deliver the expected value and if not, why?
Sound and mature PPM processes answer each of these critical questions. I say sound and mature because doing PPM right doesn’t happen on Day-1. It takes time and perseverance. Sound and mature PPM requires scads of executive sponsorship and accountability, scads of business and IT involvement, and scads of data. And don’t be fooled by its simplicity, the model entails scads of complexity.
Though this simple model belies the complexity of PPM, it provides an uncomplicated and straightforward mechanism to portray its potential. This simple model can be used to engage everyone in the enterprise in a dialogue about PPM, how it is currently working, and not simply whether or not it is being done, but whether or not PPM is being done right.
© 2011 Steven Romero, All rights reserved

Digital Celerity LL All Rights Reserved Sponsored by DC Education
CA Clarity PPM™ Community Knowledge Share Monograph
Top-Down vs. Bottom-up Planning:
Leveraging CA Clarity PPM’s features
By: Jeff Bloom, CA Clarity PPM Global Community – Secretary
Prior to the introduction of "activity based costing" techniques like those supported by CA Clarity PPM, organizations traditionally forecasted their future expenditures by allocating funds to departments and sub-departments. Each future period's expenditures were estimated by adjusting the prior period's actual/estimated costs based on anticipated changes in demand for services and the costs to provide those services. This approach is often referred to at "Top Down" planning. What is wrong? While such techniques are generally adequate for continuing operations, cost estimates for "one time" projects do not have the "prior experience" upon which to base these derivative forecasts. CA Clarity PPM's advanced project and resource management facilities allow Project Managers to develop detailed cost estimates based on the schedule of resource expenditures required to accomplish the project's tasks. The Project Management facilities within CA Clarity PPM utilize the "Critical Path Method (CPM)" to schedule the expenditure of resources of individual activities (tasks) depending upon resource availability, completion of preceding tasks, and external events required before tasks can begin. The detailed schedules and cost estimates created using these types of dependencies are referred to as "Bottom Up" Planning. For many organizations, the challenge is to balance the mix of departmental Top Down "Resource Allocation" vs. "Bottom Up" Project "Activity Base Plans". Before the introduction of CA Clarity PPM's Portfolio Management Module, "Programs" were used to group projects to provide a summary of schedules and costs. The Program's cost and effort summary is a "roll up" of the costs and effort of the Program's projects. The difference between this "Bottom Up" summary of estimated Program costs and the "Top Down" allocation of funds to departmental funding allocations was difficult to view and manage. What to do? Two approaches may be considered to coordinate Top Down and Bottom Up planning: 1. Use the Portfolio Management Module's ability to display the variance of the Portfolio's "Planned Costs" with the sum of the Portfolio's investment costs. The Top Down funding is reflected in the Portfolio's and Child Portfolio's Planned Costs. 2. Use the Program's Cost Plan to capture the difference between the "Bottom Up" sum of the Program's Investments and the "Top Down" allocation of funds to the Programs. Depending upon the requirements for detailed plan accuracy, a mix of these strategies is typically used to match the accuracy and details of the plans to the granularity needed to provide the required estimate confidence levels. Program Management Offices should strive to provide a variety of approaches and the training/mentoring necessary to make these solutions achievable and productive for users.
© 2011 Jeffrey A. Bloom, All rights reserved

Digital Celerity LL All Rights Reserved Sponsored by DC Education
CA Clarity PPM™ Community Knowledge Share Monograph
Successful Adoption of PPM using CA Clarity PPM™
Managing Organziational Change for a successful PPM implementation
By: Allan Mills, MPM, PMP, Engagement Manager, Digital Celerity LLC
Abstract
Managing organizational change is critical for a successful Clarity PPM implementation
Provide a systematic approach and framework for managing the changes associated with a Clarity PPM
implementation
Discuss the success factors of a Clarity PPM implementation, and how organizational change management
can be essential for building user acceptance and a shared vision of a Clarity PPM Implementation
An adoption approach that will endure for the duration of the PPM implementation and ensure that the
cultural changes bring the ultimate benefits of PPM to the organization
Summary
This white paper describes how some of the leading organizational change management approaches articulated by John
Kotter, Jim Collins, Peter Senge, Jerry Brightman, and Kerry Patterson can be utilized to increase the likelihood of complete
success of a Clarity PPM implementation.
The Value of Clarity PPM to an Organization
The following are some of the reasons people will buy Clarity PPM to accelerate their PPM capability and provide benefits to
an organization:
Easy alignment with Project methodology
Consistent with recognized standards including PMI and PRINCE
Project Demand can be managed
Standard project templates for project planning
Planning Resources
Manage Project Risks and Issues
Future portfolio planning
Easy configuration to Company processes
The Challenges of a Clarity PPM Implementation
Even though Clarity PPM provides significant potential benefits for an organization, some organizations fail to realize the full
benefits of the enterprise application because the organization is not prepared to change to adapt to the cultural changes that
are associated with the new integrated PPM process.
Digital Celerity LL All Rights Reserved Sponsored by DC Education
CA Clarity PPM™ Community Knowledge Share Monograph
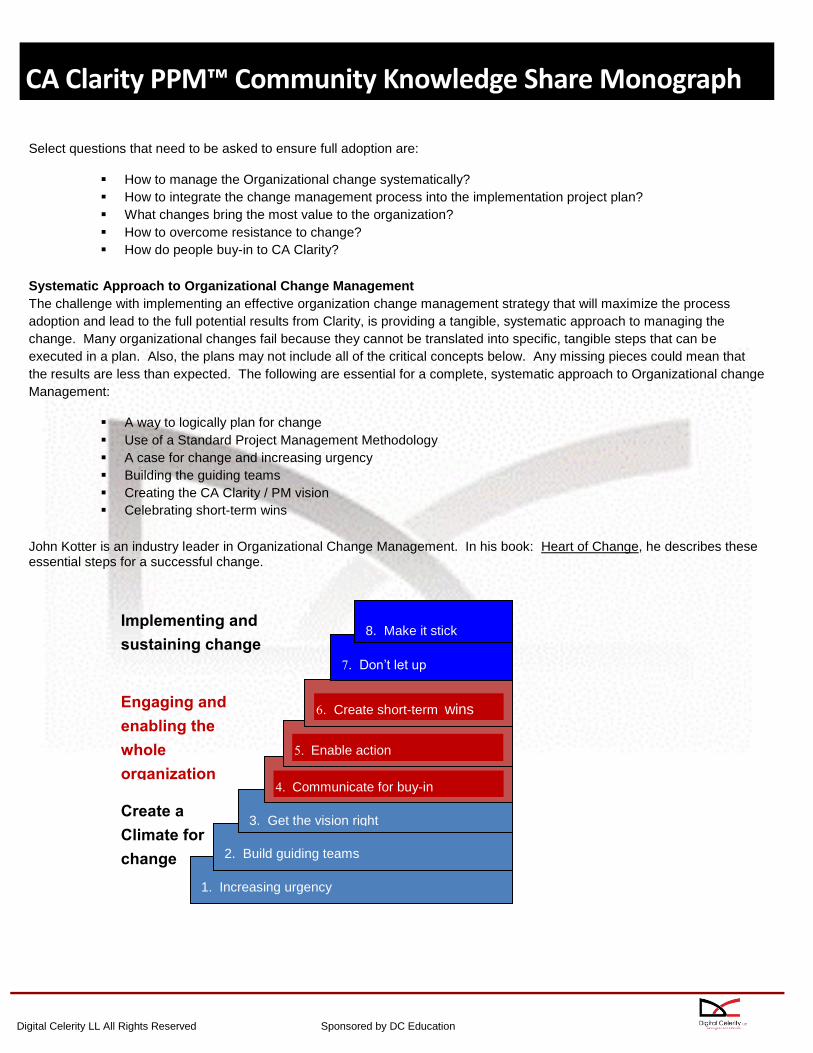
1. Increasing urgency
2. Build guiding teams
3. Get the vision right
4. Communicate for buy-in
5. Enable action
6. Create short-term wins
7. Don’t let up
8. Make it stick
Create a
Climate for
change
Engaging and
enabling the
whole
organization
Implementing and
sustaining change
Select questions that need to be asked to ensure full adoption are:
How to manage the Organizational change systematically?
How to integrate the change management process into the implementation project plan?
What changes bring the most value to the organization?
How to overcome resistance to change?
How do people buy-in to CA Clarity?
Systematic Approach to Organizational Change Management
The challenge with implementing an effective organization change management strategy that will maximize the process
adoption and lead to the full potential results from Clarity, is providing a tangible, systematic approach to managing the
change. Many organizational changes fail because they cannot be translated into specific, tangible steps that can be
executed in a plan. Also, the plans may not include all of the critical concepts below. Any missing pieces could mean that
the results are less than expected. The following are essential for a complete, systematic approach to Organizational change
Management:
A way to logically plan for change
Use of a Standard Project Management Methodology
A case for change and increasing urgency
Building the guiding teams
Creating the CA Clarity / PM vision
Celebrating short-term wins
John Kotter is an industry leader in Organizational Change Management. In his book: Heart of Change, he describes these essential steps for a successful change.

Digital Celerity LL All Rights Reserved Sponsored by DC Education
CA Clarity PPM™ Community Knowledge Share Monograph
Creating a Climate of Change
The foundation of a successful change is to create the Climate for change. People need to see the value in the change in
order for them to move in the new direction of the change.
Increasing Urgency
“Without urgency, large scale change can become an exercise in pushing a gigantic boulder up a very tall mountain”. For
change to succeed, it is important that the behaviors of complacency, self-protection, and pessimism about the change be
addressed head on. In order to feel motivated to contribute to the effort, everybody involved needs to believe the change is
critical. This step is not only a concrete business case. In order to change, people need to see, and then feel the change.
Leaders need to be acutely aware of built up fear, anger, or complacency in an organization. There are three important
steps in creating a shared sense of urgency.
1. Build a case for change that clearly identifies the gap between current organization PPM performance and
PPM desired performance:
Clarity PPM change is critical to success
Gain rational buy-in through charts and a business case for PPM and Clarity
An awareness campaign – what is PPM and Clarity?
Describe the situation and the problem with staying in the current PPM maturity level
Describe the benefits, reward, and opportunities for the PPM Clarity Implementation
Solidify the scope and the benefits of a CA Clarity Implementation
2. Identify the source of organizational complacency:
Look for the warning signs of complacency
Define an action plan to address the complacency identified
Use techniques such as those described in “Crucial Conversations” by Kerry Patterson to address
complacency
3. Clarifying the roles of leaders and managers in implementing the new PPM initiative:
The leader’s role is to make the need for Clarity PPM change apparent to the entire organization
Communicate a compelling story and engage all stakeholders in a dialogue about the need for change
Enable managers to perform their change related roles and responsibilities
Invite ideas and suggestions for improvement
Outcomes
Successfully increasing urgency will mean gaining converts through logic and emotion:
Gain rational buy-in – making a case for change based on solid data
Gain emotional buy-in – by providing a compelling story or picture that catches people’s attention and
generates a high level of energy throughout the organization
Building Guiding Teams
Strong guiding teams provide the energy, support, speed, and sense of urgency that the Clarity PPM implementation needs
in order to succeed. Three critical elements in creating effective guiding teams for the Clarity PPM implementation are:
1. Engage the right people: The Clarity PPM implementation needs a number of guiding teams to be successful.
Also, the team members must have the necessary knowledge, skills, perspective and commitment to tackle the
challenge.

Digital Celerity LL All Rights Reserved Sponsored by DC Education
CA Clarity PPM™ Community Knowledge Share Monograph
2. Set Clear team goals:
Provide a shared sense of purpose
Define clear team roles
Enable effective team processes such as team meetings, planning, problem solving, decision making,
conflict resolution
Goals create a strong relationship between team members
Develop effective interface management with other teams
3. Develop a climate of trust and commitment within the teams:
Trust, doing what you said you will do, and exceeding expectations, is the foundation of the successful team
Deep commitment to a common goal drives the common purpose of the team
Outcomes
The results of focusing attention on guiding teams are:
They become composed of individuals with sufficient power, influence, expertise, credibility, and leadership ability to
drive the Clarity PPM change
They share a common understanding of the Clarity PPM change initiative goals, and are clear about the roles and
responsibilities needed to make the change succeed
Built on trust with a strong emotional commitment to a successful Clarity PPM implementation
The teams work at a high level of performance
Get the vision right
This step involves creating a clear, inspiring, achievable picture of the future of the Clarity PPM implementation. It is
important that this vision describe the future key behaviors needed to achieve the vision. As a result the strategies and key
performance metrics can be created to support the vision. The four phases of developing a vision are:
1. Clarifying why a vision is necessary? The vision allows everyone involved in the Clarity PPM implementation to
see the need in a way that is clear and motivational. The vision must make people feel the risk of maintaining the
status quo and the positive possibilities of the future
2. Developing and analyzing a vision: Collect and analyze data related to the Clarity PPM change. Involve
stakeholders throughout the organization in development and feedback about the vision
Outcomes
A picture of change that is compelling and focused
Clear understanding of the behaviors that need to be added, removed, or maintained in order to achieve the vision
A sound strategy that defines how the vision will be achieved and demonstrates the feasibility of the goals
Engaging and Enabling the Whole Organization
Communicate for Buy-In
The goal of this step is to get as many people as possible acting to make the vision a reality. The objective is to influence
people to think and act in accordance with the new PPM Clarity direction.

Digital Celerity LL All Rights Reserved Sponsored by DC Education
CA Clarity PPM™ Community Knowledge Share Monograph
1. Initially communicating the vision: it is essential to the communication effort that feedback is received about the
level of understanding and acceptance of the vision through focus groups, and other feedback processes.
2. Engaging in continuous dialogue with the stakeholders: The guiding teams need continuous dialogue with all
stakeholders to build commitment and detect resistance.
3. Enrolling stakeholders in the Clarity PPM implementation: Managing stakeholder enrollment and commitment is
complex because different groups have different communication needs. Not everybody needs or wants to move
along the change continuum at the same speed. It is important to know where each stakeholder group is on the
enrollment continuum and develop a plan to move them to the level of commitment needed for the project.
Outcomes
Shared picture of a desirable future
Motivate people to take action and spark the change
Minimize resistance to change
Belief in the change effort to enable commitment
Enable Action
If you want the guiding team and stakeholders to carry out the vision you have to provide them with the means to do so. The
purpose of this step is to enable a broad base of people to take action by removing as many barriers to the Clarity PPM
implementation as possible.
1. Busting Barriers that block people from carrying out the Clarity PPM vision: The four major barriers that need
busting are:
Structure – create a structure for the initiative that is consistent with the vision
Lack of skills – Define the new behaviors and identify skills, abilities, and attitude that will succeed. Training
at the right time, for the right skills, and using the right approach.
Organizational systems – make sure that the performance management, compensation etc do not hamper
the adoption of Clarity PPM
Resistant leaders and managers – confront resistance directly, engaging in honest discussions. Provide
resisters the opportunity to resolve problems.
2. Encourage people to take risks and be innovative: Once the barriers to change have been removed the leader’s
job is to foster a new way of thinking and behaving.
Outcomes:
Individuals receive the PM and Clarity training needed to be successful
Managers commit the time and resources necessary to build the system and provide training
Organizational processes and systems are aligned to new PM processes
Performance measures are aligned to enable people to see how their performance is moving the successful Clarity
PPM implementation.
Create Short term wins
Short terms wins are critical to building credibility to sustain the change effort over time. They provide the tangible evidence
that the Clarity implementation is paying off. The wins also energize and inspire the team to continue the effort.
1. Planning for visible improvements in performance
2. Achieving those wins
3. Communicating the wins visibly and convincingly
4. Embedding the learning into the plan going forward

Digital Celerity LL All Rights Reserved Sponsored by DC Education
CA Clarity PPM™ Community Knowledge Share Monograph
Outcomes
Short-term wins build the Project credibility
The wins are needed to sustain the change effort
Confidence that the CA Clarity success is based on concrete evidence
Momentum for the CA Clarity implementation
More people becoming active supporters and helpers
Guiding teams invigorated with renewed motivation for CA Clarity, inspiring others to act
Implementing and Sustaining Change
It is not unusual for any project to lose focus, especially one that has so many unique areas as a Clarity PPM implementation.
This step involves not easing up on the initial successes and continuing to focus on the vision.
Don’t let up
1. Leverage the momentum and credibility gained from short-term wins
2. Align and monitor key organization areas
3. Maintain the momentum for the PPM Clarity change
4. Ensure the change is reaching all levels of the organization
5. Sustain the involvement and support of leaders
Outcomes:
Reinvigorated Project provides tangible results and optimism
Facilitates the development of new hires
Sustained leadership from senior people
Leadership reinforces the need for change, and are perceived as actively involved in the change
The following diagram describes the integrated nature of the alignment of Structure, People, Measurements and Rewards,
Processes, and Technology:

Digital Celerity LL All Rights Reserved Sponsored by DC Education
CA Clarity PPM™ Community Knowledge Share Monograph
Make it stick
Once the Clarity PPM implementation has had some success, and people have started to use the tool and changed their
process and behavior, these new behaviors and processes need to be woven into the culture of the organization. If the
organizational culture absorbs the new systems, it will not feel like extra effort by the stakeholders and they will wonder how
they operated without Clarity PPM.
1. Achieve tangible results as quickly as possible
2. Show how the change is working, and why the old ways won’t work
3. Measure and support the sustained performance
4. Ensure the leadership will support and model the new behavior
Outcomes:
When the Clarity PPM change is “sticking” you will witness the following:
An organization infrastructure that develops and reinforces correct practices and behaviors for continuous PPM
related results
The Clarity PPM processes and behavior associated with the new direction is embedded in the new culture
Conclusion
A systematic approach to organizational change management is vital for a successful Clarity PPM implementation. The
approach defined in this white paper has been proven to be successful in numerous large Clarity PPM transformational
change efforts.
Digital Celerity LL All Rights Reserved Sponsored by DC Education
CA Clarity PPM™ Community Knowledge Share Monograph
The Project Management Sextant
Triple Constraint – Earned Value
By: Steve VanArsdale, PMP, CPA, ISACA
Introduction
“Triple Constraint” Earned Value
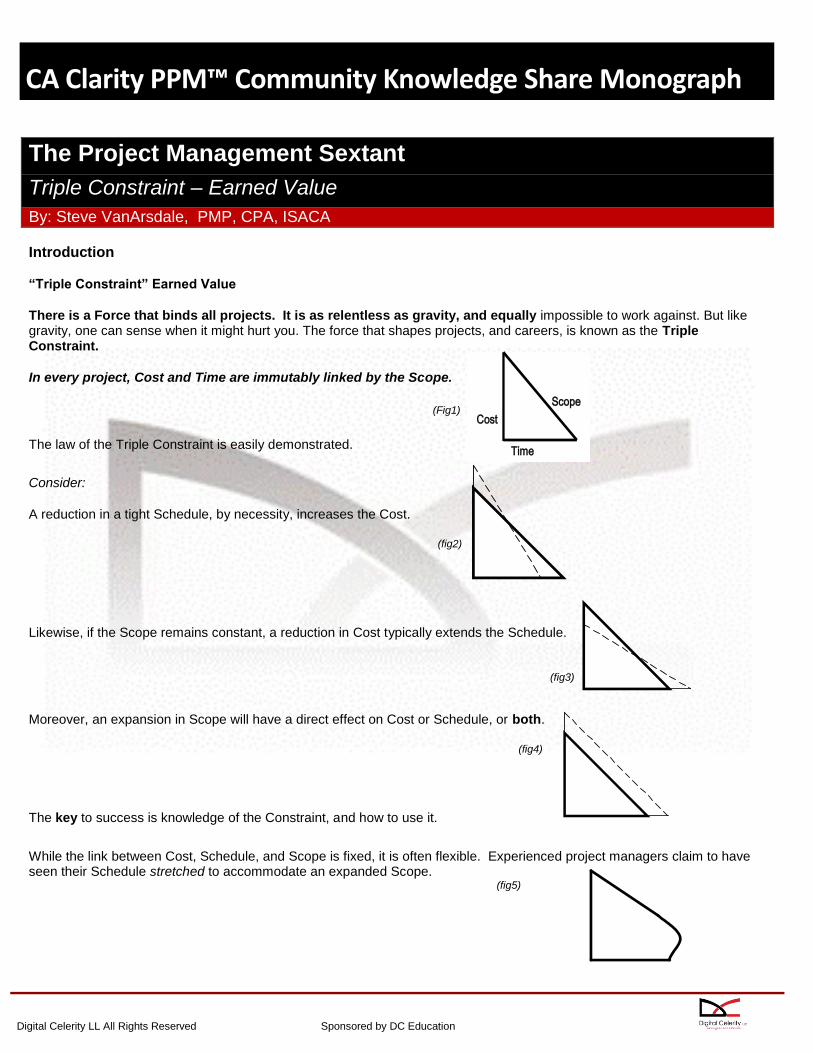
There is a Force that binds all projects. It is as relentless as gravity, and equally impossible to work against. But like gravity, one can sense when it might hurt you. The force that shapes projects, and careers, is known as the Triple Constraint.
In every project, Cost and Time are immutably linked by the Scope.
(Fig1)
The law of the Triple Constraint is easily demonstrated.
Consider:
A reduction in a tight Schedule, by necessity, increases the Cost.
(fig2)
Likewise, if the Scope remains constant, a reduction in Cost typically extends the Schedule.
(fig3)
Moreover, an expansion in Scope will have a direct effect on Cost or Schedule, or both.
(fig4)
The key to success is knowledge of the Constraint, and how to use it.
While the link between Cost, Schedule, and Scope is fixed, it is often flexible. Experienced project managers claim to have seen their Schedule stretched to accommodate an expanded Scope. (fig5)
Time
Cost
Scope

Digital Celerity LL All Rights Reserved Sponsored by DC Education
CA Clarity PPM™ Community Knowledge Share Monograph
Moreover, it is not unusual to see Costs stretched a little to cover an extended Schedule…
(fig6)
…especially past the cut-off into the next accounting period.
(fig7)
The Triple Constraint is not “dark science”. It has been known and practiced for decades.
The concept of the Triple Constraint led to the U.S. government’s supplier Cost/Schedule Control Systems Criteria in the 1960’s. C/SCSC focused on two of the constraints, Cost and Time, and led to the technique known as Earned Value, now considered a standard of project management. However, while EV is widely practiced in government and private industry, studies show that 70% of all projects exceed cost budgets or time schedules or both
1. Moreover, industry satisfaction
surveys suggest that sponsors and stakeholders are rarely getting what they expected.
Part of the problem is thought to be that there is a “dark” or hidden factor, the Scope. It is widely acknowledged by the Project Management Institute’s College of Performance Management that it is possible to ‘game’ the system, or control cost and schedule variance, by simply changing the scope of the work. The following paper suggests that a new metric is needed.
The benefit is that all three fundamental factors can then be controlled. Another benefit is that all three Constraints are revealed, the project snaps into sharp focus. A simple graphic can be an extraordinarily
effective project control and even predictive tool.
The Elusive Earned Value Scope Metric
Let’s consider the situation. The Triple Constraint concept is deceptively easy to understand. It appears just as easy to master. However, mastering the“3C” calls for the practice of Earned Value. Earned Value is a series of calculations that measure two of the three Constraints. First one calculates
the Cost Variance, or the difference between what was planned expenditure and the actual. Then one calculates the Schedule Variance, or the difference between the time planned and expended. Comparing the Cost Variance and the Schedule Variance to the original plan purports to show how well the project is doing. Or perhaps how well the project managers are doing with the project.
Volumes have been written, upon these “project metrics”. Yet studies have determined that most projects fail to meet their budgets, or schedules, or both. Not just some projects, or even a lot of them, but most (70% reported in the 1995 and 1997 Standish Group CHAOS reports). This is disconcerting. Earned Value has been practiced for forty years. Yet something in Earned Value has been missing. Poor performance goes undetected and worse yet, good performance can go unrecognized. Perhaps this is because if and when there is a shift in the third Constraint, the Scope, there usually is no corresponding adjustment in any of the other project metrics.
Oh, to be sure, there is usually a scope document, and sometimes a rigorous control procedure. Or maybe even a stern scope committee, or perhaps the dreaded Scope Change Control Board. Yet the elusive Scope remains the project manager’s most common escape clause:

Digital Celerity LL All Rights Reserved Sponsored by DC Education
CA Clarity PPM™ Community Knowledge Share Monograph
“Well, yes, of course, the SPI indicates that we’re behind schedule, which isn’t exactly true, and the CPI suggests we’re over-budget, although we’re really not… because we’re not actually going to do all that stuff in exactly that way.”
Now there is a method to retire this defense. That method is a simple calculation, depicted in an even simpler graphic.
The Project Sextant is a precision instrument designed to reveal a project’s true course, using the tools and techniques of Earned Value within the context of the Triple Constraint.
Earned Value rules dictate that the Cost Performance Index, or CPI, and the Schedule Performance Index, or SPI, are calculated as percentages such that a number larger than 1.00 is ahead of plan (desirable), less
than 1.00 is behind (bad), and an index of 1.00 is on track. The CPI and SPI can, of course, be calculated precisely, but the result is not always meaningful. For example, if the CPI is 0.90, and the SPI is 1.10, can the project be considered OK?
However, the CPI and SPI can be plotted on an X-Y line graph. When this plot is adjusted by the DPI, or Deliverables Performance Index, the succinct deviation in the Triple Constraint is suddenly visible. Like a ship’s compass in the hands of a trained navigator, a universal law is transformed into a manager’s tool. This new “triple factor” graphic shows instantly the status of the project and the degree by which it is off-course. For this reason, this technique is called the Project Sextant.
Like Earned Value versus the Triple Constraint, some things are better seen than described. Following is an example.
Let’s assume that a project has ten work packages, each producing one deliverable. Here are the Earned Value metrics, including the Deliverables Count metric used in the Project Sextant.
SEXTANT CUMULATIVE
WBS Element (Work Pkg) BAC
PGM EAC
DP Deliverables
Planned PV
BCWS EV
BCWP AC
ACWP
DC Deliverables
Actual
CURRENT Status
TOTAL 10.0 10.0 10.0 1.0 1.0 1.0 10.0
WBS 1.0 1.0 1.0 1.0 1.0 1.0 1.0 1.0
WBS 2.0 1.0 1.0 1.0 0.0 0.0 0.0 1.0
WBS 3.0 1.0 1.0 1.0 0.0 0.0 0.0 1.0
WBS 4.0 1.0 1.0 1.0 0.0 0.0 0.0 1.0
WBS 5.0 1.0 1.0 1.0 0.0 0.0 0.0 1.0
WBS 6.0 1.0 1.0 1.0 0.0 0.0 0.0 1.0
WBS 7.0 1.0 1.0 1.0 0.0 0.0 0.0 1.0
WBS 8.0 1.0 1.0 1.0 0.0 0.0 0.0 1.0
WBS 9.0 1.0 1.0 1.0 0.0 0.0 0.0 1.0
WBS 10.0 1.0 1.0 1.0 0.0 0.0 0.0 1.0
Digital Celerity LL All Rights Reserved Sponsored by DC Education
CA Clarity PPM™ Community Knowledge Share Monograph
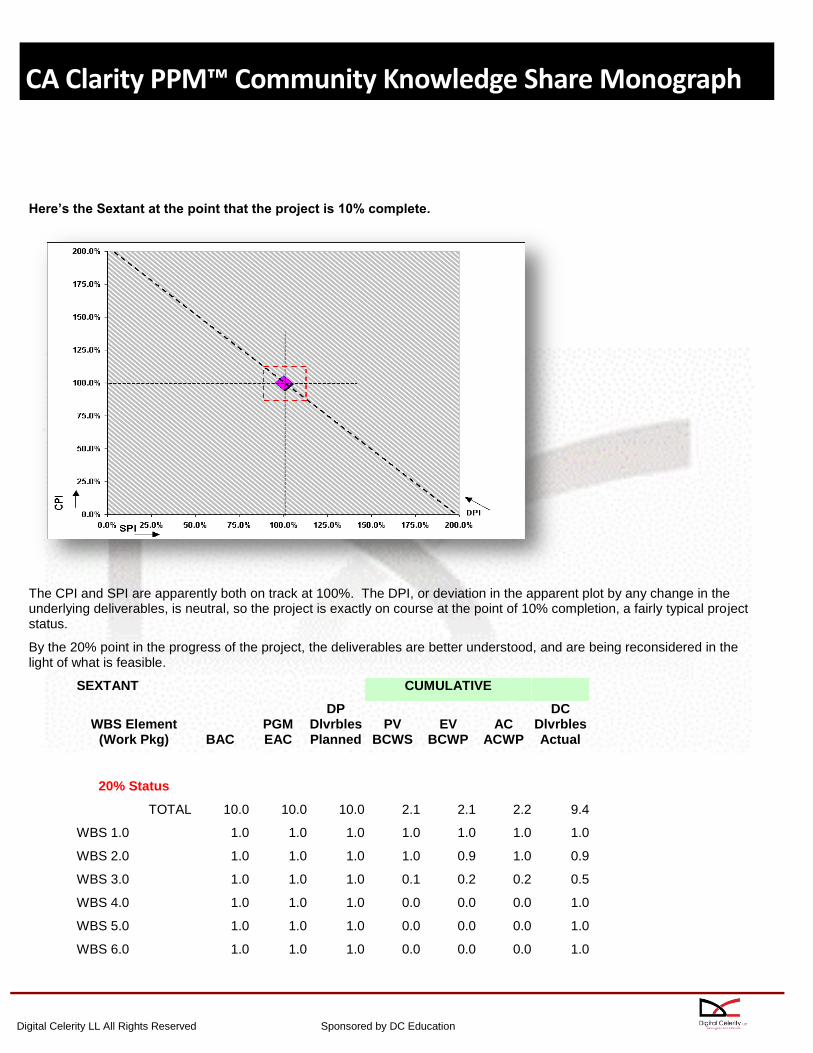
Here’s the Sextant at the point that the project is 10% complete.
The CPI and SPI are apparently both on track at 100%. The DPI, or deviation in the apparent plot by any change in the underlying deliverables, is neutral, so the project is exactly on course at the point of 10% completion, a fairly typical project status.
By the 20% point in the progress of the project, the deliverables are better understood, and are being reconsidered in the light of what is feasible.
SEXTANT CUMULATIVE
WBS Element (Work Pkg) BAC
PGM EAC
DP Dlvrbles Planned
PV BCWS
EV BCWP
AC ACWP
DC Dlvrbles Actual
20% Status
TOTAL 10.0 10.0 10.0 2.1 2.1 2.2 9.4
WBS 1.0 1.0 1.0 1.0 1.0 1.0 1.0 1.0
WBS 2.0 1.0 1.0 1.0 1.0 0.9 1.0 0.9
WBS 3.0 1.0 1.0 1.0 0.1 0.2 0.2 0.5
WBS 4.0 1.0 1.0 1.0 0.0 0.0 0.0 1.0
WBS 5.0 1.0 1.0 1.0 0.0 0.0 0.0 1.0
WBS 6.0 1.0 1.0 1.0 0.0 0.0 0.0 1.0
Digital Celerity LL All Rights Reserved Sponsored by DC Education
CA Clarity PPM™ Community Knowledge Share Monograph
WBS 7.0 1.0 1.0 1.0 0.0 0.0 0.0 1.0
WBS 8.0 1.0 1.0 1.0 0.0 0.0 0.0 1.0
WBS 9.0 1.0 1.0 1.0 0.0 0.0 0.0 1.0
WBS 10.0 1.0 1.0 1.0 0.0 0.0 0.0 1.0
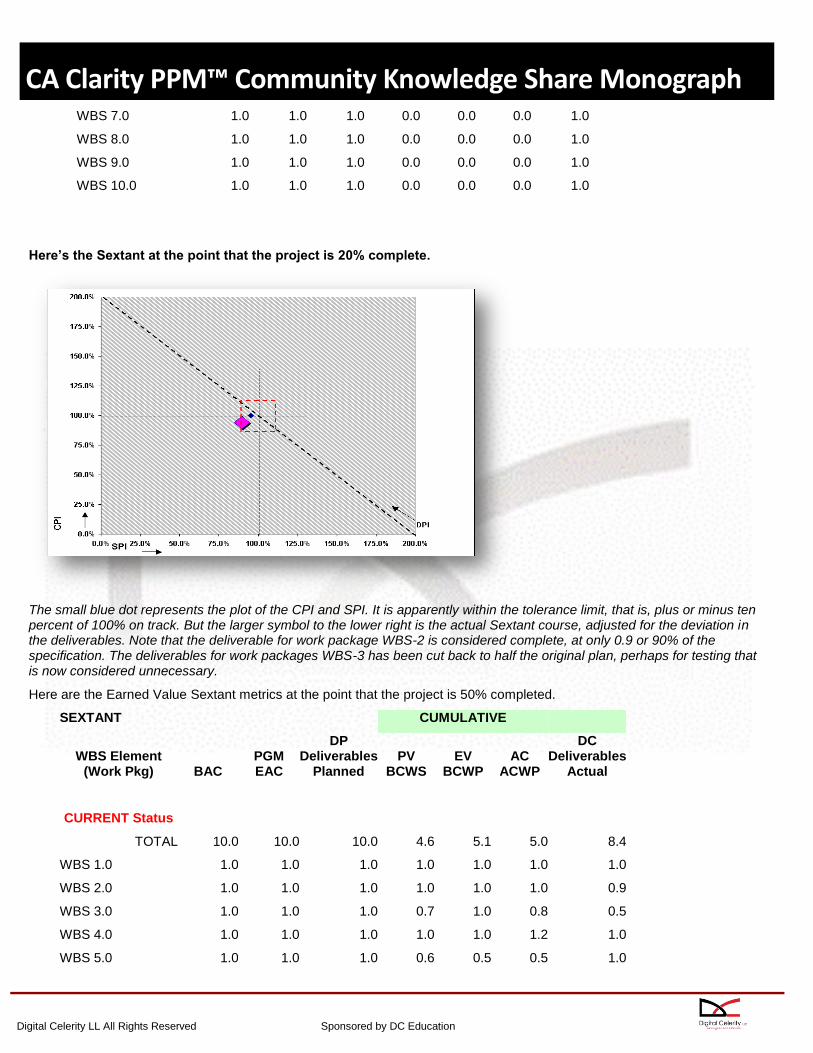
Here’s the Sextant at the point that the project is 20% complete.
The small blue dot represents the plot of the CPI and SPI. It is apparently within the tolerance limit, that is, plus or minus ten percent of 100% on track. But the larger symbol to the lower right is the actual Sextant course, adjusted for the deviation in the deliverables. Note that the deliverable for work package WBS-2 is considered complete, at only 0.9 or 90% of the specification. The deliverables for work packages WBS-3 has been cut back to half the original plan, perhaps for testing that is now considered unnecessary.
Here are the Earned Value Sextant metrics at the point that the project is 50% completed.
SEXTANT CUMULATIVE
WBS Element (Work Pkg) BAC
PGM EAC
DP Deliverables
Planned PV
BCWS EV
BCWP AC
ACWP
DC Deliverables
Actual
CURRENT Status
TOTAL 10.0 10.0 10.0 4.6 5.1 5.0 8.4
WBS 1.0 1.0 1.0 1.0 1.0 1.0 1.0 1.0
WBS 2.0 1.0 1.0 1.0 1.0 1.0 1.0 0.9
WBS 3.0 1.0 1.0 1.0 0.7 1.0 0.8 0.5
WBS 4.0 1.0 1.0 1.0 1.0 1.0 1.2 1.0
WBS 5.0 1.0 1.0 1.0 0.6 0.5 0.5 1.0

Digital Celerity LL All Rights Reserved Sponsored by DC Education
CA Clarity PPM™ Community Knowledge Share Monograph
WBS 6.0 1.0 1.0 1.0 0.2 0.3 0.2 1.0
WBS 7.0 1.0 1.0 1.0 0.1 0.2 0.2 1.0
WBS 8.0 1.0 1.0 1.0 0.0 0.1 0.1 1.0
WBS 9.0 1.0 1.0 1.0 0.0 0.0 0.0 0.5
WBS 10.0 1.0 1.0 1.0 0.0 0.0 0.0 0.5
Here’s the Sextant at this point, fifty percent completed.
Note that the Cost Performance Index, CPI, and Schedule Performance Index SPI indicate the project is within the tolerance limits, ahead of schedule and budget, as shown by the small dot at the top center. However, as shown by the large block to the left, when the Deliverables Performance Index or DPI is applied, the actual project course is behind schedule and over budget. This is borne out by close examination of the table. The work packages WBS-2 and WBS-3 are considered complete (EV of 1.0) but the actual deliverables were reduced to 0.9 and 0.5 respectively. These changes may be legitimate reductions in the testing efforts required, or elimination of specified functions. In any case, since these changes in Scope are rarely reflected in reduced Actual Costs (AC) nor in the PV Budgeted Cost of Work Scheduled. There should be appropriate consideration of the Deliverables Variance and Deliverables Performance Index. When applied to the CPI and SPI, the DPI clearly indicates that the project is off-course at the mid-point of the work.
Even at this early stage the Project Sextant shows a clear and lethal deviation for this project. According to David Christensen and Scott Heise in the National Contract Management Association Journal in 1993, a project’s final CPI will not typically change by more than 10% from the value at the 20% project completion point.
Given the DPI, calculation of Estimated Actual Cost (EAC, or budgeted cost of work remaining BAC divided by the Sextant-corrected CPI) indicates this project will be at least 16% over budget. Moreover, it is known that this simple EAC calculation tends to understate the actual total project cost overrun, if the factors such as rework that caused the deviation from the baseline plan are expected to continue.

Digital Celerity LL All Rights Reserved Sponsored by DC Education
CA Clarity PPM™ Community Knowledge Share Monograph
Now, plotting the Sextant in series can be useful. Simple line/slope extrapolation from the 20% and 50% points produces a Sextant for this project that looks like this.
At this point we can predict that given the project’s twenty-percent course and performance, the final Project Sextant will be approximately 20% over budget and 20% behind schedule.
While the small dot at the center representing CPI and SPI seems to be on track, the Sextant reveals that this project will end up considerable off its course. Management can be forewarned, for example, that if this is a million-dollar effort, there will need to be an additional $160,000 allocated to complete all the deliverables of this project. If this project is a space shuttle mission, it will miss the launch window by 16 days. In either case, a “course change” is needed immediately, before careers are at stake.

Digital Celerity LL All Rights Reserved Sponsored by DC Education
CA Clarity PPM™ Community Knowledge Share Monograph
Summary:
Few of us have the luxury of working on projects with a budget of “whatever it takes”. Instead we plan every penny, predict every deliverable, and answer to every sponsor and investor. The real benefit of the Sextant approach is more than “tweaking” Earned Value. It is the simple underlying logic. The Triple Constraint is well known, and respected in virtually every business discipline. The Deliverables Variance and Deliverables Performance Index is a simple extension of widely accepted Earned Value methods. Together with the CPI and SPI, the DPI reduces complex Earned Value calculation spreadsheets to a simple picture with the intuitive Triple Constraint perspective. So the Project Sextant is a instantly-recognizable method for identifying, and demonstrating, a project’s status. Moreover, a series of Sextant plots presents an unmistakable projection of the project’s true course. Finally, with a sufficient history of projects plotted with the Sextant, an organization can develop an indicative and even predictive tool for project performance within the organization’s own unique constraints, as shown in the two isolated SPI vertical and CPI horizontal perspectives of the following three-dimensional series example.
Note the path of the Schedule Performance Index at the top, looking downward on the 3D history of the project. Note the path of the Cost Performance Index at the bottom, as seen by looking at the course of the project directly from the front. This is representative of the course of most good projects with a mid-project funding gate. There is often a sudden shift in the cost reporting just before the funding gate, followed by a slight “sigh-of-relief” schedule slippage. Then near the end of the project there is often a flurry of rework that is visible in the SPI, and an accumulation of small unanticipated costs affecting the CPI. In each project organization, the Sextant course plots for major projects will often show a distinct pattern corresponding to the organization’s standards, policies, and practices. Knowing this pattern is the means for recognizing when a project team has improved upon standard practice instead of just fudging the numbers.
As a project manager’s tool, the Project Sextant approach is effective at the activity level, sailing to even just one deliverable. It is equally effective for the savvy business manager, at the program level, spotting characteristic behaviors affecting dozens of projects.
© 2011 Steve VanArsdale, All rights reserved

Digital Celerity LL All Rights Reserved Sponsored by DC Education
CA Clarity PPM™ Community Knowledge Share Monograph
Portfolio Management with CA Clarity PPM
Implementing PfM with Best Practices
By: Noland Eidsmoe, PE, PMP, Engagement Manager & DC Education Practice Lead, Digital Celerity
In 1999, Noland Eidsmoe wrote his first article on the topic of project portfolio management (PPM), which was published in the December 2000 issue of PMI’s PM Network titled “The Strategic Program Management Office”. At the time, the PMO concept was in its infancy and not widely accepted, with few articles and no standard practices.
What a difference a decade makes! The Portfolio Management concept, which was accelerated early-on by the need of CIO’s to achieve better alignment with their business customers, is now a generally accepted Best Practice. It was also spurred-on by Enterprise Project Management vendors who naturally promoted the concept through the use of their software tools and services.
When authoring his first article on the Strategic PMO twelve years ago, Mr. Eidsmoe was an accomplished principal consultant with ABT Corporation, providing implementation, training and mentoring services in their Results Management Suite (RMS), which included as a byproduct, a manually-driven and primitive way of performing portfolio management.
Niku Corporation, having enjoyed a successful IPO, purchased ABT’s RMS suite and numerous other companies in the emerging PPM software sector. Following the convergence of its eNiku project management and collaboration software with RMS, Proamics project accounting application and numerous feature sets from other acquired tools, Niku Corporation released Niku 6 which was soon renamed and marketed as Clarity PPM 7.0; a highly evolved application suite with significant project and portfolio management capabilities.
In 2005, CA Technologies (formerly Computer Associates) sought to complete their IT Management and Governance applications offerings and purchased Niku along with its flagship PPM product Clarity. Today, the Clarity suite of Project and Portfolio Management (PPM) software is in its 12
th release, and is known as the premier application of its kind around the
world.
This white paper presents the high-level principles, best practice processes and best practice implementation path for enabling CA Clarity Portfolio Management.
While portfolio management can be implemented at many levels within an enterprise, including the organizational strategic level and departmental tactical level, this paper focuses primarily on the strategic level. Though you will find that most of the principles and best practices contained herein also apply at the tactical level, the business drivers are different, which will result in some variation.

Digital Celerity LL All Rights Reserved Sponsored by DC Education
CA Clarity PPM™ Community Knowledge Share Monograph
Portfolio Management Principals
Portfolio Management is the coordinated management of strategic processes and decisions that enable the most effective balance of organizational Change and Business As Usual. Portfolio Management is a continuous and dynamic process: The environment is continually changing in terms of company political, business driven requirements and strategic necessities for change. This continual change requires an innovative process to continually balance the need for change, with available resources.
The following principles further elaborate on the concepts of Portfolio Management:
1. Project Management is concerned with doing things right, while Portfolio Management is about doing the right
things.
2. The right things are those that contribute most to the organization’s strategic objectives.
3. While Portfolio Management can be based from the bottom up, it is most effective when it is top down.
4. Fully mature project and program management is not a prerequisite to Portfolio Management (it is a nice to have,
not a must have).
5. An executive board should be the driver for Portfolio Management process governance.
6. The Portfolio of changes contains both Current Changes and Future Changes.
7. The Portfolio Management process should control the changes to the Business as Usual.
8. Portfolio Management can easily fit into an annual or quarterly budgeting process.
9. The Portfolio Management processes should be carried out by a PMO; Project Management Office; Program
Management Office; or Portfolio Management Office.
10. A mature organization may find benefits to employing all three types of PMO’s.
11. A PPM application suite, such as CA Clarity PPM (for IT, PSA, and/or NPD), should be incorporated into the best
practice Portfolio Management processes.
12. IT Service Management (ITSM) principles as defined in ITIL (Information Technology Information Library) can be
implemented through the best practice Portfolio Management in CA Technologies Clarity PPM™.

Digital Celerity LL All Rights Reserved Sponsored by DC Education
CA Clarity PPM™ Community Knowledge Share Monograph
Portfolio Management Best Practice Processes
These best practice processes establish the steps and methodology to define the portfolio of investments (changes to the “business as usual”) that are chosen to be implemented – typically through project or program management:
Figure 1: Portfolio Management is a Continuous Process
1. Identify Investments
The inventory of new and on-going investments (business changes) needs to be captured and identified (from strategic objects, ideas, and other requests) so that they can be evaluated and grouped into a portfolio(s). The output from this process is a list of projects and other investments with complete key description information following initial screening of the potential items. CA Clarity PPM™ provides this output as projects, ideas, applications, services and other investment types.
2. Categorize Investments
Once the list of changes are identified, each investment needs to be categorized into pre-determined categories that define such attributes as run the business, or grow the business; each investment’s links to the company’s strategic objectives; and other groupings that define the portfolio. The output from this process is the list of changes that have been organized into categories of similar strategic need – an initial look at balance. CA Clarity PPM™ facilitates this process by providing the attribute category choices for each investment and further incorporating them into display lists.
Portfolio Definition
Portfolio Implementation
Identify Categorize
Evaluate
Select
Prioritize
Balance
Communicate
Authorize

Digital Celerity LL All Rights Reserved Sponsored by DC Education
CA Clarity PPM™ Community Knowledge Share Monograph
3. Evaluate Investments
All relevant information on each investment, such as cost, benefit, risk, resource demand, strategic alignment, priority, and status needs to be collected or determined to facilitate the evaluation and selection process. In this process, the information is then evaluated into a score, resulting from a scoring model approved by the governance board. The output from this process is a scored list of investments. CA Clarity PPM facilitates this process by providing the scoring attribute in the investment and optionally, a series of computational attributes.
4. Select Investments
Based on the categorized and evaluated investment list, the portfolio list of changes can be narrowed down to include only those that are worthy of pursuit. The output from this process is the initial valid candidates. CA Clarity PPM facilitates this process by providing the investment list with attributes to reflect the initial decisions.
5. Prioritize Investments
Next the Investments are ranked within each strategic category based on scoring and other inputs to produce a prioritized investment list within each category or portfolio. Prioritization criteria must be approved by the governance board and typically includes methods to weight key criteria such as strategic alignment, planned cost, risk, benefits and status. The output from this process is the categorized, evaluated and prioritized in a list of investments. CA Clarity PPM facilitates this process by providing analysis tools such as bubble charts to evaluate the portfolio, a “what if” scenarios mechanism to test changes to the portfolio and the resulting investment list with attributes to reflect the initial decisions.
6. Balance Portfolio
Finally the mix of investments is balanced to satisfy goals and strategic objectives, risk level tolerance, resource demand compared to capacity, cost against the portfolio budget, and any other considerations to provide the final portfolio of investments. This may include balancing short-term goals to long-term goals, balancing resource demand to capacity, balancing to the portfolio budget and balancing investment dependencies. The output from this process is the final list of approved investments that comprise the portfolio. CA Clarity PPM facilitates this process by providing a ‘what if’ scenarios mechanism to test changes to the portfolio and by providing the resultant investment list grouped into portfolios, with all evaluated and calculated attributes.
7. Communicate Portfolio
Once the decision on the final portfolio investments have been completed, the results need to be communicated to all stakeholders to reset expectations and reset implementation plans. The output from this process is the communication, based on an approved communications plan, to all stakeholders. CA Clarity PPM facilitates this progression by providing a notification process that communicates directly to investment managers and owners via an action item of the changes they should make to their investments.
8. Authorize Investments
As a concluding step, each investment in the final approved portfolio needs be implemented as project and program plans within CA Clarity PPM. This is a planning or re-planning process based on the results of the approved portfolio. The output of this process is the approved, funded, resource-authorized and planed list of investments. CA Clarity PPM facilitates this process by its built-in project and resource management capabilities.

Digital Celerity LL All Rights Reserved Sponsored by DC Education
CA Clarity PPM™ Community Knowledge Share Monograph
Implementing Portfolio Management with CA Clarity PPM Best Practices
According to the June 2010 Gartner Magic Quadrant for IT Project and Portfolio Management, the CA Clarity PPM application is one of the prominent leaders in the Leadership Quadrant. Given its long history, expansive development and culture of advances, dating back to Niku and ABT, it is easy to understand why CA Clarity PPM is continuously found at the top of the Leadership Quadrant year-after-year.
One of the most significant advantages of using CA Clarity PPM is that it serves an extensive number of disciplines including: Project and Program Management, Demand Management, Resource Management, Financial (Budget) Management, Portfolio Management, and Reporting. Each discipline leverages data created in the other disciplines such that when you get to the discipline of Portfolio Management, much of the data required by the processes already exists in CA Clarity PPM.
Figure 2: Out of the Box, Clarity PPM Data Automatically Flows into Portfolio Management
CA Clarity PPM Demand Management
In Clarity PPM, Demand Investments are contained in Projects, Ideas, Applications, Products, Assets, and Other Work, with projects being the real center point. All investment types can be utilized or only projects, depending on individual organizational needs. The new inventory list of investments is identified and then maintained in the appropriate module within Clarity PPM. New demand can either flow from the Ideas module or be added directly to the projects module with an unapproved and unfunded status. Within each project on the list, a complete set of project management information is created, updated, maintained, and controlled. This includes the project team staffing of resources (both labor and non-labor); the detailed Work Breakdown Structure set of tasks, with resource assignment, estimates, and schedules; risk and issues identification and control; and Financial planning either in simple form or more detailed financial plans based on the resource plans. Together, these fully support all the portfolio management best practices.
Demand
Resources Budgets
PfM

Digital Celerity LL All Rights Reserved Sponsored by DC Education
CA Clarity PPM™ Community Knowledge Share Monograph
Figure 3: Project Listing in Project Management Module
From a total demand standpoint, once all information is captured and identified in Clarity PPM, that demand can be monitored in various views such as the life-cycle funnel view reflecting the stages of the investment list.
Figure 4: View of Demand Inventory by Life Cycle Stage
CA Clarity PPM Resource Management
Just like investments, resources are captured and identified in Clarity PPM and then used to staff projects and other investments to accomplish work. The staffing process is supported in Clarity PPM with resource load balancing tools to help the resource manager and the project manager negotiate the allocation of resources based on their remaining availability. A by-product of this process is that Clarity PPM automatically tracks resource capacity to resource demand. This can be significant in the portfolio management best practice balancing process.
Digital Celerity LL All Rights Reserved Sponsored by DC Education
CA Clarity PPM™ Community Knowledge Share Monograph
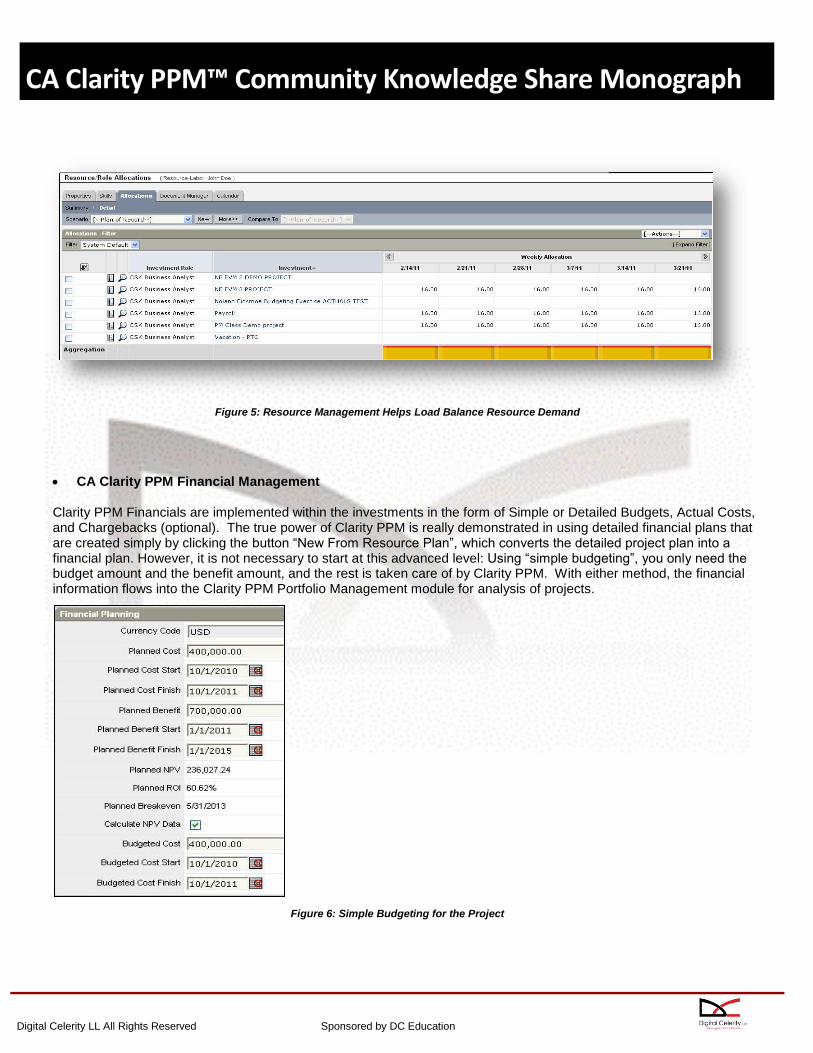
Figure 5: Resource Management Helps Load Balance Resource Demand
CA Clarity PPM Financial Management
Clarity PPM Financials are implemented within the investments in the form of Simple or Detailed Budgets, Actual Costs, and Chargebacks (optional). The true power of Clarity PPM is really demonstrated in using detailed financial plans that are created simply by clicking the button “New From Resource Plan”, which converts the detailed project plan into a financial plan. However, it is not necessary to start at this advanced level: Using “simple budgeting”, you only need the budget amount and the benefit amount, and the rest is taken care of by Clarity PPM. With either method, the financial information flows into the Clarity PPM Portfolio Management module for analysis of projects.
Figure 6: Simple Budgeting for the Project

Digital Celerity LL All Rights Reserved Sponsored by DC Education
CA Clarity PPM™ Community Knowledge Share Monograph
CA Clarity PPM Portfolio Management
Within the Portfolio Management module, portfolios are created following the best practice portfolio management (PfM) processes identified earlier. A portfolio is created simply by selecting the projects or investments from those already created in Clarity PPM.
The list of investments that form the portfolio can be displayed in the Scorecard view that displays many of the key metrics used in the processes used in the selection of the portfolio investments.
Figure 7: Investment in the Scorecard view Used in the PfM Processes
Digital Celerity LL All Rights Reserved Sponsored by DC Education
CA Clarity PPM™ Community Knowledge Share Monograph
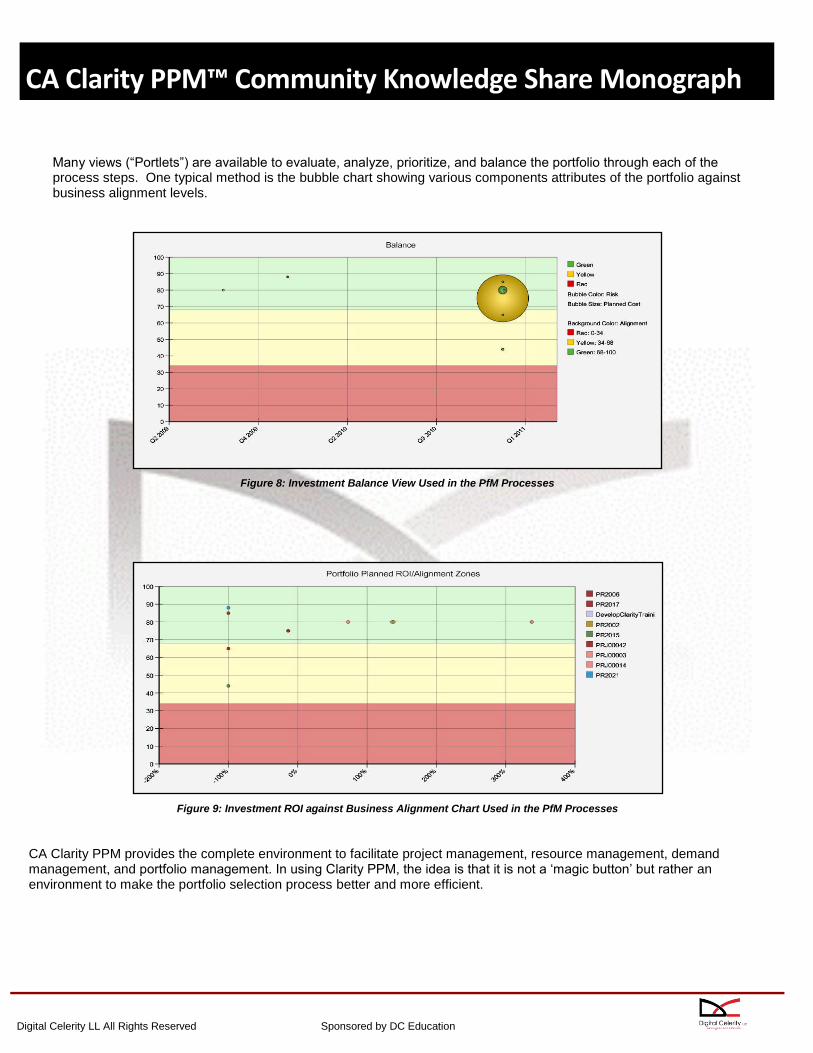
Many views (“Portlets”) are available to evaluate, analyze, prioritize, and balance the portfolio through each of the process steps. One typical method is the bubble chart showing various components attributes of the portfolio against business alignment levels.
Figure 8: Investment Balance View Used in the PfM Processes
Figure 9: Investment ROI against Business Alignment Chart Used in the PfM Processes
CA Clarity PPM provides the complete environment to facilitate project management, resource management, demand management, and portfolio management. In using Clarity PPM, the idea is that it is not a ‘magic button’ but rather an environment to make the portfolio selection process better and more efficient.

Digital Celerity LL All Rights Reserved Sponsored by DC Education
CA Clarity PPM™ Community Knowledge Share Monograph
Demand Management with CA Clarity PPM™
Using Demand Management to Manage the Pipeline
By: Richard Shapiro, Engagement Manager, Digital Celerity LLC
Understanding the Pipeline
Those that are close to organization Governance and the constant tradeoffs between opportunities, projects
and limited resources acknowledges that being able to clearly and proactively see the pipeline of work before
it becomes approved is a critical success factor of the overall Governance effort (choosing what actually
becomes approved, and then mapping consistently with how the work will be executed), and impacts the
level of success of the organization. To this end, many organizations have chosen to adopt a proactive
governance process for demand management. Two common and compelling reasons are:
1) Economic realities compel organizations to do more with less; and
2) Constantly shifting priorities impede the successful completion of their current pipeline of
commitments.
Innovative project management organizations are successful, in large measure, because they have
developed ways to monitor, prioritize and control the pipeline. They are consistently better at
quantitatively, and qualitatively assessing the priority of incoming Ideas, and have used that control
to maximize their use of limited resources.
The pipeline consists principally of three (3) work types:
1) Items (ideas) that turn into funded project initiatives to create new products and/or
services
2) Items that enhance and/or add to existing products and/or services
3) Items that increase support and maintenance efforts
These three (3) work types can be broken down further into:
1) Revenue generating ideas
2) Cost avoidance ideas
3) Products and/or Services to grow the business
4) Legal mandates and regulations
5) Support/Maintenance efforts
At either end of this spectrum, the decision model is pretty straightforward. Bad ideas are not good for the
business, are bad investments for IT on their own standing or by comparison, not connected at the core to the
IT Value Structure for the enterprise, or in plain language, just flat out hair- brained. Required work shares
the same simple decision model, as do the Operations / Break Fix variety of work, except that they are at the
other end of the Value Spectrum.

Digital Celerity LL All Rights Reserved Sponsored by DC Education
CA Clarity PPM™ Community Knowledge Share Monograph
They are good for the business to the degree that there is no reason not to do them, they are good
investments for IT on their own regardless of the existence of other supporting initiatives, they are directly
connected to the goals and objectives of either IT, the Organization or both, or are Regulatory obligations that
cannot be staged, postponed, or otherwise denied.
It is the middle of this Spectrum where most "decisioning" work is required, sometimes in consideration of the
"Required and the "Ops / Break Fixes" that simply have to be accommodated. That decision process can loosely
be considered the fundamental center of true Demand Management.
What ENTERS the DEMAND PIPELINE Queue and Why?
If your Organization is like most; this list of work-candidates are largely billed (via the GL) to the following
categories, or something similar to them:
1. Bad Ideas - Hopefully do not show up anywhere in the GL, or as a "Project" / Investment
2. Nice to Haves - No invoice, or show up in the GL as a "Project" / Investment
3. Good Ideas - Hopefully show up as a "Project" / Investment
4. Required - Surface as a "Project" or as a component of an annual portfolio work plan for compliance
5. Operations (Ops) / Break Fix - In the case of Ops work, bills to the GL via an annual operations plan
(KTLO, Run the Engine, etc), or in the case of Break Fix, shows up in the GL Help Desk or Support tickets, and
is applied against an annual work plan.
For the purposes of this discussion, we will abandon the "Bad Ideas" candidate group altogether for obvious
reasons. We will also consider the Ops / Break Fix group to consist of "non- project" work. What we will focus
upon are the "Items that turn into full blown IT project work or investments,” work candidates 2, 3, and 4.
Can’t Stop the Rain
IT cannot restrict the amount of work that is requested by the organization. We can't say: "Please stop asking us to
build things / enhance things / fix things for you. We don't have the resources to do any more."
The battery of questions we ask ourselves shouldn't focus on whether we do more "work" in response to requests from
the organization; it should rather be:
1) Based upon current constraints (resources / skills), which work from "the wall" should we execute?
2) Based upon estimated easement of current constraints (more resources, current initiatives canceled,
etc) which additional work could we take on to optimize the value of the portfolio?
Notice the reference to the "P" wordportfolio. I can almost hear you from here: "Hold on a minute, Demand
BoyI thought we were talking about Demand Management, not Portfolio Management!" Well, we are, but
if the process of deciding the work that should be done (based upon established criteria) is a fundamental
principle in true Demand Management, then I'll go ahead and step out on a limb and say (and you should
too):

Digital Celerity LL All Rights Reserved Sponsored by DC Education
CA Clarity PPM™ Community Knowledge Share Monograph
"True Demand Management is the first stepping stone to true Portfolio Management, and therefore, the value and
health of the portfolio is only as robust as the mechanism by which the IT organization manages Demand.
The "Demand Management Maturity Model" as expressed below will more often than not describe predictively whether or not the portfolio is approaching value optimization, and whether in fact it is as healthy as it could be.
Illustration #1 Demand Management Maturity Model
You'll notice that the key differences from station to station as the organization moves along the scale are largely based
upon the level of proficiency with which the organization receives, qualifies or disqualifies, & prioritizes requested work.
Included in the development of proficiency, as you'll note, is the creation and broad (if not universal) adoption of a
consistent and controlled mechanism by which the work is requested.
There are several important characteristics that this mechanism must possess to truly be effective and successful on an
enterprise scale.

Digital Celerity LL All Rights Reserved Sponsored by DC Education
CA Clarity PPM™ Community Knowledge Share Monograph
1. Request-making access to the mechanism must be controlled (rights-based access) Without this caveat in
place, any mechanism will tend to become a "suggestion box", or a repository for ideas, both good and hair-
brained. Only "qualified" requestors should have access to this mechanism. This list may consist of
representatives of the organizations customers, but should never include all "customer" resources.
2. The mechanism must be scalable In cooperation with Condition 1 above: If your
user group of "qualified requestors" is less than 20 people who each process 5-10
requests for work each week, there's no point in deploying a tool that it's designed and
developed to handle an upper limit of 10,000 requests a month, which is typically at the
low end of most Help Desk or CSC-type applications. You'll never take advantage of the
headroom in the database, and if you acquire it expressly to manage Demand, you will
have over-spent, and made some software salesperson very happy.
3. There should be appropriate traceability from cradle to grave - encompassing the entire lifecycle of
the "work candidate" it's conversion to an actual project, and the entire lifecycle of that resulting project.
4. The mechanism should allow for the composition of review parties, panels or councils - and would
ideally be the repository for any and all information necessary for the party, panel or council to render a go -
no go decision on any single request.
5. In driving the request thru the approval process (recommended based upon size, scope, potential return)
the mechanism SHOULD take advantage of current architecture, procedures and processes in "maturing"
the "work"in other words, it should be easy and clean to simply take a request for work and convert it into a
projectthe enterprise should not have to radically change its operating mechanisms to comply with the
mechanism, the mechanism should bend to the enterprise. The mechanism should provide either an
analysis platform by which the request-for-work can be prodded, probed, dismantled and dissected, or it
should accommodate the loading and storing of externally developed analysis for cost / benefit research.
7. There should be a bona-fide connection between real enterprise financial information and the
mechanism to support the analysis above.
8. The mechanism should provide complete visibility into the existing portfolio as well as the queue of
requested work to appropriately compare work candidates against not only one another, but against
initiatives already underway. Let's not forgetsometimes, it makes sense to stop a current project to make room for a
"new" project. That doesn't necessarily mean the current project was a mistakeit simply means that
something better has come along.
9. The mechanism should have a robust output and storage functionality to facilitate future decisions, as
well as to review with the client when they inevitably ask: "What have you done for me this year?"

Digital Celerity LL All Rights Reserved Sponsored by DC Education
CA Clarity PPM™ Community Knowledge Share Monograph
10. To provide for a gated approval process (recommended based upon size, scope, potential return,
etc), the mechanism should provide automation and workflow in progressing the request review
lifecycle, with jumping off points throughout. Self- containment, built in interfaces, or export
functionalities are critical. Automation or the click of a single button seems to make people the
happiest.
A major Midwestern financial institution, which had made a commitment to better prioritizing their queue of
work candidates, elected to leverage a tool that already existed in their environment. As a portion of their
scheduled Clarity PPM upgrade, the organization elected to roll out a portion of the Demand Management
Module available in the out of the box configuration of Clarity to complement their pre-existing Help Desk
platform. Service tickets (incidents) and similar work would continue to be routed to their service platform,
and Clarity would be the application of record for the staging and marshalling of "Project-Type" work
candidates. What was unclear as they made their decision was how this Demand Management module
would be configured to accommodate their requirements. Out of the box, Clarity is installed with two
specific functionalities within the Demand Management Module. The first is a mechanism to capture and
catalogue "Ideas"ideas for new products, assets, projects, etc., all of which can be directly (within the
application) converted to a Project. The second is a mechanism to capture "Incidents", which could be
considered help desk related itemsbreak fix, desktop . assistance, etc which would normally be routed via a
true Customer Service / Help Desk platform.
By all accounts, the "Incidents" component of the Demand Management module in Clarity is not as robust as many
of the other utilities and apps that are available in the marketplace, and was never intended to be. In fact, even the
un-initiated will note that Computer Associates (the owner of the Clarity application) already has a highly robust
Service Management Solution in CA ITSM, so it is clear that the "Incident" component of the Demand Module in
Clarity is a leftover design augmentation from the Niku release documentation developed before CA acquired Niku
and hence Clarity. It's just sitting there, waiting to be leveraged.
However, a highly desirable and well thought out design characteristic that emerges from a closer inspection of
both the Idea "object" and the Incident "object", is that both are designed out of box to quickly and easily become
other objects when necessary. Think of it this way: Somebody in your organization comes up with a good
"Idea" for a project, or a service, or a product, or some other asset that creates value for the organization.
Suppose this person actually recorded their "Idea" in Clarity and sent it through the organization's review process
(whatever it may be). Further suppose that since the specs for the "Idea" are fully encapsulated within a specific
location, and can be exploded for review simply and easily, the review process becomes more virtual and
distributiveyou don't have to gather in the war room to discuss it amongst the decision makers / influencers.
Finally, imagine that this good "Idea" really is a "good" Idea, and you want to put it in motion.

Digital Celerity LL All Rights Reserved Sponsored by DC Education
CA Clarity PPM™ Community Knowledge Share Monograph
Thanks to some well- designed code, Clarity will allow you to left click on a button, and with the appropriate access
rights, convert this "Idea" into a project, product, asset, or "other" investment which will be stored within the Clarity
database and visible from other modules.
At first glance, this would appear to be a perfect candidate for a work request queuing mechanism. If I want to request
project work, all I have to do is submit an "Idea", right? Well, yes, but what if the "idea" you've come up with isn't really
big enough or unique enough to become its own full-blown work plan? What if it looks more like a component (task,
activity, or phase) of an existing work plan, say for example, an annual operating work plan? Well, here's the rub with
the Idea "object"Clarity "Ideas" cannot be converted into a task on an existing projectsay for example, a task on an aggregate, annual
operations or non-project development work plan. Unfortunately, that single hitch will get in the way rather frequently in
most organizations. Ah, but the "Incident" objectwhat about it? Can "Incidents" be converted the same way into projects
OR tasks? Happily, the answer is "Yes, as slick as a Denver freeway in January".
This little factoid, in concert with the fact that the "Incident" object would have simply languished there on screen
(and would never have been capitalized upon due to Peregrine's presence on the property), led us to decide to
leverage the "Incident" object in the creation of a true "Work Request" object, which serves as the queue for all IT
Project work. What's more, the "Incident" object has an "Audit Trail" functionality, which allows visibility into major /
minor events in the lifecycle of the object, as well as an "Associations" view, which allows the user to see which (if
any) projects or tasks the "Incident" has spawned. Lastly, we leveraged the "Incident" object because not only can it
give way to either a project or a task, but it can also be converted multiple times, which accommodates the very real
possibility within this organization that a single request may be global enough to spawn several projects or tasks.
To begin, we had to ask the question: "What is a Project?"
Generally speaking, most organizations can qualify a request as a "Project Request" by the size of the effort, either in
dollars or in hours. This particular client didn't have an enterprise standard by which to answer this question already in
place, nor did they have any global "demand" tools at their universal disposal. Everybody went about it in a different
way, via a different mechanism, from spreadsheets to complex Lotus Notes databases. So not only did we not have a
universal model from which to pattern our "Work Request" (instead we had broadly variant and divergent requirements),
we also didn't have processes, procedures, or business rules from which to build. Bring out the Requirements Analysts!
After several long weeks of eliciting and documenting requirements for the "Work Request", we were able to
arrive at the roles, processes and business rules by which the organization would live and to which the
application would bend. We set about the actual configuration of the app, and by the use of large-scale JAD
sessions and review panels, the first prototypes we turned over for review (consisting of re-labeled
attributes, custom fields, suppression of non-related attributes, and financials) morphed over the course of
90 days into what is today the enterprise standard for the request, analysis, and approval of IT Work.

Digital Celerity LL All Rights Reserved Sponsored by DC Education
CA Clarity PPM™ Community Knowledge Share Monograph
An overview of the process is illustrated below:
Throughout the process, the requestor is merely the catalyst for the creation of the record in the database. We designed
our process in this fashion because within this particular organization, the folks who request the work are the customers
of IT, the business. Their requests are represented by a Demand Manager (rather than approved by one) within this
process, and it is the Demand Manager who becomes the champion for the request, shepherding it from creation thru
realization, and even into its next lifecycle as a Project or Task.
Hence, the Requestor has one view of the request itself, at its most generic and basic level, and all other roles within
the process have more robust and granular views of the Request.
Since Clarity PPM does not provide any degree of field level security, this "separate views" requirement was tricky. By
the use of sub-objects and display conditions, we were able to create display scenarios in which the requestor enters
the high level details of the request (which can include attachments, etc), but can never see any more of the request. In
this organization, the Requestor is locked out of the review process after having submitted the case for doing the work.

Digital Celerity LL All Rights Reserved Sponsored by DC Education
CA Clarity PPM™ Community Knowledge Share Monograph
The Assessment Teams can see the Requestors' view as well as a second view of their own used for estimating and
analyzing hours, dollars and impact to the portfolio.
The Approvers can see an additional third view for funding information and approval signoffs, and finally the Demand
Manager would see all of the above and be able to augment them via his / her own sub-object (not seen by the
Requestor) and portlet (also not seen by the Requestor). Notice that the process shown above is gated. In this
dramatic oversimplification, we've listed four gates. In actuality, the Work Request Lifecycle within this organization
consists of eleven different "states" that the request may lie in on its way to ultimately being approved as a project or
task, or being rejected. We leveraged the "Category" attribute to list these states by adding the appropriate values to
the "Browse Category" lookup, and suppressing the values that already existed there. Between specific gates, almost
surgical activities are prescribed, from high level analysis of the request for general value and completeness, down to
role-and- infrastructure-based building of detailed estimates for the eventual work, which can then be leveraged in the
decision making process.
To facilitate tracking and reporting, we applied Clarity workflow (process) to the object, created around the transition
from value to value in the "Browse Category" lookup. The workflow is complete with reminders, notifications, and
systems actions that will automatically or manually reposition the request status in the process flow based upon
events in its lifecycle and interventions by shepherds and decision makers / influencersright down to terminating the
request if not progressed from its current state (whatever that state is) within an appropriate period.
By the use of delivered Clarity data elements, a robust set of business rules, competent modeling and mentoring, solid
business processes, and some creative custom data elements and objects, the "Incident" in Clarity is now a fully
functional work requesting vehicle for a organization with 9000 potential requestors and upwards of 5000 IT projects in
flight at a timeand to think: they all start out as "Incidents"the Clarity platform has found yet another place among the most
versatile and effective applications in the enterprise project management marketplace.

Digital Celerity LL All Rights Reserved Sponsored by DC Education
CA Clarity PPM™ Community Knowledge Share Monograph
Using Microsoft Project with CA Clarity PPM™
Understanding Microsoft Project Task Types
By: Rich Guard, Managing Director & Principal Consultant, Rich Guard & Associates
A Tutorial - Understanding Microsoft Project Task Types and Clarity Opening a Microsoft Project (MSP) project schedule that has been stored in a Clarity project repository, at first glance seems like a simple task. Continue to inspect the file with this first impression in place, and soon you will be surprised, very surprised. “Surprised? What kind of surprises?” Well, when a project manager initially opens a project from Clarity into MSP, he or she may see that:
The project finish date have slipped, or
The total hours of work for the project, a phase, activity, or task have increased or decreased, or
The task start date or finish date for one or more key tasks are earlier or later, or
Tasks now are project milestones.
These are a few of the many changes that may appear when a project manager opens his or her project schedule from Clarity. Digital Celerity’s Best Practices Using MSP with Clarity training and mentor-coaching enables the CIO or PMO Director to minimize the effects of these risks to project data by focusing the project manager on the key task at hand: Realigning the project schedule with expectations without chasing answers to endless questions that typically ask some form of “Why did it do that?” And, in following the suggested alignment process the project manager will begin to gain more and more insight into just that question: “Why did it do that?” See the bottom of the last page of this tutorial for more information on how Digital Celerity can support and assist you and your organization’s project managers to use both Clarity and Microsoft Project more efficiently and effectively. Overview This article is a brief guide and tutorial to working with a Microsoft Project schedule that has been stored in the Clarity project data repository. The article contains a discussion of the Microsoft Project task attribute, Task Type. There are three Task Types: Fixed Units, Fixed Duration and Fixed Work. Fixed Units Task Type When you assign a resource to a task, you specify the assignment units in the Units field of the Assign Resources dialog box. You can see the units in the chart portion of the Microsoft Project Gantt Chart view. By default, the units appear with the resource name next to the Gantt bar (except when the assignment units are 100 percent). The Fixed Units task type dictates that the percentage of assignment units on a task remain constant regardless of changes to duration or work. This, for many Microsoft Project users, is the default task type because it’s the task type that fits most project tasks. If you increase task duration, Microsoft Project will not require that you to find another resource or force a 50% resource to work 100% in an assignment.

Digital Celerity LL All Rights Reserved Sponsored by DC Education
CA Clarity PPM™ Community Knowledge Share Monograph
Changes to a Fixed Unit task create these results:
If you revise the duration, work also changes, and units are fixed.
If you revise work, duration also changes, and units are fixed.
If you revise units, duration also changes, and work is fixed.
Fixed Work Task Type When you assign a resource to a task, the task’s duration is translated into work. You can see the amount of work in the Task Usage or Resource Usage view. The Fixed Work task type dictates that the amount of work on an assignment should remain constant regardless of changes to duration or units. Changes to a Fixed Work task create these results:
If you revise the duration, units also change, and work is fixed.
If you revise units, duration also changes, and work is fixed.
If you revise work, duration also changes, and units are fixed. Fixed Duration Task Type When you create a task, you specify the task’s duration in the Duration column of the Gantt Chart or other task sheet. In using the Gantt Chart view, a Gantt bar for the task is sized according to the duration that you established. The Fixed Duration task type dictates that the task duration should remain constant, regardless of changes to units or work. Changes to a Fixed Duration task create these results:
If you revise units, work also changes, and duration is fixed.
If you revise work, units also change, and duration is fixed.
If you revise the duration, work also changes, and units are fixed. Summary Changes to a Fixed Units task create these results:
Revise the duration, work also changes, and units are fixed. Revise work, duration also changes, and units are fixed.
Revise units, duration also changes, and work is fixed.
Changes to a Fixed Work task create these results:
Revise the duration, units also change, and work is fixed.
Revise units, duration also changes, and work is fixed.
Revise work, duration also changes, and units are fixed.
Changes to a Fixed Duration task create these results:
Revise units, work also changes, and duration is fixed.
Revise work, units also change, and duration is fixed.
Revise the duration, work also changes, and units are fixed.

Digital Celerity LL All Rights Reserved Sponsored by DC Education
CA Clarity PPM™ Community Knowledge Share Monograph
A Few Implications to Consider
The project resource who charges more Work (hours) to a Fixed Work or Fixed Units task than the Remaining Work assigned to him will cause the task Finish Date to extend.
The Project Manager who increases the Work (hours) of a resource assigned to a Fixed Units task will cause the task Finish Date to extend.
The project resource who charges less Work (hours) than the Work assigned to him in the current period (timesheet) of a Fixed Units task will cause the task duration to reduce and change the task Finish Date to an earlier date.
o For the Clarity customer who has invested but has yet to realize fully the power of Clarity, the MSP with Clarity
o Mentor/Coaching Program is the training and knowledge transfer solution that ensures Program and Project Managers are doing the right things and doing those things right. Unlike training course-only knowledge transfer solutions, the MSP with Clarity Mentor/Coaching Program combines classroom training led by experienced professional project managers followed by a series of one-on-one mentor/coaching sessions facilitated by an experienced mentor coach in which PM principles along with MSP and Clarity techniques and tips are applied to real-world, enterprise projects.

Digital Celerity LL All Rights Reserved Sponsored by DC Education
CA Clarity PPM™ Community Knowledge Share Monograph
Using Loading Patterns with Open WorkBench™
Quick Reference Guide
By: Digital Celerity, DC Education
Description Loading Patterns within Open Workbench (OWB) provides the option to control the way in which a resource’s work effort is disturbed across the duration of a task. Loading Patterns are set for each task assignment independently, however a default pattern is applied the moment a resource is assigned to a task. The Project Manager will determine the best Loading Pattern for each of the resources assigned to the tasks within the WBS, typically as the project schedule is being planned. The most appropriate Loading Pattern for the resource assignments will be applied by the Project Manager throughout planning and will typically be based upon the type of work being undertaken. This guide highlights the main differences between each of the Loading Pattern types and how to apply them, once resources have been assigned to tasks. General Guidelines:
The Default Loading Pattern: is set via Tools>Options>Default>Loading Patterns and will be applied as each resources is initially given a task assignment.
The are 5 Loading Pattern types:
o Front: allocates usage as early in the task as possible
o Back: allocates usage as late in the task as possible
o Contour: attempts to allocate the same usage amount for each day of the tasks duration, contingent on resource availability
o Uniform: allocation the same usage amount for the days within the task’s duration. During ‘Autoschedule’, a uniform-loaded task may be shifted to a later date in the schedule, if there is an over-commitments of resources
o Fixed: is a user specified resource usage, input manually for each day of the task’s duration.
Note - uncompleted work on a fixed-loaded tasks, is not carried forward after tracking
o Predecessor:
o Successor:
Work Effort: refers to Estimate To Complete (ETCs), the planned hours a resource is scheduled to work upon a task or the Actuals which are subsequently tracked once work has started.
Autoschedule: is a function which applies a complex algorithm to calculate the most efficient project schedule. The
Autoschedule result, is determined by the information documented within the WBS, including assignment Loading Patterns.
This document describes the steps performed by Project Managers to:
Setting a default loading pattern
Locating a suitable view
Applying Loading Patterns
Reviewing over-commitments
How Autoschdule can be applied

Digital Celerity LL All Rights Reserved Sponsored by DC Education
CA Clarity PPM™ Community Knowledge Share Monograph
Process Prerequisites Recommended training before undertaking these steps:
Using Project and Resource Management with Clarity PPM
Using Open Workbench with Clarity PPM
Process Steps
Action Result
Setting a Default Loading Pattern
1. Within the top menu options, select Tools, then Options and click on the Defaults tab
The default Loading Pattern is displayed within the Assignments section of the dialog box.
Note: the default Loading Pattern is populated at the time OWB is installed onto the user’s machine. Historically the default pattern for Target has been Uniform, however this may vary depending upon when OWB was installed.
2. Click on the dropdown value to the right of the Loading Pattern
field
The 5 Loading Pattern options are displayed within the list.
3. Select the preferred Loading Pattern, then click the ‘OK’
button
The new Loading Pattern has been saved as OWB’s default.
Accessing a suitable view
4. Click on the ‘Revise Schedule’, within the Weekly Maintenance
library group
The Revise Schedule view displays the project resource assignments and the relating effort
within the right-hand time-scaled pane.
Note: the effort within this view are Estimate to Complete (ETCs) only
5. Review the Loading Pattern
column within the view The Loading Pattern column will display the default Loading Pattern for each of the new resources assigned to tasks.
Note: Loading Patterns only can only be applied to resources (roles or named individuals),
therefore if the Loading Pattern cell against a task appears blank, then no task assignments have been undertaken.
6. Review the effort distribution within the Timescaled pane (top right pane) of the view
The ETCs displayed here, are the result of the Loading Patterns selected for each of the resources assigned to the tasks.
Hint: The timescale can be modified (for example to days or months), by clicking within the date header area of the timescale pane, then select the preferred Period and Scale options.
7. Assign a resource to a task with ETC
The resource has now been given a task assignment.
Note: for further information on how to undertake task assignments, see [[Assigning Resources to tasks within Open Workbench]]
Applying Loading Patterns
8. Against the assigned resource, click on the dropdown in the Loading Pattern field, then select ‘Front’ and click on any
other cell, to action the selection
The usage (ETC effort) on the task has been distributed to be performed as soon as possible.

Digital Celerity LL All Rights Reserved Sponsored by DC Education
CA Clarity PPM™ Community Knowledge Share Monograph
The example used will show a resource with a daily availability of 8 hrs and working on a project task with a fixed duration of 5 days, with an assigned ETC of 25 hrs.
9. Click on the dropdown in the Loading Pattern field, then select ‘Back’ and click on any
other cell, to action the selection
The usage (ETC effort) on the task has been distributed to be performed as late as possible.
10. Click on the dropdown in the Loading Pattern field and select ‘Contour’, then click on
any other cell, to action the selection
The usage (ETC effort) has been distributed evenly across the task with the same usage amount for each day of the task’s duration, contingent on resource availability.
Note: even though the effort has been evenly distributed, if the assigned resource has any over-
commitments for the same dates, the daily
11. Click on the dropdown in the Loading Pattern field and select ‘Uniform’, then click on
any other cell, to action the selection
The usage (ETC effort) has been distributed evenly across the task with the same usage amount for each day within the task’s duration.
Note: During ‘Autoschedule’, a Uniform-loaded task may be shifted to a later date in the schedule, if the assigned resource has any over-commitment for the same dates.
12. Click on the dropdown in the Loading Pattern field and select ‘Fixed’, then click on any
other cell, to action the selection
The Fixed Loading Pattern against the resource has been selected.
13. Manually enter the ETC values directly into each of the required date cells, within the right timescaled pane
The usage (ETC effort) has been entered directly into the days the resource is required to work on the task.
This pattern is a user specified type, therefore the hours are entered manually for each day (or weekly, monthly, etc) of the task’s duration. The ETCs are totaled automatically into the ‘ETC’ column for the resource.
Note: any uncompleted work on fixed-loaded tasks, will not be carried forward after tracking.
Reviewing the Over-Commitments
14. Review any resource over- Any ETCs greater than the resources daily availability, will show as an over-commitment, which

Digital Celerity LL All Rights Reserved Sponsored by DC Education
CA Clarity PPM™ Community Knowledge Share Monograph
commitments (highlighted in gold), within the bottom pane of the view.
may need to be resolved.
There are two methods which can be applied to resolve any over-commitments, while respecting the applied loading patterns.
Manually – by editing (re-distributing) the ETCs directly the timescale pane, so the total
hours for any given period do not exceed the resources availability. This includes moving task dates and/or modifying the task duration, as hours are re-distributed.
Automatically – by selecting the ‘Autoschedule’ function (via Tools>Autoschedule), an optimized schedule can be calculated. It takes into consideration the resources availability, parallel running activities and Loading Patterns, along with other components captured within the WBS.
How Autoschdule can be applied
15. Using the scenario in the previous step (s.14):
A task with a ‘Front’ Loading Pattern assignment, with 25 hrs ETC
A task with a ‘Fixed’ Loading
Pattern assignment, with 2 hrs ETC on two separate days
Click Autoschedule (Tools>Autoschedule)
Enter a date within the ‘Start Date’ field of the Autoschdule dialog box, aligning to the start date of the tasks which need resolving
Click ‘OK’ to run Autoschedule
The Fix-loaded ETC values have been respected as a ‘must happen on’ work for the resource;
therefore they take a higher priority than the Front-loaded task, as this Loading Pattern is the more flexible of the two types.
The Front-loaded task will still be respected next by Autoschedule, as it re-distributes the ETCs as early as possible across the task, without over-committing the resource.
The results of the applying Autoschedule are:
The Fixed-loaded task is respected first and those hours a not moved
The Front-loaded task is respected, however as this is a flexible Loading Pattern, the daily hours are re-distributed with different amounts to resolve the original over-commitment.
Note: Autoschedule can be used as a ‘what if’ scenario when planning. However f the results are not acceptable, then use the ‘Edit>Undo’ within the top menu or ‘close’ the project without saving, to return the schedule to its original state.
For further information about Autoschedule, see [[Using Autoschedule within Open Workbench]]
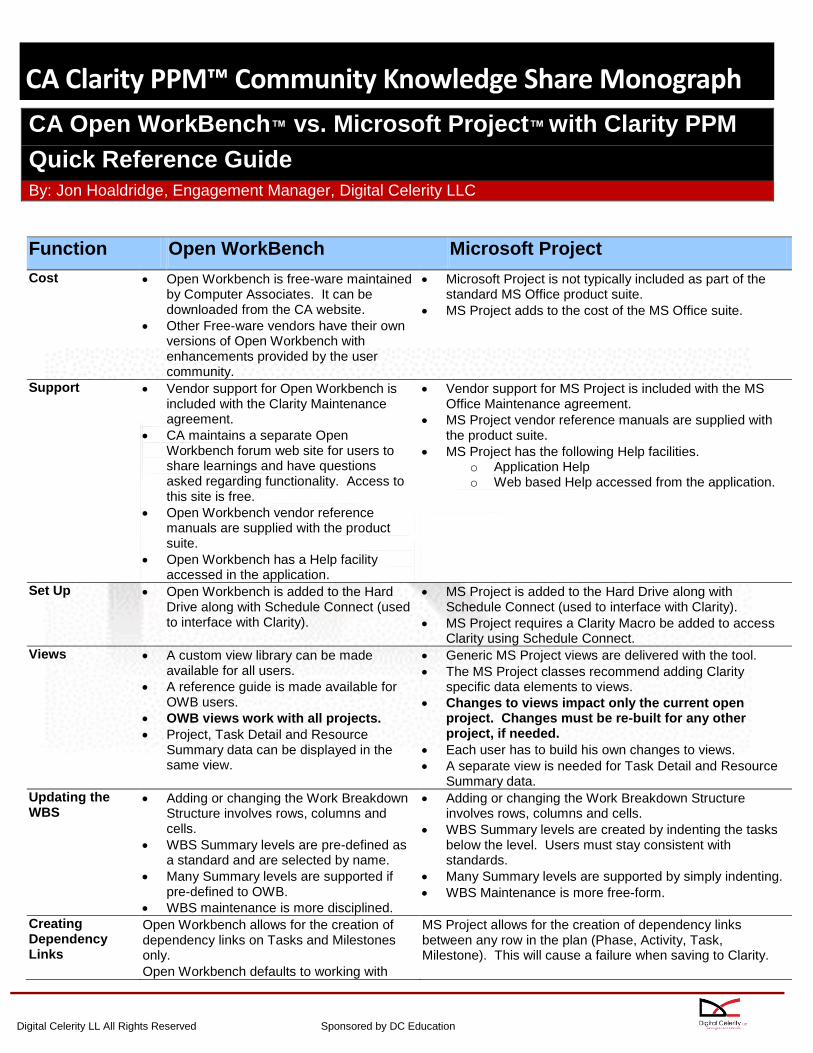
Digital Celerity LL All Rights Reserved Sponsored by DC Education
CA Clarity PPM™ Community Knowledge Share Monograph
CA Open WorkBench™ vs. Microsoft Project™ with Clarity PPM
Quick Reference Guide
By: Jon Hoaldridge, Engagement Manager, Digital Celerity LLC
P Function Open WorkBench Microsoft Project
Cost Open Workbench is free-ware maintained by Computer Associates. It can be downloaded from the CA website.
Other Free-ware vendors have their own versions of Open Workbench with enhancements provided by the user community.
Microsoft Project is not typically included as part of the standard MS Office product suite.
MS Project adds to the cost of the MS Office suite.
Support Vendor support for Open Workbench is included with the Clarity Maintenance agreement.
CA maintains a separate Open Workbench forum web site for users to share learnings and have questions asked regarding functionality. Access to this site is free.
Open Workbench vendor reference manuals are supplied with the product suite.
Open Workbench has a Help facility accessed in the application.
Vendor support for MS Project is included with the MS Office Maintenance agreement.
MS Project vendor reference manuals are supplied with the product suite.
MS Project has the following Help facilities. o Application Help o Web based Help accessed from the application.
Set Up Open Workbench is added to the Hard Drive along with Schedule Connect (used to interface with Clarity).
MS Project is added to the Hard Drive along with Schedule Connect (used to interface with Clarity).
MS Project requires a Clarity Macro be added to access Clarity using Schedule Connect.
Views A custom view library can be made available for all users.
A reference guide is made available for OWB users.
OWB views work with all projects.
Project, Task Detail and Resource Summary data can be displayed in the same view.
Generic MS Project views are delivered with the tool.
The MS Project classes recommend adding Clarity specific data elements to views.
Changes to views impact only the current open project. Changes must be re-built for any other project, if needed.
Each user has to build his own changes to views.
A separate view is needed for Task Detail and Resource Summary data.
Updating the WBS
Adding or changing the Work Breakdown Structure involves rows, columns and cells.
WBS Summary levels are pre-defined as a standard and are selected by name.
Many Summary levels are supported if pre-defined to OWB.
WBS maintenance is more disciplined.
Adding or changing the Work Breakdown Structure involves rows, columns and cells.
WBS Summary levels are created by indenting the tasks below the level. Users must stay consistent with standards.
Many Summary levels are supported by simply indenting.
WBS Maintenance is more free-form.
Creating Dependency Links
Open Workbench allows for the creation of dependency links on Tasks and Milestones only.
Open Workbench defaults to working with
MS Project allows for the creation of dependency links between any row in the plan (Phase, Activity, Task, Milestone). This will cause a failure when saving to Clarity.

Digital Celerity LL All Rights Reserved Sponsored by DC Education
CA Clarity PPM™ Community Knowledge Share Monograph
Function Open WorkBench Microsoft Project
Predecessors and Successors at the same time.
MS Project defaults to working with Predecessors only.
Add Resources Resources cannot be added directly in OWB.
Resources are added by accessing a table in Clarity.
The Resource Table can be viewed organized by Role or by Resource Name (alphabetical order).
Resources cannot be added directly in MS Project.
Resources are added by accessing a table in Clarity.
The Resource Table is viewed only by opening the Role a resource is assigned to in Clarity.
Allocating Resource Availability
Resources can be set to a certain percentage of availability for the entire project.
Variable resource availability can be adjusted in a spreadsheet format by time period.
Resource Calendar changes in Clarity for PTO time automatically affects projects when opened.
Resources can be set to a certain percentage of availability for the entire project.
Variable availability is adjusted by making changes to a Resources Calendar in MS Project.
Resource Calendar changes in Clarity for PTO time automatically affects projects when opened.
Assign Resources to Tasks
OWB allows resources to be assigned only on tasks and milestones.
Users can drag and drop multiple resources to a task.
Users can assign one or more resources to multiple tasks.
Resources can be assigned in the Task Properties dialog box.
MS Project allows users to assign resources to any WBS level. When saved to Clarity, a warning message is displayed if resources have been assigned to any Summary levels. These assignments have to be removed before saving to Clarity.
Users can assign one or more resources to multiple tasks.
Resources can be assigned in the Task Properties dialog box
Remove Resource Assignments
OWB supports a simple transfer assignments facility, which transfers task assignments from one resource to another.
Resources can only be removed from a task assignment in the Task Properties dialog box.
A warning message is displayed when deleting a resource with actual hours posted to the plan.
Resources can be removed in the Task Properties dialog box or in any view displaying the assigned resources.
A warning message is displayed when deleting a resource with actual hours posted to the plan.
Delete Resources
Resources can be easily removed from a project.
A warning message is displayed if a resource is assigned to one or more tasks.
Resources can be easily removed from a project.
Enter Estimated Work Effort
ETC is separate from duration.
ETC must be entered for each resource assigned to a task.
Remaining Work is populated when a resource is added to a task.
Remaining Work must be adjusted to reflect the true amount of effort for each assigned resource.
Manually Schedule the Plan
Open Workbench has a minimum duration of 1 day.
MS Project can have durations less than a day.
Baseline Open Workbench supports multiple baselines and baselining by WBS component.
MS Project supports multiple baselines and baselining by task.
Weekly Maintenance
Pending Actuals and Pending ETC are displayed in the appropriate data field.
Status field has the following values: Not Started, Started and Completed.
Pending ETC and Pending Actuals are stored in Number1 and Number2 assignment fields. Users must add these to a view to review.
% Complete is set to 1% when the 1st actuals are posted.

Digital Celerity LL All Rights Reserved Sponsored by DC Education
CA Clarity PPM™ Community Knowledge Share Monograph
Function Open WorkBench Microsoft Project
Status field is set to Started is when the 1st
actual hours are posted.
PM manually changes the task or milestone to Completed when it is done.
Reporting Open Workbench plans can be copied to Word.
Open Workbench plans can be exported to Excel.
Print Preview is not as robust.
MS Project plans can be copied to Word.
MS Project plans can be exported to Excel.
Resource Management
Open workbench has views delivered that allow a PM to review Actual Hours, ETC, Total, Allocated and Baselined as a total and by time period.
MS Project is very limited in reviewing resource usage for a project. Any views have to be re-built for each project.
Sharing Knowledge, Exchanging Ideas, Building Community
www.digitalcelerity.com


![[Product Monograph Template - Standard]jamp.pharmaready.com/.../0005/m1/ca/0005-ca-m131-annotated-pm-… · Web viewPRODUCT MONOGRAPH. PrACT GLICLAZIDE MR. Gliclazide. Modified-release](https://static.fdocuments.in/doc/165x107/5cdb13cd88c99386458c1eb0/product-monograph-template-standardjamp-web-viewproduct-monograph-pract.jpg)


![[Product Monograph Template - Schedule D] - CSL …labeling.cslbehring.ca/PM/CA/Humate-P/EN/Humate-P-Product... · Appendix I - Product Monograph Template - Schedule D Page 1 of 38.](https://static.fdocuments.in/doc/165x107/5baf016609d3f2d16a8bbe7f/product-monograph-template-schedule-d-csl-appendix-i-product-monograph.jpg)