CA NSM Inside Event Management and Alert Management Workload... · 2014-04-18 · CA Jobtrac™ Job...
228
Inside Event Management and Alert Management r11.2 SP2 CA NSM
Transcript of CA NSM Inside Event Management and Alert Management Workload... · 2014-04-18 · CA Jobtrac™ Job...

Inside Event Management and Alert
Management
r11.2 SP2
CA NSM

This documentation and any related computer software help programs (hereinafter referred to as the
"Documentation") are for your informational purposes only and are subject to change or withdrawal by CA at any time.
This Documentation may not be copied, transferred, reproduced, disclosed, modified or duplicated, in whole or in part,
without the prior written consent of CA. This Documentation is confidential and proprietary information of CA and may
not be used or disclosed by you except as may be permitted in a separate confidentiality agreement between you and
CA.
Notwithstanding the foregoing, if you are a licensed user of the software product(s) addressed in the Documentation,
you may print a reasonable number of copies of the Documentation for internal use by you and your employees in
connection with that software, provided that all CA copyright notices and legends are affixed to each reproduced copy.
The right to print copies of the Documentation is limited to the period during which the applicable license for such
software remains in full force and effect. Should the license terminate for any reason, it is your responsibility to certify
in writing to CA that all copies and partial copies of the Documentation have been returned to CA or destroyed.
TO THE EXTENT PERMITTED BY APPLICABLE LAW, CA PROVIDES THIS DOCUMENTATION "AS IS" WITHOUT
WARRANTY OF ANY KIND, INCLUDING WITHOUT LIMITATION, ANY IMPLIED WARRANTIES OF MERCHANTABILITY,
FITNESS FOR A PARTICULAR PURPOSE, OR NONINFRINGEMENT. IN NO EVENT WILL CA BE LIABLE TO THE END USER
OR ANY THIRD PARTY FOR ANY LOSS OR DAMAGE, DIRECT OR INDIRECT, FROM THE USE OF THIS DOCUMENTATION,
INCLUDING WITHOUT LIMITATION, LOST PROFITS, LOST INVESTMENT, BUSINESS INTERRUPTION, GOODWILL, OR
LOST DATA, EVEN IF CA IS EXPRESSLY ADVISED IN ADVANCE OF THE POSSIBILITY OF SUCH LOSS OR DAMAGE.
The use of any software product referenced in the Documentation is governed by the applicable license agreement and
is not modified in any way by the terms of this notice.
The manufacturer of this Documentation is CA.
Provided with "Restricted Rights." Use, duplication or disclosure by the United States Government is subject to the
restrictions set forth in FAR Sections 12.212, 52.227-14, and 52.227-19(c)(1) - (2) and DFARS Section
252.227-7014(b)(3), as applicable, or their successors.
Copyright © 2010 CA. All rights reserved. All trademarks, trade names, service marks, and logos referenced herein
belong to their respective companies.

CA Product References
This document references the following CA components and products:
■ CA 7® Workload Automation
■ CA Access Control
■ CA ADS™ (CA ADS)
■ CA Advanced Systems Management (CA ASM)
■ CA Cohesion Application Configuration Manager (ACM)
■ CA ASM2® Backup and Restore
■ CA eHealth Performance Manager
■ CA Jobtrac™ Job Management (CA Jobtrac JM Workstation)
■ CA NSM
■ CA NSM Job Management Option (CA NSM JMO)
■ CA San Manager
■ CA Scheduler® Job Management (CA Scheduler JM)
■ CA Security Command Center (CA SCC)
■ CA Service Desk
■ CA Service Desk Knowledge Tools
■ CA Software Delivery
■ CA Spectrum® Infrastructure Manager
■ CA Virtual Performance Management (CA VPM)

Contact CA
Contact Technical Support
For your convenience, CA provides one site where you can access the
information you need for your Home Office, Small Business, and Enterprise CA
products. At http://ca.com/support, you can access the following:
■ Online and telephone contact information for technical assistance and
customer services
■ Information about user communities and forums
■ Product and documentation downloads
■ CA Support policies and guidelines
■ Other helpful resources appropriate for your product
Provide Feedback
If you have comments or questions about CA product documentation, you can
send a message to [email protected].
If you would like to provide feedback about CA product documentation, complete
our short customer survey, which is also available on the CA Support website,
found at http://ca.com/docs.

Contents 5
Contents
Chapter 1: Introduction to Events, Correlation, and Alerts 11
Event, Correlation, and Alerts Overview ........................................................ 11
Event Management ....................................................................... 11
Advanced Event Correlation ............................................................... 12
Alert Management System................................................................. 13
Related Publications .......................................................................... 13
Chapter 2: Managing Enterprise Events with Event Management 17
Event Management System ................................................................... 17
What Is an Event? ............................................................................ 18
Event Sources ................................................................................ 18
Reading Syslog Messages ..................................................................... 19
Life Cycle of an Event ......................................................................... 19
Event Managers and Agents ................................................................... 20
Event Management Configuration .......................................................... 21
Configure a Linux Manager and UNIX/Linux Agents ......................................... 23
Configure a Windows Manager and UNIX/Linux Agents ...................................... 23
Add Agent Machines to the Administrative Configuration ..................................... 24
Verify Event Agent Installation ............................................................. 25
Authorize Users to Run Commands ......................................................... 25
Configure the Event Agent ................................................................. 26
Non-Root Event Agent .................................................................... 29
High Availability .............................................................................. 30
How You Configure Event Management in a Cluster Environment ................................ 30
Event Policy .................................................................................. 31
Message Records ......................................................................... 31
Message Actions .......................................................................... 35
Using Wildcards to Build Message .......................................................... 41
Define a Calendar ......................................................................... 41
Using Regular Expressions ................................................................. 42
Using Variables to Enhance the Current Action .............................................. 47
Use Back-Quote Processing in a Message Action ............................................ 51
Create Multiple Message Actions ........................................................... 52
Replicate Message Records and Actions .................................................... 53
Restrict Message Actions .................................................................. 53
Test Policy by Simulating Messages ........................................................ 56
View Event Messages ......................................................................... 62

6 Inside Event Management and Alert Management
Message Formats ......................................................................... 63
Manage Console Messages ................................................................ 68
Held Messages ............................................................................ 70
Console Log Files ......................................................................... 72
Store and Forward ........................................................................ 73
SAF Configuration ......................................................................... 73
Send Notification ......................................................................... 74
Reports from the Console Log ............................................................. 77
SNMP Traps .................................................................................. 78
Support for SNMP Version 3 Traps ......................................................... 78
How catrap Issues Traps .................................................................. 82
How catrapd Formats Traps ............................................................... 82
Enable Automatic Formatting of Traps ...................................................... 83
Binary and Hex Octet String Varbinds ...................................................... 83
Secure Event Management .................................................................... 84
Users Authorized to Run Commands ....................................................... 84
Authorize Users to Run Commands ......................................................... 85
Access to EM Database Tables ............................................................. 85
Console Views ............................................................................ 86
Event Policy Packs ............................................................................ 92
Message Record/Action Policy Packs ........................................................ 92
Advanced Event Correlation Policy Packs ................................................... 93
Chapter 3: Improving Event Processing with Advanced Event Correlation 97
Advanced Event Correlation ................................................................... 97
High Availability .......................................................................... 98
Why Use AEC? ............................................................................ 98
How AEC Works .......................................................................... 99
Alert Management Integration ................................................................ 100
Event Definitions ............................................................................ 100
Configure AEC ............................................................................... 100
Start the IDE Policy Editor ................................................................ 102
Start the Web Policy Editor ............................................................... 103
Tutor Pane .............................................................................. 105
Event Pick List ........................................................................... 105
Components of a Correlation Rule ............................................................ 105
Event Pipeline Rule Components .......................................................... 106
Boolean Logic Rule Components .......................................................... 110
Timing Parameters ....................................................................... 113
Tokens ...................................................................................... 115
Internal Tokens .......................................................................... 116
User-Defined Tokens ..................................................................... 116

Contents 7
Global Constants ......................................................................... 120
Calendar Support ........................................................................ 121
Template Rules .............................................................................. 121
Example:Template Rule .................................................................. 121
Regular Expressions ......................................................................... 122
Impact Analysis ............................................................................. 124
Impact Events ........................................................................... 125
Aggregate Impact Messages .............................................................. 126
Implement AEC .............................................................................. 127
Deploy Policy ............................................................................ 127
Check the AEC Engine Status ............................................................. 129
Check Policy Status and Utilization ........................................................ 129
Event Log Player ......................................................................... 129
Advanced Template String Editor ............................................................. 130
Advanced Configuration ...................................................................... 130
Override Maturity ........................................................................ 130
Suppress Processed Messages ............................................................ 130
Reformat Processed Messages ............................................................ 131
Reset Rules Dynamically ................................................................. 131
Correlation among Rules and RC Suppression Flag ......................................... 132
Flexible Configuration of Certain Reported Fields ........................................... 132
Event Filtering ........................................................................... 133
AND Concept for Pipeline ................................................................. 134
Calendar Support ........................................................................ 134
Event Counters and Thresholds ........................................................... 134
Event Sequencing ........................................................................ 135
Generate Root Cause for Every Matched Event ............................................. 135
Restart Timer on Match .................................................................. 135
Rule Chaining ............................................................................ 135
Rolling Event Window .................................................................... 136
Examples: AEC Applications .................................................................. 137
Ping Failure (Single Rule) ................................................................. 137
Ping Failure (Multiple Rules) .............................................................. 141
Operator Server Shutdown (Three Item Pipeline) .......................................... 146
Operator Service Shutdown (Multiple Tokens) ............................................. 151
Chapter 4: Monitoring Your Enterprise with the Alert Management System 157
Alert Management System ................................................................... 157
What Are Alerts? ............................................................................ 158
Alert Sources ................................................................................ 158
Life Cycle of an Alert ......................................................................... 159
Alert Management Configuration .............................................................. 159

8 Inside Event Management and Alert Management
Event Agent, Event and Alert Manager .................................................... 160
Multiple Event Agents with Multiple Event Managers ........................................ 161
Multiple Agents, DSM, Event Agent, Event Manager ........................................ 161
Event Manager and Alert Manager ........................................................ 161
High Availability ......................................................................... 161
How Alert Management Works ................................................................ 162
Define Alert Policy ........................................................................... 163
Display Attributes ........................................................................ 165
User Actions ............................................................................. 167
Action Menus ............................................................................ 169
Escalation Policies ....................................................................... 171
Alert Global Definition .................................................................... 174
Make Remote Nodes Available to the Alert Global Definition ................................ 176
User Data ............................................................................... 177
Alert Queues ............................................................................ 178
Alert Classes ............................................................................ 179
Define EMS and AEC Policy for Alerts .......................................................... 185
Message Policy for Alerts ................................................................. 186
Correlation Rules for Alerts ............................................................... 189
Alerts in the Management Command Center ................................................... 191
Alert Queue ............................................................................. 191
Chart of Alert Statistics ................................................................... 195
For a Managed Object .................................................................... 195
Maintain Alert Policy ......................................................................... 196
Export and Import AMS Policies ........................................................... 196
Archive Alerts ........................................................................... 197
Purge Alerts ............................................................................. 197
caamsalertcsv Command—Create a CSV File ............................................... 198
Integrate with Unicenter Service Desk ........................................................ 200
How the Integration with Service Desk Works.............................................. 200
Scenarios ............................................................................... 201
Affected End User ........................................................................ 202
Service Desk Tags in Event and AEC Policy ................................................ 202
Sample Policy with Service Desk Tags ..................................................... 204
Configuration of AMS and Service Desk .................................................... 204
Manage Service Desk Requests ........................................................... 211
Diagnostics and Troubleshooting .............................................................. 218
Cannot Delete an Alert Policy ............................................................. 218
Error Messages Appear When Viewing Alerts for a Managed Object .......................... 219
User Action Does Not Run ................................................................ 220
Access Denied to Event Messages and Alerts ............................................... 221
Cannot Display Alerts for a Managed Object ............................................... 221

Contents 9
Security Error Occurs When Closing an Alert ............................................... 221
AMS Cannot Close a Service Desk Ticket .................................................. 222
AMS Closes Alerts When Service Desk Tickets Have a Status Change ........................ 222
No Synchronization Between Alert Closure and Service Desk Ticket Closure .................. 223
Alert Management Does Not Always Create Service Desk Tickets ............................ 223
Index 225


Chapter 1: Introduction to Events, Correlation, and Alerts 11
Chapter 1: Introduction to Events,
Correlation, and Alerts
This section contains the following topics:
Event, Correlation, and Alerts Overview (see page 11)
Related Publications (see page 13)
Event, Correlation, and Alerts Overview
This chapter provides a brief introduction to the Event Management System
(EMS), Advanced Event Correlation (AEC), and the Alert Management System
(AMS). The remaining chapters explain how to use these components
throughout your enterprise to:
■ Monitor and consolidate event activity from a variety of sources
■ Group associated events for further processing
■ Focus on and manage the highest severity events
Each chapter contains detailed explanations and examples.
Note: The examples in this guide focus on the Unicenter MCC interface. You can
also perform some of the same actions with Unicenter Management Portal.
Unicenter MP provides a framework for accessing enterprise management data,
but not for generating the data. For example, you can view and acknowledge
events, but not define message records and actions.
Event Management
The Event Management System is the focal point for managing enterprise events
from a variety of sources throughout your network. Through the console log, you
can monitor event activity and immediately respond to events as they occur. By
filtering messages that appear on each console, you can retrieve specific
information about a particular node, user, or workstation.
By defining console log views, you can restrict message access to authorized
users and user groups. By defining console view objects to the database, you can
filter messages from the console log, thereby limiting access to sensitive
messages.

Event, Correlation, and Alerts Overview
12 Inside Event Management and Alert Management
By defining calendars, you can establish date and time controls for automated
event processing. Determining a course of action based on when an event occurs
can be critical to its proper handling.
By defining message record and action profiles, you can identify events that are
important to your operation and define the special processing that Unicenter
Network and Systems Management (CA NSM) performs when encountering
them. You can enhance your message record and action policy by using AEC to
identify a set of events that you want to monitor and correlate, and what actions
should be performed if correlation exists or does not exist.
Advanced Event Correlation
Advanced Event Correlation, an extension to EMS, provides a powerful event
correlation, root cause, and impact analysis capability. When used with existing
CA NSM features, it can increase the quality and reduce the quantity of
information reported on the console log. It groups associated events for further
processing. For example, you can suppress events, combine multiple events into
one, extract data from events, reformat events, and detect the absence of
scheduled events.
Root cause analysis helps you drastically reduce the number and frequency of
events seen by console operators, eliminate message flooding, and reduce false
notifications.
Impact analysis helps you alert users of an impending problem, thus reducing
the load on your help desk. It also helps you initiate failover or recovery
procedures for the dependent systems, or alert operations staff that they need
not address a particular problem.
To use AEC, you must first identify a set of events that you want to monitor and
correlate and identify actions to be performed if correlation exists or does not
exist. The events to be monitored are reported to the console log as messages
that act as input to AEC and are intercepted and analyzed. Then you configure
AEC to act on the input messages it receives to produce the desired output,
which are the messages that are actually sent to the console log. AEC uses
correlation rules to analyze the input messages in relation to each other and
identify the root cause messages from those incoming messages. Once AEC has
identified a root cause message, it applies the formatting specified in the
correlation rule and reports the resulting message to the console log.

Related Publications
Chapter 1: Introduction to Events, Correlation, and Alerts 13
Alert Management System
The Alert Management System, a tool for organizing and tracking the most
important events in an enterprise or logical segment of an enterprise, lets you
focus on and manage the highest severity IT events. It provides tools for defining
alert policies and multiple panes in the Unicenter MCC for viewing alerts.
To use AMS, you must first define policies that control how alerts are displayed
and indicate which event messages are alerts. You do this by defining alert
profiles, creating message record actions for alerts, and defining AEC correlation
rules for alerts. The alert policies define configuration settings for all alerts,
group alerts for viewing in the Unicenter MCC, and more. The message record
actions and correlation rules indicate which serious situations lead to alert
creation.
After defining alert policies, you can view and manage alerts in the Management
Command Center. You can view all alerts, alerts of a specific type, and alerts
associated with a managed object.
AMS also lets you link to Unicenter Service Desk, which is a customer support
application that manages calls and IT assets, tracks problem resolutions, and
shares corporate knowledge. Interaction with the Service Desk reduces the
workload of the customer support staff because some manual tasks are
eliminated. For example, you can open, update, and close Service Desk requests
automatically when an AMS alert is created, escalated, or closed.
Related Publications
The following guides provide information that you will find useful. Most are
available on the CA NSM installation media.
Administration Guide
Is intended for use by system administrators and contains general
information and procedures about how to secure, customize, configure, and
maintain CA NSM after installation and implementation. Individual chapters
describe the components that are included with or that can be integrated
with your CA NSM installation.
Agent Technology Support for SNMPv3
Provides information about how Agent Technology can take advantage of the
SNMPv3 protocol. Documents how the security information is handled on the
manager and agent side as well as how it is applied to the managed systems.
SNMPv3 configuration and usage details are provided in this guide.

Related Publications
14 Inside Event Management and Alert Management
CA Procedures
Contains procedures and processes for all components of CA NSM, including
WorldView, Agent Technology, Enterprise Management, Event Management,
CAICCI, Data Scoping, Discovery, Notification Services, Wireless Messaging,
Security Management, and CA NSM Job Management Option.
CA Reference
Contains commands, parameters, and environment variables for all
components of CA NSM, including Advanced Event Correlation, Agent
Technology, Enterprise Management, Event Management, CAICCI, Data
Scoping, Discovery, Notification Services, Wireless Messaging, Security
Management, CA NSM Job Management Option, and WorldView.
Implementation Guide
Contains architecture considerations, pre-installation tasks, installation
instructions, post-installation configuration information, and implementation
scenarios. Appendixes include in-depth information about Distributed
Intelligence Architecture (DIA), the MDB, and the CA High Availability
Service (HAS) for cluster aware environments. This guide is intended for
users who are implementing CA NSM on a new system.
Inside Active Directory Management
Provides general information, installation scenarios, and configuration
procedures for Active Directory Management.
Inside Event Management and Alert Management
Provides detailed information about Event Management (message records
and actions), Advanced Event Correlation, and Alert Management.
Inside the Performance Agent
Contains detailed information about the configuration and use of the
Performance Agent.
Inside Systems Management
Describes systems management from the CA NSM architecture perspective.
The guide describes the different layers (WorldView, Management Layer,
Monitoring Layer) and associated components, for example: Distributed
State Machine (DSM), Unicenter Configuration Manager, dashboards, and so
on.
Inside Systems Monitoring
Explores how to use and configure the system agents of CA NSM to monitor
the system resources in your environment. The chapters guide you through
the process of configuring and optimizing the agent for your special
requirements.

Related Publications
Chapter 1: Introduction to Events, Correlation, and Alerts 15
Inside Systems Performance
Contains detailed information about the three architectural layers of
Systems Performance, and provides guidance in the deployment,
configuration, use, and best practices of the Systems Performance
components.
MDB Overview
Provides a generic overview of the Management Database (MDB), a common
enterprise data repository that integrates CA product suites. The MDB
provides a unified database schema for the management data stored by all
CA products (mainframe and distributed). The MDB integrates management
data from all IT disciplines and CA products. The guide includes
implementation considerations for the database systems that support the
MDB and information specific to the CA NSM implementation of the MDB.
MIB Reference Guide
Provides detailed information about each MIB attribute of the CA NSM
system agents.
Migration Guide
Provides detailed upgrade and migration instructions. This guide is only
available on the CA Support website: http://ca.com/support
Programming Guide
Provides details for constructing applications by CA development teams and
by third parties and their clients. The guide is intended for developers who
use one or more of the application programming interfaces (APIs) in the SDK
to develop applications for use with CA NSM. Key among these APIs are the
WorldView API, the Agent Technology API, and the Enterprise Management
API.
Readme Files
Provides information about known issues and information discovered after
CA NSM publication. The following readme files are available:
■ The CA NSM r11.2 SP2 for UNIX and Linux readme
■ The CA NSM r11.2 SP2 Windows readme
■ The Unicenter Management Portal readme
Release Notes
Provides information about operating system support, system requirements,
new and changed features, published fixes, international support, and the
documentation roadmap. The following release notes are available:
■ The CA NSM r11.2 SP2 for UNIX and Linux release notes
■ The CA NSM r11.2 SP2 release notes
■ The Unicenter Management Portal release notes

Related Publications
16 Inside Event Management and Alert Management
Unicenter Management Portal Implementation Guide
Provides installation, deployment, and basic administrative instructions for
Unicenter Management Portal.
CA Green Book, Systems Management
Identifies the CA solution for managing challenges involved in maintaining
the performance and availability of complex server infrastructures. The CA
solution provides proactive management of servers as part of an overall
effort to improve service levels, and minimize the costs of managing the
computing infrastructure through increased automation. It provides a view
of the requirements for systems management and best practices for
deployment. This guide is available online at:
https://support.ca.com/irj/portal/anonymous/phpdocs?filePath=0/common
/greenbooks.html.
CA Green Book, Service Availability Management
Describes how to deliver integrated end-to-end performance and event
management that is centered on services. The CA Service Availability
Management solution leverages the Manager of Managers integration
capabilities of CA NSM and eHealth and explains how to take advantage of
those capabilities. It includes details on how to install and configure a variety
of management solutions to provide simpler and more comprehensive
management and monitoring of IT services. This guide is available online at:
https://support.ca.com/irj/portal/anonymous/phpdocs?filePath=0/common
/greenbooks.html.

Chapter 2: Managing Enterprise Events with Event Management 17
Chapter 2: Managing Enterprise Events
with Event Management
This section contains the following topics:
Event Management System (see page 17)
What Is an Event? (see page 18)
Event Sources (see page 18)
Reading Syslog Messages (see page 19)
Life Cycle of an Event (see page 19)
Event Managers and Agents (see page 20)
High Availability (see page 30)
How You Configure Event Management in a Cluster Environment (see page 30)
Event Policy (see page 31)
View Event Messages (see page 62)
SNMP Traps (see page 78)
Secure Event Management (see page 84)
Event Policy Packs (see page 92)
Event Management System
The Event Management System (EMS) collects events from almost every running
program or script that generates them, and provides a complete view of the
ongoing processing in your enterprise. It determines which messages are
important, and responds to them based on policies that you define. It can
automate many manual problem resolution tasks, filter and consolidate multiple
events, and significantly reduce the need for human intervention. Event
Management can correlate various messages, monitor for unusual conditions,
and then take proper corrective action.
With Event Management System, you can:
■ Define message record and action profiles to identify events that are
important to your organization and define the special processing that
Unicenter Network and Systems Management (CA NSM) performs when
encountering them.
■ Define calendars to establish date and time controls for when and how
events are processed.
■ Monitor event activity through the console log and immediately respond to
events as they occur.
■ Define console log views to restrict message access to authorized users and
user groups.

What Is an Event?
18 Inside Event Management and Alert Management
Note: The examples in this guide focus on the Unicenter MCC interface. You can
also perform some of the same actions with Unicenter Management Portal.
Unicenter MP provides a framework for accessing enterprise management data,
but not for generating the data. For example, you can view and acknowledge
events, but not define message records and actions.
What Is an Event?
In the context of Event Management, an event is a message that an operating
system or other application issues to alert the user or other software
components of an important occurrence. In addition to the message text,
additional information, such as date, time, node of origin, user, and so forth are
associated with the event.
Event Sources
Event Management receives events from a variety of sources:
■ The cawto command, which sends an event to the Event Console.
■ The cawtor command, which sends an event to the Event Console and waits
for a reply. It appears in the held messages pane and will not be deleted until
the operator replies.
■ The oprcmd command, which sends a request to execute a command to the
designated target machines.
■ The careply command, which lets you use any terminal to reply to an event
being held by the Event Console.
■ Enterprise Management components, which generate events directly to the
Event Console.
■ SNMP traps that are generated by various devices, such as switches or
printers, and other software components. catrapd (an Event Management
component), collects, formats, and routes these traps to the Event
Management daemon on the local or remote node.
■ The Windows Event Logs, which store events generated by the Windows
operating system, device drivers, or other products. The Event Management
log reader collects these events and forwards them to the Event
Management daemon.

Reading Syslog Messages
Chapter 2: Managing Enterprise Events with Event Management 19
■ The syslog daemon on UNIX/Linux platforms, where messages are routed
through the syslog daemon to the Event Console. Events issued through the
logger utility are included as they also use the syslog daemon. These events
may have originated on a platform not running CA NSM.
■ Agent Technology agents, policies, and DSM.
■ Any CA or client programs that use the CA NSM SDK.
■ API functions, such as EmEvt_wto, which issue events to Event
Management.
For additional information about the cawto, cawtor, oprcmd, careply, and
catrapd administrator commands, see the online CA Reference and the CA SDK
Reference.
Reading Syslog Messages
On UNIX/Linux platforms, by default, Event Management reads from a named
pipe attached to syslogd. You can configure it to read from a syslog formatted
messages file. The system administrator is required to configure the logging
system to write and maintain syslog formatted files. We recommend that you
include all messages from the *INFO facility in the messages file.
For example, if syslog messages are written to /var/adm/custom/messages, set
the variables in the $CASHCOMP/opr/scripts/envusr to the following values:
CA_OPR_READ_SYSLOG_FILE=YES
CA_OPR_SYSLOG_FILE=/var/adm/custom/messages
Life Cycle of an Event
A typical event goes through the following stages:
1. A situation (event) occurs that causes creation of a message. The message
may be informational, like announcing a job has finished. It may also
announce a more serious event, like a server going down.
2. The event is sent directly to EMS or collected by various components and
sent to EMS for processing.
3. The event is matched against EMS message policies and AEC correlation
policies. If the event matches a policy, various actions are executed
automatically.
4. If not already resolved by the automatic actions, and if not prevented by
message policy, the event is added to the Console Log. Depending on the
policy, the event may also go to the Held Messages area of the Console Log
or to AMS for further tracking and processing.

Event Managers and Agents
20 Inside Event Management and Alert Management
5. When human intervention is required, a technician is notified by Notification
Services and then starts to resolve the situation. If it was a held message,
the technician also acknowledges the message or sends a reply.
6. The situation that caused the message is resolved, and another event may
be created to announce the resolution.
Event Managers and Agents
A typical deployment of Event Management is composed of Event Managers and
Event Agents.
Event Managers are nodes that have the full installation of Event Management,
including the Event Console and administrative GUIs. Some Event Managers
have an MDB, but not necessarily all of them.
Event Agents are lightweight mechanisms that coordinate with a remote Event
Manager to handle events with little overhead. Servers running the Event Agent
do not have an MDB or a GUI. The agents get message policy from an Event
Manager server.
When you install the product, you choose between installing an Event Manager
and an Event Agent. When you install an agent, you indicate which remote Event
Manager provides Event policy to the agent. When you start the agent machine
or run opreload on it, message records and actions are copied from the Event
Manager. On Windows, this copied policy is in a file named caopr.dsb. On
UNIX/Linux, it is in two files: msgrec.rdw and msgact.rdw, located in the
$CAIGLBL0000/tmp directory.
There is also an in-memory version of the policy, named Decision Support Binary
(DSB). A DSB is also created on an Event Manager when the manager node is
started or opreload is run. Using the copy in memory (cache) is more efficient
than getting policy directly from the MDB every time the policy is needed.
This section provides the following information about Event Managers and Event
Agents:
■ Some typical configurations of managers and agents
■ An example of configuring a Windows manager and UNIX/Linux agents
■ How to set up a non-root Event Agent on UNIX/Linux

Event Managers and Agents
Chapter 2: Managing Enterprise Events with Event Management 21
Event Management Configuration
EMS provides a great amount of flexibility in setting up your Event Managers and
Event Agents. This section describes several common configurations:
■ One manager with several agents
■ Several managers with a central MDB
■ Several managers with individual MDBs
One Manager with Several Agents
In this design, one Event Manager contains the policy for several Event Agents.
The agents forward their messages to the manager. You can set up the
forwarding at installation time, or you can create message policy that uses the
FORWARD action. On Windows, the installation sets the environment variable
CA_OPERA_NODE to the manager node. On UNIX/Linux, you must define Event
policy using the FORWARD action to send events to the manager.
To minimize increased network traffic, we recommend that you create policies
for the Event Agent that forward only a select number of important events to the
Event Manager for processing and logging.
A central Event Manager is a good design for small enterprises because one
Console Log lets you view events generated from all agent nodes, and the events
are processed at one location.
Several Managers with a Central MDB
In this design, several Event Managers have a Console Log and process
messages locally. They have Event Agents forwarding messages to them. The
MDB resides on a central node that each Event Manager accesses when an
opreload command is issued. Therefore, each manager uses the same message
policy.
This design has some advantages. One, the Event Managers processing
messages are close to the resources they manage. Two, because policy is in one
location, only one set of message records and actions are created.
Although the Console Logs are local, you can use the Management Command
Center to view logs on the various nodes. To do this, choose Console Logs in the
drop-down list above the left pane, and click a node.

Event Managers and Agents
22 Inside Event Management and Alert Management
With this design, use the following features of message records:
Search all messages
Multiple message records may match an Event message. By default, EMS
performs actions for only the first message that matches. When Search all
messages is selected, all actions for all matching message records are
performed.
Eval node
With a central DSB, you may not want all Event Managers to process all
message records and actions. The default for Eval node is an asterisk (*),
which means all, but you may want to change that to specific Event
Managers. This field can have wildcards, regular expressions, a range, or
several nodes separated by the pipe (|) character.
Several Managers with Individual MDBs
In this design each Event Manager has a local MDB. Message policy can be
different on each manager, or it can be the same if you export message records
and actions and then import them.
To export and import message policy
1. Enter the following command on an Event Manager that has the policy to
copy:
oprdb script db > path_filename.txt
A text file of message records and actions is created.
2. Copy the file to an Event Manager that needs to import the message records
and actions, and then enter the following command:
cautil -f path_filename.txt
The message records and actions are copied.
Note: On Windows you can also use the following commands to save a file on the
source node and load that file on the destination node:
oprdb save filename.dsb
oprdb load filename.dsb

Event Managers and Agents
Chapter 2: Managing Enterprise Events with Event Management 23
Configure a Linux Manager and UNIX/Linux Agents
A possible implementation of Event Managers and Event Agents is a manager on
Linux and agents on UNIX/Linux. This section shows a sample scenario.
To set up a manager and agents in this example
1. Install the Event Manager on a Linux machine.
2. Install the Event Agent on a Linux machine.
■ During installation, provide the name of the manager node.
■ If you want to change the manager node after installation, run the
$CAIGLBL000/opr/scripts/rc.configure_agnt script and then unicycle all
on the Event Agent node.
3. Verify the connection between the manager and agent node by running the
command ccinet status on the agent machine.
4. Define message records and actions on the manager node.
Note: If you want all message records in the database to be loaded by all
Event Agents using the manager node, leave the eval node field blank. If you
want to restrict certain message records, enter in the eval node field the
name of the Event Agent for which the message record is appropriate.
5. Run oprcmd opreload on the Event Agents to load the policy.
Configure a Windows Manager and UNIX/Linux Agents
A common implementation of Event Managers and Event Agents is a manager on
Windows and agents on UNIX/Linux. This section shows a sample scenario.
To set up a manager and agents in this example
1. Install the full Event Management on a Windows server. Select the
installation wizard for CA NSM.
2. Install the agent on UNIX/Linux servers. Select the installation wizard for
Event Agents.
3. Verify the installation.
4. Add the agent machines to the administrative configuration on the manager
serve using the EM Connection Manager.
5. Authorize users to run commands on each agent machine.

Event Managers and Agents
24 Inside Event Management and Alert Management
6. Configure the Event Agents, if necessary. CA NSM provides the following
methods for you to set environment variables:
■ Configuration GUI (on manager node, Windows only)
■ cautenv utility (on agent node, Windows only)
■ $CAIGLBL0000/opr/config/node/actnode.prf file (UNIX/Linux only)
■ $CAIGLBL0000/opr/scripts/envusr and envset scripts (UNIX/Linux Only)
■ Unicenter Configuration Manager, a product that provides an interface
for reporting and managing configuration settings for remote and
distributed Agent Technology and Event Management components.
7. Create message records and actions on the manager server for the remote
agents.
8. Activate the message records and actions on the agent machines.
Note: You can also configure Event Agents on Windows to retrieve policy from
an Event Manager on UNIX/Linux.
Add Agent Machines to the Administrative Configuration
Before the Event Manager machine can view console logs from Event Agents, it
must recognize the agents.
To add the agents to the administrative configuration of the manager
1. On the Windows manager machine, choose Start, Programs, CA, Unicenter,
NSM, Enterprise Management, EM Connection Manager.
The EM Connection Manager opens.
2. Enter the name of an agent machine, select a platform, and click Only Event
Agent. Click Add New. Repeat for each Event Agent machine.
3. Click Next and Finish.
The Event Manager now recognizes the Event Agent machines. The user
interface on the manager computer shows an icon for each agent.
Note: Windows managers and UNIX/Linux agents must be in the same time
zone. This is not a requirement for Windows managers and agents.

Event Managers and Agents
Chapter 2: Managing Enterprise Events with Event Management 25
Verify Event Agent Installation
Before the Event Manager machine can recognize the Event Agents and provide
event policy, Event Management must be running on the agents. It should be
running after the installation.
To verify that the installation was successful
1. On the agent machines, run the following command:
unifstat
A message lists the Unicenter services that are active.
2. If Event Management is not active, enter:
unicntrl start all
Event Management starts.
3. On the manager machine, ping the agent machine.
On Windows enter:
oprping agentname 1 text
On UNIX/Linux, enter:
oprping agentname
Instead, you can enter the following command and verify that the event you
entered ("some text...") appears on the agent node console log:
cawto -n agentname some text...
Authorize Users to Run Commands
After installation, the only user authorized to run commands on the Event Agent
is the agent machine's administrator. If you want to let other users run
commands on the agent node, authorize the administrator of the Event Manager
machine as well. Set the CA_OPR_AUTH_LIST environment variable using the
following tools:
■ cautenv utility or the Enterprise Management Configuration GUI on Windows
■ $CAIGLBL0000/opr/config/node/actnode.prf file on UNIX/Linux
Note: If Alert Management is integrated with eHealth Suite, and you get a
security error when closing an alert, you need to authorize SYSTEM to run
commands. Use this procedure.

Event Managers and Agents
26 Inside Event Management and Alert Management
To add the Event Manager administrator as an authorized user using
cautenv
1. Enter the following command to save the original configuration file on the
Event Agent machine:
cautenv saveenv original.cfg
The original settings are saved in the file original.cfg.
2. Authorize the administrators on both machines:
cautenv setlocal CA_OPR_AUTH_LIST
administrator_id@EventAgentNode,administrator_id@EventManagerNode
Note: Separate users with commas and no spaces.
The variable is set.
3. Stop and restart the Enterprise Management services on the agent machine:
unicntrl stop all
unicntrl start all
The changes take effect.
Configure the Event Agent
When Event Agents are installed, configuration settings are applied
automatically based on your installation choices. You may need to change some
settings later, however. This section provides information about specifying
settings on Windows and UNIX/Linux.
For Windows
Run the cautenv utility from the command line of the Event Manager or Event
Agent.
■ On the Event Manager:
oprcmd -n agent-name cautenv setlocal envname value
■ On Event Agents:
cautenv setlocal envname value
Note: The user running the commands must be listed in CA_OPR_AUTH_LIST
(Users Authorized To Run Commands) on the agent machines.

Event Managers and Agents
Chapter 2: Managing Enterprise Events with Event Management 27
The following are examples of settings that can be changed. Substitute envname
with one of the following environment variables.
CA_OPR_PROXY (Event Agent Proxy Node)
Indicates the name of the Event Manager server that provides policy to the
Event Agent.
Note: If no value is specified for CA_OPR_PROXY, the agent retrieves policy
from the server specified in CAI_DBSERVER (Database Server Name).
CA_OPERA_NODE (Console Daemon Node)
Specifies the name of the server where event messages are forwarded. You
may want to set CA_OPERA_NODE to the local agent machine so that it
processes its own events. You may need to use Event policies to forward
some events to the manager for processing.
For UNIX/Linux
To change Event Management settings on UNIX/Linux, edit the configuration
files $CAIGLBL0000/opr/scripts/envsetlocal and
$CAIGLBL0000/opr/scripts/envusrlocal. For example, the following variable is
set in the envset file based on the response to an installation question.
CAI_OPR_REMOTEDB (Event Agent Proxy Node)
Indicates the name of the Event Manager server that provides policy to the
Event Agent.
To change this setting later, add the following lines to the envsetlocal file:
CA_OPR_REMOTEDB=nodename
export_CA_OPR_REMOTEDB
The first line sets the variable, and the second line exports it to the environment.
Note: Do not customize settings in envset and envusr. Since these files are
replaced when the system is upgraded, the customized settings are lost. The
envsetlocal and envusrlocal files are not replaced when the system is upgraded,
so the customized settings are not lost. If envsetlocal or envusrlocal does not
exist, create the file and add the customized setting to it.

Event Managers and Agents
28 Inside Event Management and Alert Management
Create Message Records and Actions for Event Agents
Message records and actions for Event Agents are defined and stored on the
Event Manager machine. Each time the agent machines are restarted or you run
opreload on them, the policy is copied from the manager machine to the agents.
On Windows, by default, an agent forwards all of its events to its manager. To
forward selected events, you need to define a policy for the agent.
Note: This example defines a message record and action that forwards from
agents to manager only those events that generate messages beginning with
"Error".
To define policy for the agents
1. On the Event Manager machine, open Messages.
The Message Records container opens.
2. Click New.
The Message Record - Detail opens.
3. Enter the following information, and click the Configuration tab:
■ Message Id -- Enter ―Error*‖ to apply this rule to all messages that begin
with "Error".
The Configuration page appears.
4. Enter the following information, and click Save.
■ Eval node -- Enter ―*‖ to apply this rule to all agents assigned to this
manager.
The message record is created.
5. Click the Actions tab.
The Actions page appears.
6. Click New.
The Message Record Action - Detail, Action page appears.
7. Enter the following information, and then click Save.
■ Action -- Choose ―FORWARD‖ to send all messages.
■ Node -- Enter Event Manager name so that all messages go to the
manager.
The message action is created.

Event Managers and Agents
Chapter 2: Managing Enterprise Events with Event Management 29
Activate Message Records and Actions on Event Agents
After you define message records and actions, you need to refresh the
in-memory copies of them. Do this on the Event Manager and the Event Agents.
To refresh message policy, do one of the following:
■ Restart the Event Manager and then restart each Event Agent.
■ Run the following command on a command line, first on the manager and
then on the agents:
oprcmd opreload
The in-memory DSB is updated with the latest Event policy from the
Management Database.
Non-Root Event Agent
On UNIX/Linux you can install a non-root Event Agent. This agent increases
security because it enables a specified non-root user to start and stop the agent
and run Unicenter processes. Without the non-root Event Agent, Event
Management must be started and stopped by the root user.
The daemons on the non-root Event Agent run under the ID of the non-root user,
except for the CAICCI processes, which run as root.
Note: For information about CAICCI (CA Common Communications Interface),
see the Administration Guide and the online CA Reference.
Message actions that run on the system run under the non-root user's ID unless
sudo is used.The shareware utility sudo enables the non-root Event Agent to run
programs and commands on behalf of any user. You can download sudo from
www.courtesan.com/sudo. Follow the instructions on that site for installing,
configuring, and using the utility.
sudo and Message Actions
The message actions UNIXCMD and UNIXSH submit a command to a spawned
UNIX/Linux shell. The following example shows how to integrate sudo into a
message action for a non-root Event Agent. The sudo command is used to
execute /usr/bin/touch as the specific user userNAME.
Command: /usr/bin/touch myfile
Command: sudo -u userNAME /usr/bin/touch myfile
The sudo command can be in the message action text field or in a shell script
executed by the message action.

High Availability
30 Inside Event Management and Alert Management
Configure sudo
The sudoers file lets you configure sudo. See the sample file on
www.gratisoft.us/sudo. To modify the sudoers file you must use the visudo
command. You need to add users and permissions to the file:
■ Add authenticate parameters for each user so that sudo does not prompt for
a password:
Defaults:user !authenticate
■ The following excerpt from the sudoers file (sudo configuration file) gives the
user unimgr permission to execute the /usr/bin/touch file as root or opsuser
on server1:
unimgr server1 =(opsuser) /usr/bin/touch, (root) /usr/bin/touch
High Availability
Since Event Management is typically the backbone of any enterprise
management system, it is essential that it be both cluster-aware and highly
available within a clustered environment. See the appendix "Making
Components Cluster Aware and Highly Available" in the Implementation Guide
for additional information.
Note: Event Management is not highly available on Linux platforms.
How You Configure Event Management in a Cluster
Environment
In general, when a node name is required, use the CA NSM cluster virtual node
(VNODE) rather than the physical node name of any of the constituent
computers. Using VNODE makes sure that CA NSM services are available.
In particular, use the VNODE when you are performing the following tasks:
■ Configuring Remote Administration Clients (RAC) to manage CA NSM on that
cluster.
■ Forwarding events to a cluster node.
Events sent to Event Manager from applications that are not registered with the
cluster, or that are generated from the Windows Event Log by the Event
Management Log Reader, carry the physical node name rather than the cluster
VNODE. If those events are of interest, you should adjust any policy records that
filter on the incoming node name to include both the physical and virtual node
names.

Event Policy
Chapter 2: Managing Enterprise Events with Event Management 31
Event Policy
Event policy defines how Event Management processes events it receives. The
Event Management service reads all message records and message action policy
definitions from the Management Database (MDB) during startup and stores
them in memory cache. It also writes a copy of this policy to a local file called
Decision Support Binary (DSB) to be used when the MDB is not available. Any
changes to message records and actions take effect only after the Event
Management service refreshes those policies in memory. You accomplish this by
using the opreload command or by shutting down and restarting Event
Management.
The opreload command directs Event Management to refresh the active message
record and message action lists immediately with the definitions stored in the
Management Database. Any requests for automated message processing remain
in the queue until the refresh of the active lists is complete.
Message Records
Message records let you identify specific events that are important to the
operation of your enterprise. They provide criteria that must be met before a
message becomes eligible for processing. You can use the following fields in the
Message Record - Detail window to help identify the messages Event
Management should process:
■ Message ID
■ Domain/Node
■ Domain/User
■ Device
■ Source
■ Category
■ Message Number
■ Severity
■ Tag
■ Job
■ Workstation
■ Program
■ User data

Event Policy
32 Inside Event Management and Alert Management
These fields, if set on the Message Record dialog, must match the equivalent
fields on the events for the message record to be selected for that event.
Once you have defined an important event you need to process, you define a
message record to match it. Afterwards you should create actions that should
take place when this message is matched. Message actions are associated with a
message record. You can define several message actions for a single message
record. A single event can match multiple message records, thus initiating
multiple sets of message actions (if you check Search All Messages on the Config
page of the Message Record - Detail window).
Message ID
The Message ID field matches the specific text of the message. It can be
alphanumeric and is always case-sensitive, so the Message ID field and the
message text must match identically for this message record to match the
message. Using wildcards makes creating message records easier and reduces
message records needed, because a single message record can match multiple
events.
The event message is parsed into words (tokenized) and compared word by word
against the Message ID using wildcard comparison.
Domain/Node
The Domain/Node field identifies the server from which the event originated. You
can use wildcards. For example, if this message record is for all nodes starting
with CALC, an entry of CALC* matches messages from CALC0101, CALC01T1,
CALC0805, and so forth. By default, all message records are case-sensitive, so a
message from calc0101 does not match. You can clear this parameter on the
Configuration page.
You can use regular expressions in this field. If you need to define multiple
nodes, and a wildcard does not cause the message record to match messages
from these nodes, you need to use regular expressions. On the Configuration
page, select Use regular expressions.
Note: In the Domain/Node field, enter each node with brackets around it
[CALC0101]. Do not insert spaces between the entries. For example, an entry of
[CALC0101] [UNIPC01] does not work, but [CALC0101][UNIPC01] does.
To match events from multiple nodes using regular expressions, use the
separator (|) character. For example, CALC0101|UNIPC01.
You can select regular expression and case-sensitivity to help design message
records that match multiple events from multiple nodes. Since this field is limited
to 64 characters, you may need to create a second message record if you are
unable to define all nodes that should match this message record.

Event Policy
Chapter 2: Managing Enterprise Events with Event Management 33
Domain/User
The Domain/User field identifies the domain/user ID by which the event was
sent. You can use wildcards, regular expressions, and case-sensitivity to help
match the message record to the messages.
Sometimes because the application, operating system, or other component is
generating the message, the domain/user may or may not be what you expect.
For this reason, it is often best to leave this field blank (defaulting to *) and
attempt to match on other criteria.
Device
The Device field specifies the name of the device associated with the event.
When events are generated from SNMP traps, this field may contain data. You
can use wildcards, regular expressions, and case-sensitivity.
Source
The Source field identifies the software that logged the event. It can be an
application or component of the operating system, such as drivers and services.
Since CA NSM is an application, many CA products communicate directly with
Event Management. You can usually identify these products within the source.
You can use wildcards, regular expressions, and case-sensitivity in this field.
Category
The Category field identifies the classification of the event as defined by the
source. Since the message sent when an event occurs rarely has information in
the Category field, it is usually not used to match message records against
incoming messages. If the source sends information in the Category field, this
field can be used to match message records against messages. When the source
is an internal application, the application can use this field to send specific
information to Event Management, which in turn processes the message and
takes appropriate action. This field may appear on events that originate in the
Windows Event logs. You can use wildcards, regular expressions, and
case-sensitivity in this field.
Note: When you define message records and actions for Alert Management
System alerts, the name of the Category field becomes Alert Text. Alert text is
used for consolidating alerts. See Message Policy for Alerts (see page 186).
Message Number
The Message Number field specifies the number assigned by the program that
generated the message. It ties directly to the Message ID. It is only a numeric
value, but is a good way to match message records to specific messages. The
source generates this number, but unlike the category, it is regularly used. This
field takes only a single entry of one number, nine digits maximum.

Event Policy
34 Inside Event Management and Alert Management
Severity
The Severity field matches the severity level of the message. It takes up to three
characters in length, or a drop-down window provides five basic options: E
(error), W (warning), I (informational), S (successful), and F (failure). If the field
is populated with multiple severities, any matched options cause the message to
be processed. By default, this field is case-sensitive, so the severity of the
message and the severity in the message record must match exactly. If the
case-sensitive option is cleared the field is no longer case-sensitive, however an
exact match must be made in the correct order (if multiple characters) for the
message to be processed.
Tag
The Tag field indicates the specific machine type. This field can be alphanumeric,
and entries can be up to 64 characters in length. Following are examples of tag
types:
■ AIX
■ MVS
■ NETWARE
■ TANDEM
You can use wildcards, regular expressions, and case-sensitivity.
Job
There are four job fields:
■ Jobset
■ Job name
■ Job number
■ Qualifier
These fields, specific to the Job Management Option (JMO), are tied directly to
events concerning jobs. JMO is a scheduling component used to manage jobs.
To define a job you must first create a jobset (a container of jobs). All jobs
defined in a jobset default to the configuration settings of the jobset. Next, you
must define the job and configure it to control the actual process or job that you
want to run. The job has a direct one-to-one relationship with the actual process.
The job controls and manages the actual job. Because a job may need to be run
multiple times, it is given a number. The number gives each instance of the job
its uniqueness. Finally, when the job runs, the system gives it a qualifier that
uniquely identifies the job by day (first two digits) and occurrence (last two
digits).

Event Policy
Chapter 2: Managing Enterprise Events with Event Management 35
Workstation
The Workstation field (also known as station) specifies the logical name given to
a machine. Workstation, usually associated with JMO, helps define jobs that run
on a particular station. As jobs run, events occur and messages are generated.
The Workstation field lets the message record match against events from a
particular station. You can use wildcards, regular expressions, and
case-sensitivity.
Program
The Program field identifies the program that issued the event. This field includes
the program name, followed by its extension. You can use wildcards, regular
expressions, and case-sensitivity.
User data
The User data field specifies a user-defined string that may be defined in an
event. When used in a production environment this field, with a company's
internal applications, can identify unique events and let Event Management
assist the business in more than network and system management. For
example, an application may send an event regarding "Shipment Received." By
having the application define the type of shipment, Event Management can then
process the event and send notifications to the appropriate departments. You
can use wildcards, regular expressions, and case-sensitivity.
Message Actions
Message actions specify what Event Management should do when it detects a
match between an input event message and a message record. Possible actions
range from simply highlighting messages on the console display to replying to
messages, opening problems, or executing commands or other programs.
For example, to ensure that a message catches the attention of the person
responsible for monitoring the console, you can use either or both of these
methods:
■ Route the message to a held area of the console GUI where it remains until
acknowledged by the console operator.
■ Assign an attribute, such as highlighting or blinking, to make a message
more noticeable on the Event Console.

Event Policy
36 Inside Event Management and Alert Management
You can use several types of actions in any sequence or combination to
thoroughly automate processing of an input or output message. For explanations
of these action keywords, see the cautil DEFINE MSGACTION control statement
in the online CA Reference.
Following are explanations of how you can use some of these actions individually
or with other actions to accomplish specific tasks.
Prevent a Message Flood (SUPPRESS/DISCARD)
Messages of little or no significance frequently flood Event Management. They
tend to fill the console log and detract from significant messages that you need
to see and track. The SUPPRESS and DISCARD actions provide a convenient way
to deal with messages that you do not need to see.
SUPPRESS tells Event Management to write to the console log, but not display
any information except the time and the Invisible message attribute icon (a pair
of glasses). To view information for suppressed messages, choose View
Suppressed messages from the console log. When the message information
appears, you can open the Console Message Properties dialog.
DISCARD tells Event Management not to write to the console log. These
messages do not appear in the current or past console logs.
Identify Messages Requiring Immediate Attention (SENDOPER, HILITE, and FORWARD)
Some messages may require immediate attention. You can use the SENDOPER,
HILITE, and FORWARD actions to identify them.
SENDOPER sends a message to the console log. In the Text field, you can enter
text to be displayed or leave it blank to display the original message. The
message appears only in the log messages area.
HILITE highlights the message when it is displayed on the console log. In the
Text field, you can specify text to be displayed or leave it blank to display the
original message.
FORWARD forwards a message to another server. In the Text field, you can
specify text to be forwarded or leave it blank to forward the original message.
SendText to an Application (SENDAPPL)
You can use the SENDAPPL action to send text to an application for processing.
The application must be active at the time the action is executed.

Event Policy
Chapter 2: Managing Enterprise Events with Event Management 37
Test Conditions and Take Actions (TEST)
The TEST action provides Boolean logic to test a variety of conditions for making
decisions and taking alternate actions based on the results. For example, you
can use the TEST action to evaluate the return code from the EXTERNAL action to
determine whether subsequent actions should be executed.
In the TEST action, use the Text field to identify the expression you want to test.
You can use internal and external variables (operating systems). Actual values
are substituted before the expression is evaluated. Put spaces around all
operators and parentheses. Put quotes around strings, variables, and literals to
prevent syntax errors if the value is null.
You can use space characters in the TEST action. For example:
Msgaction action=TEST text="&(2:5)" = "this is a test"
Nest Events (EVALUATE)
You can use the actions of a message record to initiate another message record
with another set of actions. This is called nesting because the action of one
message record triggers another message record and its defined actions. The
EVALUATE action lets you nest or call upon other message records.
EVALUATE activates the message record listed in the Text field. Using EVALUATE
is the same as using the COMMAND action to issue a CAWTO and the name of the
message record you want to process. For example, EVALUATE followed by the
text Server Down is the same as COMMAND followed by the text cawto Server
Down.
Combined with the return code, EVALUATE lets you build logic and intelligence
into the actions performed by a message record. When an action is performed
based upon the return code, you can use other EVALUATE actions to execute
other message records and actions based upon the success or failure of the
previous action.
EVALUATE also lets you call upon a message record with a predefined set of
actions. For example, you might have a set of 10 actions to perform every time
a certain event occurs on numerous servers. Each message received is unique,
so each server must have its own message record to identify this significant
event. The 10 actions must be in each message record for each server. Using
EVALUATE, you can instead build 1 message record for the 10 actions. In each
unique message record for each server, one EVALUATE can call upon the
message record with the 10 actions. Nesting is especially useful when changes
are required for 1 of the 10 predefined actions. You need to make the change
only in the message record called upon by EVALUATE. In contrast, placing all 10
actions in every message record for each server could result in days of work to
make a minor change to one of the actions.

Event Policy
38 Inside Event Management and Alert Management
Nesting is also a good way to deal with notifications. For example, build a
message record that notifies a particular person when a problem is detected. Call
the message record something generic for that individual or group (Tech One).
When the actions in a message record reach a point that this individual or group
needs to be notified, execute EVALUATE with the text of Tech One. Bill Brown is
the person to be notified if the message record Tech One is executed, but he
needs to go on vacation. Changing to his replacement, Tom Smith, is impossible
without using EVALUATE. By changing Bill Brown's notification actions to Tom
Smith's notification actions, you can make this change easily and in one place.
Deactivate and Reactivate Message Records (DISABLE and ENABLE)
To prevent other events from matching this message record while some actions
are being executed, use the DISABLE action before executing the group of
actions that need exclusive control, and use the ENABLE action after that group.
Using DISABLE and ENABLE in this way ensures that only one group of actions is
executed regardless of how many events of the same kind were generated at
that time.
Execute a Function (EXTERNAL)
You can use the EXTERNAL action to execute a defined function in a library (DLL).
The function must conform to the API standards. When you use this action, the
return code is available through the &RC variable. You can then evaluate the
return code using the conditional opcode and rc on the following action or a TEST
action to determine whether subsequent actions should be executed.
When using the EXTERNAL action, you should know the following:
■ Correct name of the function and the number and order of parameters
passed to it.
■ Return codes to expect from the function, so you can check for them in
subsequent actions.
Following are examples of how to use the EXTERNAL action.
Example 1
The following example accepts the second word of a message as a name of the
server and checks that OPR is running on that server (similar to the oprping
command). If OPR is running, the message is forwarded. If it is not running, the
FORWARD action is bypassed, and the operator is notified.
Sequence
Token
Action
Text
Conditional
Opcode
Conditional
RC
10 190 EXTERNAL Cauevt.dll
EmEVT_ping
0

Event Policy
Chapter 2: Managing Enterprise Events with Event Management 39
Sequence
Token
Action
Text
Conditional
Opcode
Conditional
RC
&2
20 190 GOTO 50 NE 0
30 190 FORWARD 0
40 190 EXIT 0
50 190 SENDKEEP Event
Management
on &2 is
unavailable.
0
Example 2
The following example uses the Microsoft Visual C Run-Time library, which
always exists in your PATH. The msvcrt.dll contains most common C functions
including, but not limited to, functions from POSIX standard. The following action
identifies the length of the message.
Sequence
Token
Action
Text
Conditional
Opcode
Conditional
RC
10 191 EXTERNAL msvcrt.dll
strlen
&TEXT
0
20 191 SENDOPER The string
length of
the \&TEXT
variable is
&RC.
0
Example 3
The following example executes a beep using user32.dll.
Sequence Token Action Text Conditional
Opcode
Conditional
RC
10 192 EXTERNAL user32.dll
MessageBeep
0

Event Policy
40 Inside Event Management and Alert Management
Call Attention to the Highest Severity IT Events (ALERT)
When a serious situation occurs, such as an important server going down or
degraded system performance, you need to ensure that it receives immediate
attention. The ALERT action lets you create Alert Management System (AMS)
alerts for such situations. Although alerts are functionally similar to Event
Management held messages, you can organize them in more complex ways.
They also provide powerful capabilities to help resolve problems.
Do not create ALERT actions until you have first installed and configured AMS.
Use Unicenter MCC to view and manipulate alerts. See the chapter "Monitoring
Your Enterprise with the Alert Management System" for more information.
When you select the ALERT action, two fields become available on the Message
Record Action - Detail window: Alert class id and Alert Text. For more
information, see Message Policy for Alerts (see page 186).
Note: Alerts should be a small subset of the events that occur. They should
represent only events that require human intervention or provide information
critical to continued normal operations. We recommend no more than 1,000
alerts per day. There are two reasons for this. First, if few alerts are generated,
the operations staff can focus more easily on what is important. Second, AMS is
a complex system and each alert consumes more computing resources than
other events. By carefully designing your AMS configuration and policy, you can
help ensure that you get the most benefit from AMS.
Notify Recipients of Important Events (NOTIFY and NOTIFYQ)
Some events require that you get the attention of operators or administrators
who must resolve a situation. The NOTIFY action lets you send messages to
individual recipients or groups of recipients to notify them about important
events. The NOTIFYQ action lets you wait and retrieve status and optionally reply
to previously issued notifications. For both actions, various protocols are
available, including email, telephony, and Short Message Service (SMS).
Unicenter Notification Services must be active on the node where the message
action is executed.
The NOTIFY action uses a syntax similar to the UNOTIFY command. The
NOTIFYQ action uses a syntax similar to the UQUERY command.
When a NOTIFY action completes, the notification request ID is stored in the
&REQID variable. The NOTIFYQ action can use the &REQID variable to check for
the completion of the previously completed NOTIFY action.

Event Policy
Chapter 2: Managing Enterprise Events with Event Management 41
Using Wildcards to Build Message
Using wildcards helps build message records that match multiple events from
multiple nodes, generated by multiple event sources. Without wildcards, you
would need to build a message record for every significant message, causing
Event Management to operate less efficiently and making it more difficult to
manage because of the sheer number of message records. Wildcards let you
create well-organized message records that match a multitude of messages.
When building message records using wildcards, keep the following rules in
mind:
■ Message ID is evaluated against the equivalent portion of the incoming
message. If the Message ID consists of five words, it is evaluated against the
first five words of the incoming message. Any additional words are not
considered.
■ In the evaluation process, a word is defined as one or more contiguous
characters bounded by a space on both sides.
■ A multiple character wildcard, asterisk (*), bound by spaces and occurring at
the beginning, in the middle, or at the end of a Message ID denotes a word
of one or more characters in length.
■ A multiple character wildcard, asterisk (*), appended to a character or group
of characters denotes zero or more additional characters.
■ A single character wildcard, question mark (?), denotes a single character.
Define a Calendar
By defining calendars, you can configure message records to apply different
Event policy on different dates and at different times. Calendars let you set
specific date and time criteria so Event Management knows which dates and
times are valid. To identify a previously defined calendar, enter its name in the
Calendar prof field on the Config page of the Message Record - Detail window.
If you specify a calendar name that is not defined, the event fails to match the
message record even if all other fields match.
To define a calendar
1. Open Calendar Management.
The Calendars container appears.
2. Click the New button on the toolbar.
The Calendar - Detail window appears.

Event Policy
42 Inside Event Management and Alert Management
3. Enter a name and description for the calendar.
4. If the calendar is for one year, enter that year and select Fixed in the Type
field. If the calendar is for all years, select Perpetual in the Type field.
5. To specify the days in your calendar using words, select from the drop-down
lists of the Date and Time Wizard. You can also choose weeks and days by
clicking the buttons on the graphical representation of a calendar. Click the
month tabs to navigate the calendar.
Note: If you enter February 29 for a year that is not a leap year, no error
message appears. This feature lets you copy calendars from year to year.
(To copy a calendar, select it in the Calendars container and click the Copy
button on the toolbar.)
6. To specify times of day in your calendar, click the button labeled Show detail
time view.
The Calendar - Detail window expands to include the Time View, which
contains numbered buttons representing each 15-minute time period in a
day. Click the buttons to select times of day.
7. To apply the same time to other days, click the Copy Time button, select the
day(s), and click Copy Time again.
8. Click OK to save the calendar.
Using Regular Expressions
When you check Use Regular Expression on the Config page of the Message
Record - Detail window, the message record matches using regular expressions.
This setting affects most of the configuration fields in a message record, with the
exception of Message ID. If you do not check Use Regular Expressions, the
message record matches using wildcards, which is the default.
Regular expressions recognize patterns in text data. They evaluate input strings
and return an answer of true or false. That is, either the input string matches, or
it does not. Regular expressions consist of characters to be matched, and special
characters that further describe the data. The description specified by special
characters (also called meta-characters) can be in the form of position, range,
repetition, and placeholders.
Letters and characters that are not special characters match themselves. For
example, the regular expression "test" exactly matches the string "test."

Event Policy
Chapter 2: Managing Enterprise Events with Event Management 43
Special characters do not match themselves. Instead they signal that some
out-of-the-ordinary thing should be matched, or they affect other portions of the
regular expression by repeating them. The following table lists the special
characters.
Character Name
\ Backslash
. Period
^ Carat
$ Dollar sign
* Asterisk
+ Plus sign
? Question mark
| Separator
{ Left curly bracket
[ Left bracket
( Left parenthesis
) Right parenthesis
] Right bracket
} Right curly bracket
Backslash (/)
A backslash turns off the special meaning of a special character. This is called
escaping. Use the backslash when the pattern you are trying to match in a
message contains a special character.
Single Character (.)
A single character matches any single character except the newline character,
which is a period at the end of a line.

Event Policy
44 Inside Event Management and Alert Management
Anchors (^ and $)
Anchors tie the pattern to a front and back of a group of characters being
matched. A carat ties the search pattern to the front of the group. A dollar sign
ties the search pattern to the back. For example, "^Router" matches the
message "Router Down", and "Critical$" matches the message "Server Critical".
If you do not use an anchor, the regular expression matches the message if the
pattern appears anywhere in the string. For example, "set" matches three times
in the message "The settings on the configset prevented the resetdsm." When
you want to match an exact string of characters only, use an anchor on both
ends. For example, "^System Down$" matches the message "System Down". If
any additional words or characters appear before or after the "System Down"
message, the regular expression does not match.
Character Sets and Ranges ([ ])
Character sets and ranges define a set of characters used individually or as a
group to match the message. When entering characters inside of brackets, you
can enter them individually or as a range. For example, you can use [abc] or
[a-c] to define that if an "a" or "b" or "c" or any combination of "abc" appears,
match the message.
Anchors used inside of brackets have different meanings. The carat (^) means
do not match, and the dollar sign ($) loses its special character meaning and only
represents a dollar sign. For example, [^abc$] means do not match the
characters "abc$" either individually or combined.
Modifiers
Modifiers define repetition (how many times to match the previous character). In
regular expressions, the asterisk (*) tells the system to match zero or more
instances of the previous character. For example "ct", "cat", and "caaat" all
match the regular expression ca*t.
Be careful using the asterisk (*). It is known as a greedy expression because it
tries as many times as possible to match the characters it represents. For
example, the regular expression a[bcd]*e matches a message of "abcde", but
the system would match "a" plus zero or more instances of the letters "b", then
"c", then "d", and then check all for the next character "e". It does not stop after
the first match.
The plus sign (+) works like the asterisk (*) except it requires at least one match
of the character. Zero instances do not match. For example, the messages "cat"
and "caaat" match the regular expression ca+t, but "ct" does not match,
because it has no instances of the letter "a".
The question mark (?) represents zero or only one instance of a character. For
example, "ct" and "cat" match the regular expression ca?t, but "caaat" does not
match, because it has more than one instance of the letter "a".

Event Policy
Chapter 2: Managing Enterprise Events with Event Management 45
The repeating qualifier is another way to define repeating characters. It uses
curly brackets or braces to identify the minimum and maximum times an
instance should appear. For example, ca{2,4}t matches "caat", "caaat", or
caaaat", but does not match "cat" or "caaaaat".
Interval Operators
Interval operators identify pattern repetitions that are being matched in the
input string. The allowed formats are {count}, {min}, {min,max}. For example,
"a{3}" matches "aaa" only. "a{3,} matches "aaa", "aaaa", "aaaaaaa", and so
forth. "a{3,5}" matches "aaa", "aaaa", and "aaaaa" only.
Group Operators
Grouping operators, used in combination with the interval operator, specify a
repeated group of characters being matched against in the input string. For
example, "(abc) {2}" matches "abcabc" only.
Alternation Operators
Alternation operators provide OR operation to logical expressions. For example,
"a|b" matches "a" OR "b".
Word Operators
Word operators determine how patterns should match against words in the input
string. The following table contains examples of word operators:
Word Operator Description
Match-Word-Boundary: \b "\brat" matches the separate word "rat",
but not "crate".
Match-Within-Word: \B "\Brat" matches "crate", but not "rate".
Match-Beginning-Of-Word: \< "\<rat" matches the word "rate", but not
"brat".
Match-End-Of-Word: \> "\>rat" matches the separate word
"brat", but not "rate".
Match-Word-Constituent: \w Matches A-Z, a-z, and 0-9.
Match-Non-Word-Constituent: \W Matches anything but A-Z, a-z, and 0-9.

Event Policy
46 Inside Event Management and Alert Management
Regular Expression Examples
The following table contains examples of regular expressions:
Regular Expression Description
. Match any single character except the newline
character (a period at the end of the line).
* Match zero or more instance of the single character
(or meta-character) immediately preceding it.
[abc] Match any of the characters enclosed.
[a-d] Match any character in the enclosed range.
[^exp] Match any character not in the following expression.
^abc Regular expression must start at the beginning of the
line (anchor).
abc$ Regular expression must end at the end of the line
(anchor)
\ (Preceding a special character) treat the next
character literally. Used to escape the meaning of
special characters such as "." and "*".
{n,m} Match the regular expression preceding this a
minimum number of n times and a maximum of m
times.
cat Match the string cat.
.at Match any occurrence of a letter, followed by at, such
as cat, rat, mat, bat, fat, hat.
xy*z Match any occurrence of an x, followed by zero or
more y's, followed by a z.
^cat Match cat at the beginning of the line.
cat$ Match cat at the end of the line.
\* Match any occurrence of an asterisk.
[cC]at Match cat or Cat.
[^a-zA-Z] Match any occurrence of a non-alphabetic character.
[0-9]$ Match any line ending with a number.
[A-Z][A-Z]* Match one or more uppercase letters.
[A-Z]* Match zero or more uppercase letters.
ab* Match a string that has an a followed by zero or more

Event Policy
Chapter 2: Managing Enterprise Events with Event Management 47
Regular Expression Description
b's
ab+ Match a string that has an a followed by at least one
b ("ab", "abbb", and so forth).
ab? Match a string that has an a that might or might not
be followed by b.
a?b+$ Match a string that has a possible a followed by one
or more b's ending a string.
ab{2} Match a string that has an a followed by exactly two
b's.
ab{3,5} Match a string that has an a followed by three to five
b's.
a(bc)* Match a string that has an a followed by zero or more
of the sequence "bc".
a(bc) {1,5} Match one through five copies of "bc".
a.[0-9] Match a string that has an a followed by one
character and a digit.
^.{5}$ Match a string with exactly five characters.
[ab] Match a string that has either an a or a b.
[a-d] Match a string that has lowercase letters a through d.
^[a-zA-Z] Match a string that starts with a letter.
[0-9]% Match a string that has a single digit before a percent
sign.
Using Variables to Enhance the Current Action
You can use variables to extract parts of the message or message record to
further enhance the current action being performed. The following tables list the
variables that Event Management uses.
Event-Related Variables
The values of the following variables are taken from the event that triggered the
action. If the field does not exist in the event, the null string ("") is used.
Variable Realtime Value
&CATEGORY CATEGORY field from the event

Event Policy
48 Inside Event Management and Alert Management
Variable Realtime Value
&DATEGEN Date when the event was generated. Format is
YYYY/MM/DD.
&DEVICE Device field from the event.
&JOBNAME JOB NAME field from the event
&JOBNO JOB NUMBER field from the event
&JOBQUAL JOB QUALIFIER field from the event.
&JOBSET JOB SET field from the event.
&MSGNUM MESSAGE NUMBER field from the event.
&NODEID Node name from which the event originated.
&PID Process ID (PID) of the process that generated the
message.
&PROGRAM PROGRAM field from the event.
&SEVERITY SEVERITY field from the event.
&SOURCE SOURCE field from the event.
&STATION WORKSTATION field from the event.
&TAG PLATFORM TAG field from the event
&TEXT Full text of the message.
&TIMEGEN Time when event was generated in format
HH:MM:SS.
&TYPE Type of message (MSG, CMD, WTOR, and so forth).
&UDATA USER DATA field from the event.
&USERID User ID of the person who originated the message.
&1 &2 ... &99 (&n...&nn) Positional words from the start of the message text.
Delimited by spaces only.
&R1 &R2... Positional words from the end of the event text.
&(Rm:Rn) Range of tokens from the end of the event text.
&ORIGUSER Original user ID of the acknowledged event.

Event Policy
Chapter 2: Managing Enterprise Events with Event Management 49
Variable Realtime Value
&ORIGNODE Original node ID of the acknowledged event.
&NODENAME The node name part of DOMAIN\NODENAME of the
node ID from which the event originated.
&NODEDOMAIN The domain part of DOMAIN\NODENAME of the node
ID from which the event originated.
&EVENTDATA Event data field from the event.
&(n1:n2) Range of tokens. See Range of Tokens.
&(Rn:Rm) Reverse range of tokens. See Reverse Range of
Tokens.
Range of Tokens
In addition to &n for token number n (space separated word) in the event text,
use &(n1:n2) expression for a range of tokens.
The syntax is &(n1:n2) where n1 and n2 are numeric or can be omitted.
Substituted tokens are separated by one space. If n1 > n2, tokens are
substituted in reverse order. Null (" ") is substituted for tokens not available in
current event text. If token range expression is not valid, for example, &(3?Z),
the same expression text is used. &(n1:) expression is especially useful if the
number of actual tokens can vary or is not known in advance. Tokens are created
from the original event text using white space (spaces, tabs, new lines, and so
forth) as delimiters. On systems with languages that use space sparingly (such
as Chinese) only the first token (&1) is assigned a value (the whole text).
The following examples assume 33 tokens are in the current event text:
■ &(7:22) is equivalent to &7 &8 &9 ... &22.
■ &(22:7) is equivalent to &22 &21 &20 ... &7.
■ &(16:) is equivalent to &16 &17 ... &33.
■ &(:) is equivalent to &1 &2 ... &33, or &text.
Note: To specify the ampersand (&) as an ampersand, use the backward slash
(\) character. For example, instead of Jack & Jill, use Jack \&Jill.

Event Policy
50 Inside Event Management and Alert Management
Reverse Range of Tokens
You can use &Rn for reverse positional reference token number n (separated by
delimiters) in the event text. For example, &R3 is the third word counting from
the end of the message, and &R1 is the last word counting from the end of the
message. You can use either R or r before the number.
The syntax is &(Rn:Rm). All rules described in Range of Tokens apply to reverse
range of tokens. You can use a mixed range of tokens: &(n:Rm) and &(Rn:m). If
the number is out of range, it is bound by the maximum and minimum of the
event message text.
Database-Related Variables
When an action is executed, these variables are extracted from the message
record that triggered the action.
Variable Realtime Value
&MSGID Full message ID from the MSGRECORD that triggered this
action.
&SEQNO Sequence number of current action.
&TOKEN ID of message record in database with which this action is
associated.
Current Processing Environment Variables
Following are the current processing environment variables:
Variable Realtime Value
&ACTMSG Status message from the Notification Services SDK.
&DATED System date in format DD/MM/YY.
&DATEM System date in format MM/DD/YY.
&DATEY System date in format YY/MM/DD.
&DAY System day in format MONDAY, TUESDAY, and so
forth.
&LOGRECID Record ID of the last record written to the log when
the command is invoked (possibly the current event
if it is not suppressed).
&MSGLOGRECID Record ID of the message that triggered execution
of the message action. Stays unchanged for the
whole cycle of MSGACTION execution if there are

Event Policy
Chapter 2: Managing Enterprise Events with Event Management 51
Variable Realtime Value
more than one MSGACTIONs associated with the
MSGECORD. Is zero if an original message is not
written to the log file.
&OPNODE Name of the node on which Event Management is
processing this message action.
&OPPID Process ID of the Event Manager daemon.
&OPUSER Name of the user under which Event Management is
processing this message action.
&RC Return code from the previous action.
&REPLID Reply ID to be used to respond to the message, if
the message is a WTOR.
&REQID Notification request tracking identifier obtained
from NOTIFY or NOTIFYQ actions.
&RPLYTEXT Text of operator REPLY to WAITOPER, NOTIFY,
NOTIFYQ action.
&TIME System time in format HH:MM.
&TIME8 System time in format HH:MM:SS.
&MMDDYYYY System date in format MM/DD/YYYY.
&DDMMYYYY System date in format DD/MM/YYYY.
&YYYYMMDD System date in format YYYY/MM/DD.
$ENVNAME or
&($ENVNAME)
Current value of the named environment variable.
Use Back-Quote Processing in a Message Action
Sometimes you may need to execute a command or script in a message action
and use the output in subsequent message actions. You can use back-quote
processing to accomplish this.
When you enclose a portion of the Text field of a message action in back-quotes
(`), the back-quoted text is treated as a command. Before the message action is
executed, the back-quoted text is passed to the operating system to be
executed. When the execution is complete, output directed to STDOUT is
substituted for the back-quoted command or script, and the message action is
executed.

Event Policy
52 Inside Event Management and Alert Management
To use the output from the back-quoted command in subsequent message
actions, use the EXPORT action to assign it to an Event Management variable.
For example:
Sequence
Token
Action
Text
Conditional
Opcode
Conditional
RC
10 189 EXPORT myvar=
`myapp
&3`
0
20 189 TEST "$myvar"
= "PROD"
0
30 189 GOTO 60 NE 0
40 189 SENDKEEP Production
server &3
requires
service.
0
Create Multiple Message Actions
After a message record has been matched, the Event policy implemented is
determined by the actions defined and associated with this message record. The
linking factor is the message record token number, which was automatically
generated when the message record was created.
Message record actions are indexed and performed by their sequence number.
You can enter the number manually or enter an asterisk (*) so the machine will
generate it. When you enter an asterisk, the system automatically takes the last
sequence number used for this message record and adds 10 to allocate space
between actions. Then, if necessary, later you can add actions to be performed
after and before the current sequence of actions. By noting the token number in
the upper right corner, you can identify the message record to which this action
is assigned.
The Text field specifies the text associated with the actions. Depending on the
action selected, this field may have different entries or meanings. When this field
is left blank, the message is used as if it were entered into the Text field.

Event Policy
Chapter 2: Managing Enterprise Events with Event Management 53
Replicate Message Records and Actions
You can copy and rename message records and actions. When copying a
message record, you must provide a new message ID, so the system will
generate a new token number for the new message record. Actions associated
with the message record will also be copied. If you want to have message
records with identical message IDs, you cannot rename or copy them. You must
create a new message record. When renaming a message record, you must
provide a different message ID. The token number will remain the same.
Actions within a message record work in a similar way. To copy or rename an
action, you must provide a unique sequence number. Actions can only be copied
within the message record with which they are associated. Exporting the
database is the only way to replicate actions within a message record in another
message record.
Exporting the database lets you back up the database in case of a system failure
and export the Event policy from one Event Manager to another. Because the
policy is exported to a text file, it is easy to duplicate and edit when multiple
unique message records and actions are needed. The command to export the
database is:
oprdb script db > filename
This command produces an ASCII file that you can view and manipulate easily
Since the token number is not exported, when the file is imported, new token
numbers are generated based on the current control number of the database.
The command to import the file into a new or different database is:
cautil -f filename
Since this command appends, but does not replace the existing message records
and actions within the database, the token number is not exported. When the file
is imported, each message record receives a new, system-generated token
number, even if it came from this database.
Restrict Message Actions
On UNIX/Linux platforms, Event Management lets you restrict the nodes and
RUNIDs authorized to send the message actions COMMAND, UNIXCMD and
UNIXSH to your local host.
During installation, if setup detects that Event Management was previously
installed at that node, a message appears informing you of the new message
action restriction feature and the default setting that disables message action
restriction. You have the opportunity to override the default and enable message
action restriction.

Event Policy
54 Inside Event Management and Alert Management
If you accept the default response n to the prompt for message action restriction,
setup creates the actnode.prf configuration file for you with a single entry of
-n=*,*,E to allow all RUNIDs from all nodes to submit these message actions.
If you instead respond to the prompt for message action restriction, setup
creates the actnode.prf configuration file with a single entry of -n=*,*,D to deny
all RUNIDs from all nodes the ability to submit these message actions.
When setup detects that you are installing Event Management for the first time
on the node, a message appears informing you of the new message action
restriction feature and the default setting that disables message action
restriction. You are given the opportunity to override the default and enable
message action restriction at that time.
If you accept the default response n to the prompt for message action restriction,
setup creates the actnode.prf configuration file for you with a single entry of
-n=*,*,E to enable message action submission for all RUNIDs from all nodes.
If you instead respond y to the prompt for message action restriction, setup
creates the actnode.prf configuration file with a single entry of -n=*,*,D to
disable all RUNIDs from all nodes from submitting these message actions.
You can change this rule at any time after installation by executing the caevtsec
utility located in the $CAIGLBL0000\bin directory. The utility only allows the uid
0 user to maintain the file and preserve the file permissions. The file may also be
maintained using a UNIX/Linux text editor. For more information about using the
caevtsec utility, see the online CA Reference.
The actnode.prf configuration file is located in the
$CAIGLBL0000/opr/config/hostname directory. You can use this file to maintain
policies that specify how message action restriction is to be enforced based on
the submitting node and RUNID. The file must be owned by root and only a uid
of 0 may have write access to it. An individual entry in the file has the following
format:
-n=nodename,runid,flag
nodename
Specifies the node from which the COMMAND, UNIXCMD or UNIXSH
message action is initiated; it may contain a trailing generic mask character.
runid
Specifies the node from which the COMMAND, UNIXCMD or UNIXSH
message action is initiated; it may contain a trailing generic mask character.

Event Policy
Chapter 2: Managing Enterprise Events with Event Management 55
flag
Specifies D for disable (feature is active; disallow the message action
submitted by RUNID from nodename), E for enable (allow the RUNID from
nodename to submit the message action), or W for warn (check the rule but
allow the message action submission to occur).
For example:
-n=*,*,E
is the default rule in effect if, during installation, you elected not to activate
message action restriction. The rule states that for all nodes and all RUNIDs,
COMMAND, UNIXCMD and UNIXSH message action submission is allowed.
-n=*,*,D
is the default rule in effect if, during installation, you elected to activate message
action restriction. The rule states that for all nodes and all RUNIDs, COMMAND,
UNIXCMD and UNIXSH message action submission is disallowed.
-n=*,*,E
-n=*,root,D
enforces a message action restriction on RUNID root and allows all other RUNIDs
to submit the message actions.
-n=*,*,E
-n=mars,*,D
-n=*,root,W
allows all RUNIDs to bypass message action restriction unless the request comes
from the node mars. In that case, message action restriction is enforced for all
RUNIDs. The last entry sets a warning type restriction rule for RUNID root if it
comes from a node other than mars.
Event Management scans the entire configuration file for a best match and uses
that rule. It uses the node field as a high level qualifier when searching for a best
match. For example if the following are the only two entries in the file, any
request coming from the node mars uses the disallow rule. The user root only
uses the warning rule if the request comes from a node other than mars.
-n=mars,*,D
-n=*,root,W
Note: On Windows, to execute a command a user must be defined in the Users
Authorized to Issue Commands configuration setting.

Event Policy
56 Inside Event Management and Alert Management
Test Policy by Simulating Messages
Event policy can be difficult to test because messages have so many variables
that are not easily duplicated unless generated by an actual event. The cawto
command, which sends a message to the console, lets you test message policy
by sending a message without creating the associated event.
To test policy by simulating messages, open a command-line interface, and
enter the cawto command using the options for simulating messages.
cawto Command—Send a Message to the Console
Valid on Windows, UNIX, and Linux
The cawto command sends a message to the Windows console or the system
console without waiting for a reply. You can also use cawto to test new policies on
Windows by simulating an event.
Notes:
■ To send a message and wait for a reply, use the Event Management cawtor
command.
■ If the Event Management daemon or CAICCI is down, the following files are
created so that the cawto and careply commands can continue to function.
The extension n is the message number the cawto command generated, and
is the same as the process that issued the cawto command.
/usr/tmp/cawto.n
■ If cawto does not work between two manager nodes on UNIX or Linux, enter
a REMOTE entry in $CASHCOMP/ccs/cci/config/hostname/ccirmtd.prf.
Restart CAICCI.
This command has the following format:
Windows
cawto [options] message-text
Standard options:
[-cat/-g category] [-msg msgnum] [-s/-sou source] [-sev/-v severity] [-a attribute]
[-c color] [-i] [-k] [-l] [-n node]
UNIX and Linux
Standard options:
cawto [-a attribute] [-c color] [-g category] [-k] [-n node] [-s source] message-text

Event Policy
Chapter 2: Managing Enterprise Events with Event Management 57
Windows, UNIX, and Linux
Options for simulating a message in order to test new policy:
[-fr_node node] [-fr_user user] [-off record-offset] [-env variable] [-sta station]
[-dev device] [-udata user-data] [-tag tag] [-f file-name] [-h]
message-text
Specifies the text of the message.
Note: Because the cawto command is issued from the command line, the
text string you specify is subject to evaluation by the shell you are executing.
Therefore, embedded blanks, special characters, and quotation marks in the
text string require special consideration. See the documentation for your
operating system for the rules about text strings.
Limits: 1 - 255 characters
-cat/-g category
Specifies the category associated with the event.
Limits: 1 - 255 characters
Default: none
-msg msgnum
Specifies a numeric value associated with the message (event) that names
the message. It is part of the prefix for messages, for example,
CASH_999_W where 999 is the message number.
Limits: 1 - 8 digits
Default: none
-s/-sou source
Identifies the application that is the source of the message (event). For
example, CASH_999_W, where CASH is the source of the event and
CASH=Job Management Option.
Limits: 1 - 255 characters
Default: none

Event Policy
58 Inside Event Management and Alert Management
-sev/-v severity
Displays the severity of the message. In the GUI Console, various icons
appear to the left of events to indicate the severity.
Limits: 1 - 3 characters. We recommend the following to ensure that icons
appear:
I
Informational
S
Success
W
Warning
E
Error
F
Failure
Default: none
-a attribute
Indicates how the message should be displayed on the system console.
Supported attributes are:
■ DEFAULT
■ BLINK
■ REVERSE
Note: You can specify the attribute name in upper, lower, or mixed case.
Default: DEFAULT

Event Policy
Chapter 2: Managing Enterprise Events with Event Management 59
-c color
Indicates that the message should be displayed on the system console in the
identified color. Supported colors are:
■ Default
■ Red
■ Orange
■ Yellow
■ Green
■ Blue
■ Pink
■ Purple
Note: The color name is not case-sensitive.
Default: Default
-i
Prevents the event from being displayed in the Event Console (invisible), but
records the message in the console log. This has the same functionality as
the SUPPRESS message action.
-k
Specifies that the message should be kept in the held messages area on the
Console.
On Windows only, when a user acknowledges or replies to a held message, a
new event is generated. The new event is a copy of the original, except that
the message text is preceded with %CAOP_I_ACKED and the user ID and
node are replaced with the user ID and node that acknowledged or replied to
the message. See Acknowledging or Replying to Held Messages in the CA
Procedures for more information.
-l
Logs the message without matching it against message record and action
policies.
-n node
Specifies the node name or IP address to which the message is directed.
Note: On UNIX and Linux, you must specify a node name rather than an IP
address. The name should match the output of the command uname -n for
the remote computer.
Limits: 1 - 64 characters
Default: local node. However, if no node is specified and CA_OPERA_NODE
or CAI_WTOR_NODE is set, the node in the variable is used.

Event Policy
60 Inside Event Management and Alert Management
-fr_node node
Specifies the node where an event originated. The node name need not be
valid because fr_node is used primarily for testing new policies.
Limits: 1 - 64 characters
Default: local node
-fr_user user
Specifies the user ID that sent an event. The fr_user parameter is used
primarily for testing new policies.
Limits: 1 - 32 characters
Default: user sending cawto command
-off record-offset
Specifies the offset of the record in today's log file to be sent to the Event
daemon. When you use -off, message-text is ignored.
-env variable
Specifies a previously set environment variable whose value is used as
message text. When you use -env, message-text is ignored.
Limits: 1 - 255 characters
Default: none
-sta station
Specifies the workstation that originated the event.
Limits: 1 - 20 characters
Default: Job Management Option workstation if the event is issued from a
running job.
-dev device
Specifies the device ID associated with this event.
Limits: 1 - 255 characters
Default: none
-udata user-data
Specifies user-defined information, like a logical expression, associated with
this event.
Limits: 1 - 255 characters
Default: value of CA_UDATA environment variable

Event Policy
Chapter 2: Managing Enterprise Events with Event Management 61
-tag tag
Specifies a tag associated with this event.
Limits: 1 - 255 characters
Default: WNT on Windows
-f file-name
Specifies the name of an existing text file that contains one or more
messages. Each line of text is a separate message unless you remove the
end-of-line characters. When you use -f, message-text is ignored.
Limits: 1 - 255 characters
Default: none
-h
Highlights the message text on the Console.
Example: Send a Message
This example alerts the console operator on node 23 that the node is not
accepting FTP connections and asks for corrective action. The message is
displayed in red and kept on the node 23 Console as a held message until the
node 23 operator releases it.
cawto -k -n23 -c red node23 is not accepting ftp -- please investigate
cawto -k -n 23 -c red node23 is not accepting ftp -- please investigate

View Event Messages
62 Inside Event Management and Alert Management
View Event Messages
When events occur, EMS writes messages to a console log file and displays them
on the Event Console. The Console makes it easy for you to view messages and
then resolve the situations that caused the events to occur.
When you select Console Logs from the drop-down list above the left pane of the
Management Command Center, the tree lets you navigate to the server that
contains the logs you want to view. For each month, you can choose today's log
or a previous one in the same month.
The Event Console has the following areas:
Held Messages
Displays messages that require an acknowledgement or reply from an
operator. This area is at the top of the Console, and appears only when held
messages exist. A check mark icon indicates the messages to acknowledge,
and a telephone icon indicates messages that need a reply. After
acknowledgement or a reply, the message is removed from the help
message area.
Log Messages
Displays all messages in the daily console log, including held messages.
Through message records and actions, you can assign a variety of colors and
attributes to make some messages more noticeable on the console than
others.
Note: The Console Log in the Management Command Center does not have a
command line or command buttons as the other GUIs do. This is because you
can define and run commands from anywhere, not just the Console Log, using
the My Actions menu.
For detailed information about the Console Log window, see the online help.
This section contains the following information about console messages:
■ Descriptions and example of message formats.
■ Procedures for managing console messages: filter messages from the
Console Log, acknowledge a message, reply to a message, view message
properties, and annotate a message.
■ Several ways to create, acknowledge, reply, and purge held messages.
■ Naming convention and location of console log files.
■ Information about sending a notification to an administrator or operator.

View Event Messages
Chapter 2: Managing Enterprise Events with Event Management 63
Message Formats
Message formats depend on the source of the events that generate them, such
as:
■ DSM events
■ Agent events (SNMP messages)
■ CA product messages
■ CAWTO and CAWTOR messages
■ CAOPRLOG messages
■ Cisco events
Following are descriptions and examples of these formats.
DSM Event Formats
Messages from the DSM are generated because of a state change. When Event
Management receives a message from the DSM, it has the following format.
Word Description
1st DSM class
2nd WorldView class
3rd Agent or DSM manager (Cisco_Manager)
4th Message type
5th Agent resource object
6th Previous state of objec
7th New state of object
8th Description of object, followed by specific data
related to its status
Following is an example of a message from a CA Agent through the DSM - trap.
Host:Windows2000_Server Windows2000_Server caiW2kOs Trap
Agent:caiW2kOs:w2kMemPhys Up Critical Physical Memory Prop=Phys
Val=638988 Warn=104757 Crit=314272
Following is an example of a message from the DSM about a CA Agent - poll.
Host:Windows2000_Server Windows2000_Server caiW2kOs Poll
Agent:caiW2kOs:w2kMemPhys Up Critical Physical Memory Prop=Phys
Val=638988 Warn=104757 Crit=314272

View Event Messages
64 Inside Event Management and Alert Management
Following is an example of a message from the DSM about the node - PingIP
(policy).
Unclassified_Class:Unclassified_TCP Unclassified_TCP PingIP Policy
PingIP Unmanaged Unknown PingIP
Following is an example of a message from the DSM about the node - Ping Agent.
Host:WindowsNT_Server WindowsNT_Server Ping Poll Agent:Ping Up
Broken Ping
Following is an example of a message from the DSM about the node -
IP_Interface (policy).
Workstation:WindowsXP WindowsXP Mib-II Policy IP_Interface
Unknown Up (65539) 10.1.48.17 ifdescr(Intel(R) PRO/100 VM
Network Connection
Following is an example of a message from the DSM about the node (switch) -
MIB-II (policy).
Switch:CISCO_SWITCH CISCO_SWITCH Mib-II Policy IP_Interface
Unknown Up (1) IP_ADDRESS ifdescr(sc0)
Following is an example of a message from the DSM about the node (switch) -
Chassis (policy).
Switch:CISCO_SWITCH CISCO_SWITCH Chassis Policy swModule
Unknown ok WS-X5225R(10)
Agent Event Formats (SNMP Messages)
Event Management receives SNMP messages directly from the CA Trap Daemon
(CATRAPD). Each message has the following format.
Word Description
1st Source of message (%CATD - Trap Daemon)
2nd SNMP message type (PDU - SNMPTRAP)
3rd Community string parameter used (-c)
4th Community string
5th Enterprise ID
6th IP address
7th Node name

View Event Messages
Chapter 2: Managing Enterprise Events with Event Management 65
Word Description
8th Generic MIB
9th Generic trap type
10th Enterprise specific trap type
Following is an example of an SNMP message from a CA agent (MIB - 791).
%CATD_I_060, SNMPTRAP: -c public 791 192.168.0.12 CALC0102 0 0
11:56:52
Following is an example of an SNMP message from a Cisco device (MIB - 9).
%CATD_I_060, SNMPTRAP: -c public 9 192.168.0.1 CALCRT01 2 0
11584:42:34 0 OID: 1.3.6.1.2.1.2.2.1.1.74
interfaces.ifTable.ifEntry.ifIndex.74 VALUE: 74 OID:
1.3.6.1.2.1.2.2.1.7.74 interfaces.ifTable.ifEntry.ifAdminStatus.74
VALUE: 1 OID: 1.3.6.1.2.1.2.2.1.8.74
interfaces.ifTable.ifEntry.ifOperStatus.74 VALUE: 2 OID:
1.3.6.1.2.1.31.1.1.1.1.74 .31.1.1.1.1.74 VALUE: 6/30
CA Product Messages
Messages from CA products vary greatly depending upon the application. Each
message has the following format.
Word Description
1st Source of message
2nd Message (may include name of application, time, date, description
of event, and other information)
See CA Messages for explanations of individual messages.
Following are examples of messages from Event Management.
%CAOP_I_DAEMONINIT, Console Daemon initialized on node
MININSM.
%CAOP_I_DBCACHED, Database (re)loaded on Thursday, January 22,
2004 10:46:51 AM.

View Event Messages
66 Inside Event Management and Alert Management
Following are examples of messages from Job Management.
%CASH_I_0098, Jobset 'DYNAMIC', Qual '2200' added to workload
%CASH_I_0050, Autoscan started at 12.00.02 for 01/04/2004 at
00.00.00, type = Automatic
Following is an example of a message from WorldView.
CATNG_2D_SYSTEM_0_I: <No Message Table> Component-
CATNG_2D_SYSTEM Unicenter 2D map for "CALC0102" ready.
Following is an example of a message from CA Licensing.
CA_LIC_5000_E: 'CA Licensing -3BA1 - License Failure. Please run the
appropriate license program to properly license your product.
LRF=3BA1, 000c29adba52, PC_1586_1_1695, MININSM, 0'
CAWTO and CAWTOR Messages
Messages generated by CAWTO or CAWTOR are simply the message. Whatever
you enter as the "Message-Text" is the message that Event Management
processes.
In the case of CA products that use CAWTO and CAWTOR to generate messages,
each message has the following format.
Word Description
1st Source (CA product plus node name)
2nd Event
3rd Description
Following is an example of a message from Unicenter Remote Monitoring.
URM.calc0101: Start: Unicenter Remote Monitoring Agent
CAOPRLOG Messages
Messages generated by the Windows operating system have eight distinct fields
(Type, Date, Time, Source, Category, Event, User, and Computer). Type is one
of the five severities: Information, Success, Warning, Error, or Failure). Source
is the device, process, application, or service that generated the event. Event is
the Event ID number associated with this source and type of event.

View Event Messages
Chapter 2: Managing Enterprise Events with Event Management 67
When CAOPRLOG processes the Windows operating system logs, the messages
have the following format.
Word Description
1st Event source + event ID number + event type
2nd Message
Following is an example of a message from the Windows system log.
BROWSER_8021_W: The browser was unable to retrieve a list of
servers from the browser master \\CALC0101 on the network
\Device\NetBT_Tcpip_{EDD34AB9-DAA0-4AD4-A117-B6FFCD604567}
. The data is the error code.
Following is an example of a message from the Windows application log.
TermServDevices_1111_E: Driver Xerox Document Centre 545 PCL 6
required for printer __usprint01_Xerox Document Centre 545PCL is
unknown. Contact the administrator to install the driver before you log
in again.
Following is an example of a message from the Windows security log.
Security_538_S: User Logoff: User Name: JDoe Domain: EDUCATION
Logon ID: (0x0,0x40B4866) Logon Type: 3
Cisco Event Formats
Following is an example of a message from the Cisco manager - trap received
from router:
Router:CISCO CISCO CISCO_Manager Trap
Agent:CISCO_Manager:AvgBusy1 Normal DeltaExceeded Last Minute
CPU Utilization
Following is an example of a message from the Cisco manager - poll generated
about router:
Router:CISCO CISCO CISCO_Manager Poll
Agent:CISCO_Manager:BufferFail Repaired DeltaExceeded Buffer
Allocation Failures

View Event Messages
68 Inside Event Management and Alert Management
Manage Console Messages
This section contains the following procedures:
■ Filter messages from the Console Log
■ Acknowledge a message
■ Reply to a message
■ View message properties
■ Annotate a message
Filter Messages from the Console Log
Console filters let you limit the number of messages displayed in the Console Log
Records.
To filter messages from the console log
1. Select Console Logs from the drop-down list in the left pane of the
Management Command Center.
The Console Logs (tree view) window appears in the left pane.
2. Drill down to the date of the console log from which you want to filter
messages, and select it.
Console Log Records for the selected date appear in the right pane.
3. Select a message, and right-click.
A context menu appears.
4. Choose Apply Filter.
A submenu containing a list of available filters appears.
5. Choose the filter you want to apply.
The display of the console log changes to reflect your choice.
Reply to Console Messages
You can select and reply to console messages in the Management Command
Center.
To reply to console messages
1. Select Console Logs from the drop-down list in the left pane of the
Management Command Center.
The Console Logs (tree view) window appears in the left pane.
2. Drill down to the date of the console log you want to view, and select it.
Console Log Records for the selected date appear in the right pane.

View Event Messages
Chapter 2: Managing Enterprise Events with Event Management 69
3. Select one or more messages, and right-click.
A context menu appears.
4. Choose Reply.
The Message Reply dialog appears.
5. Enter a reply, and click OK.
When you enter a reply, the original message disappears from the held
messages area. Both the original message and the reply appear in the log
messages area.
Acknowledge Console Messages
You can acknowledge console messages.
To acknowledge one or more console messages
1. Select Console Logs from the drop-down list in the left pane of the
Management Command Center.
The Console Logs (tree view) window appears in the left pane.
2. Drill down to the date of the console log you want to view, and select it.
Console Log Records for the selected date appear in the right pane.
3. Select one or more messages, and right-click.
A context menu appears.
4. Choose Acknowledge, and click OK.
The messages are acknowledged.
View Console Message Properties
You can view console message properties.
To view details about a console message
1. Select Console Logs from the drop-down list in the left pane of the
Management Command Center.
The Console Logs (tree view) window appears in the left pane.
2. Drill down to the date of the console log you want to view, and select it.
Console Log Records for the selected date appear in the right pane.
3. Select the message you want to view, right-click, and choose Properties.
The Console Message Properties dialog appears.

View Event Messages
70 Inside Event Management and Alert Management
Annotate a Console Message
You can add comments to messages that come across the console.
To annotate a console message
1. Display the Console Message Properties dialog as described in the previous
procedure. Click the Annotation tab.
The Annotation page appears.
2. Click the New button, enter text, and click Save.
The text you entered is appended to the selected message.
Held Messages
Held messages report critical situations that require immediate attention and an
acknowledgement or a reply from an operator. Event Management provides
several ways to create, acknowledge, reply to, and purge held messages.
Create Held Messages
You can create held messages using the following features of Event
Management:
■ SENDKEEP message action. Enter a message in the Text field or leave the
field blank to send the original message.
■ WAITOPER message action, which prompts the operator for a reply. Enter a
message in the Text field or leave the field blank to send the original
message.
■ cawtor command, or cawto with the -k parameter. (See the online
CA Reference.)
■ EmEvt_wtor() function or EmEvt_wto() function with the
EVTMSG_FLAG_KEEPMSG flag set. (See the CA SDK Developer Guide and
online CA SDK Reference.)

View Event Messages
Chapter 2: Managing Enterprise Events with Event Management 71
Acknowledge Held Messages
You can acknowledge held messages using the following features of Event
Management:
■ Context menu in the Console Log. Right-click one or more messages and
choose Acknowledge.
■ DELKEEP message action. For example, when you receive a message
reporting that a critical situation is resolved, the action could remove the
original message that reported the situation.
■ delkeep command.
■ EmEvt_ack() function in the SDK.
Reply To Held Messages
You can reply to held messages using the following features of Event
Management:
■ Context menu in the Console Log. Right-click a message and choose Reply.
■ AUTOREPLY message action.
■ careply command, which you can use to respond to held messages created
with the WAITOPER message action.
■ EmEvt_reply() function in the SDK.
Purge Held Messages
You can remove multiple held messages using the delkeep command. For
example, the following command removes all held messages older than 3600
seconds (1 hour) that start with INFO0001W:
delkeep -s 3600 INFO0001W*

View Event Messages
72 Inside Event Management and Alert Management
Console Log Files
Each day Event Management creates console log files that contain messages. As
the Event daemon processes these messages and takes action, these actions
and their results are also put in the daily log file. Everything is captured as it
occurs.
Each day at midnight, the daily log file is closed and a new one is opened. All held
messages from the previous day are copied to the new log file. Three or four files
are created:
■ yyyymmdd.log - Daily log for one day
■ yyyymmdd.idx - Index of held messages
■ yyyymmdd.ldx - Index of daily log
■ yyyymmdd.ann- File of annotations added to messages. This file is not
created if no annotations exist.
Settings
The following settings apply to the daily log:
■ CAI_CONLOG specifies the directory where the log files are located. The
default is Installpath\LOGS.
■ CA_OPR_RETAIN_LOGS specifies the number of daily log files kept on the
server. The default value is zero, which turns off this feature and tells Event
Management to keep the files indefinitely.
To update these settings, use the following tools:
■ Windows: Use the Windows Configuration GUI or the cautenv utility. For
example, the following command changes the number of retained logs to 30.
cautenv setlocal CA_OPR_RETAIN_LOGS 30
■ UNIX/Linux: Change the values in the
$CAIGLBL0000/opr/scripts/envusrlocal file.
Note: You can also change settings using the Job Management Option product.

View Event Messages
Chapter 2: Managing Enterprise Events with Event Management 73
Store and Forward
Store and forward (SAF) is a feature that stores messages locally when the Event
Manager on a remote node is not available. When you enable SAF for a remote
node and Event Management sends a message that cannot be delivered to the
Event Console on that node, the message is added to a list and forwarded when
the node is available again.
SAF is implemented by a daemon that periodically tries to reconnect to all nodes
for which there are SAF files. The SAF files are maintained per node, per day in
a directory specified by the CA_OPR_SAF_ROOT environment variable. Each
node eligible for SAF has directories where the stored messages are kept.
When SAF messages are sent to their destination, the message text is prefixed
with the following, and the message is deleted from the SAF list:
QMSG date time
The prefixes let message actions differentiate between timely messages and
those delivered after some delay.
SAF Configuration
The settings for Store and Forward are listed in the following table. You can set
these variables using the Windows Configuration GUI, the cautenv utility, or the
secopts file on UNIX/Linux.
Variable Description
CAIACTSAFSV Activates Store and Forward. Applies to
Windows. Default: NO
CA_OPR_SAF Activates Store and Forward. Applies to
UNIX/Linux. Default: NO
CA_OPR_SAF_CONFIG Specifies the name and location of the
configuration file used by SAF. This file lets you
limit the nodes eligible for SAF. (By default all
nodes are eligible.) Applies to Windows. Default:
%CAILOCL0000%\SAF.CFG
CA_OPR_SAF_MAX_OPEN Specifies the maximum number of SAF files that
can be opened. Applies to Windows and
UNIX/Linux. Default: 20. Range: 5 - 500.

View Event Messages
74 Inside Event Management and Alert Management
Variable Description
CA_OPR_SAF_ROOT Specifies the location of SAF files. Applies to
Windows, UNIX/Linux, and NetWare. Windows
Default:%CAILOCL0000%\LOGS\SAF
UNIX/Linux Default: $CAIGLBL0000/opr/saf
NetWare Default: sys\tng\LOGS\SAF
CA_OPR_SAF_SCAN_INT Specifies the number of seconds between
attempts to reconnect to nodes that have
messages waiting in SAF files. Applies to
Windows and UNIX\Linux. Default: 60. Range: 0
- 1000.
Send Notification
Some situations may require that you send a notification message to someone.
Use Unicenter Notification Services to do so.
Unicenter Notification Services lets you send wired and wireless messages using
various protocols and devices to get the attention of operators or administrators,
wherever they are, who must resolve problems or attend to emergencies.
Notification Services is different from Wireless Messaging, which is still available
in Event Management. Wireless Messaging lets you send emails and pages.
The available protocols are:
Email - SMTP, POP3
Simple Mail Transfer Protocol (SMTP) is used to send one-way and two-way
email messages to various devices, including cell phones. Post Office
Protocol version 3 (POP3) is used to receive emails from a mail server.
Wireless - WCTP
Wireless Communications Transfer Protocol (WCTP) uses XML over HTTP and
is designed for sending and receiving messages and binary data between
wire-line systems and one-way or two-way wireless devices.
Page - SNPP
Simple Network Paging Protocol (SNPP) is based on TCP/IP and offers
one-way and two-way pages.
Page - TAP
Telocator Alphanumeric Protocol (TAP) sends pages by modem, and is the
oldest one-way paging protocol.

View Event Messages
Chapter 2: Managing Enterprise Events with Event Management 75
Short Message - SMS
Short Message Service (SMS) is used to send text one-way to cell phones
using HyperText Transport Protocol (HTTP).
Instant Message - Sametime
IBM Lotus Instant Messaging and Web Conferencing (Sametime Instant
Messaging - SIM) is used on Windows to send one-way, and two-way instant
messages.
Voice - TAPI
Telephony Application Programming Interface (TAPI) is used on Windows to
send one-way voice messages that are synthesized from text using the
Microsoft Speech Application Programming Interface (SAPI) text-to-speech
(TTS) engine. The default speech is set in the Windows Control Panel. The
messages travel by telephone line using a TAPI-compliant telephony device
to a human recipient.
Script
Third-party or customer programs or scripts can be used to send one-way
messages. Scripts and command definitions are stored in the file
UNSConnections.ini in the install_path/config directory.
How Unicenter Notification Services Works
Unicenter Notification Services keeps track of all notifications that you send. This
is especially important for two-way notifications that must be matched with
responses. Here is the process:
1. You create a notification message by using one of the following features:
■ User interface
■ Command line or script
■ Event Console by right-clicking a message
■ Event Management NOTIFY action
■ Alert Management escalation
■ Application using the Notification Services client SDK
2. Based on the recipient, provider, or protocol information in the request, the
Notification Services daemon (unotifyd) selects a protocol-specific driver to
send the notification.
Note: The daemon runs as a service on Windows and as a background
process on UNIX/Linux.
3. The daemon assigns a tracking ID, which it returns to the command or
program that sent the notification.
Note: If the daemon stops and then restarts, it also restarts the outstanding
notifications stored on disk.
View Event Messages
76 Inside Event Management and Alert Management
4. If a response was requested, the daemon checks for it periodically from the
service provider.
5. The daemon stores information about the notification on disk, and updates
that information throughout the life cycle of the notification. This is called
checkpointing. Updates include:
■ The request is created.
■ The service provider received the notification.
■ The provider delivered it.
■ The recipient read it.
■ The recipient sent a reply.
Sample Notifications
Notification messages consist of a recipient, connection information for the
protocol and service provider being used, and a message. Notification Services
lets you define much of this information in its recipient and provider registry so
that you can avoid lengthy input. For information about defining recipients,
recipient groups, and service providers, see the online help.
The examples in this section show how to send notifications with the unotify
command. For details about the command syntax, see the online help or CA
Reference. When supplying recipient and connection information, use one of the
following groups of parameters:
■ -t (recipient alias) Uses the default provider for the recipient.
■ -t (recipient alias) with -v (via provider) Uses another provider.
■ -ta (recipient address) with -v (via provider)
■ -ta (recipient address) with -p (protocol) and -c (connection information)
Note: You can also send notifications with the Windows GUI.
Send Notification Using Predefined Recipient and Provider Information
The following example sends notification using recipient, provider, and
protocol-specific connection information that is predefined for the alias "Joe" in
the recipient and provider registry.
unotify -t Joe -m "Application ydr is experiencing slow response time"

View Event Messages
Chapter 2: Managing Enterprise Events with Event Management 77
Send Notification Using Predefined Recipient
The following example sends notification using recipient information that is
predefined for the alias "Joe" in the recipient and provider registry. The default
provider and connection information for Joe is overridden by the predefined
provider "SkyTel."
unotify -t Joe -v SkyTel -m "Application ydr is experiencing slow response time"
Send Email Notification
The following example sends the email "Service xxx is down" using SMTP
protocol. Recipient and provider information is not predefined.
unotify -p SMTP -f [email protected] -ta [email protected] -m "Service xxx is down"
-c mail.company1.com
Send Email Notification with Subject Line
The following example sends an email with the subject line "Urgent message"
using SMTP protocol. Recipient and provider information is not predefined.
unotify -p SMTP -f [email protected] -ta [email protected] -ms "Urgent message"-m
"Application ydr is experiencing slow response time" -c mail.company1.com
Reports from the Console Log
You can create reports from the console log file using the following utilities and
features:
■ ConlogtoHTML, a field-developed utility on the implementation DVD. This
utility generates HTML reports from console logs.
■ EvtLogAnalyzer, a field-developed utility on the implementation DVD. This
utility provides information such as peak period, number of events
generated by different nodes, and servers that had threshold breaches.
■ Cautil CONLOG control statements. (See the online CA Reference.)
■ Event Management reports available through the Report Explorer utility.
(See the online CA Reference.)
■ Various SDK functions. (See the CA Programming Guide and online
CA SDK Reference.)

SNMP Traps
78 Inside Event Management and Alert Management
SNMP Traps
Simple Network Management Protocol (SNMP), a widely used standard in
network Event Management, identifies objects on a network and provides a
method to monitor and report on their status and activities.
An SNMP trap is usually an unsolicited message that reports on one of two types
of events:
■ Extraordinary events indicate something is wrong, or an error has occurred.
■ Confirmed events provide status information, such as a process ending
normally or a printer coming online.
Many SNMP agents are available, including those provided through Unicenter
Agent Technology. Although they vary in purpose, complexity, and
implementation, all SNMP agents can:
■ Respond to SNMP queries
■ Issue an SNMP trap
■ Accept instructions for routing an SNMP trap (accept a setting for a trap
destination)
Note: On some UNIX/Linux computers, an snmptrapd system might be running,
occupying port 162. If so, catrapmuxd stops snmptrapd and starts it at port
6164, which frees port 162 for catrapmuxd. When catrapmuxd is shut down, it
stops snmptrapd and restarts it, listening to port 162.
Support for SNMP Version 3 Traps
Event Management supports receiving and processing SNMP version 1, version
2c, and version 3 traps. On UNIX/Linux, the trap manager supports version 1,
2c, and 3 traps by default. On Windows, the default is to receive and process only
versions 1 and 2c traps using the Windows SNMP service. To receive and process
version 3 traps, in addition to versions 1 and 2c, you must install and configure
the CA Trap Multiplexer (TRAPMUX) by entering the following command:
catrapmuxd UniConfig
The CA Trap Multiplexer also supports IPv6. Therefore, make sure that you use
catrapmuxd instead of the Windows SNMP service if using IPv6 on Windows
versions earlier than Windows Vista, because the Windows SNMP service does
not support IPv6 on these versions.
For more information about catrapmuxd, see the online CA Reference.

SNMP Traps
Chapter 2: Managing Enterprise Events with Event Management 79
TRAPMUX requires port 162 to be available. On Windows, if port 162 is in use,
catrapmuxd issues an error message. You must free port 162 before attempting
to run catrapmuxd again. On a Windows server system with the Windows SNMP
service installed, the Windows SNMP service is probably using port 162. You can
configure the Windows SNMP service to run on a different port. TRAPMUX can
forward traps to that port if the Windows SNMP service is still required.
Note: When TRAPMUX forwards a trap to the Windows SNMP service, the trap
loses its original embedded address. From the perspective of the Windows SNMP
service, the trap originated on the local node with catrapmuxd. This also applies
to any third-party SNMP service manager configured to receive traps from
TRAPMUX.
To support SNMP version 3 Traps
1. Shut down the snmp and snmp-trap services.
2. Open the %system%/drivers/etc/services file.
3. Change snmptrap 162/udp to snmptrap xxxx/udp, where xxxx is a port not
currently in use, for example: snmptrap 5162/udp.
4. Save and close the services file.
After freeing port 162, if the Windows SNMP service is still required, follow these
steps:
1. Restart the snmp and snmp-trap services.
2. To enable the Windows SNMP service to receive traps from TRAPMUX, enter
the following command:
catrapmuxd add snmptrap:xxxx
where xxxx is the port to which snmptrap was moved in the services file, for
example: catrapmuxd add snmptrap:5162.

SNMP Traps
80 Inside Event Management and Alert Management
Authorize SNMP Version 3 Users for CATRAPD
To identify SNMP version 3 users from which you want to receive traps, manually
modify the authorization file located, in a default installation, at:
CA\SharedComponents\CCS\CommonResourcePackages\Misc\snmpv3.dat.
The format for adding SNMP version 3 authorizations is:
h:c:cn u:sl:ap:a:pp:p
where:
h
Specifies the host subnet or range for every authorization. This is a required
field.
c
Specifies the agent classname.
cn
Specifies the contextname, or instance.
u
Specifies the username. This is a required field.
sl
Specifies the snmpSecurityLevel. This is a required field.
noAuthNoPriv
AuthNoPriv
AuthPriv
ap
Specifies the authProtocol. This is a required field if sl is not set to
noAuthNoPriv.
MD5
SHA
a
Specifies the authentication password. This is a required field if sl is not set
to noAuthNoPriv.

SNMP Traps
Chapter 2: Managing Enterprise Events with Event Management 81
pp
Specifies the privProtocol. This is a required field if sl is AuthPriv.
DES
p
Specifies the privacy password. This is a required field if sl is AuthPriv.
Examples
■ Set all hosts in the range to have minimum SNMP version 3 security (no
authentication required) if the user is evans:
172.24.111.5-15:*:* evans:noAuthNoPriv
■ Set all hosts in the range to have AuthNoPriv security using MD5 protocol
and an authentication password of evansa if the user is evans33:
172.24.111.5-15:*:* evans33:AuthNoPriv:MD5:evansa
■ Set all hosts in the range to have AuthPriv security using SHA protocol, an
authentication password of AJHa0123 and a privacy password of AJHp0123,
if the user is AJH3:
172.24.111.5-15:*:* AJH3:AuthPriv:SHA:AJHa0123:DES:AJHp0123
■ Remove the node from SNMP version 3 security, and let it default to SNMP
version 1/version 2 security:
-172.24.111.11
Note: You must recycle catrapd for the updated authorized user information to
take effect.
Encrypt the snmpv3.dat File
When testing SNMP version 3 authorizations, we recommend that you use a clear
text version of the file. When satisfied that everything is working, encrypt the file
to be used in the production environment. We do not recommend leaving
unencrypted SNMP version 3 authorization files in the production environment.
For example:
1. Test and validate snmpv3.dat.
2. Encrypt snmpv3.dat.
■ aw_enc -i snmpv3.dat -o snmpv3.dat.crypt
■ move the clear text snmpv3.dat to some archive area
■ ren snmpv3.dat.crypt snmpv3.dat
For more information about authorization of SNMP version 3 agents, see Agent
Technology Support for SNMPv3.

SNMP Traps
82 Inside Event Management and Alert Management
How catrap Issues Traps
The catrap command can issue SNMP traps to any destination in your network
and supports all operands accepted as Open System standards for an SNMP trap
command. You can use it interactively, through UNIX/Linux shell scripts or in
Windows .bat files, or as part of automated event handling policies defined to
Event Management.
■ The operands provided as destination and information data to catrap convert
automatically into the appropriate Open Systems standard datagram.
■ catrap sends the operands to the designated trap destination.
Note: This command makes it simple for user applications, shell scripts that are
part of production jobs, or Event Management policies to issue their own SNMP
traps, simply by executing the command and passing it the appropriate
arguments. Unlike some other SNMP trap commands, catrap does not restrict
itself to any particular set of ISO or Enterprise MIBs and is totally open for use
with any MIB or pseudo-MIB with no dependencies on any third-party network
management components.
For more information on catrap, see the online CA Reference.
How catrapd Formats Traps
If automatic formatting of SNMP traps is enabled, catrapd uses the TRAP and MIB
tables in the CAITRPDB database to determine which traps to format. A TRAP
record identified by a unique Eid (Enterprise ID), Generic, and Specific key
contains information needed to format one trap. A MIB record identified by a
unique Name key contains information about one MIB. All TRAP and MIB records
have Enable columns that control which traps to translate. A MIB is a collection of
related traps generated by one software program or hardware device. One
company or organization usually compiles a MIB.
■ If an incoming trap matches the Eid (Enterprise ID), Generic, and Specific
trap fields, and the corresponding TRAP and MIB records are enabled,
CATRAPD translates it to readable form.
■ catrapd uses the Format, Args, and AlarmName columns of the matching
TRAP record and the Variable Bindings (VarBinds) from the incoming trap to
create the final text in the following format:
%CATD_I_066, AlarmName: unique variable-text ...
Where AlarmName is from the TRAP record and unique variable-text is
created by substituting selected VarBinds into the Format column of the
corresponding record.
■ catrapd sends the formatted traps to the Event Management daemon for
further processing.

SNMP Traps
Chapter 2: Managing Enterprise Events with Event Management 83
Enable Automatic Formatting of Traps
A catrapd option lets you enable automatic formatting of SNMP traps. The
formatted text contains the most important information from the trap in an
easy-to-use form. Predefined formatting is provided for thousands of traps from
many companies.
To enable automatic formatting of traps
1. Select Start, Programs, CA, Unicenter, NSM, Enterprise Management, EM
Settings.
The EM Settings window appears.
2. Click the Component Activation Flags tab at the bottom and the Client
Preferences tab on the right.
3. Set the SNMP Trap Server Activated option to YES, and click Yes on the
confirmation message.
4. Click the Event Management tab at the bottom and the Client Preferences
tab on the right.
5. Set the Format traps using provided tables option to YES, and click Yes on
the confirmation message.
6. From the Settings menu, click Exit.
7. Restart catrapd.
Your settings are in effect.
Binary and Hex Octet String Varbinds
The Windows SNMP service treats octet string varbinds containing binary or hex
string data in traps as printable strings unless one of the following is true:
■ None of the characters in the octet string is printable
■ The conversion to printable data truncates data length
If either of the preceding cases is true, the octet string is displayed in hex.
Octet string varbinds containing binary or hex string data in traps when using
catrapmuxd with v1, v2c, and v3 SNMP support are converted to printable
strings with a potential for truncation of data in the Console when the octet string
contains non-printable data. If this occurs, you can modify the aws_snmp.cfg file
to specify that certain varbind OIDs are always displayed in hex. This ensures
that the octet string data is displayed fully, in hex, on the Console.

Secure Event Management
84 Inside Event Management and Alert Management
Secure Event Management
CA NSM provides several ways to secure Event Management. This section
discusses the following methods:
■ Specify users authorized to run commands.
■ Provide access to EM database tables by non-root users on UNIX/Linux
■ Define Console Views
Users Authorized to Run Commands
You can specify the users and user groups in your enterprise who can enter
Event Management commands, acknowledge held messages, and reply to held
messages when Security Management is not active. Use the environment
variable CA_OPR_AUTH_LIST. This variable is ignored when Security
Management is active.
Note: Because of security concerns, you may want to limit the users who can run
commands on Event Managers and Agents to the administrator ID.
When specifying users and groups, consider the following information:
■ To set this variable, use the following tools:
– Windows: Configuration GUI or cautenv utility
Note: You can see the current settings for all environment variables by
entering "cautenv dumpini."
– UNIX/Linux: $CAIGLBL0000/opr/config/node/actnode.prf file
– Any operating system: Unicenter Configuration Manager product
■ The caunint user (or the user ID under which CA NSM is started) is
authorized to run commands, even if the CA_OPR_AUTH_LIST environment
variable is empty. You do not need to add caunint to CA_OPR_AUTH_LIST.
■ By default, the user that installed the product, usually
administrator@localcomputer, is added to CA_OPR_AUTH_LIST during the
installation process.
■ You may want to add to CA_OPR_AUTH_LIST the users IDs that log on to the
computer, start services, and execute programs that send events to the
Event Console if those events are used to run a COMMAND action.
■ If you are using cautenv, reenter any users or groups that already had
permission. Any previous list is replaced, not appended.
■ Separate users and groups with commas and no spaces.
■ If you do not include a node name with a user or group, permission is given
for all nodes. (Specify node names like this: User03@node09.)

Secure Event Management
Chapter 2: Managing Enterprise Events with Event Management 85
■ You can use wildcards in the names of users, groups, and nodes. Use * to
indicate zero or more characters, and ? to indicate one character.
■ To identify a user group, precede it with an ampersand, for example,
&Administrators.
■ To give CA_OPR_AUTH_LIST no value, enter NULLSTRING. This gives no one
permission to run commands except the user ID that runs the CA NSM
service, usually caunint.
Authorize Users to Run Commands
You can use cautenv to specify users to run commands.
To authorize users to run commands
1. Enter a cautenv command like the following one:
cautenv setlocal CA_OPR_AUTH_LIST administrator,caunint@*,user01,system
The variable is set.
2. Stop and restart the Enterprise Management services:
unicntrl stop all
unicntrl start all
The changes take effect.
Access to EM Database Tables
Unlike root user, a non-root user by default does not have access permissions to
EM database tables in MDB. A predefined user group called emadmin exists in
MDB for the purpose of granting users permissions to access these tables.
Members of the emadmin group have select, insert, update, and delete
permissions granted for the EM database tables. A user must be a member of the
emadmin group to gain access permissions to EM database tables in the Ingres
database system.
A utility called uni_db_adduser can be used to grant user access permissions to
EM tables. Only user root can run this utility.

Secure Event Management
86 Inside Event Management and Alert Management
The following command grants read/write access to EM tables, adds the user to
the Ingres system and makes the user a member of the emadmin group.
$CAIGLBL0000/db/scripts/uni_db_addusr -a username password
Note: password is the user's password on the MDB server machine.
Use the following command to remove a user from the emadmin group.
$CAIGLBL0000/db/scripts/uni_db_addusr -r username
Console Views
The Console View feature lets system administrators filter the Event messages
users can see on the Console. If you have role-based Event messages or want to
limit access to sensitive messages, use this feature. If, however, you have no
need to restrict access to messages, you may not need to define Console View
profiles.
Note: Console View is a joint feature of Event Management and Security
Management. You must have Security Management for Console View to function.
Security Management has the following asset types for console message access:
CA-CONVIEW
Identifies records in the DSB as console view profiles.
CA-CONVIEW-ACCESS
Specifies the view that users see on the Console Log. You can define this
asset type through Event Management or Security Management.
Security Management has environment variables that apply to Console View:
Variable Description
CONVIEW_AUTH_USERS
(Users Can Use the CONVIEW)
Specifies whether Console View profiles are
enabled. Yes indicates that access is
restricted by a Console View profile. No
indicates that all users have full access to
messages.
Applies to all users on Windows and non-root
users on UNIX/Linux. Default: YES
CONVIEW_AUTH
(Root Console Views)
Specifies whether Console View access is
secured for the root user. Yes indicates that
access is restricted by a Console View profile.
No indicates that root has full access to
messages.

Secure Event Management
Chapter 2: Managing Enterprise Events with Event Management 87
Variable Description
Applies to UNIX/Linux. Default: NO
NONROOT_CONLOG_ACCESS Specifies whether a non-root user can use the
cautil command to view the console log. YES
indicates non-root users can use cautil to
view the console log. NO indicates non-root
users can not use cautil to view the console
log, but they can use the GUI to access the
console log with proper security permission.
Applies to non-root users on UNIX/Linux.
Default: YES
Note: The Security Management environment variable SYSTEM_MODE (System
Violation Mode) must be set to FAIL (the default) for Console View to function
correctly.
Define Console Views Using Event Management
Note: Console View is designed to work with Security Management. To take full
advantage of the features of Console View, you must have Security Management
installed.
Defining a Console View profile involves:
■ Creating the profile
■ Assigning the profile to a user or an authorization group
■ Defining a filter to limit the messages a user can see
■ Performing a commit in Security Management
■ Making Console View take effect
To create the profile
1. Open Event Management and then Console Views.
The Console Views container appears.
2. Click the New button on the toolbar.
The Console View - Detail window appears.
3. Enter a name in the View Name field, and if you want, add a description.
4. Click Save.

Secure Event Management
88 Inside Event Management and Alert Management
To assign the profile to a user or an authorization group
Note: Security Management is required for this procedure.
Use the Access notebook page of the Console View - Detail window to assign the
new profile to a User or an Authorization Group in Security Management.
1. On the Access notebook page of the Console View - Detail window, click New.
The Console View Management window appears.
2. Select Authorization Group, and click the Selection List button to the left of
your choice.
The Selection dialog appears.
3. Select an Authorization Group and click OK, or select User and enter the user
name.
4. Click OK to accept changes to the console view.
The Console View - Detail window appears. The Console View profile is
automatically assigned to the asset type CA-CONVIEW-ACCESS.
To define a filter to limit the messages a user can see
Use the Filter notebook page of the Console View - Detail window to limit the type
of messages that a user can read.
1. Click the Filter tab.
The Filter page of the Console View - Detail window appears.
2. To create a filter, click New on the toolbar of the Filter page. To modify a
filter, click it in the list and then click Open.
The Filter - Detail window appears.
3. Specify the criteria for a filter. Select the Active check box to turn on the
filter, and click OK.
To perform a commit in Security Management
Note: Security Management is required for this procedure.
You must perform a commit any time Console View access changes for a User or
an Authorization Group.
1. Click OK on the Console View - Detail.
The following message appears: "A Security Management commit must be
performed for access changes to take effect."
2. Click OK on the message dialog.

Secure Event Management
Chapter 2: Managing Enterprise Events with Event Management 89
3. Enter the following command:
Windows: secadmin /c ALL
UNIX/Linux: secadmin -c ALL
To change the Set System Violation Mode to FAIL
You can change this Security Management variable (SYSTEM_MODE) with the
Windows Configuration GUI, the CAUTENV command, or the secopts file on
UNIX/Linux.
Note: This step is necessary only once. If you have previously set this variable to
FAIL, skip this step.
Windows GUI:
1. Open Configuration from the Enterprise Management main folder.
2. Open Settings from the Configuration folder.
3. Click the Options and Security Options tabs in the EM Settings window.
4. Set System Violation Mode to FAIL.
5. Select Settings, Exit.
CAUTENV command:
Enter the following:
LOAD CAUTENV SYSTEM_MODE FAIL
secopts File on UNIX/Linux:
Use a text editor to change SYSTEM_MODE to FAIL in the secopts file in the
$CAIGLBL000 directory.
To make console view profiles take effect
1. Activate Security:
unicntrl start sec
2. Grant the Access permissions CA-CONVIEW and CA-CONUSER to users and
authorization groups that were assigned to the Console View Profiles. See
Permit Assets to Authorization Groups for instructions. This step is not
necessary for UNIX/Linux.

Secure Event Management
90 Inside Event Management and Alert Management
Define Console Views Using Security Management
Note: Console View is designed to work with Security Management. To take full
advantage of the features of Console View, you must have Security Management
installed.
Before you define Console View objects, and with Security Management active
on the machine, non-root users are not permitted to access the console log by
default. However, after a user is granted access to a Console View, this default
restriction is lifted. To ensure that the console log is not accessible from the
command line, either through cautil or the UNIX/Linux shell, you should make
the following permissions change to remove global read permissions:
chmod 750 $CAIGLBL0000/opr/logs
To define console views
1. Open Security Management and then Authorization Groups.
The Authorization Groups container appears.
2. Select an authorization group and click the Open button on the toolbar.
3. Click the Assets tab, and click New on the Assets page.
4. In the Asset Access Management window, select CA-CONVIEW-ACCESS as
the Asset Type. Enter a name for the new Console View profile in the Asset
Name field.
5. In the Access Type field, select Permit. In Access Modes, select Search.
6. (Optional) In the Calendar field enter the name of a calendar defined in
Calendar Management. In the Expires field enter a date when access expires.
7. Click OK twice.
8. Perform a Security Management commit by entering the following
command:
Windows: secadmin /c ALL
UNIX/Linux: secadmin -c ALL
To change the Set System Violation Mode to FAIL
You can change this Security Management variable (SYSTEM_MODE) with the
Windows Configuration GUI, the CAUTENV command, or the secopts file on
UNIX/Linux.
Note: This step is necessary only once. If you have previously set this variable to
FAIL, skip this step.

Secure Event Management
Chapter 2: Managing Enterprise Events with Event Management 91
Windows GUI:
1. Open Configuration from the Enterprise Management main folder.
2. Open Settings from the Configuration folder.
3. Click the Options and Security Options tabs in the EM Settings window.
4. Set System Violation Mode to FAIL.
5. Select Settings, Exit.
CAUTENV command:
Enter the following:
LOAD CAUTENV SYSTEM_MODE FAIL
secopts File on UNIX/Linux:
Use a text editor to change SYSTEM_MODE to FAIL in the secopts file in the
$CAIGLBL000 directory.
To make console view profiles take effect
1. Activate Security:
unicntrl start sec
2. Grant the Access permissions CA-CONVIEW and CA-CONUSER to
authorization groups that were assigned to the Console View Profiles. See
Permit Assets to Authorization Groups for instructions. This step is not
necessary on UNIX/Linux.
Permit Assets to Authorization Groups
You can permit assets to authorization groups.
To give an authorization group access to an asset or an asset group
1. Open Security Management and then Authorization Groups.
The Authorization Groups container appears.
2. Select an authorization group and click the Open button on the toolbar.
The Authorization Groups - Detail window appears.
3. Click the Assets tab.
The Authorization Group - Asset Access Management window appears.
4. Enter data in the fields and click OK.

Event Policy Packs
92 Inside Event Management and Alert Management
Event Policy Packs
Event Management provides preconfigured event policy packs for:
■ Message record/action
■ Advanced Event Correlation
Message Record/Action Policy Packs
Use cautil -f scriptname.cautil to load the following message record/action policy
packs into the MDB. For information about cautil, see the online CA-Reference.
■ caiOraA2_msgrec.cautil for the Oracle database agent.
■ caiSybA2_msgrec.cautil for the Sybase database agent.
■ caiSqlA2_msgrec.cautil for the SQL Server database agent.
■ caiAdsA2_msgrec.cautil for the Active Directory agent.
■ caiUxsA2_msgrec.cautil for the UNIX system agent.
■ hpxAgent_msgrec.cautil for the Performance agent.
■ caiLogA2_msgrec.cautil for the Log agent.
■ caiWinA3_msgrec.cautil for the Windows 2003 system agent.
These policy packs are located on the installation DVD:
■ DVD\Windows\NT\Policy Packs for Windows
■ DVD/policypacks for UNIX/Linux
A message record/action policy pack does the following for each agent:
■ Color codes traps based on severity. Red is critical. Orange is warning. Green
is ok or repaired. Blue is unknown.
■ Annotates trap descriptions.
Following is an example of trap annotation. The trap message is:
Host:Solaris Solaris CaiUxOs Trap Agent:CaiUxOs:Swap:SwapTotal Ok Critical Prop
StatusSwapTotalSpaceStatus Val .1000 Warn 700 Crit 900 Total
Annotation adds the following to the trap message:
The Unicenter UNIX System Agent ""&3"" reports a total swap watcher state change: State
of 'swap space utilization' metric changed from '&6' to '&7'.

Event Policy Packs
Chapter 2: Managing Enterprise Events with Event Management 93
Advanced Event Correlation Policy Packs
Advanced Event Correlation policy packs, preloaded into the MDB during
installation, provide correlation policies to detect combinations/associations of
events and generate correlation events. For catastrophic events, the policies
generate alerts into the appropriate alert queue. Each policy contains root cause
logic for scheduled outages and node failures.
■ AdsAgent (Active Directory Agent) policy has rules to generate an alert into
the CA-Applications queue for a domain controller failure.
■ caiUxsA2 (UNIX System Agent) policy has these rules:
– File system failure rule suppresses symptomatic quota, directory, and
files on the same file system.
– CPU rule shows process-specific trap/poll as the root cause and
suppresses general CPU traps/polls.
– Memory rule shows process-specific trap/poll as the root cause and
suppresses general memory traps/polls.
– CPU spike rule detects five critical events within a time period.
■ caiWinA3 (Windows 2003 System Agent) policy has these rules:
– File system failure rule suppresses symptomatic quota, directory, and
files on the same file system.
– CPU rule shows process-specific trap/poll as the root cause and
suppresses general CPU traps/polls.
– Memory rule shows process-specific trap/poll as the root cause and
suppresses general memory traps/polls.
– CPU spike rule detects five critical events within a time period.
■ caiW2kOs (Windows 2000 System Agent) policy has these rules:
– File system failure rule suppresses symptomatic quota, directory, and
files on the same file system.
– CPU rule shows process-specific trap/poll as the root cause and
suppresses general CPU traps/polls.
– Memory rule shows process-specific trap/poll as the root cause and
suppresses general memory traps/polls.
– CPU spike rule detects five critical events within a time period.

Event Policy Packs
94 Inside Event Management and Alert Management
■ caWmiAgent (Windows Management Instrumentation agent) policy has
example rules to determine what is possible with Advanced Event
Correlation and the caWmiAgent:
– Terminal services rule correlates the number of sessions and users to
virtual memory.
– Locked-out user rule correlates locked-out users to application failures.
Applications may fail due to incorrect or obsolete credentials.
– Device failure rule shows a fan failure as the root cause of other device
failures.
■ Ora2agent (Oracle database agent) policy has these rules:
– Catastrophic failure rule generates an alert to the CA-Database queue.
– Memory rule correlates Oracle agent memory monitoring to
Windows/UNIX/Linux system agent memory monitoring and shows the
more specific Oracle trap/poll as the root cause.
– Disk space rule correlates the Oracle agent tablespaces events to
Windows/UNIX/Linux system agent disk space and shows the more
specific Oracle trap/poll as the root cause.
– Multiple database failure rule looks for three or more failure of any kind
on a particular database instance.
■ Sqla2agent (Microsoft SQL Server database agent) policy has these rules:
– Catastrophic failure rule generates an alert to the CA-Database queue.
– Memory rule correlates Microsoft SQL Server agent memory monitoring
to Windows/UNIX/Linux system agent memory monitoring and shows
the more specific Microsoft SQL Server trap/poll as the root cause.
– Disk space rule correlates the Microsoft SQL Server agent tablespaces
events to Windows/UNIX/Linux system agent disk space and shows the
more specific Microsoft SQL Server trap/poll as the root cause.
– Multiple database failure rule looks for three or more failures of any kind
on a particular database instance.
■ Db2agent (DB2-UDB database agent) policy has these rules:
– Catastrophic failure rule generates an alert to the CA-Database queue.
– Memory rule correlates DB2 agent memory monitoring to
Windows/UNIX/Linux system agent memory monitoring and shows the
more specific DB2 trap/poll as the root cause.
– Disk space rule correlates the DB2 agent tablespaces events to
Windows/UNIX/Linux system agent disk space and shows the more
specific DB2 trap/poll as the root cause.
– Multiple database failure rule looks for three or more failures of any kind
on a particular database instance.

Event Policy Packs
Chapter 2: Managing Enterprise Events with Event Management 95
■ syba2agent (Sybase database agent) policy has these rules:
– Catastrophic failure rule generates an alert to the CA-Database queue.
– Cpu rule correlates Sybase agent memory monitoring to
Windows/UNIX/Linux system agent memory monitoring and shows the
more specific Sybase trap/poll as the root cause.
– Disk space rule correlates the Sybase agent tablespace events to
Windows/UNIX/Linux system agent disk space and shows the more
specific Sybase trap/poll as the root cause.
– Multiple database failure rule looks for three or more failures of any kind
on a particular database instance.
■ Job Management Option policy looks for correlations within the Job
Management Option with these rules and generates an alert to the
CA-Scheduling queue for critical events that go unresolved for a time period.
– Job submission problems rule generates an alert to the CA-Scheduling
queue for jobs submitted but not started and for jobs started but not
completed within a certain interval.
– Autoscan problems rule detects an autoscan (and/or pre-scan) started
but never completed.
– Predecessor warnings rule highlights warnings that are uncorrected after
a time period.
– SQL errors rule generates an alert to the CA-Scheduling queue for critical
SQL errors.
– Multiple failures rule detects multiple failures on a given Job
Management Option.


Chapter 3: Improving Event Processing with Advanced Event Correlation 97
Chapter 3: Improving Event Processing
with Advanced Event Correlation
This section contains the following topics:
Advanced Event Correlation (see page 97)
Alert Management Integration (see page 100)
Event Definitions (see page 100)
Configure AEC (see page 100)
Components of a Correlation Rule (see page 105)
Tokens (see page 115)
Template Rules (see page 121)
Regular Expressions (see page 122)
Impact Analysis (see page 124)
Implement AEC (see page 127)
Advanced Template String Editor (see page 130)
Advanced Configuration (see page 130)
Examples: AEC Applications (see page 137)
Advanced Event Correlation
Advanced Event Correlation (AEC) integrates seamlessly with Event
Management to provide a powerful event correlation, root cause, and impact
analysis capability. When used with existing CA NSM features, AEC can increase
the quality and reduce the quantity of the information reported on the Event
Console, which is used to automate certain operational tasks.
In simple terms, event correlation is a way to group associated events together
for the purpose of further processing. Grouping events in this way lets you do
simple but powerful forms of processing, such as event suppression,
reformatting, aggregation or consolidation. For example:
■ Suppress events according to source, duplication, transient states (for
example, a flapping link that toggles on and off), frequency, thresholds
associated with field values, and so on.
■ Combine (aggregate) information spanning multiple events into one event.
■ Extract data from events that may be difficult to extract using existing tools,
making it available for further processing through automation.
■ Reformat events for easier processing or to be more readable for operators.
■ Detect the absence of scheduled events, such as a Backup Complete. Event
correlation can also facilitate more powerful contextual forms of processing,
such as root cause analysis and impact analysis.

Advanced Event Correlation
98 Inside Event Management and Alert Management
Root cause analysis lets you clearly differentiate the root cause event associated
with an event stream from the non-root cause or symptomatic events that may
not require a direct response. Root cause analysis helps you to reduce the
number and frequency of events seen by console operators, eliminate message
flooding, and reduce false notifications.
Symptomatic events can provide valuable information about the impact of the
root cause problem on the overall system, and, therefore, should not be
discarded in all cases. The impact analysis function helps you alert users to an
impending problem, thus reducing the load on your help desk. It also helps you
to initiate failover or recovery procedures for the dependent systems, or alert
operations staff that they need not address a particular problem.
Note: As an integral part of Event Manager and Event Agent, AEC is installed
with these components.
High Availability
Because Event Management is fully cluster aware, it is essential that AEC is also
fault tolerant to the same degree to ensure event processing continuity and
quality is maintained from the point of failure. See the appendix "Making
Components Cluster Aware and Highly Available" in the Implementation Guide
for additional information.
Note: Because Event Management is not highly available on UNIX/Linux, AEC is
not highly available.
Why Use AEC?
CA NSM reports messages generated by the failure of managed components to
the Event Console. Within the Event Console, message records trigger actions for
the failure messages reported. However, some of the messages that the Event
Console receives can be misleading or unnecessary. These messages can trigger
unnecessary actions to fix false or secondary failures.
Examples of misleading or unnecessary failure messages include the following:
■ An expected but normally inappropriate state, such as services taken offline
for repairs
■ Service failures cause dependent object failures
■ System failures cause agent failures
■ Repetition of a previously received message

Advanced Event Correlation
Chapter 3: Improving Event Processing with Advanced Event Correlation 99
These false failure messages cause problems because message records and
actions erroneously generate notifications and trouble tickets, and, therefore,
important messages may be lost in all the erroneous, secondary, false
messages.
Using AEC, you can do the following:
■ Distinguish between primary and secondary failure messages
■ Determine the root cause of the failure
■ Provide an impact analysis of a failure
■ Diagnose and filter unwanted messages
■ Respond to dynamically changing environments
How AEC Works
AEC extends the functionality of Event Management. To use AEC, you must first
identify a set of events that you want to monitor and correlate, and specify any
actions to perform if correlation exists or does not exist. The events to be
monitored are reported to the Event Console as messages that act as input to
AEC, and are intercepted and analyzed. You configure AEC to act on the input
messages it receives to produce the desired output, which are the messages that
are actually sent to the Event Console.
AEC uses correlation rules to analyze the input messages in relation to each
other and to identify the root cause messages from those incoming messages. A
correlation rule performs the following functions:
■ Describes patterns so as to recognize those incoming messages that are
related
■ Defines timings on when to report root cause messages to the Event Console
■ Captures the logic of cause-and-effect relationships of all related messages
■ Describes formatting of the root cause messages reported to the Event
Console
AEC processes events as follows:
1. Listens to all incoming messages.
2. Uses patterns in the rule to identify the incoming messages that match.
3. Triggers the correlation rule when a matched message is detected.
4. Listens to incoming messages to see if any more messages match the
patterns in the rule.
5. Uses timing, specified in the rule, to determine continuation of monitoring.
6. Stores the logic of cause-and-effect relationships of different messages.

Alert Management Integration
100 Inside Event Management and Alert Management
7. Identifies which incoming messages are root causes, based on the cause and
effect logic.
8. Applies the formatting specified in the correlation rule.
9. Reports the resulting message to the Event Console.
Alert Management Integration
AEC can generate correlation alerts directly into the Alert Management
component of CA NSM. The alert class is specified at the engine level of the
policy, and each rule can selectively enable or disable alert generation to that
class.
Event Definitions
Understanding event definitions is critical to understanding AEC, configuring it,
and using it correctly.
You can define the two types of events in AEC: input events and output events.
Input events are the events that define patterns used by AEC to match messages
coming in to the Event Console. Output events are events generated by AEC and
sent to the Event Console.
You define these events in the correlation rules when you configure AEC. Each
event that you define has a key field, called the message string, which describes
the event. The message string can contain regular expressions and tokens.
Configure AEC
Configuring AEC consists of defining correlation rules and saving them in the
Management Database (MDB). You can create correlation rules using either the
Integrated Development Environment (IDE), which is a Windows application, or
the browser-based Policy Editor.

Configure AEC
Chapter 3: Improving Event Processing with Advanced Event Correlation 101
Before you use AEC in a production environment, you must typically work
through the following procedures:
1. Define the correlation policy.
2. Deploy the correlation policy.
3. Test the correlation policy.
4. Save the correlation policy in the MDB.
Note: You can import CA NSM 3.x rca files into the Policy Editors and then save
them to the MDB.
After you define your correlation policies, you can deploy them to a test Event
Agent (preferably a non-production machine) using deployment dialogs within
the editors. The Windows IDE editor also provides a real-time testing
environment by reading the Event Console messages and applying the rules you
have defined.
Note: You need only use the Policy Editors when you are defining, deploying,
and testing rules. After you are satisfied that your new AEC policy is working
properly, you can use the Deploy Policy dialog to deploy it into a production
environment. See Implement AEC.
The policy editors have a real-time status capability to let you see the following:
■ What rules were triggered.
■ How many instances are running, and the values of tokens in each instance.
For more information, see Tokens.
■ The times the rule processing started.
■ How much time is left for maturity and reset of the rule. For more
information, see Timing Parameters.
Note: If Security Management is running, and AEC policy is intended to create
alerts in the Alert Management System (AMS), the user defining the policy must
have permission to the CA-AMS-POLICY asset type. Without this permission, an
access violation message appears.
For more information about CA-AMS-POLICY, see the online CA Reference topic
Asset Types for Windows and UNIX/Linux. It is under Security Management,
Executables: Security Management, cautil Security Management Control
Statements, Control Statements for ASSETTYPE.
Configure AEC
102 Inside Event Management and Alert Management
Start the IDE Policy Editor
To start the AEC Windows IDE Policy Editor, locate the Windows Classic
Enterprise Management GUI, navigate to the Event icon, and then navigate to
the AEC Policies icon. You can use the resulting list container of AEC policy names
to open the IDE for a single policy. You can also open the IDE from the Alert
Management Class notebook.
IDE Configuration Wizards
Every configurable AEC object has a configuration wizard associated with it in the
Windows IDE, which guides you through the steps necessary to configure the
object. You can launch the wizard from the IDE toolbar by clicking the
Configuration Wizard button ( ) or by right-clicking the object and then
choosing from the context menu. For more information, see the online help for
the IDE.
Note: The Windows Advanced Event Correlation IDE is no longer being
enhanced and may not have some of the functionality that exists in the AEC Web
UI. Therefore, we recommend that you use the AEC Web UI instead of the
Windows IDE.

Configure AEC
Chapter 3: Improving Event Processing with Advanced Event Correlation 103
Start the Web Policy Editor
You can launch the AEC Web Policy Editor a few different ways:
■ Locate the AEC Policies tree item in the Management Command Center. The
Web Policy Editor opens in the right pane of the Management Command
Center.
■ Open the Web Policy Editor from Alert Management using the Alert Class -
Detail window, AEC tab in the Unicenter MCC.
■ Launch through the CA Web Server menu, which displays a list of all CA web
applications, including the AEC web policy editor.
Launching the Web Policy Editor independently, outside of Management
Command Center, requires some basic configuration. The Web Editor
automatically displays a Configuration tab that prompts for the name of the
Distributed Intelligence Architecture (DIA) Knowledge Base and the Event
Manager host.
Note: Launching from within Management Command Center does not require
this configuration because Management Command Center already understands
these values and passes them automatically to the web policy editor within the
right pane of Management Command Center.

Configure AEC
104 Inside Event Management and Alert Management
Policy Wizards
The Web Policy Editor provides policy wizards as an effective means of creating
rules without manually having to configure the many flags and options. The
Windows IDE has a similar capability in its preconfigured rules dialog. The
following Policy Wizards are provided:
Down for Maintenance
Suppresses messages from systems that are down for scheduled
maintenance. For example, if software patches that require a restart are
scheduled for a particular machine, you can select an event that indicates
that machine is down for maintenance. All messages coming from that
machine during the specified time are suppressed and consequently no
trouble ticket gets opened erroneously.
Dependency Event
Raises an alert for a component based on events raised by other
components. For example, a web application uses both a database and a file
server. An alert for the web application is sent if either resource reports a
problem.
Dual Dependency Event
Raises an alert for a component based on two events raised by other
components. For example, a web application runs on a cluster consisting of
two cluster nodes. An alert is sent if both clusters report a problem within the
specified time period.
Event Threshold
Detects the number of times a specific event occurs within a time frame. For
example, when CPU usage exceeds its threshold five times in two minutes,
an alert is raised.
Missing Event
Detects the absence of an important event, such as a Database Backup
Started event is detected, but the Database Backup Completed event is not
detected within a specified time range.
Missing Heartbeat
Detects the absence of a heartbeat message within a specified time range. A
heartbeat message is sent from a server to ensure that it is online. The
absence of the heartbeat event from the server indicates that the server is
offline.
Root Cause
Raises an alert for a component based on events raised by other components
and provides information about the event that initiated the issues. For
example, a switch failure causes a ping failure, which causes an agent
failure.

Components of a Correlation Rule
Chapter 3: Improving Event Processing with Advanced Event Correlation 105
Suppression of Duplicates
Suppresses repeated similar events. For example, a host IP device failure
causes DSM to repeatedly generate ping failure events. This type of rule
suppresses the redundant events, permitting only the initial failure to trigger
a trouble ticket.
Transient Event
Eliminates spike alarms when a resource has acceptable periods of peak
activity. For example, a web server is known to have surges in activity every
time new content is posted. This rule suppresses alerts caused by these
activity surges.
User Defined
Represents an empty rule list; you must create rules manually.
Tutor Pane
The Tutor pane provides an interactive guide that works with any rule but has
special knowledge of the preconfigured rules. The pane gives a step-by-step task
list for modifying the rule.
As you follow the steps, the tree view and right-hand properties page are
selected to indicate where the focus should be next. As you select that tree item
in turn, the Tutor pane changes to a new topic and task list.
Event Pick List
When you enter match events it is sometimes difficult to remember the syntax of
an agent trap, security message, or job scheduling event. The event pick list
provides a comprehensive listing of CA events, together with their regular
expressions. The list is available when you enter any of the input events in the
Policy Editors.
Components of a Correlation Rule
The two types of correlation rules that you can add to your policy are as follows:
■ An Event pipeline rule.
■ A Boolean logic rule, which supports complex nested Boolean logic
conditions, helps you analyze and identify complex patterns of behavior.
Note: For more information, see Boolean Logic in AEC Rules.

Components of a Correlation Rule
106 Inside Event Management and Alert Management
Event Pipeline Rule Components
The components of an event pipeline correlation rule are as follows:
■ Pipeline
■ Root events
Pipeline
The pipeline is where most of the logic of cause-and-effect relationships of
messages is defined. Each correlation rule has one pipeline listing the pipeline
items, each of which contains descriptions of similar messages. Each pipeline
item deals with only one message type. You group pipeline items to form a
pipeline that has a cause-and-effect relationship among the items. The order of
the items in a pipeline is important, as any item is considered to be the root
cause of all the items below it.
When AEC receives many messages that are matched by different pipeline
items, it chooses the highest item and determines that message to be the root
cause. For example:
Pipeline Item # 1: Ping Failure on Server
Pipeline Item # 2: Service Critical on Server
The Promote/Demote feature lets you modify the order.
The main components of pipeline items are as follows:
Match Event
This component indicates conditions (message string and node name) under
which the item triggers the rule.
Local Correlation Event and Local Reset Event
The Local Correlation and Local Reset Events describe the message strings
that are sent to the Event Console at maturity (reset) of the correlation rule.
In this way they are similar to the Root Correlation and Root Reset Events.
However, you can configure AEC to use either the Local or the Root
Correlation (Reset) message by setting one of two flags. The flags Use Root
Correlation Event and Use Root Reset Event let the Root Correlation and Root
Reset messages override the Local Event Messages.

Components of a Correlation Rule
Chapter 3: Improving Event Processing with Advanced Event Correlation 107
The advantage of setting the Root Correlation (Reset) message is that, for
example, you must configure the correlation (Reset) message at only one
place. However, the disadvantage may be that, regardless of the root cause,
AEC generates the same formatted message (although, using tokens, it can
be specialized to reflect the root cause event in each case).
The disadvantage of setting the Local Correlation (Reset) message is that
you must configure these messages at each of the individual pipeline items.
This lets you configure different messages to be sent to the Event Console
when you have different root causes.
Exclusion Event
You can use the Exclusion Event with the Match Event to help restrict the
events that match the matching element. For example, you could define a
Match Event to match any events containing the text ABC but exclude any
events also containing the text DEF.
If you defined the following events in a rule, all Application Failure events are
matched except for those that refer to lab applications.
Match Event: ^Application .* has failed$
Exclusion Event: ^Application LAB_APP1|LAB_APP2 has failed$
You can also use the Exclusion Event to restrict the matching of any element
of an event. For example, you could use it with the Match Event to match a
given event from all servers except those specified in the Node field of the
Exclusion Event.
Reset Request Event
The Reset Request Event lets you reset an individual pipeline item.
Set the Enable Local Reset Request Event flag to reset an individual pipeline
item. In addition, this lets you decrement the counter for the number of
matching events associated with a pipeline item when a Reset Request Event
is received. When you set this flag, a pipeline item is reset only when the
counter is decremented to zero.
For example, suppose that you have five automated procedures that
generate consecutive events to indicate that they have started and
completed successfully. Using this flag, you can match the five start events
and decrement the counter by assigning the Reset Request Event to the
completion event. If the matching element has not reset at the end of the
maturity period, one or more of the automated procedures must have failed
to complete, and the rule can generate a Root Correlation Event to indicate
that.

Components of a Correlation Rule
108 Inside Event Management and Alert Management
Local Reformat Event
Configured at the rule or matching element level, you can use the Reformat
Event to change the format of a matched event. The reformatted event can
consist of the following:
■ All, or any element of the original event (using &TEXT or &1 - &n,
respectively)
■ Any global or user-defined token value
■ Static text
For example, suppose that you want to prefix any event that matches
Pipeline Item # 1 with the string %AEC_HOLD. This prefix could then be
identified by a standard Event Management message record/action,
resulting in the event being placed in the Held Messages queue.
Local Revised Correlation Event
It is possible that a higher pipeline item can be matched after a correlation
event has been generated (for example, where the rule matures before the
highest pipeline item is matched). In that case, you may want to generate an
event indicating that the previous correlation event has been superseded. A
Revised Correlation Event can consist of the following:
■ All, or certain elements of the original root cause event (using &TEXT or
&1 - &n, respectively)
■ All, or certain elements of the new root cause event (using &RCTEXT or
&RC1 - &RCn, respectively)
■ Any global or user-defined token value
■ Static text
For example, if Event B was initially determined to be the root cause but was
subsequently replaced by Event A, you could generate the Revised
Correlation Event ―Event A has been replaced by Event B as the root cause
for Problem X‖ using the template ―&TEXT has been replaced by &RCTEXT as
the root cause for Problem X.‖
Reset Request Acknowledge Event
The Reset Request Acknowledge Event can be generated whenever a rule or
pipeline item resets in response to a Reset Request Event.
Local Impact Event
If the rule is configured to generate impact events, the pipeline item Use
Root Impact Event flag is set to false, and this is not the root cause item, this
output event is generated to the Event Console after maturity to report the
events impacted by the root cause.

Components of a Correlation Rule
Chapter 3: Improving Event Processing with Advanced Event Correlation 109
Root Events
You can define root events to override pipeline events. Individual root events are
defined as follows:
Reset Request Event
You can configure this input event to match incoming events that trigger the
rule to reset automatically, rather than waiting for the duration of the reset
period.
Root Reformat Event
You can configure this output event to reformat events that matched the
item if the pipeline item Reformat Matched Event is set to TRUE, and the Use
Root Reformat Event flag is set to TRUE.
Root Correlation Event
This component describes the message that identifies the root cause event
to be sent to the Event Console at maturity of the correlation rule.
Root Revised Correlation Event
This output event is generated to indicate that a new root cause has been
identified in the following circumstances:
■ The rule level Enable Revised Root Cause Event flag is set to TRUE.
■ The new root cause pipeline item Use Root Revised Correlation Event
flags is set to TRUE.
■ The pipeline item is matched after maturity and is higher than the
current root cause item.
Root Impact Event
This component describes the message to be sent to the Event Console for
each of the impacted messages. This message could contain components of
the root cause message as well as the impacted messages. You can also use
event-by-event impact messages, or aggregate impact messaging.
Note: For more information, see Impact Analysis.
Root Reset Event
This component describes the message to be sent to the Event Console when
the correlation rule is reset.
Note: For more information about resetting a rule, see Timing Parameters.
Root Request Acknowledge Event
This output event is generated to acknowledge receipt of the request to the
Console if the rule has been reset using a Reset Request Event.

Components of a Correlation Rule
110 Inside Event Management and Alert Management
Boolean Logic Rule Components
The components of a Boolean logic correlation rule are as follows:
■ Boolean operators
■ Root events
Boolean Operators
Each Boolean rule can have one or more nested Boolean operators, each with
one or more pipeline items. These Boolean operators let you establish complex
relationships among messages. When AEC receives many messages that are
matched by different pipeline items, it performs the logical Boolean operations to
determine if all conditions have been met.
For example, assume you define a rule that contains the following components:
Boolean Operator AND has been selected.
Pipeline Item # 1: Disk I/O Usage Critical
Pipeline Item # 2: Database Backup Starting
When AEC detects both events (Item # 1 AND Item # 2) occurring within the
maturity period, it generates a correlation event. In this example, you may want
to stop the database backup to save disk I/O.
The following components of Boolean operator pipeline items are the same as a
pipeline rule:
■ Match Event
■ Exclusion Event
■ Reset Request Event
■ Local Reformat Event
■ Reset Request Acknowledge Event
Note: The Local Correlation Event, Local Reset Event, Local Impact Event, and
Local Revised Correlation Events are not available in a Boolean pipeline item,
because all pipeline items must be considered together in a Boolean rule. Use the
root versions to generate these output events.

Components of a Correlation Rule
Chapter 3: Improving Event Processing with Advanced Event Correlation 111
Root Events for Boolean rules
The following Boolean rule root events are the same as a pipeline rule:
■ Reset Request Event
■ Root Reformat Event
■ Root Correlation Event
■ Root Reset Event
■ Reset Request Acknowledge Event
Boolean Logic in AEC Rules
AEC provides support for complex nested Boolean logic conditions, which lets
you use Boolean logic on events. In addition to defining patterns and capturing
matched events, AEC can perform Boolean logic on whether matched events
have occurred and make a corresponding determination on whether to send out
correlated messages when the Boolean logic returns a TRUE condition.
Boolean logic can be applied by defining Boolean logic rules. Boolean logic rules
are different than event pipeline correlation rules. Boolean logic rules do not
have pipelines but instead correlate events using Boolean operations.
Boolean Logic Rules
Boolean logic rules support complex nested Boolean logic conditions that help
you analyze and identify complex patterns of behavior.
The Boolean operators supported are as follows:
The symbol
Means AND. All Conditions must be meet
The symbol
Means OR. At least one of the conditions must be met.
The symbol
Means XOR (exclusive OR). Only one of the conditions must be met.
The symbol
Means NOT. The condition must not be met.

Components of a Correlation Rule
112 Inside Event Management and Alert Management
These operators can be combined to form very complex logical statements. For
example:
As with event pipeline rules, the pipeline item object for a Boolean logic rule
determines what events are matched, how they are processed, and what the
output will be:
A Boolean condition is different from a root cause (input) event. You define the
Root Correlation and Reset Events at the rule level (rather than pipeline item)
and they are output when the rule matures, assuming all conditions have been
met in the Boolean logic statement.
Boolean logic rules can be configured to mature as soon as all conditions of the
Boolean statement are met.
Auto-Trigger
An additional feature of a Boolean logic rule is Auto-Trigger (a configurable
option), which is a trigger that can occur without receiving an event as input. At
least one NOT condition must be met. Using Auto-Trigger, you can trap the
absence of an anticipated event.
For example, if you know that there should be a heartbeat event from a key
application every hour, you can define a rule with one NOT condition to match
that event. It will auto-trigger in the absence of the event. If the event is not
received by the end of the maturity period, the condition will be TRUE and the
rule can cut a Root Correlation event to indicate that the application has failed. If
the event is received, the condition will not be true and the rule will be reset at
maturity without generating its Root Correlation event.

Components of a Correlation Rule
Chapter 3: Improving Event Processing with Advanced Event Correlation 113
Example: Boolean Logic
You may have a situation where the correlation depends on the occurrence or
non-occurrence of a series of events. An example of this situation could be Ping
Down from two nodes of a clustered server. If there is a Ping Down from Server
A, it does not constitute a problem, as the Server B would handle its functions.
However, a Ping Down of Server B in conjunction with Server A does constitute
a serious problem. Similarly, if there is a Ping Down message from Server B
alone, it does not constitute a problem.
The previous situation can be further complicated with a third message, Server
Maintenance, which indicates that Server A and Server B are brought down as a
part of maintenance, but the servers being down does not constitute a problem.
The following table summarizes this situation:
Messages Diagnosis Correlated
Message
Ping Down Server A [EVENT-A] Not a problem because
Server B takes over.
None
Ping Down Server B [EVENT-B] Not a problem because
Server A takes over.
None
Ping Down Server A [EVENT-B]
Ping Down Server B [EVENT-B]
No application availability. Cluster failure
Ping Down Server A [EVENT-A]
Ping Down Server B [EVENT-B]
Server Maintenance [EVENT-C]
Scheduled maintenance. None
Timing Parameters
Each correlation rule has time settings that specify when to report a correlation
message to the Event Console once the rule is triggered, and when to stop
processing the rule after it is triggered.

Components of a Correlation Rule
114 Inside Event Management and Alert Management
Maturity Seconds and Override Maturity Flag
Maturity Seconds or Maturity Period in the Configuration Wizard is the period
required to establish the root cause for a given event stream. AEC waits a given
number of seconds after triggering a rule to report the root cause event to the
Event Console.
This maturity period must be long enough to ensure that AEC sees the root cause
event for a given event stream. If the period is too short, AEC will not have
enough time to establish the root cause, and will not be able to correlate all
messages associated with the current event stream. If the period is too long,
AEC will wait too long to establish the root cause, and unrelated events from a
new event stream may be seen by AEC as related to the previous stream.
The value of this parameter depends heavily on the events that you are
correlating. You can override this value by setting an Override Maturity flag on a
pipeline item. In this case, the root cause event is established as soon as the
matched event arrives.
Reset Seconds and Request Reset Event
Reset Seconds or Reset Period in the Configuration Wizard is set as the
estimated time in which the flood of messages is to be blocked. AEC waits a given
number of seconds after triggering a rule to identify subsequent matched
messages as repeated messages, relating to the same root cause.
This reset period should correspond to the time it generally takes after the root
cause of an event is established for that problem to be resolved. If the period is
too short, AEC does not have enough time to recognize repeated messages as
being repeated, and treats repeated messages as if they were separate failures.
If the period too long, AEC continues to ignore similar messages that are
repeated for longer than the specified time, and may not act upon some
messages by mistaking them as repeated.
The value of this parameter also depends heavily on the events that are being
correlated. This value can be overridden when a message comes in that matches
the Request Reset Event. Then the rule is reset immediately.
For example, if an interface failure on a server occurs, you may want to suppress
the agent events for the time that it takes to replace the interface. The Request
Reset event is important because if you replace the interface faster than normal,
you want to be ready as soon as possible, in the event that the new interface also
fails.

Tokens
Chapter 3: Improving Event Processing with Advanced Event Correlation 115
How AEC Uses Timing Parameters
Typically, a correlated message is generated by the correlation rule at maturity.
Until reset, the rule is triggered only once. All other messages that satisfy the
rule are considered correlated to the current instance of the rule. Duplicate
messages do not trigger another rule. That is how the reset period absorbs
flooding.
Upon reset, the current instance of the rule dies. No further messages are
correlated with the same root cause. Any further messages satisfying the rule
conditions can trigger another rule instance and report another root cause. This
new instance is completely independent of the last one.
Fine-tuning the maturity and reset periods is important for AEC to correlate
correctly.
Example: Timing Parameters
When a system fails, an application makes four attempts to access its services
every 60 seconds. Thus, the application reports four failures at 0, 60, 120, and
180 seconds.
A reset period of 100 seconds is too short because two rules will be triggered and
two root causes will be reported for a single failure. However, a reset period of
500 seconds is too long. The system may go through a failure, come back up,
and fail again. In this case, only one root cause would be reported for two
failures.
In this example, a good reset period would be 200 seconds.
Tokens
You can use tokens in correlation rules. A token is similar to a substitution
parameter and can be recognized by the preceding ampersand character (&). For
each Event field, any tokens are replaced by their actual correlation rule values
(if they exist), otherwise they will be replaced by a word wildcard, that is, any
value will match.
AEC supports the following types of tokens:
■ Internal tokens
■ User-defined tokens

Tokens
116 Inside Event Management and Alert Management
Internal Tokens
Internal tokens already exist in AEC and can be referenced without the need to
define them. Internal tokens are also referred to as built-in tokens.
AEC internal tokens closely match the tokens available in Event Management
message records and actions, and can be used to identify predefined event
variables. In addition, there are tokens specific to AEC.
See the online help for descriptions of AEC internal tokens.
User-Defined Tokens
User-defined tokens can be included in any field of an incoming matching
message. User-defined tokens are defined as &(..), with the name of the
user-defined token in the parentheses.
User-defined tokens can be used to establish a relationship among messages
that should be correlated. For example, if you want to relate a ping failure on one
server to a service failure on that particular server, you can define a token such
as &(NODENAME) in the matching string of the two messages.
An assigned token, such as &(NODENAME), parsed from an incoming message,
can be reused in an output message. For example, if you enter &(NODENAME) in
the node field of a pipeline item match message, it is assigned to the first
matching message and may be reused as part of an output message, such as a
local correlation message.
User-defined tokens can facilitate template rules, that is, a new rule will be
triggered for each unique user-defined token assignment. For more information,
see Template Rules.
The user-defined token value is assigned by the first matching message, and it
does not change until the rule has been reset.
Local User-Defined Tokens
User-defined tokens can have a scope within a rule, called a local token. A local
token can be referenced only within the rule in which it is defined.
Local user-defined tokens can be either static or dynamic. The value of static
tokens can be determined using the fields of an event. A dynamic token can be
configured to use a script or executable to return the token value. Periodically,
the script is executed and the result is parsed into match and output
components. In this way, tokens that reflect the current state of the dynamically
changing enterprise can be assigned.

Tokens
Chapter 3: Improving Event Processing with Advanced Event Correlation 117
To define a token for a rule, select a token type. Valid token types are as follows:
Case-sensitive
The token uses case-sensitive matching.
Case-insensitive
The token uses case-insensitive matching.
Host
The token matches the case-insensitive short or fully qualified name for a
device.
Dynamic
The token is assigned a value dynamically from an external source.
Maturity
The token can extract a numeric value from an event field and assign it to the
rule maturity interval.
Reset
The token can extract a numeric value from an event field and assign it to the
rule reset interval.
The token is added to the token list with a red icon to indicate it is not yet active,
which means that it has not yet been instantiated:
After the token is added, you can configure the token name and additional
properties (which vary depending on the token type). Whenever you use the
token in a rule, you can reference it by name, for example, &(MYTOKEN). All
configuration information is retrieved from the declaration when the token is
instantiated.
Static User-Defined Tokens
You can predefine static user-defined tokens by adding token objects to the
token list and then referencing them throughout a rule.

Tokens
118 Inside Event Management and Alert Management
Dynamic User-Defined Tokens
A local dynamic token calls a script or executable when instantiated, and can
pass as a parameter the value that matched the token (using an &TEXT token).
The script or executable must return (to stdout) a string in the following format:
[input-string]\n[output-string]
where input-string is the string substituted in input events, and output-string is
the string substituted in output events.
For example, the following event and token call the script MyScript with the
command line:
C:\MyScript AValue ABC
The string returned by MyScript is then parsed; everything before the new line is
the string for input events, and everything after is for output events.
Match String: ^TEST: &(DYNAMIC:3600:C:\MyScript &TEXT ABC)
Input Event: TEST: AValue
Lists and Paired Lists
The values returned from a dynamic script or executable can be a singular value,
a list of values, or a paired list of values. The format of the values for each of
these return types is shown in the following table:
Return Type Example of Returned
Values
Referencing the Token
Singular value Red &(TOKEN1) matches /returns
"Red"
List of values Red,Blue,Green &(TOKEN1:1) matches /returns
"Blue"
List of paired
values
Color,Red,Age,Thirty &(TOKEN1:Age) matches
/returns "Thirty"
Additionally, local dynamic tokens have a cache to aid performance. The data returned by a
script or executable call is placed into the cache and remains there for the time (in seconds)
indicated in the token definition. Any call to a script checks the cache first to see if a previous call
with the same parameters has been made.
If a previous call has been made with the same parameters and it is ―in-date,‖
the return value is retrieved from the cache, saving significant time. If there is no
entry, or the entry is too old, the entry is flushed and the script is invoked.
Because the cache is shared across all rules, its benefits are significant.

Tokens
Chapter 3: Improving Event Processing with Advanced Event Correlation 119
Example: User-defined Tokens
You can use user-defined tokens in a correlation rule with two items, such as the
following:
Ping Failure on &(NODENAME)
Service failure on &(NODENAME)
The event Ping Failure on A will be correlated to Service Failure on A messages
only, and not to Service Failure on B and Service Failure on C messages.
Use the Matching Regular Expression
You can configure the matching regular expression asterisk character (*) to
include any valid regular expression. This gives you tight control over what token
will match in incoming events. This expression is defined in the Expression field
in the token object.
Note: For more information, see Regular Expressions.
Use Additional Token Evaluation
Once a token has been assigned a value based on the matched element within an
incoming event, you can apply additional evaluators to that value to determine if
the token (and therefore the pipeline item) matches. Available evaluators are as
follows:
Greater Than
The matched value must be greater than the value specified.
Greater Than or Equal To
The matched value must be greater than or equal to the value specified.
Less Than
The matched value must be less than the value specified.
Less Than or Equal To
The matched value must be less than or equal to the value specified.
Between
The matched value must be within the range specified.
Not Equal To
The matched value must not match the value specified.

Tokens
120 Inside Event Management and Alert Management
When using additional evaluators, you can also specify that the token never
actually be instantiated with a value. This lets you use tokens to extend the
capabilities of Perl-compatible regular expressions to include the evaluation
capabilities listed previously.
For example, assume you have defined a token &(IP_RANGE) that has a
Between evaluator configured specifying the matched value must be between 75
and 100. You can then use the IP_RANGE token to restrict the Match Event to
match events only relating to devices that have an IP address that falls within the
range specified (for example, 192.168.51.&(IP_RANGE)). Because IP_RANGE is
never instantiated with a value, it continues to act as a filter for the IP addresses
being matched even after the first event has been matched.
Global Constants
A global constant is a constant that you define once — manually or by calling an
external script, Dynamic Link Library (DLL), or executable — and then use
throughout AEC policy. Global constants apply to all rules in a policy. These
constants can be used to implement a static text substring in multiple rules. The
substring can be changed globally, making it unnecessary to modify many rules
manually.
Global constants can be either static or dynamic. The value of static constants
can be determined using the fields of an event. A dynamic constant can be
configured to use an external script, DLL, or executable to return the constant
value. The DLL is loaded periodically, and the specified DLL function is called to
retrieve the constant value. In this way, constants that reflect the current state
of the dynamically changing enterprise can be assigned.
As with user-defined dynamic tokens, the script or executable invoked must
return a string in the format:
[input-string]\n[output-string]
where input-string is the string substituted in input events, and output-string is
the string substituted in output events.
Template Rules
Chapter 3: Improving Event Processing with Advanced Event Correlation 121
If you want to write a DLL function then it must be in Microsoft MFC/ATL. The
function declaration is as follows:
bool DllFunc(CStringList *lpParams, int *nBufSize, CString *lpReturnString);
where the parameters are as follows:
CStringList *lpParams
In parameter. A cstring list of all parameters, specified during the creation of
the global dynamic constant.
int *nBufSize
Out parameter. Return the length of the lpReturnString here.
CString *lpReturnString
Out parameter. Return the string here. This should be in the format
Input\nOutput, as with the executables and scripts.
Calendar Support
As with correlation rules, dynamic global constants support the use of CA NSM
calendars. If configured, the value of the dynamic global constant is only
refreshed when the calendar is active.
Template Rules
A template rule is a rule that acts as a generic template and lets multiple
instances run. The rule should contain user-defined tokens that enable AEC to
identify similar (but unrelated) events.
Tokens are set when events are compared against the rule; the tokens take the
values of the corresponding items in the event.
When an event occurs that matches the match string in a rule but does not agree
with the user-defined tokens, the new event invokes another instance of the
rule. This new instance processes with its own token values, and, at the time of
its maturity and reset, creates its own correlation and resets messages.
Example:Template Rule
Expanding upon the previous example of a correlation rule using Service Failure
and Ping Failure as a template rule, a new instance will be created for each new
NODENAME value that is encountered.

Regular Expressions
122 Inside Event Management and Alert Management
Where NODENAME is a static user-defined token, assume that the following
events occur:
1. Ping Failure on A
2. Service Failure on A
3. Service Failure on B
4. Service Failure on C
5. Service Failure on C
Three different instances of the rule will be triggered, as follows:
■ Instance # 1--NODENAME=―A‖ correlates events # 1 and # 2. The root
cause identified by this rule would be Ping Failure on A.
■ Instance # 2--NODENAME=―B‖ correlates event # 3. The root cause
identified by this rule would be Service Failure on B.
■ Instance # 3--NODENAME=―C‖ correlates events # 4 and # 5. The root
cause identified by this rule would be Service Failure on C.
As another example, assume that you have defined the following tokens in a
correlation rule:
Router &(ROUTERNAME) is &(STATUS)
These tokens would match a message such as "Router A1 is Down" or "Router A2
is Up."
If the correlation rule is a template rule, two instances of the correlation rule
would be created.
If the correlation rule is not a template rule, the rule would match only the first
event because, once set in a correlation rule, user-defined tokens cannot be
reset. If you want to match both events, define the correlation rule as a template
rule.
Regular Expressions
AEC allows the matching of events based on patterns instead of fixed strings.
These text patterns are known as regular expressions, and they are stored in the
match event fields of AEC. AEC uses the Perl-compatible Regular Expression
Library for the evaluation of regular expressions.

Regular Expressions
Chapter 3: Improving Event Processing with Advanced Event Correlation 123
Regular expressions evaluate text data and return an answer of true or false.
That is, either the input string matches or it does not. Regular expressions
consist of characters to be matched as well as a series of special characters that
further describe the data. The description specified by special characters (also
called meta characters) can be in the form of position, range, repetition, and
placeholders.
Within AEC, rules can be specified for the set of possible events that you want to
match. Regular expressions can also be used to split the event apart in various
ways. Regular expressions are also used to extract parts of strings and store the
parts as tokens.
All fields of the Match Event accept regular expressions, including the following:
■ Message Number
■ Message String
■ Node
■ User
■ Station
■ Severity
■ Device
■ Job Management
■ Process
■ User Data
■ Category
■ Tag
■ Source
■ Hour
■ Day of Month
■ Month
■ Year
■ Day of Week
■ Day of Year
AEC correlates only those messages whose node, user, station, message string,
and so on, matches what is specified in the match event of a rule, and then
triggers that rule.
For a list of regular expressions and their meanings, see the online help.

Impact Analysis
124 Inside Event Management and Alert Management
Impact Analysis
You can configure AEC rules to generate, in addition to root cause messages,
messages associated with the events impacted by the root causes.
AEC analyzes input messages to determine the impact a failure has on a
component of a system. AEC responds by sending out impact analysis messages
based on its rules. These messages can contain specified substrings from both
the root cause and the impacted message. In addition, these impact messages
can be sent to the Event Console in the form of an aggregate report, one for each
non-root cause.
AEC recognizes a dependency of event A on event B (which is defined in the
correlation rules), so you can use it to report impact messages like the following:
■ A is impacted because B went down
■ B has impacted A
■ B has impacted [A1, A2, A3, A4]
For example, an operator shutdown on US-NY-01 has caused a ping failure and
an agent failure.
You can use impact analysis to do the following:
■ Provide the operators with complete and intelligent information, enabling
them to understand and provide notification of the failures in the enterprise.
■ Use impact messages to notify the repair personnel to fix the real failures.
These messages can also be used to notify users that "false" failure of
components has impacted their hardware or software.
■ Make infrastructure changes that affect the impacted components, after
receiving impact messages.
For example, a router failure has caused a group of applications to fail
because they have been disconnected from the database server. After
receiving the impact messages, provide an alternate route or use a failover
router from the applications to the database server that would bypass the
failed router, thereby reducing the downtime of these applications.
■ Provide system administrators with a way to measure the impact of failures
of hardware and software throughout the enterprise—measuring not only
the downtime of the failed component, but the impact of the failure on all
affected components.
For example, a failure on a router that is connected to two less critical
workstations may not necessitate a repair until hours later. However, a
failure on a router that supports hundreds of servers that house an
enterprise’s main applications, which are accessed in real time by its clients,
requires an immediate fix.

Impact Analysis
Chapter 3: Improving Event Processing with Advanced Event Correlation 125
Impact Events
A root impact event is a type of reporting event that lets you specify the format
of reported messages.
You configure a root impact event in the same way that you configure the other
two types of reporting events (root correlation and root reset). A root impact
event also has a similar local instance for each pipeline item, called a local impact
event, and also a flag for Use Root Impact Event.
When configuring a root impact event, you can use tokens to configure the
impact message that is reported to the Event Console. Different types of
messages are generated in different ways.
■ A correlation message is generated at maturity. A reset message is
generated at the end of the reset period (or when reset by a reset request
event). Both messages contain information about the root cause event.
■ A local impact message is generated for each processed Event Console
message. This message will contain information about non-root cause
events that have been impacted by the root cause failure. The impact
messages can be generated, one by one, after maturity, or can be done as a
one-time aggregate report.
■ If the aggregate impact mode is not chosen, the impact messages are
generated once for each non-root cause event. However, there is no
message generated until the root cause is determined, which is at maturity.
In some cases, maturity may be before the end of the maturity period if the
Override Maturity flag is set. The impact messages cannot be generated until
the root cause is known because, until correlation occurs, it is not known if a
message is root cause or non-root cause.
■ At maturity, each distinct non-root cause message causes an impact
message. After maturity, any non-root cause event that occurs generate an
impact message. This continues until reset occurs. As AEC reports distinct
messages only, operators do not have to read repeated failure messages and
impact messages.
As well as generating individual impact messages, AEC can be configured to
generate an aggregate impact message, which is one message for all non-root
cause events. For example, you could configure a message such as ―Ping Failure
on Server A caused Agents (X Y Z) to fail.‖

Impact Analysis
126 Inside Event Management and Alert Management
Aggregate Impact Messages
Impact events can also be aggregated into a single, concise message. To use
aggregate impact messages, the flags Generate Impact Events for Root Cause
and Generate Aggregate Impact Event must be set to true at the rule level.
Aggregate impact events are defined within the root impact event because
impacts from all pipeline items must be considered.
Note: In the wizard, this means selecting the Generate Impact Events check
box, and clicking the Aggregate button under Impact events at the bottom of the
window.
The key to specifying aggregate impact events is the special token &EVTLST(...),
which outputs elements of each matched event that is non-root cause. Tokens
inside the parentheses are repeated for every non-root cause event that
matched the pipeline. You can use any user-defined or built-in tokens inside
&EVTLST.
The following is an example of an aggregate impact message:
&RULEDESC Root Impact: &RCTEXT CAUSED { &EVTLST(&TEXT )}
Thus, a rule with the following elements would generate the aggregate impact
event shown below:
Rule Description: Server Shutdown
-Pipeline Item # 1: OPR Server Shutdown
-Match Event: ̂ OPR_Server_Notify: Server: &(SERVERNAME) UID=caunint 12/4/00 10:18:18
AM Change#: Msg=shutdown restart
-Local Correlation Event: Scheduled Shutdown of &(SERVERNAME)
-Pipeline Item # 2: Server Ping Failure
-Match Event: ^WindowsNT_Server Ping Poll Agent:Ping .* Broken Ping
-Local Correlation Event: Ping Failure on &(SERVERNAME)
-Pipeline Item # 3: Agent Failure
-Match Event: ^WindowsNT_Server SysAgtNT Trap Agent:SysAgtNT NA LINK-DOWN NT
-Local Correlation Event: Agent Failure on &(SERVERNAME)
The resulting impact message would be as follows:
Server Shutdown Root Impact: Scheduled Shutdown of NODEA CAUSED { WindowsNT_Server
Ping Poll Agent:Ping NODEA:Ping Broken Ping WindowsNT_Server SysAgtNT Trap
Agent:SysAgtNT NA LINK-DOWN NT}
So, a single console message can display the root cause and all events impacting
the root cause determination.

Implement AEC
Chapter 3: Improving Event Processing with Advanced Event Correlation 127
Implement AEC
After you have created, deployed, and tested rules, you can put them into
production. The correlation process runs unattended by deploying policy to the
AEC Engine, which is installed with every Event Agent and Event Manager.
The AEC Engine runs in the background and processes the events received at the
Event Console.
By default, Event Management passes all events to this Engine before doing any
of its own processing (that is, message actions, writing to the log, and so forth).
You can also configure AEC to process events sent directly to the console log,
such as the message action SENDOPER.
Note: The Windows IDE Policy Editor processes events after they are sent to
Event Console, whereas the Engine processes them beforehand. So, when AEC is
configured with reformatting or suppression features, these features work only
when using the Engine.
Deploy Policy
You can deploy policy using either the Deploy Policy dialog or the ace_reload
command line utility. Both facilities let you select any combination of policies
from the MDB and deploy them to any combination of Event Agents.
Note: Do not use the Windows IDE Policy Testing function and deploy policy to
the AEC Engine at the same time to process rules. If both the IDE Engine and the
Engine are running at the same time on the same machine, duplicate messages
appear in the Event Console.
Implement AEC
128 Inside Event Management and Alert Management
ace_reload Command—Select and Deploy AEC Policy
Valid on Windows, UNIX, and Linux
You can deploy policy using the ace_reload command-line utility. You can run the
ace_reload command-line utility on each agent to select any combination of
policies from the MDB and deploy them to any combination of Event Agents.
This command has the following format:
ace_reload [-all] [-cawto] [-database policy1,policy2,...] [-help] [-import
xml_file1,xml_file2,...|text_file] [-list] [-overwrite] [-registry] [-status] [-v
policy1,policy2,...] [-xml xml_file1,xml_file2,...] [-k policy1]
-all
Removes policies from the AEC Engine, and then reloads it with all active
policies from the MDB.
-cawto
Resets and reloads the current set of policy.
-database policy1,policy2,...
Withdraws the specified policies from the MDB and forces the AEC Engine to
load them. The command appends the policies to the existing policy unless
you specify the -overwrite parameter.
-help
Displays on-screen help on this command.
-import xml_file1, xml_file2,…|text_file
Imports the specified XML policy files into the MDB. Alternatively, specify the
name of a text file that lists the XML policy files to load.
-list
Lists all the available policies in the MDB.
-overwrite
When used in combination with the -database and -xml options, overwrites
the current configuration instead of merging it with the specified policy.
-registry
Checks the Windows registry to determine which policies are specified for
deployment under the DeployPolicy entry. The command then withdraws the
specified policies from the MDB and forces the AEC Engine to load them.
-status
Displays the currently loaded policies, the total number of active policies,
active rules, active template rules, and active rule instances. The output of
-status option is seen in the EM Conlog.

Implement AEC
Chapter 3: Improving Event Processing with Advanced Event Correlation 129
-v policy1,policy2,...
Forces the AEC Engine to unload the specified policies.
-xml xml_file1, xml_file2,…
Forces the AEC Engine to load the specified XML policy files. Specify the full
path to each file. The command appends the policies to the existing policy
unless you specify the -overwrite parameter.
-k policy1
Deletes the policy from the policy database.
Note: Before running the ace_reload utility on a Linux or UNIX console, you
should run the following command:
# source /etc/profile.CA
Check the AEC Engine Status
You can check the AEC Engine status across multiple nodes and platforms from
a single location by using the Policy Editor's Deploy Policy dialog. The same
dialog lets you pause and resume any combination of Event Agent engines.
Check Policy Status and Utilization
Diagnostics in the engine track each policy, the number of times it is triggered,
when it is triggered, the rules within the policy that are triggered, and a number
of other parameters. This diagnostics data is stored internally and available for
reporting later. This provides a convenient way to monitor the engine and to
ensure that policy is being invoked.
Utilization statistics are also tracked and reported. For better performance, you
can optimize those policies that are frequently invoked and remove policies that
are never invoked.
Event Log Player
The Event Log Player utility plays back prior Console Logs so that you can
optimize the AEC policy. The player resembles a video cassette recorder. You
must enter the log directory and starting date and times as well as a target Event
Management node. Clicking Play causes all prior log messages that meet the
criteria to be resent to today's console on the designated node. In this way, you
can use historical events to provide simulation for the AEC rules. Other features
allow for a real-time playback mode in which the messages are sent with their
original frequency.

Advanced Template String Editor
130 Inside Event Management and Alert Management
The Event Log Player installs with the Windows AEC only. To start the Event Log
Player, enter the following at a command prompt:
C:\Program Files\ca\sharedcomponents\ccs\wvem\ace\EmEvtLogPlayer.exe
Advanced Template String Editor
The AEC Windows IDE includes a powerful utility that lets you test matched
messages against regular expressions and tokens defined in the message.
Invoke the Advanced Template String Editor from the Configuration Wizard by
clicking the Editor icon next to the field.
Advanced Configuration
You can use the following advanced features when configuring correlation rules
in AEC.
Override Maturity
By default, AEC waits for the maturity seconds before sending a root cause
message. Sometimes you do not need to wait for the maturity period. For
example, if an operator shuts down a system, you know the root cause of failure.
You can use the Maturity Override flag to override any wait time. As soon as the
matched event is encountered, the system sends correlated messages.
To override maturity, set the Maturity Override flag for the desired rule. Once
you have set this flag to true, the rule no longer waits for the maturity period to
send a root cause message.
Suppress Processed Messages
You may sometimes want to hide the messages that AEC has identified as being
non-root cause. This process enables operators who are looking at the Event
Console to see genuine problem messages only.
To hide these events in the Event Console, set the Suppress Matched Event flag
at the pipeline item level (see Pipeline). Setting this flag also prevents Message
Record and Actions from processing these events. Notice that by choosing
Suppressed Messages from the View menu in the Event Console log, you can
optionally view the events.

Advanced Configuration
Chapter 3: Improving Event Processing with Advanced Event Correlation 131
Note: You can suppress a processed message through the shared library engine
but not through the Windows IDE policy editor. Unlike the shared library engine,
the IDE policy editor reads events directly from the Event Console log rather than
intercepting them before they reach the log. Once an event is in the log, you
cannot suppress it.
Reformat Processed Messages
You may not want to suppress messages that AEC has identified as not being the
root cause. Instead, you may want to make these processed messages look
different on the Event Console by reformatting. This reformat lets operators
know that the events are processed, even if they do not need to take action. For
example, suppose that the following two messages arrive in the Event Console:
Subnet 130.200.78.xx Down
Node 130.200.78.99 Down
The Subnet message is the root cause. However, instead of suppressing the
node message, you can reformat the message to let the operator know that the
node is down due to the Subnet being down.
To reformat messages, use the Reformatted Event String at the Engine level.
&TEXT is the only valid token. Root and Local Reformat Events support all
tokens.
For event reformatting specific to each matched event, see the Root and Local
Reformat Events associated with each rule.
Reset Rules Dynamically
By default, setting the Reset Seconds in the correlation rule resets the rule in a
static manner when the Reset period ends. AEC lets you terminate a rule while it
is processing. There are two ways to reset a correlation rule while it is
processing:
■ During development testing, in the Windows IDE policy editor, right-click the
correlation rule that you want to reset and then choose Reset from the
context menu.
■ Define a Reset Request Event. This identifies a user-defined situation where
a rule is reset while it is running. The Reset Request Event listens for an
incoming message and, when a match occurs, terminates the rule
processing instead of waiting for the duration of the maturity and reset
period. When the Reset Request Event occurs, the correlation rule resets.
Note: If the Reset Request Event is received after maturity, the rule resets
immediately.

Advanced Configuration
132 Inside Event Management and Alert Management
Correlation among Rules and RC Suppression Flag
By default, AEC generates a root cause message for each rule, regardless of
whether another rule may have sent out a root cause message for the same
event. This creates multiple messages whenever the same match event exists
for more than one rule, and that event is matched.
You can specify correlation among the root cause messages so that the common
event is reported as the root cause only once. For example, consider the
following two rules:
Example Rule # SR:
Pipeline Item # A: Operator performed Shutdown with Restart
Pipeline Item # B: Ping failure
Example Rule # SO:
Pipeline Item # C: Operator performed Shutdown with no Restart
Pipeline Item # D: Ping failure
These two rules have a common event: ping failure (B or D). For example, if an
operator brings down a system with a ―shutdown with restart‖ option, a ping
failure occurs. Since events A and B occur, rule # SR is triggered. Because event
B is the same as event D, rule # SO is also triggered.
By default, AEC generates two root cause messages: one associated with event
A as the root cause in rule # SR, and the other associated with event D as the
root cause in rule # SO. You can eliminate the generation of the second
message.
To suppress additional root cause (or non-root cause) messages for a rule, set
the Suppress Matched Event RC flag to TRUE for all rules that you want to
correlate.
Flexible Configuration of Certain Reported Fields
You can configure AEC to use the match and reported fields to achieve different
goals. The following sections describe two examples.
Use Tokens to Report the Originating Node
AEC reads messages from the Event Console, and then determines whether they
are false. As a result, the output messages generated by the engine contain the
node name of the node on which the engine is running, and not the name of the
node from which the message originated. This may cause problems with those
message records that are defined to trap messages that are generated on the
original server.

Advanced Configuration
Chapter 3: Improving Event Processing with Advanced Event Correlation 133
To keep the original node name in the node name field of the messages
generated by the engine, use the &NODEID internal token in the node field of the
reporting event (correlation, reset, or impact). This token retrieves the value of
the node from the original message. By using the same token in the reporting
event, AEC will report the messages with a node field containing the originating
node’s name.
Use Reset Request Event for Dynamic Resetting of Rules Using Event Messages
By default, setting the Reset Seconds parameter in the correlation rule resets the
rule in a static manner. AEC lets you terminate an instance dynamically, while it
is running, by right-clicking the instance, or by sending a message to the Event
Console.
In a production environment, you may want to terminate an instance in the
following situations:
■ A message from the Event Console
■ A particular status on an object that is reflected in a message
■ Adding or removing an object to or from a Business Process View by creating
a message to be sent to the Event Console
The Reset Request Event field lets you specify a match event that, upon receipt,
forces the rule to reset. For example:
Rule # 1
Pipeline # 1--Match Event=Ping Failure
Pipeline # 2--Match Event=Service Failure
Rule Reset Request Event=Ping OK
In this case, a Ping Failure triggers the rule and causes service failures to be
optionally suppressed. But, at some point during the activation of the rule, a Ping
OK event is received. The rule is then immediately reset. If it is reset before
maturity, the correlation event is not issued. After maturity, the reset interval is
circumvented and the reset event is immediately issued.
Event Filtering
By checking the Filter Matched Events flag, any event that matches a pipeline
item will not be considered by any subsequent pipeline item (in the same rule),
or rules in the rule list. This functionality is provided to improve event
throughput. Where you know that an event matches one of your rules only, there
is no need for that event to be processed by other lower-level rules in your
policy.

Advanced Configuration
134 Inside Event Management and Alert Management
AND Concept for Pipeline
A Match all Pipeline Items for RC flag can be set for a pipeline rule to indicate that
all pipeline items must be matched for the rule to generate a Root Correlation
event. This introduces a simple AND concept for the pipeline (defaults to OR).
You could also use a Boolean logic rule.
Calendar Support
AEC includes Calendar support for rules and dynamic tokens. A rule will only be
enabled when the (optionally) assigned Calendar is active. If a rule is enabled
while a Calendar goes inactive, the rule will continue to process events until
reset, after which it will not process events again until the Calendar reactivates.
This allows increased event throughput and reduced performance overhead by
preventing certain rules from processing events if they are relevant only to
certain times of the day, week or month.
Similarly, the scheduling capabilities of the global tokens are enhanced by
Calendar support. If configured, the token refreshes its value only when the
Calendar is active.
Event Counters and Thresholds
You can assign counters and thresholds to pipeline items to indicate how many
events should match before that element is considered a root cause item (in a
pipeline) or a TRUE condition in a Boolean logic statement. This lets you define
rules that state that one instance of an event is not a problem, but two or more
may indicate a problem. For example, a domain login failure may be a user error
the first time, but two or more errors could indicate an attempted security
breach.
All pipeline items have a threshold that defaults to one. This threshold must be
exceeded for a pipeline item to be a valid root cause item.
You can configure the threshold with the Configuration Wizard, using the
following built-in tokens:
■ &COUNT. The number of events that matched the root cause pipeline item.
■ &THRESHLD. The threshold on the root cause pipeline item.
For example, the correlated message can be defined this way:
Domain Logon Failure Message is generated &COUNT Times and the Threshold is &THRESHLD.
Advanced Configuration
Chapter 3: Improving Event Processing with Advanced Event Correlation 135
Event Sequencing
Every pipeline item has a configurable sequence number that can be used to
determine the order in which events must arrive for that element to be matched.
For example, the sequence number enables you to have a pipeline in which the
second pipeline item must arrive before the first in order to match. Additionally,
within a Boolean logic statement, the order in which the events arrive can affect
which conditions are met and, therefore, what the associated root cause is
determined to be.
All elements have a default sequence number of 0, which means they can be
matched in any order. A sequence number higher than 0 means that the event
must arrive at or later than the sequence number specified. Elements can have
the same sequence number, so you could have a condition that says Event A
(seq no 1) must arrive first, followed by Event B or C or D (all seq no 2).
Generate Root Cause for Every Matched Event
In a pipeline where you may have multiple events matching the same pipeline
item, you may want to output a correlation event for every matched event. For
example, if you have a pipeline covering ping failure and agent failure events for
a host, where the ping failure event is not seen but multiple agents have
reported failures, you can configure AEC to generate a correlation event to
indicate that several agents have failed of their own accord. You can do this by
setting the Generate RC for every Matched Event flag at the pipeline item level.
Restart Timer on Match
This flag lets you configure a rule that says, ―If I see a problem reported multiple
times within a five minute period, assume it is the same problem. If the problem
is reported outside of that five minute window, assume it is a new problem.‖ This
can further reduce the number of tickets associated with the same problem.
The flag works by resetting the maturity counter every time a new event
matches the pipeline item, so that the rule will only expire when no additional
events are matched during the configured period.
Rule Chaining
In some cases, you may want to use the output from one AEC rule to form the
input to another AEC rule. To support this, set the Reprocess AEC Events flag on
the rule. Default functionality in AEC prevents the automatic reprocessing of its
own events to avoid situations of infinite recursion and accidental matching.

Advanced Configuration
136 Inside Event Management and Alert Management
Rolling Event Window
A standard AEC rule is triggered when the first matching event arrives, and
matures in n seconds according to the maturity period you specified. Using
counters, you can do some basic event frequency correlation. For example, you
can generate a correlation event if five events are generated from the time of the
first event to maturity. However, to support true event frequencies, you can use
a rolling event window. This means that a correlation event is generated if five
events are generated at any time within the time window specified. Consider the
following time line:
The dashed lines represent the arrival of matching events, and the dotted lines
represent the maturity period for the associated rule.
In a standard rule configured to generate a correlation event, when five events
are matched within a maturity period of five minutes, no correlation event is
generated because five events were not matched between the time the rule was
triggered and the time it reached maturity (it would have been triggered twice in
the previous example with three matches on the first occasion and three
matches on the second).
In a rule configured to use the rolling event window, because five events were
seen within a five-minute period (just not within five minutes of the rule first
being triggered), a correlation event would be generated. A rolling event window
means that, as new events are added to the list of matching events for the rule,
old (expired events) are removed from that list and the maturity period is
readjusted to start from the first matched event that still falls within the maturity
period specified. This means that both the match counter and the maturity
counter for a rule can go down as well as up.
Using the Rolling Event window, you can configure rules that will trigger when an
event reaches a significant frequency. For example, a few network alarms may
be considered noise, but, if 50 are seen within an hour, that may indicate some
as yet undiscovered problem, such as an error in an updated routing table.
Note: The Rolling Event window only works with one pipeline item.

Examples: AEC Applications
Chapter 3: Improving Event Processing with Advanced Event Correlation 137
Examples: AEC Applications
The following examples guide you step-by-step through different applications of
AEC in an enterprise.
Ping Failure (Single Rule)
Whenever a system monitored by CA NSM fails, many Event Console failure
messages occur. These include ping failure messages as well as one service
failure message for each service.
The ping failure message is genuine and requires action. However, in this case,
the service failure messages are not necessarily important. Whether an action is
taken due to a service failure message depends on whether a ping failure
message has been sent.
Also, the DSM may report multiple failure messages for both ping and service
failure. When multiple failure events are reported, the message record
component of Event Management may issue multiple notifications. In extreme
cases, this failure can cause so many messages that the Event Console is
flooded. This flooding can have a negative impact on Event Management
processing times, and may cause other Event Management messages to be
overlooked by operators.
This example shows you how to configure AEC to achieve the following results:
■ Identify the genuine failure messages
■ Reduce multiple notifications
■ Eliminate flooding
Identify the Correlation (Single Rule)
Consider the following conditions:
■ If a ping failure occurs, it is the root cause.
■ If accompanied by a ping failure, a service failure is not the root cause.
■ If not accompanied by a ping failure, a service failure is the root cause.
■ Service failure and ping failure should be correlated only if they occur on the
same server. A service failure message on one server should not be
correlated with a ping failure message on another server.
■ Service failure and ping failure messages should be correlated on the same
server and any service.
Note: Configure AEC so that, after reading input messages of ping failure and
service failure, it outputs the root cause message.

Examples: AEC Applications
138 Inside Event Management and Alert Management
Configure the following correlation rule and pipeline items for this scenario:
■ Service correlation rule
■ Ping Failure pipeline item
■ Service Failure pipeline item
Add and Configure the Ping Failure--Service Correlation Rule
A rule must be created to ensure that service failures from a particular node are
only matched against ping failures on that node.
To add and configure the Ping Failure--Service Correlation Rule
1. Open a new Empty preconfigured rule, and expand Engine in the left pane of
the editor.
2. Select Correlation Rules, and then select Add Event Pipeline Rule.
3. Right-click the new rule, and then select Wizard (Windows IDE editor only).
The Rule Configuration Wizard window appears.
4. Enter information in the following fields:
Rule Name
Enter Ping Failure--Service Correlation Rule.
Maturity Period
Enter 30.
Reset Period
Enter 45.
Template Rule
Check this check box so that a different rule is triggered for each
originating node.
5. Click OK.
Add and Configure the Ping Failure Pipeline Item
A pipeline item must be created to identify when a ping failure occurs on a
particular node.
To add and configure the Ping Failure pipeline item
1. Expand the Ping Failure rule, and then select Pipeline.
2. Select Add New Pipeline Item.
3. Right-click the pipeline item, and then select Wizard (Windows IDE editor
only).
The Pipeline Item Configuration Wizard window appears.

Examples: AEC Applications
Chapter 3: Improving Event Processing with Advanced Event Correlation 139
4. In the Item Name field, enter Ping Failure.
5. Click Next.
The Event Configuration Wizard - Match Event pane appears.
6. Enter information in the following fields:
Message Template
Enter WindowsNT_Server Ping Poll Agent:Ping UP Broken Ping.
Node
Enter &(NODENAME). This ensures that service failures from a
particular node are only matched against ping failures on that node. This
field is used with the Template Rule check box.
7. Click Next repeatedly until the Local Correlation Event pane appears.
8. Enter the following string in the Message Template field:
AEC Correlated Message: Ping Failure on &(NODENAME)
9. Click Next repeatedly until the Local Reset Event pane appears.
10. Enter the following string in the Message Template field:
AEC Reset Message: Ping Failure on &(NODENAME)
11. Click OK.
Add and Configure the Service Failure Pipeline Item
A pipeline item must be created to identify when a service has failed.
To add and configure the Service Failure pipeline item
1. Expand the Ping Failure rule, and then select Pipeline.
2. Select Add New Pipeline Item.
3. Right-click the pipeline item, and then select Wizard (Windows IDE editor
only).
The Pipeline Item Configuration Wizard window appears.
4. In the Item Name field, enter Service Failure.
5. Click Next.
The Event Configuration Wizard - MATCH EVENT pane appears.
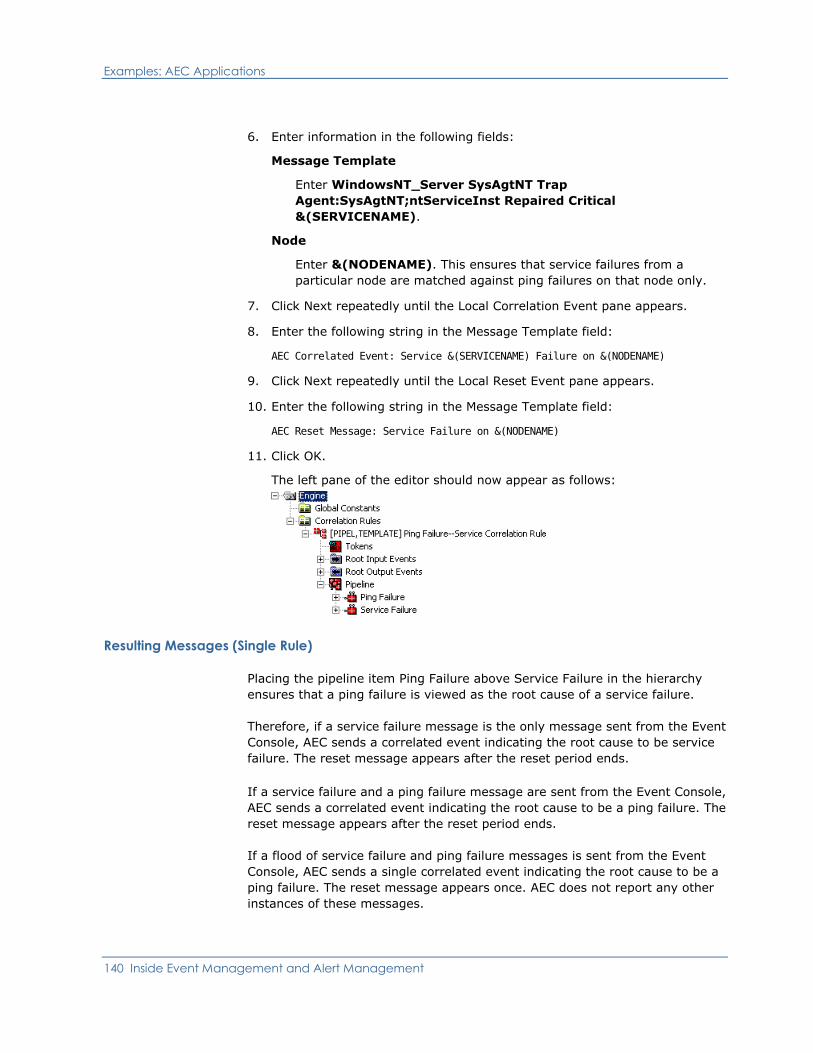
Examples: AEC Applications
140 Inside Event Management and Alert Management
6. Enter information in the following fields:
Message Template
Enter WindowsNT_Server SysAgtNT Trap
Agent:SysAgtNT;ntServiceInst Repaired Critical
&(SERVICENAME).
Node
Enter &(NODENAME). This ensures that service failures from a
particular node are matched against ping failures on that node only.
7. Click Next repeatedly until the Local Correlation Event pane appears.
8. Enter the following string in the Message Template field:
AEC Correlated Event: Service &(SERVICENAME) Failure on &(NODENAME)
9. Click Next repeatedly until the Local Reset Event pane appears.
10. Enter the following string in the Message Template field:
AEC Reset Message: Service Failure on &(NODENAME)
11. Click OK.
The left pane of the editor should now appear as follows:
Resulting Messages (Single Rule)
Placing the pipeline item Ping Failure above Service Failure in the hierarchy
ensures that a ping failure is viewed as the root cause of a service failure.
Therefore, if a service failure message is the only message sent from the Event
Console, AEC sends a correlated event indicating the root cause to be service
failure. The reset message appears after the reset period ends.
If a service failure and a ping failure message are sent from the Event Console,
AEC sends a correlated event indicating the root cause to be a ping failure. The
reset message appears after the reset period ends.
If a flood of service failure and ping failure messages is sent from the Event
Console, AEC sends a single correlated event indicating the root cause to be a
ping failure. The reset message appears once. AEC does not report any other
instances of these messages.

Examples: AEC Applications
Chapter 3: Improving Event Processing with Advanced Event Correlation 141
Ping Failure (Multiple Rules)
Whenever a CA NSM monitored system fails, many Event Console failure
messages occur. These include ping failure messages as well as one service
failure message for each service and one process failure message for each
process.
The ping failure message is genuine and requires action. However, in this case,
the service failure and process failure messages are not necessarily important.
Whether an action is taken about a service failure or process failure message
depends on whether a ping failure message has been sent.
In addition, the DSM may report multiple failure messages for ping, process
failure, and service failure. When multiple failure events are reported, the
message record component of Event Management may issue multiple
notifications. In extreme cases, this failure can cause so many messages that the
Event Console is flooded. This flooding can have a negative impact on Event
Management processing times, and may cause other Event Management
messages to be overlooked by operators.
This example shows you how to configure AEC to achieve the following results:
■ Identify the genuine failure messages
■ Reduce multiple notifications
■ Eliminate flooding
Identify the Correlation (Multiple Rules)
Consider the following conditions:
■ If a ping failure occurs, it is always the root cause.
■ If accompanied by a ping failure, a service failure is not the root cause.
■ If not accompanied by a ping failure, a service failure is the root cause.
■ If accompanied by a ping failure, a process failure is not the root cause.
■ If not accompanied by a ping failure, a process failure is the root cause.
■ Service, process, and ping failures should be correlated only if they occur on
the same server. A service or process failure message on one server should
not be correlated with a ping failure message on another server.
■ Service failure and ping failure messages should be correlated on the same
server and any service.
■ Process failure and ping failure messages should be correlated on the same
server and any process.
Note: Configure AEC so that, after reading input messages of ping failure,
process failure, and service failure, it outputs the root cause message.

Examples: AEC Applications
142 Inside Event Management and Alert Management
To configure the correlation rules and pipeline items, first open a new Empty
preconfigured rule and use the procedures in the first example to create the
service correlation rule and pipeline items described in that example. Then
configure the following correlation rule and pipeline items:
■ Process correlation rule
■ Ping Failure pipeline item
■ Process Failure pipeline item
The following sections provide instructions on how to do this.
Add and Configure the Process Correlation Rule
A rule must be created to contain pipeline items to identify the root cause when
a ping failure or service failure occurs on a particular node.
To add and configure the process correlation rule
1. Open the policy you previously created, and expand Engine in the left pane
of the editor.
2. Select Correlation Rules, and then select Add Event Pipeline Rule.
3. Right-click the new rule, and then select Wizard (Windows IDE editor only).
The Rule Configuration Wizard window appears.
4. Enter information in the following fields:
Rule Name
Enter Ping Failure--Process Correlation Rule.
Template Rule
Select this check box so that a different rule is triggered for each
originating node.
Suppress Multiple Event RCs
Select this check box because ping failure is configured in both rules. If
the root cause is a ping failure, both rules report this event to the Event
Console, but checking this flag suppresses duplicate reporting of the root
cause.
Maturity Period and Reset Period
Use the default values.
5. Click OK.

Examples: AEC Applications
Chapter 3: Improving Event Processing with Advanced Event Correlation 143
Add and Configure the Ping Failure Pipeline Item
A pipeline item must be created to identify when a ping failure occurs on a
particular node.
To add and configure the Ping Failure pipeline item
1. Expand the Ping Failure rule and select Pipeline.
2. Select Add New Pipeline Item.
3. Right-click the pipeline item, and then select Wizard (Windows IDE editor
only).
The Pipeline Item Configuration Wizard window appears.
4. In the Item Name field, enter Ping Failure.
5. Click Next.
The Event Configuration Wizard - Match Event pane appears.
6. Enter information in the following fields:
Message Template
Enter WindowsNT_Server Ping Poll Agent:Ping UP Broken Ping.
Node
Enter &(NODENAME). This ensures that service failures from a
particular node are only matched against ping failures on that node.
7. Click Next repeatedly until the Local Correlation Event pane appears.
8. Enter the following string in the Message Template field:
AEC Correlated Message: Ping Failure on &(NODENAME)
9. Click Next repeatedly until the Local Reset Event pane appears.
10. Enter the following string in the Message Template field:
AEC Reset Message: Ping Failure on &(NODENAME)
11. Click OK.

Examples: AEC Applications
144 Inside Event Management and Alert Management
Add and Configure the Process Failure Pipeline Item
A pipeline item must be created to identify when a process failure occurs on a
particular node.
To add and configure the Process Failure pipeline item
1. Expand the Ping Failure rule, and then select Pipeline.
2. Select Add New Pipeline Item.
3. Right-click the pipeline item, and then select Wizard (Windows IDE editor
only).
The Pipeline Item Configuration Wizard window appears.
4. In the Item Name field, enter Process Failure.
5. Click Next.
The Event Configuration Wizard - Match Event pane appears.
6. Enter information in the following fields:
Message Template
Enter WindowsNT_Server SysAgtNT Trap
Agent:SysAgtNT;ntProcessInst Up Critical &(PROCESSNAME).
Node
Enter &(NODENAME). This ensures that service failures from a
particular node are matched against ping failures on that node only.
7. Click Next repeatedly until the Local Correlation Event pane appears.
8. Enter the following string in the Message Template field:
AEC Correlated Event: Service &(PROCESSNAME) Failure on &(NODENAME)
9. Click Next repeatedly until the Local Reset Event pane appears.

Examples: AEC Applications
Chapter 3: Improving Event Processing with Advanced Event Correlation 145
10. Enter the following string in the Message Template field:
AEC Reset Message: Service &(PROCESSMESSAGE) Failure on &(NODENAME)
The left pane of the editor should now look like this:
Resulting Messages (Multiple Rules)
Placing the pipeline item Ping Failure above Service Failure and above Process
Failure in the hierarchy ensures that a ping failure is viewed as the root cause of
a service failure or a process failure.
Therefore, if a service failure message is the only message sent from the Event
Console, AEC sends a correlated event indicating the root cause to be a service
failure. The reset message appears after the reset period ends.
If a process failure message is the only message sent from the Event Console,
AEC sends a correlated event indicating the root cause to be a process failure.
The reset message appears after the reset period ends.
If either a service failure or a process failure message and a ping failure message
are sent from the Event Console, AEC sends a correlated event indicating the
root cause to be a ping failure. The reset message appears after the reset period
ends.
When a service failure, process failure, and ping failure message are sent from
the Event Console, AEC sends a correlated event indicating the root cause to be
a ping failure. For both rules, ping failure is indicated to be the root cause.
However, since the Suppress Multiple RCs flag is TRUE, only one root cause
message is returned.
If a flood of service failure and ping failure messages are sent from the Event
Console, AEC sends a single correlated event indicating the root cause to be ping
failure. The reset message appears once. AEC does not report any other
instances of these messages.

Examples: AEC Applications
146 Inside Event Management and Alert Management
Operator Server Shutdown (Three Item Pipeline)
In an enterprise, operators routinely shut down servers. As a result, the CA NSM
Agents generate huge volumes of failure messages. However, the failures from
the system that the operator is shutting down are not problems because the
down state is a desired state.
Event Management message records log these failure messages and send
notifications. These messages cause message/action records to open
unnecessary tickets. Then service personnel rush to fix problems only to find out
that there is no problem. Also, messages are sometimes generated repeatedly,
causing multiple unnecessary responses.
This example shows how to use AEC with a desired state application to identify
true failures only. This application identifies the desired state of a service or
system.
Identify the Correlation (Three Item Pipeline)
Consider the following conditions:
■ AEC rules are set up to correlate the messages of the desired state
application using he system failure message generated by the agents.
■ If the failure is desired, that is, caused by an operator, it shows the root
cause as ―Server being taken down by Server Manager‖ message.
■ If the failure is a genuine failure then it shows the root cause as system
failure.
■ If there is a ping failure (regardless of whether it is caused by operator action
or a genuine failure), there may be many agent failure messages. These
agent failure messages are not real failures.
■ If the agent failures are reported without any ping failure or operator
message on the same system, there is a genuine agent failure.
■ Traps must be sent to the Event Console as input if the operators shut down
systems. These traps appear as messages on the Event Console. AEC reads
the messages and knows that the system or service must be stopped.
Configure the following correlation rule and pipeline items for this example:
■ Server Shutdown correlation rule
■ Operator Server Shutdown pipeline item
■ Ping Failure pipeline item
■ Agent Failure pipeline item
The following sections provide instructions on how to do this.

Examples: AEC Applications
Chapter 3: Improving Event Processing with Advanced Event Correlation 147
Add and Configure the Server Shutdown Correlation Rule
A rule must be created to contain pipeline items that identify when agent and
ping failures must be matched against an operator server shutdown message on
that particular server.
To add and configure the Server Shutdown correlation rule
1. Open a new Empty preconfigured rule, and expand Engine in the left pane of
the editor.
2. Select Correlation Rules, and then select Add Event Pipeline Rule.
3. Right-click the new rule, and then select Wizard (Windows IDE editor only).
The Rule Configuration Wizard window appears.
4. Enter information in the following fields:
Rule Name
Enter Server Shutdown.
Template Rule
Check this check box so that a different rule is triggered for each
originating node.
Maturity Period and Reset Period
Use the default values.
5. Click OK.
Add and Configure the Operator Server Shutdown Pipeline Item
A pipeline item must be created to identify when an operator server shutdown
occurs on a particular node.
To add and configure the Operator Server Shutdown pipeline item
1. Expand the Server Shutdown rule, and then select Pipeline.
2. Select Add New Pipeline Item.
3. Right-click the pipeline item, and then select Wizard (Windows IDE editor
only).
The Pipeline Item Configuration Wizard window appears.
4. In the Item Name field, enter Operator Server Shutdown.
5. Click Next.
The Event Configuration Wizard - Match Event pane appears.

Examples: AEC Applications
148 Inside Event Management and Alert Management
6. Enter information in the following fields:
Message Template
Enter ^OPR_Server_Notify: Server: &(NODENAME) UID=caunit
??/??/?? ??:??:?? ?? Change#: Msg=shutdown restart.
Node
Enter &(NODENAME). This ensures that agent failures and ping failures
from a particular server will be matched against the operator server
shutdown message on that server.
7. Click Next repeatedly until the Local Correlation Event pane appears.
8. Enter information in the following fields:
Message Template
Enter AEC Correlation Message: &PIPEDESC &(NODENAME).
Colour
Change this field to Red.
9. Click Next repeatedly until the Local Reset Event pane appears.
10. Enter information in the following fields:
Message Template
Enter AEC Reset Message: &PIPEDESC &(NODENAME).
Colour
Change this field to Green.
11. Click OK.
Add and Configure the Ping Failure Pipeline Item
A pipeline item must be created to identify when a ping failure occurs on a
particular node.
To add and configure the Ping Failure pipeline item
1. Expand the Server Shutdown rule, and then select Pipeline.
2. Select Add New Pipeline Item.
3. Right-click the pipeline item, and then select Wizard (Windows IDE editor
only).
The Pipeline Item Configuration Wizard window appears.
4. In the Item Name field, enter Ping Failure.

Examples: AEC Applications
Chapter 3: Improving Event Processing with Advanced Event Correlation 149
5. Click Next.
The Event Configuration Wizard - Match Event pane appears.
6. Enter information in the following fields:
Message Template
Enter ^WindowsNT_Server Ping Poll Agent:Ping .* Broken Ping.
Node
Enter &(NODENAME). This ensures that agent failures and ping failures
from a particular server are matched against the operator server
shutdown message in that server.
7. Click Next repeatedly until the Local Correlation Event pane appears.
8. Enter information in the following fields:
Message Template
Enter AEC Correlation Message: &PIPEDESC on &(NODENAME).
Colour
Change this field to Red.
9. Click next repeatedly until the Local Reset Event pane appears.
10. Enter information in the following fields:
Message Template
Enter AEC Reset Message: &PIPEDESC on &(NODENAME).
Colour
Change this field to Green.
11. Click OK.
Add and Configure the Agent Failure Pipeline Item
A pipeline item must be created to identify when an agent failure occurs on a
particular node.
To add and configure the Agent Failure pipeline item
1. Expand the Server Shutdown rule and select Pipeline.
2. Select Add New Pipeline Item.
3. Right-click the pipeline item, and then select Wizard (Windows IDE editor
only).
The Pipeline Item Configuration Wizard window appears.
4. In the Item Name field, enter Agent Failure.

Examples: AEC Applications
150 Inside Event Management and Alert Management
5. Click Next.
The Event Configuration Wizard - Match Event pane appears.
6. Enter information in the following fields:
Message Template
Enter ^WindowsNT_Server SysAgtNT Trap Agent:SysAgtNT NA
LINK-DOWN NT.
Node
Enter &(NODENAME). This ensures that agent failures and ping failures
from a particular server are matched against the operator server
shutdown message on that server.
7. Click Next repeatedly until the Local Correlation Event pane appears.
8. Enter information in the following fields:
Message Template
Enter AEC Correlation Message: &PIPEDESC on &(NODENAME).
Colour
Change this field to Red.
9. Click Next repeatedly until the Local Reset Event pane appears.
10. Enter information in the following fields:
Message Template
Enter AEC Reset Message: &PIPEDESC on &(NODENAME).
Colour
Change this field to Green.
11. Click OK. The left pane in the editor now appears as follows:

Examples: AEC Applications
Chapter 3: Improving Event Processing with Advanced Event Correlation 151
Resulting Messages (Three Item Pipeline)
AEC generates a correlated event indicating the root cause to be Operator Server
Shutdown. The AEC reset message appears after the reset period.
Placing the Operator Server Shutdown at the higher pipeline level ensures that it
is viewed as the root cause should it happen at the same time as a ping or agent
failure.
If the server shuts down on its own due to a power failure or some other
electronic or software failure, the Ping Failure pipeline item would be determined
as the root cause, and AEC would generate its associated Local Correlation
Event. The associated agent traps would be suppressed from the Event Console
because they are caused by the ping failure.
Lastly, AEC would generate ―AEC Correlation Message: Agent failure on XYZ‖ if
the ―WindowsNT_Server SysAgtNT Trap Agent:SysAgtNT NA LINK-DOWN NT‖
event message occurs by itself.
A separate rule instance is triggered for each node where these events occur. A
ping failure on node ABC does not correlate with an operator shutdown on node
XYZ. These events would be treated separately if they occur.
Operator Service Shutdown (Multiple Tokens)
This example expands on the previous one. The last example showed how to
configure AEC to ignore unwanted messages when operators shut down servers.
This example also deals with a desired down state, except that an operator
brings down services rather than a server. This application must match two
things: the service name and the server name.
That is, if an operator brought down one service on a server, this should
correlate with the service failure message on the same service and server.
Identify the Correlation (Multiple Tokens)
Configure the following correlation rule and pipeline items for this example:
■ Service Shutdown correlation rule
■ Operator Service Shutdown pipeline item
■ Service Failure pipeline item
The following sections provide instructions on how to do this.

Examples: AEC Applications
152 Inside Event Management and Alert Management
Add and Configure the Service Shutdown Correlation Rule
A rule must be created to ensure that service failures from a particular server will
be matched against the operator service shutdown message on that server.
To add and configure the Service Shutdown correlation rule
1. Open a new Empty preconfigure rule, and expand Engine in the left pane of
the editor.
2. Select Correlation Rules, and then select Add Event Pipeline Rule.
3. Right-click the new rule, and then select Wizard (Windows IDE editor only).
The Rule Configuration Wizard window appears.
4. Enter information in the following fields:
Rule Name
Enter Service Shutdown.
Template Rule
Check this check box so that a different rule is triggered for each
originating node.
Maturity Period and Reset Period
Use the default values.
5. Click OK.
Add and Configure the Operator Service Shutdown Pipeline Item
A pipeline item must be created to identify when an operator has shut down a
service.
To add and configure the Operator Service Shutdown pipeline item
1. Expand the Service Shutdown rule and select Pipeline.
2. Select Add New Pipeline Item.
3. Right-click the pipeline item, and then select Wizard (Windows IDE editor
only).
The Pipeline Item Configuration Wizard window appears.
4. In the Item Name field, enter Operator Service Shutdown.
5. Click Next.
The Event Configuration Wizard - Match Event pane appears.

Examples: AEC Applications
Chapter 3: Improving Event Processing with Advanced Event Correlation 153
6. Enter information in the following fields:
Message Template
Enter ^OPR_Service_Notify: Service: &(SERVICENAME) Server:
.* has been Stopped.
Node
Enter &(NODENAME). This ensures that service failures from a
particular server will be matched against the operator service shutdown
message on that server.
7. Click Next repeatedly until the Local Correlation Event pane appears.
8. Enter information in the following fields:
Message Template
Enter AEC Correlation Message: &PIPEDESC &(NODENAME)
service &(SERVICENAME) has been stopped.
Colour
Change this field to Red.
9. Click Next repeatedly until the Local Reset Event pane appears.
10. Enter information in the following fields:
Message Template
Enter AEC Reset Message: &PIPEDESC on &(NODENAME) service
&(SERVICENAME) has been stopped.
Colour
Change this field to Blue.
11. Click OK.
Add and Configure the Service Failure Pipeline Item
A pipeline item must be created to identify when a service has failed.
To add and configure the Service Failure pipeline item
1. Expand the Service Shutdown rule and select Pipeline.
2. Select Add New Pipeline Item.
3. Right-click the pipeline item, and then select Wizard (Windows IDE editor
only).
The Pipeline Item Configuration Wizard window appears.
4. In the Item Name field, enter Service Failure.
5. Click Next.
The Event Configuration Wizard - Match Event pane appears.

Examples: AEC Applications
154 Inside Event Management and Alert Management
6. Enter information in the following fields:
Message Template
Enter ^WindowsNT_Server SysAgtNT .*
Agent:SysAgtNT:ntServiceInst .* Critical &(SERVICENAME).
Node
Enter &(NODENAME). This ensures that a service failure from a
particular server is matched against the operator service shutdown
message on that server.
7. Click Next repeatedly until the Local Correlation Event pane appears.
8. Enter information in the following fields:
Message Template
Enter AEC Correlation Message: &PIPEDESC on &(NODENAME).
Colour
Change this field to Red.
9. Click Next repeatedly until the Local Reset Event pane appears.
10. Enter information in the following fields:
Message Template
Enter AEC Reset Message: &PIPEDESC &3 &(NODENAME) service
&(SERVICENAME) is down.
Colour
Change this field to Blue.
11. Click OK.
The left pane in the editor now appears as follows:

Examples: AEC Applications
Chapter 3: Improving Event Processing with Advanced Event Correlation 155
Resulting Messages (Multiple Tokens)
Placing the Operator Service Shutdown at the higher pipeline level ensures that
it will be viewed as the root cause if it happens at the same time as a service
failure event.
If a service failure is unforeseen, the System Agent would generate a trap event
for it, and AEC would generate the associated Local Correlation Event.
Separate rule instances are triggered for each node where these events occur
and for each service that fails. The Alerter service failure on node ABC would
trigger a distinctly separate rule instance from the MSSQLSERVER service on the
same node. Likewise, the MSSQLSERVER service on nodes ABC and XYZ are
considered separately.


Chapter 4: Monitoring Your Enterprise with the Alert Management System 157
Chapter 4: Monitoring Your Enterprise
with the Alert Management System
This section contains the following topics:
Alert Management System (see page 157)
What Are Alerts? (see page 158)
Alert Sources (see page 158)
Life Cycle of an Alert (see page 159)
Alert Management Configuration (see page 159)
How Alert Management Works (see page 162)
Define Alert Policy (see page 163)
Define EMS and AEC Policy for Alerts (see page 185)
Alerts in the Management Command Center (see page 191)
Maintain Alert Policy (see page 196)
Integrate with Unicenter Service Desk (see page 200)
Diagnostics and Troubleshooting (see page 218)
Alert Management System
The Alert Management System (AMS) is a tool for organizing and tracking the
most important events in an enterprise or a logical segment of an enterprise. It
lets you focus on and manage the highest severity IT events.
With AMS you can do the following:
■ Specify the situations that create alerts, and define alert policies.
■ View and manage alerts in multiple panes of the Management Command
Center (Unicenter MCC).
■ Link to Unicenter Service Desk, which is a customer support application that
manages calls and IT assets, tracks problem resolution, and shares
corporate knowledge.
■ Link to eHealth Suite, which delivers comprehensive fault, availability, and
performance management across complex, heterogeneous systems and
application environments. eHealth collects a wide variety of data from your
network infrastructure to generate alarms and reports.
Note: The examples in this guide focus on the Unicenter MCC interface. You can
also perform some of the same actions with Unicenter Management Portal.
Unicenter MP provides a framework for accessing enterprise management data,
but not for generating the data. For example, you can view and acknowledge
events, but not define message records and actions.

What Are Alerts?
158 Inside Event Management and Alert Management
What Are Alerts?
Alerts are sophisticated messages that provide important or critical information
about the state of your enterprise. They are generated by Event Management
policy, and although they are functionally similar to Event Management held
messages, they can be organized in more complex ways and provide the
following powerful capabilities to resolve problems:
■ Alerts have many properties related to their importance, display
characteristics, age, acknowledgement, and more. These properties let you
organize and view alerts in ways that benefit your enterprise.
■ Alerts provide automated actions and menu actions in context to the type of
problem the alert represents, thus helping you respond rapidly.
■ Alerts are automatically linked to affected WorldView objects and optionally
linked to Service Desk requests or eHealth alarms to simplify tracking and
resolving situations.
■ Alerts can be annotated, and each time-stamped entry is locked after it is
added to ensure the integrity of your operations.
■ Alerts can be automatically consolidated into a single parent alert when they
are similar or identical. Consolidation eliminates confusion and console
clutter when the same problem is reported in multiple similar alerts.
■ Alerts are automatically escalated based on several of their properties to
ensure that they receive attention quickly. Escalation can increase alert
urgency, transfer alerts to another queue, set alarms, send notifications, and
more.
■ Alerts have a detailed audit trail that includes information about automated
and manual actions that affect them or are carried out on their behalf so that
you always know the actions taken to resolve them.
Alert Sources
Alerts are created when Event Management System (EMS) message policy or
Advanced Event Correlation (AEC) policy evaluates one or more console
messages and determines that alerts should be created. Event Management
creates alerts based on your definition of the critical situations that require
special attention. You identify the events that cause alerts by:
■ Defining Event Management message actions that create alerts.
■ Defining AEC policies that generate correlation events as alerts.

Life Cycle of an Alert
Chapter 4: Monitoring Your Enterprise with the Alert Management System 159
Life Cycle of an Alert
A typical alert goes through the following stages:
1. A serious situation occurs. Examples are an important server going down or
degraded system performance.
2. Event message policy or AEC correlation policy determines that the situation
is serious enough to warrant alert creation.
3. Optional, predefined actions may execute automatically based on EMS, AEC,
or AMS policies.
4. The alert is assigned to a queue and appears in a Unicenter MCC console on
a technician's desktop monitor.
5. A technician acknowledges the alert and starts to resolve the situation.
6. An alert may be escalated based on factors like the age of the alert, the
length of time in the queue, and the time since acknowledgement. Escalation
causes actions like setting an alarm, opening a ServiceDesk request, running
a command, changing the alert's display on the Unicenter MCC, or sending a
notification.
7. The situation that caused the alert is resolved, and the alert is closed.
8. After being closed for a certain length of time, the alert is archived.
Alert Management Configuration
Event Agents, Event Managers, and AEC can all be configured to generate alerts;
therefore, you have a great amount of flexibility in setting up AMS. It is
important to understand your deployment options and to carefully consider the
best way to configure and deploy AMS and the various possible alert sources.
These are important factors to consider:
■ An Alert Manager must reside on a node that has an Event Manager or Event
Agent to ensure that the Alert Manager is properly monitored.
■ Alert Managers differ from Event Managers in that they cannot forward alerts
to other Alert Managers, so AMS is not designed to be hierarchical but should
be the end point for the critical events in your enterprise. You can still choose
to have multiple Alert Managers, however, if your organization has
semi-autonomous geographic, functional, or logical divisions. Management
domains or Distributed Intelligence Architecture (DIA) zones may also be a
consideration.

Alert Management Configuration
160 Inside Event Management and Alert Management
The following illustration shows several AMS deployment options.
Event Agent, Event and Alert Manager
The middle of the illustration shows an Event Agent node and above it an AMS
Manager node. Event Agents and Managers can create alerts, and in this
example both nodes have Event message policy for alert creation. In most cases,
you will probably want your EMS and AEC policy to create alerts on your Event
Manager nodes to make the deployment and management of AMS policy easier,
but there may be situations where Event Agents are configured to create their
own alerts. You should design and deploy your policy carefully so that you do not
create redundant or false alerts. In this example, the Event Agent determines
which events to forward to the manager node and which of its local events should
prompt alert creation. The alerts created here are forwarded to the Alert
Manager on the node above.
The Event Manager node also has AEC policy, and can correlate and perform root
cause analysis on the forwarded events to determine which should become
alerts. For example, a device that cannot be pinged because of a network outage
may also have many associated agent failure messages. AEC can help to
determine that the key event in this scenario is the ping failure, not the agent
failures, so only the ping failure will result in an alert. The Event message policy
on this node for alert creation is more generic than that on the Event Agent below
it, and may apply to many event sources. The policy creates additional alerts
that are not specific to the Event Agent node's purpose.

Alert Management Configuration
Chapter 4: Monitoring Your Enterprise with the Alert Management System 161
Multiple Event Agents with Multiple Event Managers
This scenario expands on the previous one by including the nodes shown on the
right of the illustration. Several Event Agents forward their events to an Event
Manager. This manager is a middleman that has message policy (and optionally
AEC policy) to create alerts, and it forwards them and selected events to the
Event and Alert Manager with Unicenter MCC and AEC. As in the previous
scenario, this manager may create additional alerts relevant to these nodes
using more generic AEC and EMS policy.
Multiple Agents, DSM, Event Agent, Event Manager
This scenario is shown on the left of the illustration and adds an Agent
Technology Distributed State Machine (DSM) and an Event Agent to the
environment. Several Agent Technology agents on managed devices report to
this DSM, which then forwards related events to an Event Agent with AEC. This
agent correlates events and forwards AEC output events and other selected
events to the Event and Alert Manager node shown in the center of the
illustration. The manager has a full installation of Unicenter MCC, AMS, AEC, and
EMS. Alerts are created here.
An alternative configuration could have Event Management policy and AEC policy
create agent-specific alerts on this Event Agent node and forward them to the
Event and Alert Manager node. A decision to do this should be based on factors
like ease of policy management, system performance, and so on.
Event Manager and Alert Manager
This scenario is not shown in the diagram. An Alert Manager node sits above one
or more Event Managers. The Event Managers contain Event and AEC policy to
create alerts, which are forwarded to the Alert Manager.
High Availability
AMS supports fault tolerance through HAS. For more information, see the
appendix "Making Components Cluster Aware and Highly Available" in the
Implementation Guide.

How Alert Management Works
162 Inside Event Management and Alert Management
How Alert Management Works
The Alert Management System (AMS) works with Event Management System
(EMS) and Advanced Event Correlation (AEC) to capture the most important
events so that you can respond to them quickly. Alerts are displayed on the
Management Command Center (Unicenter MCC).
This is how AMS works:
■ Alert profiles assign properties to alerts when they are created, escalated,
transferred, and so on. The first thing you should do is define the objects that
assign the properties. These objects include:
– Alert classes, which organize alerts and supply most of their initial
properties. Classes specify which of the other profiles are associated
with alerts.
– Alert queues, which specify how alerts are grouped for viewing on the
Unicenter MCC. Alert queues can be for departments like Accounting,
Research and Development, and Marketing. Alert queues can also be for
your WorldView business processes. Alerts in each queue are shown in
separate viewers on the Unicenter MCC.
– Alert Global Definition, which specifies properties that apply to all alerts
and to the entire Alert Management System.
– Display attributes, which specify how alerts look on the Management
Command Center. Examples of attribute properties are text color,
blinking text, and more.
■ Event Management message policy determines the conditions that prompt
alert creation. Message records and actions for alerts use the ALERT
message action. You assign initial properties for alerts by indicating the alert
class in the message action.
Note: Alerts should be a small subset of the events that occur. They should
represent only events that require human intervention or provide
information critical to continued normal operations. We recommend no more
than 1,000 alerts per day. There are two reasons for this. First, if few alerts
are generated, the operations staff can focus more easily on what is
important. Second, AMS is a complex system and each alert consumes more
computing resources than other events. By carefully designing your AMS
configuration and policy, you can help ensure that you get the most benefit
from AMS.
■ Advanced Event Correlation can generate correlation alerts directly into the
Management Command Center. The alert class is specified at the engine
level of the policy and each rule can enable or disable alert generation to that
class.

Define Alert Policy
Chapter 4: Monitoring Your Enterprise with the Alert Management System 163
■ Alerts are shown by alert queue or managed object in the Management
Command Center:
– The queues you have defined are listed in the left pane when Alerts is
chosen from the drop-down list above that pane. When you select a
queue in the left pane, the alerts in that queue are shown in the right
pane. You can open multiple queues in the right pane, and lock them in
place as you move to other areas of the Unicenter MCC.
– A bar chart of alert statistics is displayed when you right-click a node in
the left pane and choose Viewers Status. The chart shows the total
number of alerts for the node broken down by queue and priority.
– Alerts for a managed object in the Topology view are displayed when you
right-click the object and choose Alert Viewer from the context menu.
Periodically, an association daemon polls the alert table for unassociated
alerts and links them to their origin node.
– The context menu that opens when you right-click individual alerts in the
right pane lets you acknowledge alerts, view their properties, transfer
them to another queue, and more.
■ AMS provides a connection to Unicenter Service Desk, which is a customer
support application that manages calls, tracks problem resolution, shares
corporate knowledge, and manages IT assets. You can open and resolve
Service Desk trouble tickets without leaving the Unicenter MCC. Besides
viewing trouble tickets from AMS, you can also view them for managed
objects in the Topology view.
■ AMS also integrates with eHealth Suite, which delivers fault, availability, and
performance management across heterogeneous systems and application
environments. Based on policy that you deploy, eHealth alarms and
netHealth exceptions create alerts automatically. When an alert or alarm is
closed by either AMS or eHealth, the corresponding alert or alarm is also
closed. You can display eHealth At-a-Glance and Alarm Detail reports for a
selected alert from the context menu or the My Actions menu in the
Unicenter MCC.
Define Alert Policy
Before you can view and manage alerts in the Management Command Center,
you need to define policies that control how alerts are displayed.
Note: The following policies are listed in the order you should define them, not in
order of their importance. Most policies are interrelated and reference other
policies that should already exist. The most important policies, alert queues and
alert classes, are at the end of the list.

Define Alert Policy
164 Inside Event Management and Alert Management
Display Attributes
Specify the appearance of alerts in the Unicenter MCC.
User Actions
(Optional) Run scripts, executables, and commands in response to alerts or
manually from the context menu in the Unicenter MCC.
Action Menus
(Optional) Arrange user actions into submenus for use on the context menu.
Escalation Policies
(Optional) Increase the attention an alert receives.
Alert Global Definitions
Assign properties to all alerts and specify configuration settings for all of
AMS.
User Data
(Optional) Add site-specific information such as a customer name to an alert.
The information is populated at alert creation time from a user exit function.
Alert Queues
Group similar alerts. AMS organizes alerts by the queues that you define,
and the Unicenter MCC displays alerts by queue in multiple panes.
Alert Classes
Give alerts their initial properties.
Note: If AMS does not let you delete a previously defined policy, make sure that
you first delete or modify anything that uses that policy. For example, some open
or closed alerts in the MDB may belong to a class, reference a display attribute,
or are in a queue that you are trying to delete. You must either archive
(caamsarchive command) or purge (caamspurge command) those alerts. See
Archive Alerts (see page 197) and Purge Alerts (see page 197).
You also cannot delete a queue if it is the initial queue for a class that exists.
Likewise, you cannot delete an escalation policy that is defined for an existing
queue. You must modify the class or queue.

Define Alert Policy
Chapter 4: Monitoring Your Enterprise with the Alert Management System 165
Display Attributes
Display attributes specify how alerts appear on the Management Command
Center. Available attributes include foreground and background color, blinking
text, reverse video, and more. Display attributes give alerts a consistent look
and help limit possible display combinations.
An example of a display attribute profile is called High Priority with foreground
color that is bold, red, and blinking. Another example is a Low Priority profile with
black text and a white background.
When you create an alert class, you assign a predefined display profile to it. This
can make alerts of each class visually distinctive from alerts of other classes in
the Unicenter MCC. You can also apply different attributes automatically through
escalation policies.
To define a display attribute profile
1. Choose Enterprise Management from the drop-down list above the left pane
of the Management Command Center. Open a server, and expand Alert
Management.
The left pane displays a list of the AMS profiles you can define.
2. Double-click Display Attributes.
The Display Attributes Summary window opens in the right pane.
3. Click the New button on the toolbar.

Define Alert Policy
166 Inside Event Management and Alert Management
The Display Attribute - Detail window opens.
4. Select a foreground or background color:
a. Click select color.
The Color Selection dialog opens.
b. Click a color, and click OK.
The foreground or background color changes.
5. Enter an attribute name and description. Select any other attributes, and
click OK.
The dialog closes and the new display attribute profile is defined.
6. Specify how to use the display attributes:
■ To apply the attributes to all alerts in a class, enter the profile name on
the Alert Class window Appearance page. See Define Alert Classes.
■ To apply the attributes to alerts that are escalated, enter the profile
name on the Escalation Policy Editor. See Define Escalation Policies.
The display attributes are applied to alerts.

Define Alert Policy
Chapter 4: Monitoring Your Enterprise with the Alert Management System 167
User Actions
User actions are designed to run commands automatically in response to alerts,
and manually from the context menu in the Management Command Center. User
actions can run scripts, executables, commands, and so on. User actions are
optional.
The following are examples of common user actions:
■ Opening a telnet session to the machine originating the alert.
■ Opening a help desk issue for the problem that the alert is reporting.
■ Running a query.
■ Starting a database tool when an alert reports a database problem.
■ Running a custom application to correct a problem, like archiving a file.
If you need to pass values from the originating alert, choose from a list of
parameter tokens and include them with the command. When the action is
called, the parameters are expanded with the values of the alert properties that
they represent. The parameter tokens are described in the Unicenter MCC help.
Note: If you want an ampersand (&) to appear as & in a URL, use ̂ as an escape
character. Otherwise, AMS interprets the & and the text following it as a variable.
An example is:
iexplore http://anysite.com/servlet^&view%27
Note: A user ID must have permission to run User Actions with oprcmd or
automatically by class or escalation policy. On Windows, add the ID SYSTEM to
the variable CA_OPR_AUTH_LIST (Users authorized to issue commands). On
UNIX/Linux, add the user ID to the file
$CAIGLBL0000/opr/config/hostname/actnode.prf. For information about the
variable and the file, see the online CA Reference.
To define a user action profile
1. Choose Enterprise Management from the drop-down list above the left pane
of the Management Command Center. Open a server, and expand Alert
Management.
The left pane displays a list of the AMS profiles you can define.
2. Double-click User Actions.
The User Actions Summary window opens.

Define Alert Policy
168 Inside Event Management and Alert Management
3. Click the New button on the toolbar.
The User Action - Detail window opens.
Note: If you configure AMS to run user actions automatically, you must run
the actions on the AMS manager node (User Action - Detail, Target/type
field). Actions can be run automatically when certain alerts are escalated or
when alerts of a specific class are created, acknowledged, transferred, or
closed.
4. Enter a label, and a command with its path. Fill in the other fields as needed,
and click OK.
Note 1: The script, application, or library must be installed and either
explicitly defined with a path or in the system path.
Note 2: The choices in the Available parameters drop-down list are
explained in the Management Command Center help.
The user action is defined.
5. Specify how the user action is run:
■ To run the user action for all alerts in a class, enter the profile name on
the Alert Class window, Actions page. Commands can run automatically
when alerts in the class are created, acknowledged, transferred to
another alert queue, and closed. See Define Alert Classes.
■ To run the user action when alerts are escalated, enter the profile name
on the Escalation Policy Editor. See Define Escalation Policies.
■ To run the user action manually, enter the profile name on the Action
Menu window. This window adds the command to the context menu in
the right pane of the Unicenter MCC. See Define Action Menus.
The user action is applied to alerts or the context menu.

Define Alert Policy
Chapter 4: Monitoring Your Enterprise with the Alert Management System 169
Action Menus
Action menus are custom submenus for the context menu in the Management
Command Center. These submenus list commands that you defined as user
actions. By customizing the context menu, you can run commands quickly,
without having to open a command prompt.
Note: If you did not define user actions, you do not need action menus.
The context menu on the Unicenter MCC can have up to three custom submenus:
■ Global submenu, which you specify as part of the alert global definition. The
global submenu appears first on the context menu, and is present for all
alerts.
■ Class submenu, which you specify as part of an alert class profile. The class
submenu appears after the global submenu, but only when you right-click
alerts in that class.
■ Queue submenu, which you specify as part of an alert queue profile. The
queue submenu appears after the class submenu, but only when you
right-click alerts in that queue.
Note: You can also define commands for the context menu by using the My
Actions menu in the Unicenter MCC. Those commands appear at the bottom of
the context menu, and are unique to each Unicenter MCC client installation.
To define action menus
1. Choose Enterprise Management from the drop-down list above the left pane
of the Management Command Center. Open a server, and expand Alert
Management.
The left pane displays a list of the AMS profiles you can define.
2. Double-click Action Menus.
The Action Menus Summary window opens.

Define Alert Policy
170 Inside Event Management and Alert Management
3. Click the New button on the toolbar.
The Action Menu – Detail window opens.
4. Add a menu name and optional description. Select items in the Available
user actions/menus area and click Add.
The actions or menus are moved to the right.
5. Click Move up or Move down to rearrange items in the Selected user
actions/menus area. Click OK.
The window closes and the submenu is defined.
6. Add the submenu to the context menu on the Management Command
Center.
■ To add it as the global submenu, use the Menu field on the Alert Global
Definition window. See Define Alert Global Definitions.
■ To add it as the class submenu, use the Menu field on the Alert Class
window Appearance page. See Define Alert Classes.
■ To add it as the queue submenu, use the Menu field on the Alert Queue
Detail window. See Define Alert Queues.
The menu is added to the context menu.

Define Alert Policy
Chapter 4: Monitoring Your Enterprise with the Alert Management System 171
Escalation Policies
Escalation increases the attention that an alert receives. You specify the
situations that cause escalation, like age of the alert, time since
acknowledgement, and number of duplicate alerts. You also specify what should
be done when escalation occurs, like running a command, changing the
appearance of the alert on the Management Command Center, and increasing
the urgency of the alert.
You can assign sub-policies to an escalation policy. Sub-policies specify the
situations that trigger escalation and the actions to perform when those
situations for occur. For example, one escalation sub-policy may specify that
when an alert is not acknowledged, its background color should change on the
Management Command Center. Another sub-policy may specify that when an
alert is 20 minutes old, a notification is sent.
Escalation policies can check for one or more of the following situations:
■ Age of alert (hours and minutes).
■ Time in the queue (hours and minutes).
■ Time since acknowledgement (hours and minutes).
■ Urgency.
■ Number of similar alerts.
■ If alerts are not acknowledged.
■ If alerts are alarmed. Alarmed alerts attract more attention than other alerts
because they are displayed in a dialog that pops up when the alarms arrive
in the Unicenter MCC.
If the conditions are met, escalation policies can cause the following actions:
■ Run a command defined with User Actions.
■ Change the appearance of alerts in the Unicenter MCC by assigning different
Display Attributes.
■ Transfer to a different alert queue. See Alert Queues.
■ Set urgency or increment it. Urgency indicates how soon a technician or
operator should try to resolve the situation that caused an alert.
■ Send a notification using Unicenter Notification Services.
■ Set an alarm.
■ Create a Service Desk request.

Define Alert Policy
172 Inside Event Management and Alert Management
Escalations are scheduled. That is, AMS does not continuously scan open alerts
to determine which ones meet escalation criteria. That would be inefficient.
Instead, each alert has its next escalation scheduled soon after it is created,
modified, or escalated. Therefore, if you modify an escalation policy, the
modification does not affect alerts that have been scheduled for escalation until
after the escalation occurs.
You can assign escalation policy at three levels: globally, by queue, and by class.
Queue policy takes precedence over class policy, which takes precedence over
global policy.
To define escalation policies
1. Choose Enterprise Management from the drop-down list above the left pane
of the Management Command Center. Open a server, and expand Alert
Management.
The left pane displays a list of the AMS profiles you can define.
2. Double-click Escalation Policies.
The Escalation Policies Summary window opens.
3. Click the New button on the toolbar.
The Escalation Policy - Detail window opens.

Define Alert Policy
Chapter 4: Monitoring Your Enterprise with the Alert Management System 173
4. Enter an escalation policy name and description, and click the New button.
The Escalation Policy Editor opens.
Note: The Escalation Policy Editor lets you configure AMS to run a user
action automatically when alerts are escalated. The action must run on the
AMS manager node (User Action - Detail, Target/type field).
5. Enter information in the fields and click OK.
The Escalation Policy - Detail window reopens, and the sub-policy you just
defined appears in the list.
6. (Optional) Add other sub-policies by clicking New and entering information in
the Escalation Policy Editor. Click OK several times.
The escalation policy is defined.
7. Specify how to use the escalation policy:
■ To apply the escalation policy to all alerts, enter the policy name on the
Alert Global Definition window. See Define Alert Global Definitions.
■ To apply the escalation policy to all alerts in a queue, enter the policy
name on the Alert Queue - Detail window. See Define Alert Queues.
■ To apply the escalation policy to all alerts in a class, enter the policy
name on the Alert Class window Limits page. See Define Alert Classes.
The escalation policy is applied to the alerts.

Define Alert Policy
174 Inside Event Management and Alert Management
Alert Global Definition
The alert global definition specifies properties that apply to all alerts and to the
entire Alert Management System. When you define the alert global definition,
you can also specify site-specific information (User Data) to add to all alerts.
Note: You can override some of these global properties by applying the same
properties to a queue or a class.
You can specify the following global settings for all alerts:
■ Escalation policy. Escalation increases the attention that an alert receives.
You specify the situations that cause escalation, like age of the alert, time
since acknowledgement, and number of duplicate alerts. You also specify
what should be done when escalation occurs, like running a command,
changing the appearance of the alert on the Management Command Center,
and increasing the urgency of the alert.
■ User data, which is site-specific information that is added to an alert.
Examples of user data are customer name, contact information, location of a
server, hardware owner, and so on. When an alert is created, a user exit
function attaches the user data. All alert properties are available to the exit
function to determine the content of the user data.
You define user data in another window that you open from the container on
the Alert Global Definition - Detail. The callout name refers to a DLL or
shared object. The procedure entry point identifies the process or function
name of the callout. For maximum performance, leave these fields blank if
you are not using the User Data feature.
Unicenter attempts to load the procedure before it creates an alert. If
successful, AMS calls the procedure. When it returns from the procedure,
AMS creates an alert with your data.

Define Alert Policy
Chapter 4: Monitoring Your Enterprise with the Alert Management System 175
■ Submenu that appears on the Unicenter MCC context menu for every alert,
regardless of queue or class. You define this menu with Action Menus, and
you define the commands on this submenu with User Actions.
■ Maximum and minimum impact and urgency values for AMS. The highest
value is 1.
– Impact indicates how much an event affects your business. A
consideration in determining the level of impact is how many users are
inconvenienced by a situation.
– Urgency indicates how soon a technician or operator should try to
resolve the situation that caused an alert. Because a situation can
become more urgent or less urgent as time passes, you can change the
urgency manually or with escalation policies after an alert is generated.
Note: You can order alerts in the Unicenter MCC in a meaningful way based
on the combination of urgency and impact. Alerts with high urgency and high
impact are at the top of the queue, alerts with low urgency and low impact
are at the bottom, and alerts with mixed urgency and impact are in between.
For example, a non-functioning printer in the R & D department with low
urgency and high impact will be below a finance department server with high
urgency and medium impact.
■ Information for accessing Unicenter Service Desk. URI is the Uniform
Resource Identifier of the Service Desk web service. This is the address of
the web service on your primary Service Desk server. The default for Service
Desk 6.0 is http://server/usd_ws/usd_ws.asmx. The default for Service
Desk r11 is http://servername/axis/services/USD_WebServiceSoap.
Note: If the Service Desk web service is hosted on a secure web server,
indicated by "https" in the URI, you must import the Service Desk server's
SSL certificate to the server hosting AMS. See Install the Service Desk SSL
Certificate later in this chapter.
■ Nodes where global properties are applied. These are nodes that have Event
Management or an Event Management agent installed and that you have
enabled for Alert Management. The Alert Management node will produce
error events in the console log if a node in the Selected nodes list does not
respond to requests to forward alerts.
Note: To add global properties to remote nodes, see Make Remote Nodes
Available to the Alert Global Definition later in this chapter.
■ WorldView repositories that are linked to Alert Management. When you
right-click a managed object in the Topology view and choose Viewers
Alerts, you can see alerts for that object.

Define Alert Policy
176 Inside Event Management and Alert Management
To define the alert global definition
1. Choose Enterprise Management from the drop-down list above the left pane
of the Management Command Center. Open a server, and expand Alert
Management.
The left pane displays a list of the AMS profiles you can define.
2. Double-click Alert Global Definitions.
The Alert Global Definition - Detail window opens.
3. (Optional) Add site-specific information to alerts. Follow the instructions in
the procedure Define User Data.
The site-specific information is defined.
4. Enter information in the remaining fields, and click OK.
The alert global definition is defined.
Make Remote Nodes Available to the Alert Global Definition
If you want to apply global properties to remote nodes, you must make the
nodes available to CA NSM.
On Windows
To make remote nodes available on Windows, use the Enterprise Management
Connection Manager.
On UNIX/Linux
To make remote nodes available on UNIX/Linux
1. Navigate to the directory that contains the file ccirmtd.prf:
cd $CAIGLBL0000/cci/config/servername
The directory changes.
2. Add the following line to ccirmtd.prf using a text editor, and save the file.
REMOTE = nodename1 nodename1 32768 startup
Note: To add more than one node, repeat this line for each additional node
name.
3. Stop and restart CA NSM by entering the following commands:
unishutdown all
unistart all
The Alert Global Definition - Detail window now displays the remote nodes in
the Available nodes area.

Define Alert Policy
Chapter 4: Monitoring Your Enterprise with the Alert Management System 177
User Data
User data is site-specific information that is added to an alert. Examples of user
data are customer name, contact information, location of a server, hardware
owner, and so on. When an alert is created, a user exit function attaches the user
data. All alert properties are available to the exit function to determine the
content of the user data.
The Management Command Center has columns that display the user data for
individual alerts.
To define site-specific information
1. Open the file caamscoapi.h on the installation DVD. Read about the callout
binding Application Programming Interface (API), which describes the
functions that query alert properties and provide site-specific information.
Note: Use a library that can be dynamically loaded. On Windows, it is a
dynamic link library (DLL). On UNIX/Linux, it is a shared object.
2. Create a procedure (entry point or function) in the library that conforms to
the CAAMS_CB_RTN type defined in the sample source code. Call GetRtn and
SetRtn to perform your customization.
3. Choose Enterprise Management from the drop-down list above the left pane
of the Management Command Center. Open a server, and expand Alert
Management.
The left pane displays a list of the AMS profiles you can define.
4. Double-click Alert Global Definitions.
The Alert Global Definition - Detail window opens.

Define Alert Policy
178 Inside Event Management and Alert Management
5. Click the New button in the User Data container on the right side of the
window.
The User Data - Detail window opens.
6. Enter information in the fields and click OK.
Note: The callout is invoked before an alert is created and can slow
processing. Use it only when necessary.
The User Data - Detail window closes, and the Alert Global Definition - Detail
window reappears.
7. Register the callout library and procedure entry point in the Callout
DLL::PROC fields. Click OK.
The Alert Global Definition - Detail window closes and the user data is
defined.
Alert Queues
Alert queues are groups of similar alerts. Queues are usually based on role,
function, department, geographical location, or other category that is
meaningful to your enterprise. For example, your queues may be for
departments like Accounting, Finance, and Research and Development. AMS
organizes alerts by the queues that you define, and the Management Command
Center displays alerts for each queue separately in the right pane.
To define alert queues
1. Choose Enterprise Management from the drop-down list above the left pane
of the Management Command Center. Open a server, and expand Alert
Management.
The left pane displays a list of the AMS profiles you can define.
2. Double-click Alert Queues.
The Alert Queues Summary window opens.

Define Alert Policy
Chapter 4: Monitoring Your Enterprise with the Alert Management System 179
3. Click the New button on the toolbar.
The Alert Queue - Detail window opens.
4. Enter information in the fields and click OK.
An alert queue is defined.
5. Apply the queue to a class using the Alert Class - Detail window.
The queue is applied to a class.
Alert Classes
Alert classes organize alerts and specify their initial properties. Classes are
groups of alert profiles like queue, escalation policy, and display attributes.
Classes make it easy to define alerts because properties are automatically given
to alerts in each class. You do not have to specify all alert properties manually.
Classes tie everything together. Besides linking alerts to the other profiles, they
also specify other properties, including:
Impact
Indicates how much an event affects your business.
Urgency
Indicates how soon a technician or operator should try to resolve the
situation that caused an alert. The highest urgency is 1.
Expiration date
Indicates when alerts in the class are no longer generated.
Calendar
Controls the days and times when alerts in the class can be created.

Define Alert Policy
180 Inside Event Management and Alert Management
Consolidation
Groups alerts that have the same class, queue, node of origin, and alert text.
Consolidated alerts appear on the Management Command Center as one
alert that has a number indicating how many alerts are grouped together.
Also, if the alert creates a Service Desk request, only one request is opened.
Consolidation occurs when you enable consolidation on the Alert Class -
Detail, Limits page, and specify alert text. Alert text is a short description
that identifies similar alerts. Specify alert text on the Message Record Action
- Detail window or New Event Alert Policy window (shown in Define Alert
Classes). For more information about alert text, see Message Policy for
Alerts.
Create, Acknowledge, Transfer, and Close Actions
Specifies user actions (commands) to run when alerts in the class are
created, acknowledged, transferred, and closed. These are actions that you
defined with the User Actions feature of AMS.
URL and Parameters
Lets you transmit the alert information to a website. For example, if the URL
is the address of a knowledge base, the alert ID could take you to
information about resolving that type of alert. If the website is a support
center, open issues could be updated with alert status such as whether the
alert has been acknowledged.
Message Policies
Lets you define new message policies for alerts in this class quickly.
AEC Policies
Lets you define AEC correlation policies for alerts in this class.

Define Alert Policy
Chapter 4: Monitoring Your Enterprise with the Alert Management System 181
To define alert classes
1. Choose Enterprise Management from the drop-down list above the left pane
of the Management Command Center. Open a server, and expand Alert
Management.
The left pane displays a list of the AMS profiles you can define.
2. Double-click Alert Classes.
The Alert Classes Summary window opens.
3. Click the New button on the toolbar.
The Alert Class - Detail window opens with the focus on the Main page.

Define Alert Policy
182 Inside Event Management and Alert Management
4. Enter information into the fields.
Note: Fields on the Main page are required. Fields on the other pages are
optional. Classes receive the default values for any properties you omit.
The Limits, Appearance, and Actions pages are shown following:

Define Alert Policy
Chapter 4: Monitoring Your Enterprise with the Alert Management System 183
Note: The Alert Class - Detail, Actions page lets you configure AMS to run
user actions automatically when alerts in this class are created,
acknowledged, transferred, or closed. These actions must run the on the
AMS manager node (User Action - Detail, Target/type field).
5. (Optional) Create a new alert from the Message Policies page:

Define Alert Policy
184 Inside Event Management and Alert Management
a. Choose File, Save As.
The class is saved in the MDB.
b. Click New.
The New Event Alert Policy window opens.
c. Enter information in the fields and click OK.
The window closes.
6. (Optional) Click Open on the Message Policies page.
The Message Record - Detail opens so that you can add more information to
the new message policy you just created.
7. (Optional) Create a new correlation policy from the AEC Policies page:

Define EMS and AEC Policy for Alerts
Chapter 4: Monitoring Your Enterprise with the Alert Management System 185
a. Choose File, Save As.
The class is saved in the MDB.
b. Click New.
The Advanced Event Correlation IDE opens. Define the correlation
policy.
8. Click OK on the Alert Class - Detail window.
The alert class is defined.
Define EMS and AEC Policy for Alerts
Alerts are created from Event Management or Advanced Event Correlation policy
that contains an alert class ID in the definition. The alert class ID assigns initial
properties to the alerts, and indicates the alert queues that group the alerts in
the Management Command Center.
Note: Alerts should be a small subset of the events that occur. They should
represent only events that require human intervention or provide information
critical to continued normal operations. We recommend no more than 1,000
alerts per day. There are two reasons for this. First, if few alerts are generated,
the operations staff can focus more easily on what is important. Second, AMS is
a complex system and each alert consumes more computing resources than
other events. By carefully designing your AMS configuration and policy, you can
help ensure that you get the most benefit from AMS.

Define EMS and AEC Policy for Alerts
186 Inside Event Management and Alert Management
Message Policy for Alerts
Message records for alerts are the same as for any other type of Event
Management message. You can define new message records for alerts or use
existing ones.
Message actions for alerts, however, are different from actions for other events
in the following ways:
■ The Alert class id field ties the message action to AMS.
■ The action on the Action page is ALERT.
■ An Alert text field becomes available on the Override page. This field is
necessary if you want to consolidate alerts. Consolidation groups alerts that
have the same alert class, alert queue, node of origin, and alert text.
Consolidated alerts appear on the Unicenter MCC as one alert that has a
number indicating how many similar alerts are grouped together. You enable
consolidation for a class on the Alert Class - Detail, Limits page.
Alert text can be up to 80 characters of text, variables, tokens, or any
combination of these. The variables and tokens are the same ones used for
Event Management. See Using Variables to Enhance the Current Action.
Examples of alert text are:
– ―Workstation Agent‖ or ―Eastern Region‖
– "&nodeid" to consolidate all alerts for a node. All events for that asset are
assigned to the same Service Desk request.

Define EMS and AEC Policy for Alerts
Chapter 4: Monitoring Your Enterprise with the Alert Management System 187
– "Issues for &9 assigned to &10" where the ninth word in the alert
message is an office name and the tenth is the person assigned to
resolve the critical situation. All alerts for that office and that person are
consolidated.
■ The Workstation field on the Override page provides a way to run a user
action (command) that you defined in Alert Management. Specify the name
of an Event Manager node that forwarded the alert. This lets you take
corrective actions directly on the node that manages the node where the
alert originated. For more information, see User Actions.
The Unicenter MCC shows the manager node in the Route Node column.
Note: Alert Management provides a way to define message records and actions
quickly when you define alert classes. For more information, see Define Alert
Classes.
Define Message Records and Actions for Alerts
You can define message records and actions for alerts with the Message Record
and Message Record Action windows in Event Management.
To define message record and action policy for alerts
1. Choose Enterprise Management from the drop-down list above the left pane
of the Management Command Center. Open a server, and expand Event
Management.
The left pane displays a list of the Event profiles you can define.
2. Double-click Messages.
The Message Records container opens.

Define EMS and AEC Policy for Alerts
188 Inside Event Management and Alert Management
3. Click the New button on the toolbar or double-click an existing message
record.
The Message Record - Detail window opens.
4. Enter information in the fields and notebook pages. See the online help for
specific information about each field. Choose File, Save.
The message record is created or updated.
5. Click the New button on the Actions page.
The Message Record Action – Detail window opens.
6. Choose the ALERT action on the Action page. Select a class name in the Alert
class id field. Fill in any other fields at the top of the window and on the
Action page.
The Alert text field on the Overrides page becomes available.
7. Click the Overrides tab.
The Overrides page is displayed.
8. If you are consolidating alerts, enter a subcategory for the alert in the Alert
text field. Alert text is used to group similar alerts, and is required for
consolidation to happen. Examples of alert text are Workstation Agent or
Eastern Region. Click OK several times to close all open windows.
Note: This field is the same as the Alert text field on the New Event Alert
Policy window shown in the Alert Class section. The alert text specified in the
Message Record Action- Detail overrides any text specified in that window.
The alert definition is saved.
Note: You can embed Service Desk tags in Event message policy and AEC
correlation rules. These tags let you specify values for Service Desk request
properties, rather than use the default values for creating and closing requests
that are provided by the integration between Alert Management and Unicenter
Service Desk. See the topics Service Desk Tags in Event and AEC Policy and
Sample Policy with Service Desk Tags.
Create Alerts from the Command Line
You can create alerts from the command line by using message records and
actions with the cawto command.
Use the -n node parameter to specify the Alert Manager node where the message
is sent. You must have Event Management message record and action policy on
that node to evaluate the command and create an alert.
Tip: Use a unique wildcard message prefix of your choice to catch cawto
messages that should trigger alert creation.

Define EMS and AEC Policy for Alerts
Chapter 4: Monitoring Your Enterprise with the Alert Management System 189
The following example informs server06 that node03 has gone down. The
message record matching text is "XYZ:*" for messages that trigger alert
creation.
cawto -n server06 "XYZ:Node03 has gone down"
Correlation Rules for Alerts
Advanced Event Correlation can generate correlation events as alerts and send
them to alert queues in the Management Command Center. To generate alerts,
specify alert class in engine-level properties and set the Generate Alert property
to TRUE.
To define correlation rules for alerts
1. Open the Advanced Event Correlation IDE Policy Editor or Web Policy Editor.

Define EMS and AEC Policy for Alerts
190 Inside Event Management and Alert Management
2. Open Engine, and double-click Alert Class Id.
The alert classes defined in AMS are listed.
3. Choose a class.
The selected class is shown in the Value column.
4. Double-click a rule.
5. Set Generate Alert to TRUE. The value in Alert Class ID is the read-only value
set at the engine level. Set other values, and save the rule.
The correlation event will be generated as an alert.
Note: You can embed Service Desk tags in Event message policy and AEC
correlation rules. These tags let you specify values for Service Desk request
properties, rather than use the default values for creating and closing requests
that are provided by the integration between Alert Management and Unicenter
Service Desk. See the topics Service Desk Tags in Event and AEC Policy and
Sample Policy with Service Desk Tags.

Alerts in the Management Command Center
Chapter 4: Monitoring Your Enterprise with the Alert Management System 191
Alerts in the Management Command Center
The Management Command Center provides several ways to display alerts, thus
making it convenient for you to manage important events from different areas of
the interface. You can view alerts in the following ways:
■ By alert queue
■ As a chart of alert statistics
■ For a managed object in the Topology view
Alert Queue
The Alert Queue Records view in the right pane of the Management Command
Center shows alerts in a queue. Queues are usually based on role, function,
department, geographical location, or other category that is meaningful to your
enterprise. Each queue is displayed separately from other queues.
This section contains procedures for performing the following actions:
■ Display alerts by queue
■ Acknowledge an alert
■ Annotate an alert
■ Transfer an alert to another queue
■ View consolidation details
■ Close an alert
■ View alert properties
Note: Procedures for opening, viewing, and closing Service Desk requests are
discussed later in this chapter.

Alerts in the Management Command Center
192 Inside Event Management and Alert Management
Display Alerts by Queue
You can display a list of all alerts in a queue.
To display alerts by queue
1. Choose Alerts from the drop-down list above the left pane.
The left pane lists nodes where Alert Management is installed.
2. Open the node with the alerts that you want to view.
The tree expands and lists alert queues for that node.
3. Display alerts in the queue by using one of these methods:
■ Right-click an alert queue and choose Viewers, Alert Queue Records.
■ Select an alert queue.
The alerts in that queue appear in the right pane.
Acknowledge an Alert
The first step in resolving an alert is acknowledging its existence in Management
Command Center. Since acknowledgment creates an audit/history entry for the
alert that includes the name of the acknowledging user, you can also use it as a
means to indicate ownership of the alert.
To acknowledge an alert
1. Right-click an alert.
A context menu appears.
2. Choose Acknowledge on the menu.
A checkmark appears in the Ack column of the right pane.
Note: You can also acknowledge an alert when you view alert properties (Alert
Properties dialog Status page). See View Alert Properties.

Alerts in the Management Command Center
Chapter 4: Monitoring Your Enterprise with the Alert Management System 193
Annotate an Alert
While viewing an alert in the Management Command Center, you can add
comments to it. These comments can help you keep track of the interim steps
that you took to resolve the alert.
Note: After you save alert annotation, it becomes read-only. You cannot change
it.
To annotate an Alert
1. Display alert properties by using one of these methods:
■ Right-click an alert and choose Properties from the context menu.
■ Double-click an alert.
The Alert Properties dialog opens.
2. Click the Annotation tab.
The Annotation page comes to the foreground.
3. Click the New button, and enter comments in the text box. Click Save.
The annotation is saved.
Transfer an Alert to Another Queue
Sometimes you may find that an alert belongs in a different queue. In such case,
you may want to transfer an alert to another queue.
To transfer an Alert to another queue
■ Right-click an alert, choose Transfer to from the context menu, and select a
queue from the list.
■ Drag the alert to a queue listed in the left pane.
The alert moves to the selected queue.
Note: You can also transfer an alert when you view alert properties (Alert
Properties dialog General page). See View Alert Properties.

Alerts in the Management Command Center
194 Inside Event Management and Alert Management
View Alert Details
The alert consolidation feature groups alerts that have the same class, queue,
node of origin, and alert text. Consolidated alerts appear on the Management
Command Center as one alert that has a number indicating how many alerts are
grouped together.
To view Alert details
1. Right-click an alert.
A context menu appears.
2. Choose Consolidation Details on the menu.
A dialog opens that shows each alert in the group.
Note: You can separate alerts that have been consolidated by choosing
Unconsolidate. If the selected alert is the parent, all alerts in the group are
removed. If the selected alert is a member of the group, that alert is removed
but the parent and other members remain.
Close an Alert
After you resolve the situation that caused an alert, close the alert in the
Management Command Center.
To close an alert
1. Right-click an alert.
A context menu appears.
2. Choose Close.
The alert is closed.
View Alert Properties
You can view details about alerts that may help you manage them in the
Management Command Center.
To view alert properties
1. Display alert properties by using one of these methods:
■ Right-click an alert and choose Properties from the context menu.
■ Double-click an alert.
The Alert Properties dialog opens.
2. Click the tabs to view the alert properties.
The properties pages are displayed.

Alerts in the Management Command Center
Chapter 4: Monitoring Your Enterprise with the Alert Management System 195
Chart of Alert Statistics
The Management Command Center can display bar charts that show all alerts for
a node broken down by queue and priority.
Each bar represents a queue. The length of the bars shows the total number of
alerts in various priorities, which is indicated in the legend.
Priority is calculated by multiplying the values for urgency and impact. Urgency
indicates how soon a technician or operator should try to resolve the situation
that caused an alert. Impact indicates how much an event affects your business.
To display a chart of alert statistics
1. Choose Alerts from the drop-down list above the left pane.
The left pane lists nodes where Alert Management is installed.
2. Display the chart by using one of these methods:
■ Right-click the node with the information that you want to view, and
choose Add Viewer, Summary from the context menu.
■ Select the node, and choose Status from the drop-down list over the
right pane.
A bar chart appears in the right pane.
For a Managed Object
The Management Command Center can display alerts that are relevant to a
particular managed object in the Topology view.
You display alerts that are relevant to a managed object by right-clicking the
object and choosing Add Viewer, Alerts from the context menu. See the
Management Command Center help for details regarding viewers, viewer
behavior, and viewer selection.
Periodically, an association daemon polls the alert table for unassociated alerts
and links them to their origin node.

Maintain Alert Policy
196 Inside Event Management and Alert Management
Maintain Alert Policy
Alert Management provides several commands that let you do the following:
■ Export and import alert policies from one machine to another.
■ Archive closed alerts and their associated history and annotation records.
■ Purge alerts.
■ Create a comma-separated value (CSV) file of archived alerts.
Note: For information about the commands referenced in this section, see the
online CA Reference.
Export and Import AMS Policies
After you set up AMS on one machine, you can export the policies you defined to
other machines. Exporting and importing ensures that AMS policies are identical
across your entire enterprise.
You can export and import the following profiles using the caamspolicy
command:
■ Display attributes
■ User actions
■ User action cross-reference information (classes they are associated with,
menus they are on)
■ Action menus
■ Escalation policies
■ Global definitions without selected nodes from which alerts are acquired
■ User data
■ Alert queues
■ Alert classes

Maintain Alert Policy
Chapter 4: Monitoring Your Enterprise with the Alert Management System 197
You can copy alert policies from one machine to another by exporting and
importing.
Note: Importing overwrites any existing policies. If you want to save them,
export them before importing other policies.
To export AMS policies
1. Enter the following command from any directory on the machine you are
exporting from:
caamspolicy -e 0204
Note: "0204" is a prefix to the files being created. It identifies the files that
are part of the same export-import.
A file is created for each profile in the current directory.
2. Copy the files to the target machine where the import will take place.
3. Enter the following command in any directory on the import machine:
caamspolicy -i 0204
The policies are copied to the target machine.
Archive Alerts
Archiving lets you remove closed alerts to free up disk space. The command
caamsarchive writes closed alert records and their associated history and
annotation records to flat files and deletes them from the database. Alerts are
archived only when their retention period (Alert Class window Limits page) has
elapsed since the closed date. Archived records cannot be restored.
To archive alerts, enter the following command:
caamsarchive -a
Note: An optional parameter, -v, displays the name of the archive file.
Purge Alerts
Purging removes all alerts, both opened and closed. Therefore, do not purge
alerts in a production environment unless a situation has made it necessary to
remove everything and start over. Purged records cannot be restored.
To purge alerts, enter the following command:
caamspurge -d 30 -c default

Maintain Alert Policy
198 Inside Event Management and Alert Management
All alert records 30 days or older in the class default, with their associated history
and annotation records, are written to flat files and deleted from the database.
Note: An optional parameter, -v, displays the name of the purge file. The
parameter -c class is also optional.
caamsalertcsv Command—Create a CSV File
The caamsalertcsv command creates a CSV (comma separated value) file of
archived and/or purged alert records and their associated history and annotation
records. You can use CSV files to create reports that show such things as the
time of day when most alerts are generated, what servers cause most alerts, and
which operators resolve alerts.
This command has the following format:
caamsalertcsv [-b | -a | -p] [-sm mm -sd dd -sy yyyy] [-em mm -ed dd -ey yyyy]
[-o output_file] [-v]
-b|-a|-p
(Optional) Specifies whether to add archived alerts, purged alerts, or both to
the CSV file.
-b
Includes both archived and purged alert records.
-a
Includes only archived alert records.
-p
Includes only purged alert records.
Default: -b
-sm mm -sd dd -sy yyyy
(Optional) Specifies alerts that were archived, purged, or both, on and after
a specified month, day, or year.
-sm mm
Includes files created this month and later.
-sd dd
Includes files created on and after this day of the month.
-sy yyyy
Includes files created this year and later.
Default: All alerts regardless of date

Maintain Alert Policy
Chapter 4: Monitoring Your Enterprise with the Alert Management System 199
-em mm -ed dd -ey yyyy
(Optional) Specifies alerts that were archived, purged, or both, on and
before a specified, month, day, or year.
-em mm
Includes files created this month and earlier.
-ed dd
Includes files created on and before this day of the month.
-ey yyyy
Includes files created this year and before.
Default: All alerts regardless of date
-o output_file
(Optional) Specifies the CSV file name. Surround the name with quotations
marks if the name has a space in it.
-v
(Optional) Displays the name of the CSV file created. The default file name is
today's date in the format yyyymmdd.csv, for example, 20080613.csv.
Examples: Create a CSV File
■ This example creates a CSV file of all archived and purged alerts regardless
of date and displays the file name.
caamsalertcsv -v
■ This example copies archived alerts to a CSV file named archived.dat in the
C:\Alert Reports directory:
caamsalertcsv -a -o "c:\Alert Reports\archived.dat"
■ This example copies alerts purged on April 1, 2008, and later to a file named
fromApril.csv in the C:\temp directory:
caamsalertcsv -p -sm 04 -sd 01 -sy 2008 -o c:\temp\fromApril.csv
■ This example copies alerts archived and purged during June, 2008, to the file
June.csv in the current directory:
caamsalertcsv -sm 06 -sd 01 -sy 2008 -em 06 -ed 30 -ey 2008 -o June.csv
Note: If you want an ampersand (&) to appear as & in a URL, use ̂ as an escape
character. Otherwise, AMS interprets the & and the text following it as a variable.
An example is:
iexplore http://anysite.com/servlet^&view%27

Integrate with Unicenter Service Desk
200 Inside Event Management and Alert Management
Integrate with Unicenter Service Desk
CA NSM provides a connection to Unicenter Service Desk (Service Desk), which
is a customer support application that manages calls, tracks problem resolution,
shares corporate knowledge, and manages IT assets.
The integration with Service Desk is through the Alert Management System
(AMS) and the Management Command Center (Unicenter MCC) interface. The
connection is installed automatically with CA NSM. Interaction with the Service
Desk reduces the workload of the customer support staff because some manual
tasks are eliminated.
How the Integration with Service Desk Works
CA NSM creates Service Desk requests based on policies defined in the Event
Management System (EMS), Advanced Event Correlation (AEC), and Alert
Management System (AMS). This is how it works:
1. A situation is evaluated by either EMS message records and actions or by
AEC rules. If the event is serious, an alert is generated.
2. AMS class or escalation policy determines if a Service Desk request (ticket) is
appropriate, and creates one.
Note: AMS creates requests only for Service Desk resources that are active. This
helps avoid flooding the Service Desk.
CA NSM comes with EMS, AEC, and AMS policy that can automatically create and
close Service Desk requests. You can also write your own policy using message
records and actions, correlation rules, and alert classes and escalation policies.
This is how CA NSM interacts with Unicenter Service Desk:
■ Alert policy definitions specify that Service Desk requests be opened and
closed during the life cycle of an alert:
– Open a Service Desk request when an alert is created. Indicate this using
the Alert Class Window.
Note: AMS does not open a request if an existing request has identical
summary, description, and asset properties. This prevents multiple
trouble tickets describing the same root problem.
– Open a Service Desk request when an alert is escalated. Use the
Escalation Policy Editor.
– Close a request when the alert that opened it is closed or made inactive.
Use the context menu in the Unicenter MCC to close an alert; use the
Alert Class window Main page or Alert Properties dialog Status page to
make an alert inactive.

Integrate with Unicenter Service Desk
Chapter 4: Monitoring Your Enterprise with the Alert Management System 201
■ Alerts that are associated with Service Desk requests include the request
reference number. Likewise, Service Desk requests created by alerts
indicate that an outside application opened the request.
■ The activity log of a Service Desk request is updated automatically with
additional information from AMS when duplicate alerts are created.
■ The context menu in the Unicenter MCC lets you interact manually with the
Service Desk. You can view requests, open a request, and search the Service
Desk Knowledge Tools. For example, when you right-click an alert, you can
see requests associated with that alert. When you right-click a managed
object in the 2D Map or Topology view, you can see requests for the selected
node.
Note: When Service Desk requests are opened and closed, a message is sent to
the Event Console.
Scenarios
This section contains examples of situations that could trigger the creation of an
alert and a Service Desk request.
Scenario 1: System Agent on a Critical Server
1. An agent metric exceeds a threshold.
2. An Event Management System (EMS) event is generated.
3. EMS message record policy creates an alert for this event.
4. AMS escalation policy opens a Service Desk request because the alert is open
more than 30 minutes.
5. A technician resolves the problem and closes the alert, and the Service Desk
request is closed automatically.
Scenario 2: Third-Party Software
1. Third-party software produces a series of events in the system log indicating
a failure.
2. EMS captures the events.
3. AEC policy evaluates the events and creates an alert.
4. AMS class policy opens a Service Desk request immediately.
5. Operations staff resolves the problem and closes the alert. The request is
closed automatically.

Integrate with Unicenter Service Desk
202 Inside Event Management and Alert Management
Affected End User
One of the tables in the CA MDB is the Contact Table (ca_contact). The Service
Desk product uses the Contact Table to store information about any user that
receives service from the Service Desk.
The Service Desk installation process loads an entry in the Contact Table called
System_NSM_Generated. This entry is used to populate the Affected End User
field of any tickets automatically generated by the Alert Management System.
In order for the AMS integration to work properly, this entry must be present in
the Contact table when a ticket is generated.
Service Desk Tags in Event and AEC Policy
The Alert Management integration with Service Desk provides the basic
capability to create and close Service Desk requests. The default integration uses
default values for many Service Desk request properties. Greater customization
is possible, however, by embedding Service Desk tags in the alert detail
message. Enter the following tags in Event and AEC policies that generate alerts.
AMS uses the tags when it creates the Service Desk requests.
SDTemplate
Specifies a Service Desk template to use for creating the request. Templates
provide values for common situations and allow requests to be created
quickly. If other Service Desk tags are entered, their values override the
default template properties.
SDAssignee
Specifies the Service Desk contact to assign to the request. Use the format
"lastname, firstname" and include the comma even if part of a name is blank.
Examples are ",Anna" for just a first name and "Smith," for just a last name.
SDEndUser
Specifies the user affected by the situation that caused the Service Desk
request. Use the format "lastname, firstname" and include the comma even
if part of the name is blank. Examples are ",Anna" for just a first name and
"Smith," for just a last name. If you do not include the comma, or the user is
not valid, the default login "System_NSM_Generated" is used.
SDGroup
Specifies the Service Desk group responsible for the request. Use the Group
Name property.
SDPriority
Indicates the priority of the request, from 1 to 5.

Integrate with Unicenter Service Desk
Chapter 4: Monitoring Your Enterprise with the Alert Management System 203
SDSeverity
Indicates the severity of the request, from 1 to 5.
SDImpact
Indicates the impact of the request, from 1 to 5.
SDUrgency
Indicates the urgency of the request, from 1 to 5.
SDConfigItem
Specifies the asset or resource affected. If omitted, the alert node is used.
SDAssetClass
Specifies a general category of assets such as modem, router, or application.
The Service Desk administrator defines the asset classes. Use this optional
tag if AMS is configured to create a Service Desk asset (configuration item).
AMS creates the asset during ticket creation if the asset does not already
exist.
If you do not specify SDAssetClass, the asset is created with the default class
in Service Desk releases later than 6.0. For the 6.0 release, the asset is
created with the unknown class.
Note: AMS is configured to create an asset by default in the AMS_SD.xml file
by the tags <ConfigItem> and <CreateAsset>. For more information, see
AMS_SD.xml—Configuration File for the Service Desk Integration (see
page 205).
SDRequestArea
Specifies the Service Desk request area or category.
SDRootCause
Specifies the Service Desk root cause.
SDSummary
Specifies the Service Desk summary for the request. If omitted, the alert
text is used.
SDDescription
Specifies the Service Desk description for the request. If omitted, the alert
detail is used.
SDTicketType
Specifies the Service Desk ticket type: I for incident, P for problem, or R for
request. If omitted, a request is opened.
SDServiceType
Specifies the Service Desk service type for the request.

Integrate with Unicenter Service Desk
204 Inside Event Management and Alert Management
Sample Policy with Service Desk Tags
The examples in this section show Event policies that create AMS alerts. The
Service Desk tags embedded in the event are used when AMS creates the
Service Desk request.
■ The following event creates a Service Desk request with the assignee Smith,
George, root cause Failure, description "Network interface is no longer
responding on node xx" and severity 2.
Network interface not responding. SDAssignee="Smith, George" SDRootCause=Failure
SDDescription='Network interface is no longer responding on node &NODENAME'
SDSeverity=2
■ The following event creates a Service Desk incident instead of a request.
Network interface not responding. SDTicketType=I
■ The following event creates a Service Desk request with values from the
Account Lockout template.
User "Smith, George" is unable to access server ABC. SDTemplate='Account Lockout'
■ The following event creates a Service Desk request using the Service Desk
template Network. The contact specified in the SDAssignee tag overrides the
template's assignee property.
Network interface not responding. SDTemplate=Network SDAssignee="Smith, George"
Configuration of AMS and Service Desk
You can configure some aspects of the integration between the Alert
Management System and the Service Desk application. Specifically, you can
control the following features by updating the file AMS_SD.xml:
■ Specify the Service Desk ticket close statuses that trigger the closure of
associated AMS alerts.
■ Migrate the AMS Universally Unique ID (UUID) from the Service Desk ticket
description field to a different field.
■ Synchronize AMS and Service Desk so that associated alerts and tickets are
closed.
■ Set up AMS so that it creates Service Desk assets (objects) if they do not
already exist.
■ Specify a custom Service Desk close status that AMS uses when closing
tickets.

Integrate with Unicenter Service Desk
Chapter 4: Monitoring Your Enterprise with the Alert Management System 205
More information:
AMS_SD.xml—Configuration File for the Service Desk Integration (see page
205)
Associate Ticket Close Statuses with Alerts (see page 207)
Migrate Alert UUID from Ticket Description (see page 208)
Synchronize Alert and Ticket Closure (see page 209)
Create Service Desk Asset (see page 210)
AMS Cannot Close a Service Desk Ticket (see page 222)
AMS_SD.xml—Configuration File for the Service Desk Integration
The file AMS_SD.xml lets you configure the integration between the Alert
Management System and Unicenter Service Desk. It is located in the following
folder:
EMInstallationPath\bin
The EMInstallationPath is the InstallPath string value of the registry location
HKEY_LOCAL_MACHINE\SOFTWARE\ComputerAssociates\Unicenter
TNG\Registered Components\Enterprise Management.
This file has the following syntax:
<AMS>
<AlertCloseOptions>
<SDCloseStatus>Closed</SDCloseStatus>
<SDCloseStatus>Closed-Unresolved</SDCloseStatus>
<SDCloseStatus>Problem-Closed</SDCloseStatus>
</AlertCloseOptions>
<Migration>
<MoveAmsUuidToEventToken>False</MoveAmsUuidToEventToken>
</Migration>
<Synchronization>
<CloseTicket>True</CloseTicket>
<CloseAlert>True</CloseAlert>
</Synchronization>
<ConfigItem>
<CreateAsset>False</CreateAsset>
</ConfigItem>
<TicketCloseOption>
<SetTicketCloseStatus>Closed<SetTicketCloseStatus>
</TicketCloseOption>
</AMS>

Integrate with Unicenter Service Desk
206 Inside Event Management and Alert Management
<AlertCloseOptions>
Shows the Service Desk states that indicate a closed ticket.
<SDCloseStatus>
Specifies the individual states for closed Service Desk tickets. Enter a
<SDCloseStatus> tag for each status that should trigger the closure
corresponding alerts.
<Migration>
Specifies whether some information in Service Desk tickets is migrated to a
different field.
<MoveAmsUuidToEventToken>
Specifies whether to move the Alert UUID to the event_token field in
Service Desk tickets. Previously, both the Alert UUID and description
were placed in the Description field of the ticket.
Migration is done automatically when the AMS service starts. This tag is
automatically set to False after the migration is finished. You can set the
tag to True if some tickets are created later using old binaries.
Default: False
Note 1: This does not apply to Service Desk release 6.0, only to later
releases.
Note 2: You must apply a patch to Service Desk that increases the size
of the event_token field. See Migrate Alert UUID from Ticket Description
(see page 208). If you do not install the patch, only part of the ID is
moved.
<Synchronization>
Controls whether associated alerts and tickets are closed.
Note: In order for synchronization to occur, the check box for
synchronization must be checked on the Alert Class - Detail window (see
page 179).
<CloseTicket>
Specifies whether Service Desk tickets are closed when associated alerts
are closed.
Default: True
<CloseAlert>
Specifies whether alerts are closed when associated Service Desk tickets
are closed.
Default: True

Integrate with Unicenter Service Desk
Chapter 4: Monitoring Your Enterprise with the Alert Management System 207
<ConfigItem>
Specifies how AMS handles resources for Service Desk.
<CreateAsset>
Indicates whether AMS creates an asset in Service Desk. Synonyms for
assets are resources, configuration items, and managed objects.
Examples are servers and applications.
When the value is True (the default), the asset is created with the default
class unless you specify another class (such as Software) with the
SDAssetClass tag. See Service Desk Tags in Event and AEC Policy (see
page 202).
The Service Desk administrator defines asset classes.
Default: True
Note: If the value is False, AMS does not create any assets. If an asset
does not already exist in Service Desk, AMS also does not create a ticket.
<TicketCloseOption>
Specifies the status that AMS gives to Service Desk tickets when closing
them.
<SetTicketCloseStatus>
Specifies the status that closed Service Desk tickets should have when
AMS closes them. This tag is useful if you customize the status on the
Service Desk side, for example, to match the local language. Specifying
a custom state with this tag enables AMS to close tickets, and provides
the state that it should use.
Default: Closed
Note: This field should have the ―sym‖ value of Service Desk status.
Associate Ticket Close Statuses with Alerts
The configuration file AMS_SD.xml lets you configure the integration between
AMS and Service Desk. You can specify the states for closed Service Desk tickets
that trigger the closure of corresponding alerts. When a ticket with one of the
specified states is closed, the associated alert is also closed.
By default, several close statuses are specified by the tag <SDCloseStatus> in
the configuration file (see step 2, following). This procedure may not be
necessary unless you want to change them.

Integrate with Unicenter Service Desk
208 Inside Event Management and Alert Management
Note: If the Service Desk property Make Request Active? is Yes for an entry
specified by a <SDCloseStatus> tag in AMS_SD.xml, AMS closes any duplicate
alerts that are generated. For example, suppose an alert is created and
generates a Service Desk ticket. The Service Desk operator resolves the
situation and changes the status to Problem-Fixed, which is specified by
<CloseStatus> and its Make Request Active? property is set to Yes. This
situation triggers AMS to close the alert. Any duplicate alert generated later is
associated with the fixed ticket. AMS identifies the Problem-Fixed status and
closes the alert. Therefore, the new alert appears in the Unicenter MCC for a
short time and then disappears.
To associate Service Desk close statuses with AMS alerts
1. Open the following file in an editor:
EMInstallationPath\bin\AMS_SD.xml
2. Go to the section <AlertCloseOptions>. The following lines are the default
close statuses. Add or change any values.
<AlertCloseOptions>
<SDCloseStatus>Closed</SDCloseStatus>
<SDCloseStatus>Closed-Unresolved</SDCloseStatus>
<SDCloseStatus>Problem-Closed</SDCloseStatus>
</AlertCloseOptions>
3. Save the file.
The changes take effect the next time the AMS service is restarted.
Note: To see the entire syntax of the configuration file and more details about it,
see the topic AMS_SD.xml—Configuration File for the Service Desk Integration
(see page 205).
Migrate Alert UUID from Ticket Description
The configuration file AMS_SD.xml lets you configure the integration between
AMS and Service Desk. You can move the Alert Universally Unique ID (UUID) to
the event_token field in Service Desk tickets. Previously, the Alert UUID and
description were placed in the Description field of the ticket.
Important! Do not update the event_token field of tickets created by AMS. If you
do, AMS will not be able to track the ticket and will close the corresponding alert.
You must apply a patch to Service Desk to increase the size of the event_token
field. Then, when you start the AMS service, migration is done once,
automatically. The tag <MoveAmsUuidToEventToken> (step 3) is automatically
set to False, the default, after the migration is finished. You can specify True for
this tag if some tickets are created later using old binaries. Otherwise, this
procedure is not necessary to perform more than once.
Note: This functionality does not apply to Service Desk release 6.0, only to later
releases.

Integrate with Unicenter Service Desk
Chapter 4: Monitoring Your Enterprise with the Alert Management System 209
To update Service Desk ticket descriptions
Contact CA Support to get the Service Desk and MDB patches that upgrade
the event_token field size. You must install them on the Service Desk
machine.
Note: If you do not install the patch, only part of the ID is moved to the
event_token field.
1. Open the following file in an editor:
EMInstallationPath\bin\AMS_SD.xml
2. Go to the section <Migration>. The following lines show the default value.
Add or change the value.
<Migration>
<MoveAmsUuidToEventToken>False</MoveAmsUuidToEventToken>
</Migration>
3. Save the file.
The changes take effect the next time the AMS service is restarted.
Note: To see the entire syntax of the configuration file and more details about it,
see the topic AMS_SD.xml—Configuration File for the Service Desk Integration
(see page 205).
Synchronize Alert and Ticket Closure
The configuration file AMS_SD.xml lets you configure the integration between
AMS and Service Desk. You can specify whether associated alerts and tickets are
closed at the same time. By default, alerts are closed when the associated tickets
are closed, and tickets are closed when the associated alerts are closed. You do
not need to perform this procedure unless you want to turn off the
synchronization.
Note: In order for synchronization to occur, the check box for synchronization
must be checked on the Alert Class - Detail window (see page 179).

Integrate with Unicenter Service Desk
210 Inside Event Management and Alert Management
To synchronize the closure of AMS alerts and Service Desk tickets
1. Open the following file in an editor:
EMInstallationPath\bin\AMS_SD.xml
2. Go to the section <Synchronization>. The following lines show the default
values.
<Synchronization>
<CloseTicket>True</CloseTicket>
<CloseAlert>True</CloseAlert>
</Synchronization>
3. Change any values, and save the file.
The changes take effect the next time the AMS service is restarted.
Note: To see the entire syntax of the configuration file and more details about it,
see the topic AMS_SD.xml—Configuration File for the Service Desk Integration
(see page 205).
Create Service Desk Asset
The configuration file AMS_SD.xml lets you configure the integration between
AMS and Service Desk. You can specify whether AMS creates a Service Desk
asset if one does not already exist. Assets are the devices, software, and services
that make up your business infrastructure.
By default AMS creates an asset, so you can omit this procedure unless you want
to disable global asset creation permanently or during the current session.
Note: Disabling asset creation also prevents ticket creation when an asset is not
defined or inactive in Service Desk.
When the value in AMS_SD.xml is True (the default), the asset is created with
the default class unless you specify another, valid class with the SDAssetClass
tag. See Service Desk Tags in Event and AEC Policy (see page 202). With Service
Desk 6.0, however, the class is unknown when SDAssetClass is not used.
Asset classes identify general categories of assets such as modem, router, and
application. The Service Desk administrator defines asset classes.

Integrate with Unicenter Service Desk
Chapter 4: Monitoring Your Enterprise with the Alert Management System 211
To configure AMS to create Service Desk assets
1. Open the following file in an editor:
EMInstallationPath\bin\AMS_SD.xml
2. Go to the section <ConfigItem>. The following lines show the default values.
<ConfigItem>
<CreateAsset>True</CreateAsset>
</ConfigItem>
3. Change the value, and save the file.
The changes take effect the next time the AMS service is restarted.
Note: To see the entire syntax of the configuration file and more details about it,
see the topic AMS_SD.xml—Configuration File for the Service Desk Integration
(see page 205).
Manage Service Desk Requests
This section has the following procedures for connecting to Unicenter Service
Desk; opening, closing, and viewing Service Desk requests; opening the Service
Desk Knowledge Tools, and installing the Service Desk SSL certificate.
■ Connect to Unicenter Service Desk.
■ Install the Service Desk SSL certificate.
■ Open a request automatically when an alert is created.
■ Open a request automatically when an alert is escalated.
■ Open a request manually.
■ Close a request automatically when an alert is closed.
■ View the request associated with an alert.
■ View requests associated with a managed object.
■ Open the Service Desk Knowledge Tools.
Note: Be judicious about what conditions trigger the creation of requests. Do not
flood the Service Desk.

Integrate with Unicenter Service Desk
212 Inside Event Management and Alert Management
Connect to Unicenter Service Desk
Connecting to Unicenter Service Desk involves entering information on two
windows, User Options and Alert Global Definitions.
Note: The release number of CA NSM and Unicenter Service Desk need not be
the same, as long as the two products do not share a database. If they do not
share a database, any combination of product releases will work.
To connect to Unicenter Service Desk
1. Choose View, Options from the main menu in the Management Command
Center.
The User Options dialog appears with the General page open in the right
pane.
2. Click the Service Desk link in the left pane.
The Service Desk page appears in the right pane.
3. Enter the Service Desk connection information and any other options, and
close the window.
Options are saved and take effect immediately.
Note: Most information on the User Options dialog is saved immediately.
The only exception is information on the Status Color Schemes tab, which
has an icon for saving.
4. Choose Enterprise Management from the drop-down list above the left pane
of the Unicenter MCC. Open a server, and expand Alert Management.
The left pane displays a list of the AMS profiles you can define.
5. Double-click Alert Global Definitions.
The Alert Global Definition - Detail window opens.
6. Enter the Uniform Resource Identifier (URI) of the web service on your
primary Service Desk server. The default for service Desk 6.0 is
http://server[:port]/usd_ws/usd_ws.asmx. The default for Service Desk
r11.x is http://servername[:port]/axis/services/USD_WebServiceSoap.
Enter a user ID and password. Click Save.
The connection to Service Desk is established.

Integrate with Unicenter Service Desk
Chapter 4: Monitoring Your Enterprise with the Alert Management System 213
Install the Service Desk SSL Certificate
If the Service Desk web service is hosted on a secure web server, indicated by
"https‖ in the URI, you must import the Service Desk server’s SSL certificate to
the server hosting AMS.
Note: You specify the URI on the Alert Global Definition - Detail window.
To install the certificate
1. Get the SSL certificate for the Service Desk server from Service Desk
administrator.
2. Import the certificate to the following directories using the openssl command
line utility:
Windows - \Program Files\CA\SharedComponents\non-CA\bin
Linux/UNIX - $CAIGLBL0000/alert/config
For information about openssl, see the OpenSSL documentation.
Open a Request Automatically When an Alert Is Created
You can configure AMS so that when a critical situation occurs and an alert in a
certain class is created, a Service Desk request is opened automatically. This
saves time because the request does not need to be opened manually. For more
information, see Alert Classes.
To open a Service Desk request automatically when an alert is created
1. Choose Enterprise Management from the drop-down list above the left pane
of the Management Command Center. Open a server, and expand Alert
Management.
The left pane displays a list of the AMS profiles you can define.
2. Double-click Alert Classes.
The Alert Classes Summary window opens.
3. Click New to create a new class, or click a class in the list and click Open.
The Alert Class - Detail window opens.

Integrate with Unicenter Service Desk
214 Inside Event Management and Alert Management
4. Click the Actions tab, and check the check box Create request when alert is
opened.
5. If this is a new class, continue defining the class. Click OK.
When alerts in the class are created, a Service Desk request will be opened.
Open a Request Automatically When an Alert Is Escalated
You can configure AMS so that when an alert is escalated, a Service Desk request
is opened automatically. For information about escalation policies, see Escalation
Policies.
To open a Service Desk request automatically when an alert is
escalated
1. Choose Enterprise Management from the drop-down list above the left pane
of the Management Command Center. Open a server, and expand Alert
Management.
The left pane displays a list of the AMS profiles you can define.
2. Double-click Escalation Policies.
The Escalation Policies Summary window opens.
3. Click the New button on the toolbar to create a new policy, or click a policy in
the list and click Open.
The Escalation Policy - Detail window opens.

Integrate with Unicenter Service Desk
Chapter 4: Monitoring Your Enterprise with the Alert Management System 215
4. Click New or select a subpolicy and click Open.
The Escalation Policy Editor window opens.
5. Check the check box Create Service Desk request. Enter information in any
other fields and click OK several times.
When alerts associated with this policy are escalated, a Service Desk request
will be created.
Open a Request Manually
You can open a Service Desk request manually for alerts that do not
automatically create requests.
To open a Service Desk request manually
1. Choose Alerts from the drop-down list above the left pane of the
Management Command Center. Expand the tree to display the alert queue
that contains the alert that warrants a Service Desk request.
The alert queue is visible in the left pane.
2. Double-click the queue.
The alerts in that queue are displayed in the right pane.
3. Right-click the alert that needs a Service Desk request, and choose Create
Request from the context menu.
A window for creating requests opens.

Integrate with Unicenter Service Desk
216 Inside Event Management and Alert Management
Close a Request Automatically When an Alert Is Closed
You can configure AMS so that when an alert in a certain class is closed, the
associated Service Desk request is also closed.
To close a request automatically when an alert is closed
1. Choose Enterprise Management from the drop-down list above the left pane
of the Management Command Center. Open a server, and expand Alert
Management.
The left pane displays a list of the AMS profiles you can define.
2. Double-click Alert Classes.
The Alert Classes Summary window opens.
3. Click New to create a new class, or click a class in the list and click Open.
The Alert Class - Detail window opens.
4. Click the Actions tab, and check the check box Synchronize closure of
requests and alerts.
5. If this is a new class, continue defining the class. Click OK.
When alerts in the class are closed, the associated Service Desk request will
also be closed.
View the Request Associated with an Alert
The Management Command Center lets you view the Service Desk request
opened by an alert. This saves time because you do not have to leave CA NSM
and activate Unicenter Service Desk.
Note: An active alert has one associated active Service Desk request. However,
some resolved requests may be listed for alerts that had the same Service Desk
summary, description, and asset as the active alert.
To view the request associated with an alert
1. Choose Alerts from the drop-down list above the left pane of the
Management Command Center. Expand the tree to display the alert queue
that contains the alert with the Service Desk request you want to view.
The alert queue is visible in the left pane.
2. Double-click the queue.
The alerts in that queue are displayed in the right pane.
3. Right-click the alert whose Service Desk request you want to view, and
choose View Request from the context menu.
The request associated with the alert is displayed.

Integrate with Unicenter Service Desk
Chapter 4: Monitoring Your Enterprise with the Alert Management System 217
Open a Service Desk Ticket for a Managed Object Manually
If you have installed Unicenter Service Desk, and specified connection
information on the User Options dialog, Service Desk page, you can manually
create a Service Desk ticket for a managed object if no policy exists to open a
ticket automatically.
To open a Service Desk ticket manually
1. Open the Topology, Business Process Views, or Class Specification viewer.
The viewer opens.
2. Expand the tree, and open a managed object node.
Managed objects are displayed in the right pane.
3. Right-click a managed object, select Service Desk from the context menu,
and select Create Request, Create Incident, or Create Problem from the
submenu.
Note: Create Incident and Create Problem appear only when the Service
Desk is configured for ITIL support.
A dialog for creating tickets opens.
Note: If you have not specified Service Desk connection information on the User
Options dialog Service Desk page, the Service Desk menu item is disabled.
View Requests Associated with a Managed Object
You can view Service Desk requests associated with a managed object in the
Topology view.
To view Service Desk requests for a managed object
1. Open Topology view in the left pane of the Management Command Center,
expand the tree, and open a managed object node.
Managed objects are displayed in the right pane.
2. Right-click the node with Service Desk requests you want to view, and
choose View Requests from the context menu.
Note: If you have not defined the web address of your Service Desk server
on the Connections page in the User Options Notebook, you are prompted for
the Service Desk URL.
Requests associated with the node are displayed.

Diagnostics and Troubleshooting
218 Inside Event Management and Alert Management
Open the Service Desk Knowledge Tools
You can get information about Service Desk requests by using the Service Desk
Knowledge Tools (KT).
To display the Service Desk KT
1. Right-click an alert in the right pane or a managed object in the Topology
view.
Note: You can view the Knowledge Tools even if the alert or object does not
have any associated requests.
2. Choose Knowledge Tools from the context menu.
The Service Desk KT opens.
Diagnostics and Troubleshooting
The topics in this section provide ways to troubleshoot problems that you may
have when using Alert Management.
Cannot Delete an Alert Policy
Valid on Windows and UNIX/Linux
Symptom:
When I try to delete an alert policy like a display attribute, class, or queue, I get
a message that says deletion is denied because the item in still in use. This
happens even after I removed all connections to other alert properties.
Solution:
AMS is based heavily on references between objects. If AMS does not let you
delete a policy, make sure that you first delete or modify anything that uses that
policy. For example, some open or closed alerts in the MDB may belong to a
class, reference a display attribute, or are in a queue that you are trying to
delete. You must either archive (caamsarchive command) or purge (caamspurge
command) those alerts.
You also cannot delete a queue if it is the initial queue for a class that exists.
Likewise, you cannot delete an escalation policy that is defined for an existing
queue. You must modify the class or queue.

Diagnostics and Troubleshooting
Chapter 4: Monitoring Your Enterprise with the Alert Management System 219
Error Messages Appear When Viewing Alerts for a Managed Object
Valid on Windows
Symptom:
Error messages appear on Windows systems when I right-click managed objects
in the Topology view and display the alerts associated with them.
Solution:
This happens when AMS Manager servers, which are designated as Worldview
repositories in the Alert Global Definition, are in workgroups but not domains.
You can prevent the messages by changing the primary Domain Name System
(DNS) suffix on those servers.
To change the primary DNS suffix
1. Select Start, Settings, Control Panel, System.
The System Properties dialog opens.
2. Click the Computer Name tab, and then click Change.
The Computer Name Changes dialog opens.
3. Click More.
The DNS Suffix and NetBIOS Computer Name dialog opens.
4. Update the following information:
■ Enter the DNS suffix in the field Primary DNS suffix of this computer. Use
the format "xxxxxx.com."
■ Check the box Change primary DNS suffix when domain membership
changes if you want your computer to update the suffix automatically if
the domain changes.
Click OK several times, and reboot the computer.
The DNS suffix is changed.

Diagnostics and Troubleshooting
220 Inside Event Management and Alert Management
User Action Does Not Run
Valid on Windows and UNIX/Linux
Symptom:
A user action defined for alerts does not run. The action works fine when invoked
from the context menu in the Management Command Center.
Solution:
If you configure AMS to run user actions automatically, you must run the actions
on the AMS manager node (User Action - Detail, Target/type field). Actions can
be run automatically when certain alerts are escalated or when alerts of a
specific class are created, acknowledged, transferred, or closed.
In addition, a user ID must have permission to run User Actions with oprcmd or
automatically by class or escalation policy.
Perform the following actions.
On UNIX/Linux
1. Configure the file $CAIGLBL0000/opr/config/node/actnode.prf so that the
execution ID of the escalation daemon (root) is permitted to execute
message actions.
2. On the User Action - Detail, Target/type field, select AMS Manager.
The user action will be run on the Alert Management manager node only.
On Windows
1. Update the environment variable Users authorized to issue commands
(CA_OPR_AUTH_LIST) so that it includes the user ID under which the
escalation daemon runs.
■ The ID is NT AUTHORITY\SYSTEM because by default the escalation
daemon runs under the LocalSystem account.
■ Update the variable with cautenv, the Configuration GUI (EM Settings),
or Unicenter Configuration Manager.
■ Separate each user with commas.
2. Recycle Event Management.
The new setting takes effect.
3. On the User Action - Detail, Target/type field, select AMS Manager.
The user action will be run on the Alert Management manager node only.

Diagnostics and Troubleshooting
Chapter 4: Monitoring Your Enterprise with the Alert Management System 221
Access Denied to Event Messages and Alerts
Symptom:
When I try to access alerts or event messages on a remote server, I get an error
message that says access is denied because the current user does not have
CA-AMS-ALERT or CA-CONLOG read access.
Solution:
Unicenter Security may prevent a user on one server from accessing alerts and
event messages on a remote server. To get access to a remote Event Console,
add the local user to the SYSADMIN group on the remote node. See the
procedure Allow Access to the Event Console on a Remote Server.
Cannot Display Alerts for a Managed Object
Symptom:
When I right-click a managed object in the Topology tree and choose Alert
Viewer, no alerts are displayed. The managed object and the AMS Server reside
in different WorldView repositories. The WorldView repository of the managed
object is correctly defined in the Alert Global Definition on the AMS Server.
Solution:
You may need to define a logical repository or update the connection to the
remote computer where the repository is located. See the following topics:
Define a Logical Repository (Windows)
Define a Logical Repository (UNIX/Linux)
Connect to a Remote Repository
Security Error Occurs When Closing an Alert
Symptom
When I close an alert associated with an eHealth alarm or netHealth exception, I
get an error message from Security Management.
Solution
You need to grant permission to the user SYSTEM. See Authorize Users to Run
Commands (see page 25).

Diagnostics and Troubleshooting
222 Inside Event Management and Alert Management
AMS Cannot Close a Service Desk Ticket
Symptom:
Alert Management cannot close a Service Desk ticket associated with an alert
that it closed.
Solution:
AMS sets Service Desk tickets to the Closed status when it closes them. That
status may have been changed in Service Desk to another word that, for
example, matches the local language. AMS would then not be able to close the
ticket because Closed is not available. If you want to use the custom status
instead of Closed, update the AMS_SD.xml configuration file.
To use a custom Service Desk close status
1. Open the following file in an editor:
EMInstallationPath\bin\AMS_SD.xml
2. Go to the section <TicketCloseOption>. The following shows the default
status of Closed. Change it to the custom close status name in Service Desk.
<TicketCloseOption>
<SetTicketCloseStatus>Closed<SetTicketCloseStatus>
</TicketCloseOption>
3. Save the file.
The changes take effect the next time the AMS service is restarted.
Note: To see the entire syntax of the configuration file and more details about it,
see the topic AMS_SD.xml—Configuration File for the Service Desk Integration
(see page 205).
AMS Closes Alerts When Service Desk Tickets Have a Status Change
Symptom:
Alert Management closes alerts when the associated Service Desk tickets have a
status change. Alerts should be closed only when tickets are closed.
Solution:
A modified status may be specified as a closed status in the configuration file
AMS_SD.xml. You may need to update the file. See Associate Ticket Close
Statuses with Alerts (see page 207).
This is how it works. Before closing a ticket, AMS compares the ticket status to
the values specified by the <SDCloseStatus> tags in the <AlertCloseOptions>
section of the configuration file. If the status of the ticket matches one of the
close options, AMS closes the associated alert.

Diagnostics and Troubleshooting
Chapter 4: Monitoring Your Enterprise with the Alert Management System 223
No Synchronization Between Alert Closure and Service Desk Ticket Closure
Symptom:
Alert are not closed when associated Service Desk tickets are closed, tickets are
not closed when associated alerts are closed, or both.
Solution:
Synchronization may be turned off in the configuration file AMS_SD.xml. You
may need to update the file. See Synchronize Alert and Ticket Closure (see
page 209).
Alert Management Does Not Always Create Service Desk Tickets
Symptom:
Sometimes Alert Management does not create Service Desk tickets when it
creates alerts.
Solution:
By default, if a resource is not defined in Service Desk, AMS creates the resource.
However, this functionality may be turned off in the configuration file
AMS_SD.xml. You may need to update the file. See Create Service Desk Asset
(see page 210).


Index 225
Index
A
acknowledging messages • 70, 72
action menus in Alert Management System •
169
Advanced Event Correlation
advanced configurations • 130
Boolean logic rules • 111
Boolean rule pipeline items • 110
correlation rules • 99, 105
correlation timing parameters • 112
creating rules • 100
event definitions • 99, 100
global constants • 119, 120
impact analysis • 124
implementing • 127
Maturity Seconds parameter • 114
pipeline • 106
pipeline items • 106
regular expressions • 122
Reset Seconds parameter • 114
starting the Integrated Development
Environment(IDE) • 100, 102
template rules • 121
user-defined tokens • 115, 116, 117, 118
using tokens • 115, 116
AEC policy packs • 94
ALERT action • 40
alert classes in Alert Management System • 179
alert global definition in Alert Management
System • 174
Alert Management System
about alerts • 158
acknowledge alerts • 192
action menus • 169
AEC policies for alerts • 189
alarms • 171
alert global definitions • 174
annotate alerts • 193
archive alerts • 197
caamsarchive command • 197
caamspurge command • 197
chart of alert statistics • 195
classes • 179
close alerts • 194
consolidate alerts • 179, 194
create alerts from the command line • 188
display attributes • 165
escalate alerts • 171
global definitions • 174
impact • 174
message records and actions for alerts • 186
priority • 195
properties of alerts • 194
purge alerts • 197
queues • 178, 192
Service Desk integration • 200
transfer alerts • 193
troubleshooting • 218
urgency • 174
user actions • 167
user data • 177
alternation operators • 45
AMS. See Alert Management System • 157
AMS_SD.xml • 205
anchors • 44
annotating a console message • 71
authorized users • 85, 86
B
back-quote processing • 52
backslash • 43
Boolean logic
using in AEC rules • 111
C
calendars • 41
Category field • 33
character sets and ranges • 44
classes in Alert Management System • 179
command line, create alerts from • 188
configuration of Managers and Agents • 21, 22,
23, 26
console log files • 73
console log reports • 78
console message properties • 70
console views • 87
defining using Event Management • 88
defining using Security Management • 91
Correlation
creating rules • 100

226 Inside Event Management and Alert Management
correlation rules, Advanced Event Correlation •
99
create alerts from the command line • 188
creating held messages • 71
current processing environment variables • 50
D
database-related variables • 50
deactivating message records • 38
Device field • 33
DISABLE action • 38
DISCARD action • 36
display attributes in Alert Management System •
165
Domain/Node field • 32
Domain/User field • 33
E
ENABLE action • 38
escalation policies in Alert Management System
• 171
EVALUATE action • 37
event
console • 63
definition • 18
event sources • 18
life cycle • 19
messages • 63
policy • 31
Event Agents • 20, 24, 25, 26, 28, 29
Event Management System • 17
console log files • 73
console log reports • 78
console views • 87
Event Agents • 20
event definition • 18
event life cycle • 19
Event Managers • 20
event policy • 31
event sources • 18
message actions • 35
message records • 31
messages • 63
notifications • 75, 77
policy packs • 93
security • 85
SNMP traps • 79
store and forward • 74
Event Managers • 20
event-related variables • 48
F
filtering messages from console log • 69
FORWARD action • 36
G
global constants • 119, 120
global definitions in Alert Management System •
174
grouping operators • 45
H
held messages • 63, 71, 72
HILITE action • 36
I
impact in Alert Management System • 174
interval operators • 45
J
Job fields • 34
Job Name field • 34
Job Number field • 34
Job Qualifier field • 34
Jobset field • 34
L
log messages • 63, 70
M
message actions • 35
ALERT • 40
creating multiple • 53
DISABLE • 38
DISCARD • 36
ENABLE • 38
EVALUATE • 37
EXTERNAL • 38
FORWARD • 36
HILITE • 36
NOTIFY • 40
NOTIFYQ • 40
replicating • 53
SENDAPPL • 36
SENDOPER • 36
SUPPRESS • 36
TEST • 37

Index 227
message flood, preventing • 36
Message ID field • 32
Message Number field • 33
message record/action policy packs • 93
message records • 31
replicating • 53
messages
acknowledging • 70, 72
annotating console • 71
creating held • 71
preventing flood • 36
purging held • 72
replying to held • 72
requiring immediate attention • 36
sending to console log • 36
viewing properties • 70
messages requiring immediate attention • 36
modifiers • 44
multiple message actions • 53
N
nesting events • 37
non-root Event Agent • 29
notification samples • 77
Notification Services • 75, 76
NOTIFY action • 40
notifying recipients • 40
NOTIFYQ action • 40
P
pipeline • 106
policy packs • 93, 94
priority in Alert Management System • 195
Program field • 34
protocols, UNS • 75
purging held messages • 72
Q
queues in Alert Management System • 178, 192
R
range of tokens • 49
reactivating message records • 38
regular expressions • 42
alternation operators • 45
anchors • 44
backslash • 43
character sets and ranges • 44
examples of • 46
grouping operators • 45
interval operators • 45
modifiers • 44
single character • 43
replicating message records and actions • 53
replying to held messages • 72
reports, console log • 78
S
SAF (store and forward) • 74
SAF variables • 74
security • 85
SENDAPPL action • 36
sending message to console log • 36
sending notification • 75
sending text to application • 36
SENDOPER action • 36
Service Desk integration in Alert Management
System • 200
about the integration • 200, 201
AMS_SD.xml • 205
close a Service Desk request • 216
configure the integration • 204
open a Service Desk request • 213, 214, 215
open Service Desk Knowledge Tools • 218
view a Service Desk request • 216, 217
Severity field • 34
single character • 43
SNMP traps • 79
automatic formatting of traps • 84
how catrap issues traps • 83
how catrapd formats traps • 83
support for version 3 traps • 79
Source field • 33
store and forward (SAF) • 74
sudo utility • 29
SUPPRESS action • 36
T
Tag field • 34
TEST action • 37
troubleshooting Alert Management • 218
U
Unicenter Notification Services (UNS) • 75, 76
Unicenter ServicePlus Service Desk. See Service
Desk Integration in Alert Management System
• 200
UNS protocols • 75

228 Inside Event Management and Alert Management
urgency in Alert Management System • 174
user actions in Alert Management System • 167
User data field • 34
user data in Alert Management System • 177
V
variables • 47
current processing environment • 50
database-related • 50
event-related • 48
SAF • 74
W
wildcards • 41
word operators • 45
Workstation field • 35