CA-NP-205 Attachment K NP 2016/2017 GRA · CA-NP-205 Attachment K ... Level of Responsibility...
39
CA-NP-205 Attachment K Requests for Information NP 2016/2017 GRA Newfoundland Power – 2016/2017 General Rate Application 2015 NATENG: Mercer OSPE National Engineering Compensation Survey Eastern Canada Mercer
Transcript of CA-NP-205 Attachment K NP 2016/2017 GRA · CA-NP-205 Attachment K ... Level of Responsibility...

CA-NP-205
Attachment K
Requests for Information NP 2016/2017 GRA
Newfoundland Power – 2016/2017 General Rate Application
2015 NATENG: Mercer OSPE National Engineering Compensation Survey Eastern Canada
Mercer

CA-NP-205, Attachment K Page 1 of 38
I l Tl1 ·. EI"\L, H .... REEk
2015 NATENG: MERCER OSPE NATIONAL ENGINEERING COMPENSATION SURVEY EASTERN CANADA SURVEY REPORT
MAKE TOMORROW, TODAY MMERCER

CA-NP-205, Attachment K Page 2 of 38
Published Date: September 2015 Data Effective Date: june 1, 2015
Mercer is providing this survey in formation to its clients to permit them
to make independent decisions regarding salaries and benefits. Because
the exchange of salary and benefit information among competitors may
be construed in certain circumstances as a means to facilitate an antitrust
violation. Mercer has taken appropriate steps in collecting and disseminating
this information in order to avoid such perceptions.
Survey materials and the data contained therein are copyrighted works owned
exclusively by Mercer and may not be copied, modified. sold. transformed into
any other media, oro therwise transferred in whole or in any part to any party
other than the named subscriber, without prior written consent from Mercer.
For further information, please contact your local Mercer office or visit our
web site at: www.1mercer.com
Argentina India
Australia Indonesia
Austria Ireland
Belgium Italy
Brazil japan
Canada Malaysia
Chile Mexico
China Netherlands
Colombia New Zealand
Czech Republic Norway
Denmark Peru
Finland Philippines
France Poland
Germany Portugal
Hong Kong Saudi Arabia
~ 2015 Mercer LLC Ail rights reserved.
400 West Market Street. SLUte 700 Louisville. KY 40202·34! s
...... MARSH &MclENNAN ~~~~(:'!"""' C 0 M PAN I E S
Singapore
South Korea
Spain
Sweden
Switzerland
Taiwan
Thailand
Turkey
United Arab Emirates
United Kingdom
United States
Venezuela

CA-NP-205, Attachment K Page 3 of 38
NATENG 12015 Mercer OSPE National Engineering Compensalion Survey
MESSAGE FROM THE CHAIR
Karen Chan, P.Eng., MBA President and Chair
Ontario Society of Professional Engineers (OSPE)
Introducing the new Mercer OSPE National Engineering Compensation Survey
The Ontario Society of Professional Engineers (OSPE), in partnership with Mercer, is pleased to release the new 2015 Mercer OSPE National Engineering Compensation Survey. This new survey replaces the OSPE Employer Compensation Survey which has been conducted with Ontario's engineers for over 50 years.
OSPE recognizes that businesses in this province and across the country are increasingly regional, national and global in scope. This new survey will be the single source of premium national engineering compensation data in Canada.
As in previous years, the survey implementation was overseen by an advisory committee comprised of representatives from industry, engineering and human resources tasked with ensuring the most extensive and relevant data was collected. In 2015, we included data from 225 organizations, which includes compensation data for over 27,000 engineers across all major industry groups in both private and public sectors.
I would like to personally thank all of the organizations that took part in the survey this year, many of which are returning participants from prior years. Your support remains critical to the success of the survey.
We hope that you will find the results of the 2015 Mercer OSPE National Engineering Compensation Survey a valuable resource for your company's continued success, and we look forward to your participation in 2016.
© 2015 Mercer LLC. All rights reserved including the right to reproduce this document or any portion thereof in any form.

CA-NP-205, Attachment K Page 4 of 38
NATENG 1 2015 Mercer OSPE National Engineering Compensation Survey
NATENG 1 2015 Mercer OSPE National Engineering Compensation Survey
The 2015 Mercer OSPE National Engineering Compensation Survey package, including all aspects and
modifications thereof (hereafter referred to as uthe Survey"), contains the proprietary information of Mercer and the
Ontario Society of Professional Engineers. No part of the Survey may be reproduced or transmitted in any form or by
any means, electronic or mechanical, including photocopy, or information storage and retrieval systems, without the
prior written consent of Mercer and the Ontario Society of Professional Engineers. Redistribution or reproduction of
the material is expressly forbidden.
The information and data contained in this report are for information purposes only and are not intended nor implied
to be a substitute for professional advice. In no event will Mercer or the Ontario Society of Professional Engineers be
liable to you or to any third party for any decision made or action taken in reliance of the results obtained through the
use of the information and/or data contained or provided herein.
The use of the Survey is limited to the original buyer or recipient. The Survey is intended for the internal use of the
buyer only. No management consulting firm, research agency or other comparable organization is authorized to use
the Survey without the express written consent of Mercer and the Ontario Society of Professional Engineers.
Mercer Information Solutions 120 Bremner Boulevard, Suite 800 Toronto, Ontario MSJ DAB Telephone: BOO 333 3070 Email: [email protected]
Ontario Society of Professional Engineers 4950 Yonge Street, Suite 502 Toronto, Ontario M2N 6K1 Telephone: 416 223 9961 Email: [email protected]
© 2015 Mercer LLC. All rights reserved including the right to reproduce this document or any portion thereof in any form.
CA-NP-205, Attachment K Page 5 of 38
NATENG 12015 Mercer OSPE Natlonal Engineering Compensation Survey Table of Contents
Table of Contents
Using the Survey Results Introduction o•·······o····················· .......... o •••• o ........ o.o ... o ............ o.o ...... o ......... o.o •• o ...... o ......... o ••• o ..... o ...... o •• o ...... ... .... o ....... o .......... o 1
Advisory Committee .. 0 ...... o ...................... . o• ....... o oo. o. 0 .......................... o• ........ o• ..... o ................... o• o ......................................... 1 Confidentiality and Privacy .................. o ................. ... o ... o ................. o ... . .. ... o ..................... .... ............. o .......................... o ........ 2 About OSPE ............................. o ..... 00 o• ....................... o .............. ·o ..... o• ............... ..... o• o• o• •• o ................. o .......................... 0 o• ...... 2 To Contact Mercer ........ oo .... o ...... o.oooooo ............................ o.o ............... o .... o .... o ........... o.o•o· o•o•ooo o ...... o .... o .... o .. oooo •• o ... o.o•o ........ o.o .. 3 Mercer OSPE National Engineering Compensation Survey Results Workshop ................................................................. 3 Data Reported .o .............. o ...... o ... •o•o••o•o ............. o .................... o ...... o .... o.o •• o .... o .... o.o•oo•o•o•o •o ...... o.o .... o.o ....... o ................ o.o ........... 4 Mercer's Reporting Tool ... o ....................... o . ........................ .... .. ... ................. o ......................... o ............. . .. . ....... . ................... 4
Survey Methodology . 0 ..... 0 0 .................. 0 •••• 0 0 0 0 ......... 0 ............................ 0 .... o .... 0 ............. 0 ..... o .... o• o•o•· ••••• 0 .... o •• o· .............. o· ........ 5 Matching Positions ... o ........ o .......... o ...... oo ................... o ........................ oo•···· ... ............... oo ............................................... o ....... 6
Analyzing Survey Results .o .... o.o .... o.o .... o.oo ... o ........ o.o•o•o·o· · ........ o ............. .... ............ o .......... . ....... o ...... o .. ooooooooo .... o.ooo•o•o .... o.ooooo6
Aging the Data ... o.ooooo•o•o .... o.ooo••o•o• ... o ... .. oo ...... o .......... o.o•o•o•o· .... ·o•o••ooo ...... ... o.oooo ...... o ... o ....... o ....... o.ooo •• o ....... o ....... o ....... o ........... 7
Terms and Definitions ......................................................................................................................................................... 8 Eastern Canada Regions .o .................. o ............................. oo ............. o .......... o .......... o.ooo ............................................. oo ......... 9 Industry Groupings ............................................................................................................................ o ......... .. .................... 10
Sample Overview Sample Size by Engineering Responsibility Level ............................................................................................................ 14
Distribution of Incumbents by Location ... o .... o ........... oo .................... oo .... o ....... o ...... o.o ....................... oo .... o .... o .. o .......... o.o ........ 14
Participant Distribution by Number of Engineers in Eastern Canada ................................................................................ 14
Participant Distribution by Industry Super Sector ......... o .. ooo .................. o .... o ........... o.o ..... o ............... oo ......... o .... o ........ o.o ........ 1S
Participant Distribution by Net Sales Revenue o ........... ....... o ...... o.o ... o ..... o .... o ........... o.o•o•o•o ... o ... ··o•o ... oo .... o ......... o.o•o•o· ...... oooo15
Participant Distribution by Operating Expenses/Budget ....... o ...... o.o ....... o ......... ....... o ••• o .o•o··· ..... oooo ......... o .... o ....... o .. o .......... . 16
Spread of Actual Years from Graduation .......................................................................................................................... 16
Standard Work Week .o .... o ..... o ...... o .............. o .. o ... o ..... ........... o.ooo ........ ooooooo .... o .... o.ooo•• o•ooo•oo ........................ o .... o .................... 17
Summary Findings Survey Trends and Highlights ooooo ... o.o ...... o .. ··o•o ...... o•o·o·o·o•o•o•o .. . . o.oooooooo •• o .. oooooooo .... o ........ o ... o ........ o .... o.oooo· ..... o ................. o.ooo18
Base Salary & Total Cash Compensation by Level .......................................................................................................... 19 Base Salary & Total Cash Compensation by Industry Super Sector ................................................................................ 19 Base Salary & Total Cash Compensation by Job Type .................................................................................................... 20
Benefits and Turnover Benefits •o •o ··· ··· ....... o ..... o ..... oo•• ···· .. ···o· .. ·o······o· .. ·· ·o•o·o•o· ......... o o o• o• .. oo•o••o•o··o• ... o .... o.o•oooo•o•o·o•o•o•o .. ...... . o.o •• o.o•oooo.o ........ o.o ...... o.o •• 21 Turnover ............... ......... o• ........ .... ............ o• ... o• ................... o ............... . .......... o• ... o• ..... o • . . . . . .................................................. 29
Compensation Data Comprehensive compensation analysis provided in an excel export file Please download the excel export separately from Mercer WIN
Participant List Click here to open attachments panel
Classification of Engineering Responsibility Levels Level of Responsibility (A,B,C} ..... o •• o.ooo ... o ............ o.o·····o·o··· ..... o ...... o ......... o ......... o ..... ..... o .................... .... o .............. o ........... 31
Level of Responsibility (D,E,F) ................................... .................................................. o ........................... . o ........... oo .......... 32
Mercer Services About Mercer ... o.o ..... ooo·•o•o······ ......... oo.o····o· ... ... ... ....... o ........................ o.o •• o ... . o ••••••••• o.ooo . .... o ... o ......... o.o••o·o ........ ooo ... o .... o.o·o•o .. 33
© 2015 Mercer LLC

CA-NP-205, Attachment K Page 6 of 38
NATENG (2015 Mercer OSPE National Engineering Compensation Survey Using the Survey Results
USING THE SURVEY RESULTS
Introduction Mercer and the Ontario Society of Professional Engineers (OSPE) are pleased to present the results of the 2015 Mercer OSPE National Engineering Compensation Swvey. This survey provides current data with respect to actual compensation levels for professional engineers across Canada.
The 2015 Mercer OSPE National Engineering Compensation SuNey, conducted by Mercer in partnership with OSPE on behalf of its members and their employers, is designed to:
• Establish meaningful criteria for levels of engineering responsibility for the benefit of both engineers and employers of engineers; and
• Provide current data with respect to actual compensation levels for engineering work.
Advisory Committee Mercer maintains a National Engineering Compensation Survey Advisory Committee comprised of both human resources professionals and professional engineers from a variety of industries. Many of the committee members are also OSPE members. We would like to thank the Committee for its efforts and continuing dedication to this survey. The 2015 Advisory Committee was comprised of the following members:
Adele Argirakis HR Director Crossey Engineering ltd.
Christina Ridolfo Compensation & HRIS Specialist MacDonald, Dettwiler and Associates ltd.
Dominic Macchia, CHRP Director, HR Dragados Canada Inc.
Shindy Ng Manager, Global Compensation and International Benefits Teck Resources Limited
Moji Odebunmi National Leader, Total Rewards Golder Associates Ltd.
© 2015 Mercer LLC

CA-NP-205, Attachment K Page 7 of 38
NATENG )2015 Mercer OSPE National Engineering Compensation Survey Using the Survey Results
SURVEY OVERVIEW
The 2015 Mercer OSPE National Engineering Compensation Survey results represent salary data submitted by 66 organizations covering more than 7,100 incumbents, across six engineering responsibility levels. All salary data are based on rates paid effective June 1, 2015. Incentive data included are based on the most recent awards or most recently completed fiscal year. All figures are reported in thousands of Canadian dollars for full-time equivalent employees.
2015 Mercer OSPE National Engineering Compensation Survey Profile
Organizations Participating in the Survey .... ...... ................... ....... ............... ... 66 Engineers Represented ....................................................... ......... ........... 7,116 Date Effective .............................................................................. June 151
, 2015
All data in these results have been reviewed and verified for accuracy. Where necessary, individual responses have been verified with participants. Mercer reserves the right to exclude data which it considers statistically invalid or which may result in a breach of confidentiality for any survey participant.
Confidentiality & Privacy Mercer ensures all data collected for this survey are treated as confidential. In Instances where these data may be used in other Mercer survey reports, such as custom analyses, company names may appear in the participant list. Summary statistics from the 2015 Mercer OSPE National Engineering Compensation Survey are published in electronic format as a PDF. In addition, summary statistics can be queried in Mercer's Reporting Tool and accessed in Excel format. In all cases, it is Mercer's policy to continue to maintain the confidentiality of all data submitted during the data collection process. Mercer is committed to protecting the privacy of employee data and to meeting its obligations under Canadian privacy law.
Mercer's confidentiality policy is to report data only where a minimum sample size guarantees that all individual inputs and salary records are fully masked and protected. In all cases, Mercer maintains the highest level of data security and ensures confidentiality of all data submitted.
AboutOSPE The Ontario Society of Professional Engineers (OSPE) is the Voice of Ontario's Engineers. OSPE promotes and supports excellence in all aspects of engineering by enhancing the professional recognition of Ontario's 70,000+ professional engineers among employers and all levels of government; increasing their public profile; and advancing their economic interests by offering exemplary continuing education, career advancement and affinity programs. For more information, please visit www.ospe.on.ca.
If you have any questions about the history of the salary surveys or OSPE services, please contact OSPE: Phone: 416 223 9961 (Toll Free: 1 866 763 1654) Email: Mail:
© 2015 Mercer LLC
[email protected] Ontario Society of Professional Engineers 4950 Yonge Street, Suite 502 Toronto ON M2N 6K1
2

CA-NP-205, Attachment K Page 8 of 38
NATENG 12015 Mercer OSPE National Engineering Compensation Survey Using the Survey Results
To Contact Mercer
Mercer's goal is to ensure that the Mercer OSPE National Engineering Compensation Survey meets the needs of its participants. Your input and suggestions help to ensure that the survey continues to be an accurate, reliable and relevant benchmarking tool. Please feel free to contact us to share your comments and suggestions.
Phone:
Email:
Mail :
800 333 3070
Mercer Information Solutions 120 Bremner Boulevard, Suite 800 Toronto, ON MSJ OA8
Mercer OSPE National Engineering Compensation Survey Results Workshop -November 4, 2015
Please join us for the complimentary Mercer OSPE National Engineering Compensation Survey Results Workshop, hosted by Mercer. Employers of engineers, who participated in the survey, are welcome to attend. The workshop, facilitated by Mercer and OSPE, will cover the following :
• Orientation to the 2015 survey results; and
• Trends and highlights - analyses by engineering responsibility level, year of graduation, industry, number of engineers in Ontario, geography and job type.
This meeting will provide employers with an excellent opportunity to network. To register, please contact Mercer at [email protected] or 800 333 3070.
© 2015 Mercer LLC 3

CA-NP-205, Attachment K Page 9 of 38
NATENG 12015 Mercer OSPE National Engineering Compensation SuNey Using the SuNey Results
Data Reported
The following compensation elements are reported for all engineering responsibility levels:
• Base salary
• Short-term incentive amounts granted (as a percentage of base salary)
• Actual total cash compensation
As in previous years, data are reported by:
• Year of graduation
• Industry
• Organization size
• Job type • Incumbent location
New in 2015 Compensation Data- Excel export file
The comprehensive compensation data analysis has been provided separately in an excel export file to enable easier access and filtering of data.
The survey will also report on the following policies and practices elements:
• Turnover by engineering level and by gender
• Prevalence of reasons for turnover
• Prevalence and summary of benefits programs offered to engineers
Policies and practices information will be provided in the PDF report only.
In addition to the PDF and excel export file, the survey results are presented in an online format through Mercer's reporting tool. Participant employers may analyze the survey data in non-standard categories (i.e. , define custom cuts of the data).
Example: Total cash for Level C employees that graduated in 1995 and work in High Tech organizations with revenues of less than $150 million.
Mercer WIN® allows you to request custom peer groups by organization name. Total Number of Employees, Gender, Overtime Eligibility and Engineering Discipline scopes are available to all survey purchasers.
Mercer's Reporting Tool, Mercer WIN®
The survey results are presented via Mercer's reporting tool, an online market pricing software.
Mercer's reporting tool, a leading-edge analytical tool, provides direct, online access to the highest-quality, most comprehensive market data available from a source you can trust. Use this powerful tool to effectively evaluate your organization's competitive position and analyze market data.
Mercer's Reporting Tool, Mercer WIN® access to the Mercer OSPE National Engineering Compensation Survey provides you with all of the pre-determined statistics available within the hard copy report in an easy-to-use electronic format. You are provided with both the report statistics and the entire survey database. Mercer WIN® allows you to generate new statistics, that is, perform market pricing analyses and define parameters (such as revenue size and location) that more closely meet your needs. In addition, you can generate statistics based on custom peer groups, and access summary statistics available for download in Excel format.
© 2015 Mercer LLC 4
CA-NP-205, Attachment K Page 10 of 38
NATENG 12015 Mercer OSPE National Engineering Compensation Survey Using the Survey Results
Survey Methodology
Mercer follows a standardized methodology that has proven highly effective in executing surveys of national scope, as defined below:
Mercer uses a number of market data masking rules in this report and Mercer WIN® to guarantee client data confidentiality and to ensure the reported market data is as meaningful and useful as possible.
Summary of Market Data Masking Approaches
A minimum number of incumbents, organizations and distinct organizations are required to present remuneration statistics. If the minimums are not met, market data is suppressed ("masked") to protect confidentiality.
• Incumbents represent the number of distinct employees (i.e., observations) that are used to present mean, median and percentile remuneration statistics.
• Organization is defined as any entity or operating unit (e.g., divisions, subsidiaries, headquarters) providing unique incumbent remuneration data to the survey.
• A distinct organization is defined as either a stand-alone organization or a parent organization with multiple entities (i.e., divisions and/or subsidiaries). Multiple entities may provide survey data and be part of the same distinct organization which is counted only once.
We gauge whether or not an organization "dominates" the analysis, i.e., if an organization's incumbents represent a disproportionate share of the sample. We test for and report on two tiers of dominance.
• Tier 1 organization dominance alert- at this level we alert the data user that a certain threshold of organization dominance has occurred and recommend that the user take this into account and/or also consider switching to organization weighted statistics.
• Tier 2 organization dominance masking- at this level we mask (suppress) all statistics except mean and median.
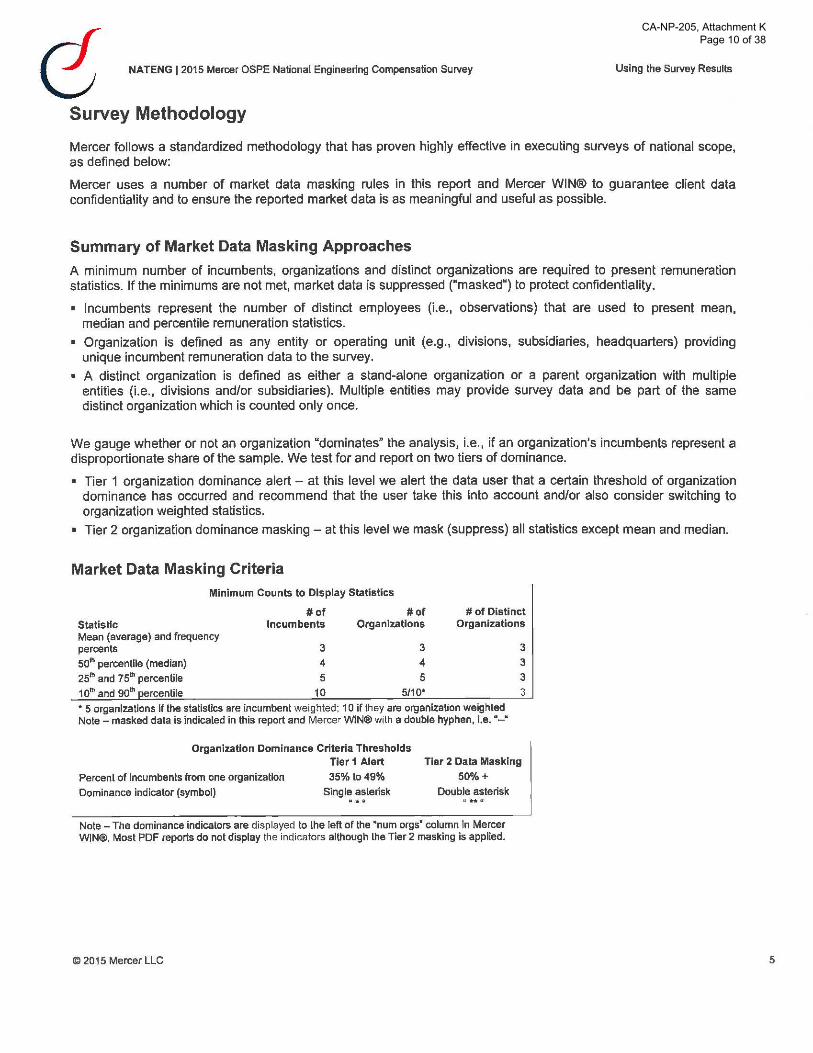
Market Data Masking Criteria Minimum Counts to Display Statistics
#of #of #of Distinct Statistic Incumbents Organ lu.tlons Organizations Mean (average) and frequency percents 3 3
sotn percentile (median) 4 4 251!> and 75th percentile 5 5 1 o"' and 90th ercentile 10 5/10*
• 5 organizations if the statistics are incumbent weighted; 10 if they are organization weighted Note- masked data is indicated in this report and Mercer WIN® with a double hyphen, i.e.·-·
3
3 3
3
Organization Dominance Criteria Thresholds Tier 1 Alert
Percent of incumbents from one organization
Dominance indicator (symbol)
35% to49%
Single asterisk
Tier 2 Data Masking
50%+ Double asterisk . . . ....
Note- The dominance indicators are displayed to the left of the "num orgs" column ln Mercer WIN®. Most PDF reports do not display the indicators although lhe Tier 2 masking is applied.
© 2015 Mercer LLC 5
CA-NP-205, Attachment K Page 11 of 38
NATENG 12015 Mercer OSPE National Engineering Compensation Survey Using the Survey Results
Peer Group Confidentiality
Peer groups {client defined subsets of this survey's participants) may be created in Mercer WIN®. To protect the confidentiality of survey participants, the following rules apply to creating and modifying peer groups.
Peer Group Minimums • Criteria Number of organizations
Number of distinct organizations
Number of organization peer groups lo vary by
Matching Positions
Minimum#
10
8
4
When using this survey to assess your current compensation levels against market practices, try to:
• Match your positions to engineering levels based on position content. Please refer to the uclassification Guide of Engineering Responsibility Levels" section of this report for more details on the positions surveyed.
• Recognize that your Incumbent need not perform all of the functions described in the survey position in order to have a valid match. If 80% of the responsibilities overlap, consider the match "Equal to". If one or several major responsibilities included in the level descriptions are not applicable to your position (or vice-versa), another match may be more appropriate.
• For hybrid positions, users of Mercer's reporting tool can blend positions easily and quickly to produce their own composite reports.
• Keep in mind that the survey has not been designed to cover every possible Professional Engineering position in your organization - the engineering responsibility levels are intended to be benchmarks, so please treat them accordingly. Engineers working in positions that exceed the scope described in Level F are not covered in this survey.
Analyzing Survey Results
Once you have determined that an engineering responsibility level is an appropriate umatch" for your position:
• Determine which positions are scope sensitive. Generally, the value of senior positions will vary based on organization-wide scope measures as well as individual scope measures. For these positions, comparisons should be based on the appropriate scope ranges. If a special analysis is needed, customized reports can be created in Mercer's reporting tool, at no additional charge.
• Determine which positions are location sensitive (generally the more junior positions). For these positions, consider using the regional analysis where a sufficient sample exists. In some cases, however, local and regional sample sizes are small and they may not accurately reflect the regional pay level. In such cases, additional data based on other parameters should complement the location data. It is suggested that you use all appropriate scope categories provided in the survey to analyze competitive pay levels for a particular position.
• Determine relevant compensation data - salary and/or total cash. Determine the appropriate statistics. UMean" pay is generally a higher figure than median pay, and has the advantage of being almost universally available in salary surveys. UMedian" is the middle rate; most compensation professionals prefer to make comparisons on this basis since it is less easily influenced by the extremes. Your firm's pay philosophy may make it more appropriate to compare at a percentile other than the median {50th percentile).
• Make the data comparable in time. Either age the survey data to bring it to the present, or make your comparisons based on your salaries at the effective date of the survey {June 1, 2015). (This can be automated in Mercer's reporting tool.)
• Wherever possible, identify more than one reliable source of data for each position. Industry and local salary surveys are good supplementary reference points.
© 2015 Mercer LLC 6

CA-NP-205, Attachment K Page 12 of 38
NATENG ]2015 Mercer OSPE National Engineering Compensation Survey Using the Survey Results
Aging the Data Effective Date: June 1, 2015
Since the data were collected for this report, changes may have occurred in the marketplace. Predictions regarding salary increase budgets can be used to uagen the data over the course of a year.
The following example ages data from June 1, 2015 to January 1, 2016 and assumes an annual salary increase budget of 3%:
1. Determine the monthly salary increase budget:
3% Annual Increase 12 Months
= 0.0025
This is the prorated monthly salary increase projection (MSIP).
2. Multiply the prorated MSIP by the number of months since the effective date of the report to obtain the aging factor. To age the data to January 1, 2015 multiply the MSlP (0.0025} by the 7 months elapsed time.
0.0025 X 7 = 0.0175
This is the aging factor.
3. To calculate the 7-month salary increase, multiply the chosen base salary by the aging factor and add this amount to the chosen base salary.
(Base Salary x Aging Factor) + Base Salary = Aged Salary
This approach is a reasonable predictor of salary growth when the economy is relatively stable. When the economy fluctuates significantly (innation/recession), figures should be adjusted to reflect those economic trends.
When using the survey results via Mercer's reporting tool, clients should refer to the "Set Aging" screen in order to apply an aging factor to the survey data. In the 2015 Mercer OSPE National Engineering Compensation Survey, the following fields can be aged: base salary, incentive granted($) and total cash compensation.
For salary planning budget information, Mercer's Compensation Planning Survey provides data to assist organizations in salary planning and budgeting. In addition to providing comprehensive coverage of forthcoming pay increases and structural adjustments, issues such as workforce planning, long-term and short-term incentive plan design and current economic conditions are addressed. For more information, please visit Mercer's website at www.imercer.ca/cps.
© 2015 Mercer LLC 7

CA-NP-205, Attachment K Page 13 of 38
NATENG 1 2015 Mercer OSPE National Engineering Compensation Survey Using lhe Survey Results
Terms and Definitions
Compensation Anelyala
Annual Baea salary
Num Orga Num Oba 10th '!loll• 15th 'llolle Median 75th 'llolle 90th 'lloila Mean
l Ba:~~ Salary-Inc. wtd. (All)
Ba:~~ Salary- Org wtd (All)
ea... Salary - (1/R)
Annual Incentives
Cf!- Incentive Granted (I) (1/R)
.. lncenlrve Granted ('llo of oase) (IIR)
Total Caoh Compenullon
I= Total Ca.tl -Inc. Wid (All)
Total Ca.tl -Org. Wtd. (All)
Total Ca.tl (UR)
Incentive Eligibility
4»-: Annual Incentive
N Oba 'llo Eligible
Definitions of variables and compensation data reported in the excel export file.
1-Num Orgs The number of organizations reporting information for the position.
2-NumObs. The number of observations or incumbents for which information is reported.
3- 1oth Percentile (Low Decile) The data point within the sample which is higher than 10% of all data reported.
4- 25th Percentile (1st Quartile) The data point within the sample which is higher than 25% of all data reported.
5- Median (5if' Percentile) The data point within the sample which is higher than 50% of all data reported (also known as the middle rate).
6- 75th Percentile (3rd Quartile) The data point within the sample which is higher than 75% of all data reported.
7- 90th Percentile (High Decile) The data point withrn the sample which is higher than 90% of all data reported
8- Mean (Average) The sum of the data reported divided by the number of data points in the sample (also known as the average).
9- Base Salary -Incumbent Weighted (All) Each incumbent's base salary information is given equal weight In the computation of the statistics. The results therefore reftect the inHuence of lhose organizations reporting multiple incumbents.
10- Base Salary - Orgamzation Weighted (All) Each organization's base salary information for a position Is averaged in order to obtain a single statistic for the organization. The results therefore reflect equal weighting for each organization.
11 - Base Salary- (1/R) Base salary for those incumbents who received an incentive in the past year- bonus and/or commission (excludes zero values).
@ 2015 Mercer LLC
12 - Incentive Granted ($) (1/R) Annual incentive or bonus payments granted, expressed in thousands of Canadian dollars, for lhose Incumbents who received an incentive in lhe past year (excludes zero values). Incentives may include bonuses, sales commissions, project bonuses. profit and gain sharing, lump sum merit pay or other performance related variable pay.
13- Incentive Granted (% of base) (1/R) Annual incentive or bonus payment granted, expressed as a percentage of base salary, for those incumbents who received an incentive in the past year (excludes zero values).
14- Total Cash -Inc. Wtd. (All) Annual base salary and incentives, if any. for all incumbents in the sample whether or not they were eligible for or received an incentive. Each incumbent Is given equal weight in the computation of the statistics. The results therefore reflect the influence of those organizations reporting multiple incumbents.
15- Total Cash- Org. IN!d. (All) Annual base salary and incentives, if any, for all incumbents in the sample whether or not they were eligible for incentives. Each organization's compensation rntormation for a position is averaged in order to obtain a single rate. The results therefore reflect equal weighting for each participating organization who matched the position.
16- Total Cash (1/R) Annual base salary and actual incentives paid, including profit sharing, other guaranteed payments and sales incentives for all incumbents who received at least one of the following incentives: profit sharing, annual incentives or sates incentives. Data are incumbent weighted.
17 - Annual Incentive The percentage of incumbents who are eligible for short-term incentives (bonuses).
B
CA-NP-205, Attachment K Page 14 of 38
NATENG J2015 Mercer OSPE National Engineering Compensation Survey
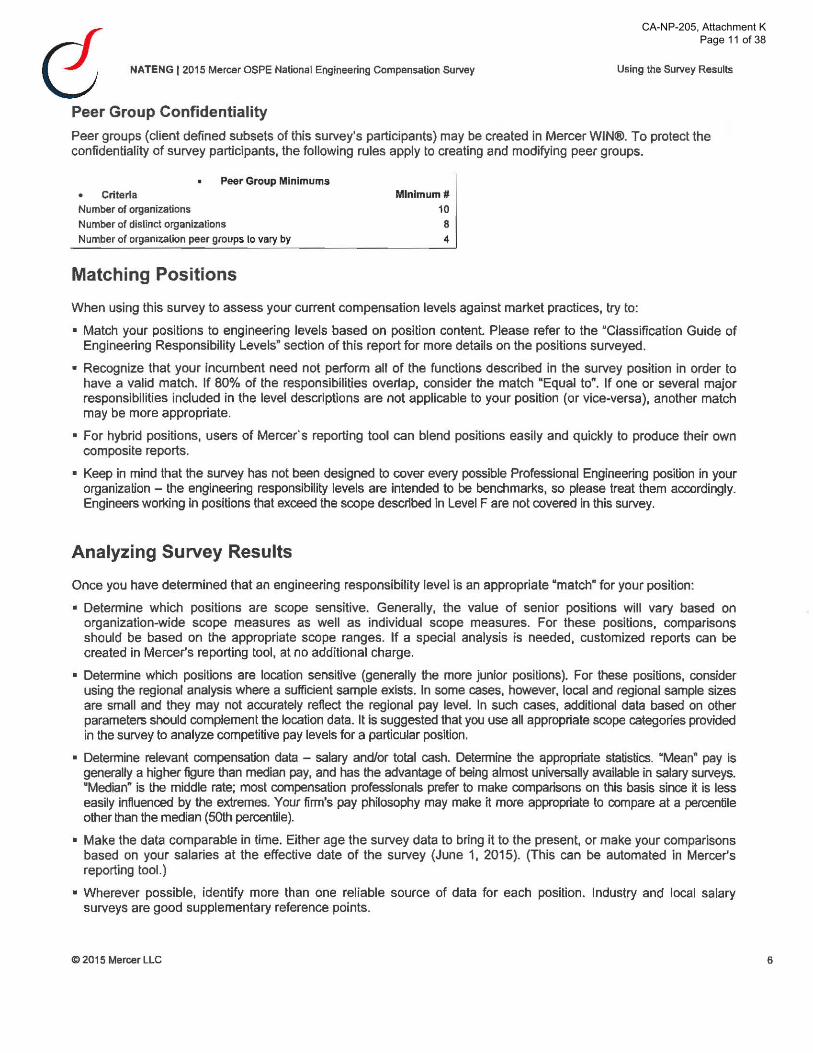
Eastern Canada Regions
QUEBEC
@ 2015 Mercer LLC
NEWFOUNDLAND AND LABRADOR
NEW BRUNSWICK
Using the Survey Resulls
9
CA-NP-205, Attachment K Page 15 of 38
NATENG 12015 Mercer OSPE National Engineering Compensation Sutvey Using the Sutvey Results
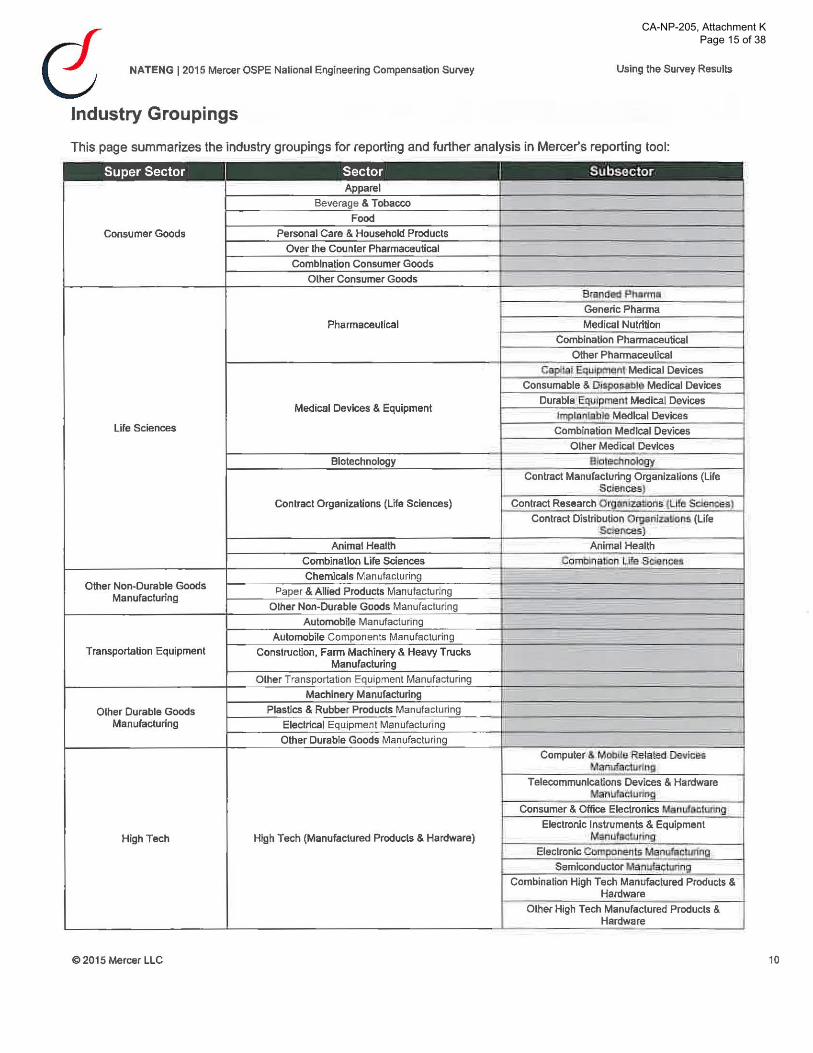
Industry Groupings
This page summarizes the industry groupings for reporting and further analysis in Mercer's reporting tool:
Super Sector I Sector I Subsector Apparel
Beverage & Tobacco
Food
Consumer Goods Personal Care & Household Products
Over the Counter Pharmaceutical
Combination Consumer Goods
Other Consumer Goods
9!illld$d P.llal"f11<1
Generic Pharma
Pharmaceutical Medical Nutrition
Combination Pharmaceutical
Other Pharmaceutical
Capital EqWpmenl Medical Devices
Consumable & D18po:>able Medical Devices
Medical Devices & Equipment Durable Equlpmept Medical Devices
lmptor'!liibla Medical Devices Life Sciences Combination Medical Devices
Olher Medical Devices
Biotechnology B loteclmology
Contract Manufacturing Organizalions (lire Sc11:mces)
Contract Organizations (Life Sciences) Contract Research Orgooizatlolis {Lire~ Sc:lan~l Contract Distribution OfWiruz;diOrtS (Life
Sclsn~l Animal Health Animal Health
Combinallon Life Sciences Comi'JII'Jallon L.ife ~li!l
Other Non-Durable Goods Chemicals Manufacturing
Paper & Allied Products Manufactunng Manufacturing
Olher Non-Durable Goods Manufacturing
Automobile Manufacturing
Automobile Components Manufacturing
Transportation Equipment Construction, Farm Machinery & Heavy Trucks !
Manufacturing
Other Transportation Equipment Manufacturing
Machinery Manufacturing
Olher Durable Goods Plastics & Rubber Products Manufacturing
Manufacturing Electrical Equipment Manufactunng
Other Durable Goods Manufacturing
Computef & MoDlle Related Dllvlces MetW!ar.:t:uf!ng
Telecommunications Devices & Hardware ManiJfal:Jurfn!l
Consumer & Office Electronics ManulriDllllll'lg
Electronic Instruments & Equipment
High Tech High Tech (Manufactured Products & Hardware) Manuta.cwnnsr Eleclronic Componelll5 Manuf11cWnng
Semiconductor M:IJlueCllmng Combination High Tech Manufactured Products &
Hardware
Other High Tech Manufactured Products & Hardware
©2015 Mercer LLC 10

CA-NP-205, Attachment K Page 16 of 38
NATENG 12015 Mercer OSPE National Engineering Compensation Survey Using the Survey Results
Super Sector 1 Sector l Subsector Business End User Applications Development
Consumer End User Applications Development
Systems Software Development
Design Software Development High Tech (Software & Virtual Products) Internet Services
Gaming Development
Combination High Tech Software & Virtual Products
Other High Tech Software & Virtual Products
IT Consulting Services & Solutions
IT Back Office Service (ITO)
Telecommunications Services High Tech Engineering Design Services
High Tech (Services) Data Analytics Services & Solutions
Web Design Services
Combination High Tech Services
Other High Tech Services
Combination High Tech Manufactured/Hardware & Combination High Tech Manufactured/Hardware SoftwareNirtual Products & SoftwareNirtual Products
Combination High Tech Manufactured/Hardware Combination High Tech Manufactured/Hardware Products & Services Products & Services
Combination High Tech SoftwareNirtual Products & Combination High Tech SoftwareNirtual Producls Services & Services
Combination All High Tech Products & Services Combination All High Tech Products & Services -Olher High Tech Products or Services Other High Tech Products or Services
Energy Fully Integrated
Energy Fully Integrated and Exploration & Production Energy Exploration & Production
Energy Exploration
Energy Production
Energy Services & Drilling Energy Services & Equipment
Energy Drilling
Energy Pipeline/Midstream Energy Pipeline/Midstream
Energy Refining/Processing
Energy Downstream Energy Marketing & Distribution
Energy Fully Integrated Downstream
Energy Energy Trading Energy Trading
Energy Power Generation
Energy Utilities Retail Utility
Fully Integrated Utility
Solar Energy
Alternative & Renewable Energy Wind Energy
Other Alternative or Renewable Energy
Combination Alternative or Renewable Energy
Energy Engineering. Procurement & Construction Energy Engineering, Procurement & Construction
Other Energy Public Sector
Other t=:fl;eliD' Base Metals Mining
Coal. Industrial & Other Materials Mining - -
Mining & Metals Gold Mining ·-
Precious Metals & Minerals Mintng (excluding Gold) ·-- ·-
Diversified Mining
© 2015 Mercer LLC 11

CA-NP-205, Attachment K Page 17 of 38
NATENG 12015 Mercer OSPE National Engineering Compensation Survey Using the Survey Results
-
Super Sector I Sector i Subsector Apparel/Accessories Retail - Family
Apparel/Accessories Retail- lnranls/Children
Apparel, Fashion, Footwear & Accessories Retail Apparel! Accessories Retail - Men
AppareVAccessories Retail - Women
Footwear/Shoes Retail
Combination Apparel & Accessories Retail
Department Stores Department Stores
Combination Electronics etc. Retail
Electronics Retail Electronics, Entertainment, Communications & Office
Entertainment Retail Retail
Communications Retail
Office Supply Retail
Grocery Retail
Grocery, Pharmacy & General Merchandise Retail Drug & Pharmacy Retail
General Merchandise Retail
Combination Grocery etc. Retail
Gas/Petro Retail
Convenience Retail Convenience Retail
Combination Gas/Petro & Convenience Retail
Hardware Retail
Retail & Wholesale Building Supplies Retail
Home, Hardware, Building & Garden Supply Retail Garden Supplies Retail
Other Home Products Retail
Combination Home, Hardware etc. Retail
Quick Service & Fast Food
Restaurants Fine Dining
Restaurant Chains
Automotive Dealers
Automotive Parts & Services Retail
Books/Music/Video Retail
Furniture & Home Furnishing Retail
Gifts/Novelties Retail
Specialty Retail Home Goods & Products Retail
Jewelry Retail
Luxury Retail
Salon/Personal Care Products Retail
Sporting Goods/Hobby Retail
Other Specialty Retail
Combination Specialty Retail
Wholesale Trade & Durable Goods
Wholesale Distribution Wholesale Trade & Non-Durable Goods
Wholesale Trade - Other or Combination
Automotive Financing
Consumer Finance - General
Consumer Finance - Mortgage
Consumer Finance & Retail Banking Credit Union
Home Equity/Real Estate Finance
Banking/Financial Services Credit Card Issuer
Retail Bank
Thrift (Savings Bank, Savings & Loan)
Commercial Bank Commercial Lending Commercial Finance (Commercial Loan,
Commercial Real Estate)
Universal (Diversified) Banking Universal (Diversified) Banking
© 2015 Mercer LLC 12

CA-NP-205, Attachment K Page 18 of 38
NATENG 12015 Mercer OSPE National Engineering Compensalion Survey Using the Survey Results
Super Sector I Sector I sulke~~ --Investment & Asset Management
Investment Investment Banking
Private EquityNenture Capital Investment
Banking/Financial Services Trust & Private Banking Trust & Private Banking
Financial Services Operations Financial Services Operations
Combination Banking/Financial Services Organizations Combination Banking/Financial Services
Organizations
Other Financial Services Other Financial Services
Life Insurance Life Insurance
Property & Casualty Insurance
Non-Life Insurance (Excluding Health & Medical) Workers Compensation Insurance
Combination Non-Life Insurers
Health & Medical Insurance Health & Medical Insurance
Insurance/Reinsurance Life and Property & Casualty Insurance Combination Life & Non-Life Insurers
Life & Other Non-Life Insurers
Reinsurance- Life Insurance
Reinsurance Reinsurance - Non-Life Insurance
Reinsurance - Combination Life & Non-Life Insurance
Business Process Outsourcing I
Business/Professional Services I -
Education . -··
Healthcare Services Services (Non-Financial)
Information & Data Processing Services ·--
Government/Public Administration & other Civic, Social Political or Religious Organizations
Services - Other or Combination
Agriculture. Forestry. Fishing & Hunting
Construction
Entertainment
Hospitality !
Other Non-Manufacturing Publishing I
Real Estate -· -
Research & Development .. ~
--- --··
Transportation & Warehousing
Water, Sewage & Other Systems -
Combination Other Non-Manufacturing "" "" .....
© 2015 Mercer LLC 13

CA-NP-205, Attachment K Page 19 of 38
NATENG 12015 Mercer OSPE National Engineering Compensation Survey Sample Overview
SAMPLE OVERVIEW
This section provides the broader market context that will enable users to gain a greater insight into this year's survey sample.
Sample Size by Engineering Responsibility Level The following table shows the number of incumbents for whom data were received for each engineering responsibility level:
Level Num Orgs Num Obs
All Levels 66 7,116
Level A 36 687
LevelS 39 1,980
Level C 46 2,234
Level D 37 1,312
Level E 41 661
LeveiF 17 242
Distribution of Incumbents by Location The incumbent distribution by geographic location is as follows:
City (N"'7,116) %of Sample
Fredericton 0.7
Galineau 0.6
Halifax 5.3
Labrador City 0.6
Longueuil 5.6
Moncton 0.2
Montreal 62.6
Quebec City 3.3
Rouyn-Noranda 0.8
Rural Eastern Quebec 0.4
Saint John 0.3
St. John's 2.3
Vai-D'Or 4.7
Other 14.3
Percents do not equal100% due to rounding.
Participant Distribution by Number of Engineers in Eastern Canada The following table illustrates the distribution of participant organizations based on the number of engineers they employ in Eastern Canada:
# of Engineer$ (N=32)
Under 10 Engineers
10 < 25 Engineers
25 < 75 Engineers
75 < 200 Engineers
200 Engineers and over
"k of Sample
37.5
9.4
15.6
18.8
18.8
Percents do not equal100% due to rounding.
© 2015 Mercer LLC 14
CA-NP-205, Attachment K Page 20 of 38
NATENG 1 2015 Mercer OSPE National Engineering Compensation Survey Sample Overview
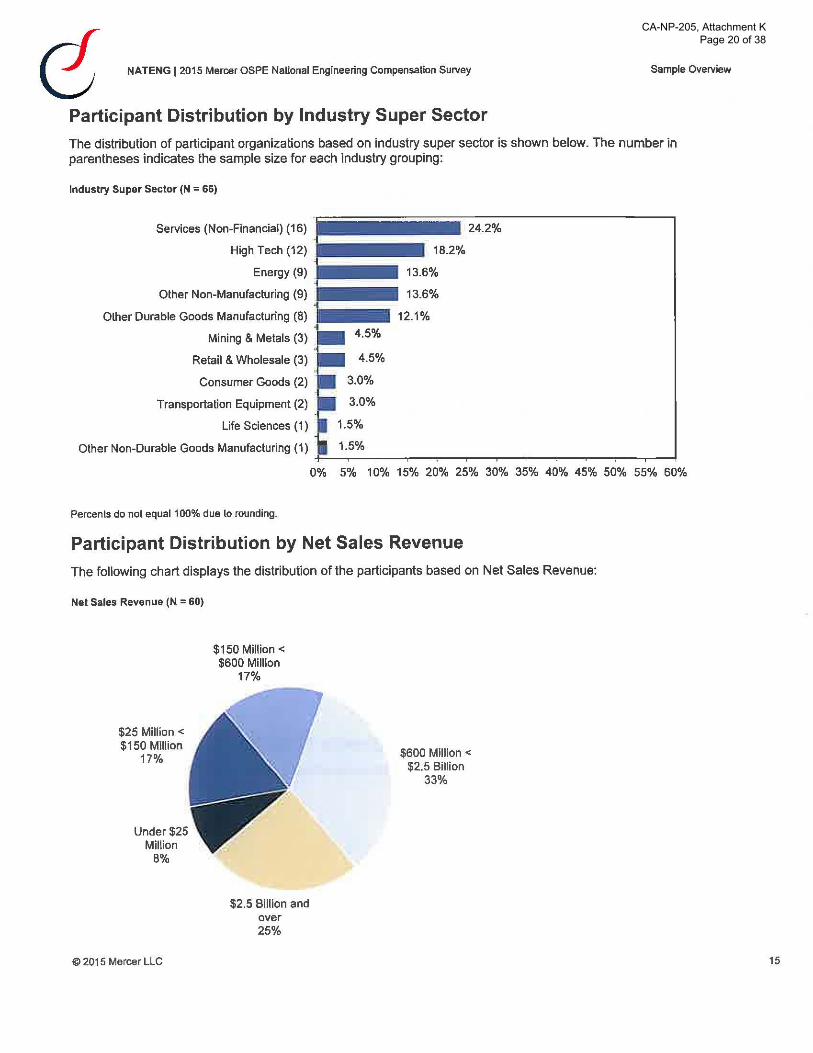
Participant Distribution by Industry Super Sector
The distribution of participant organizations based on industry super sector is shown below. The number in parentheses indicates the sample size for each industry grouping:
Industry Super Sector (N = 66)
Services (Non-Financial) (16) jiiiiiiiiiiiiiiiiif22;4~.2;%;;----------~
High Tech (12)
Energy (9) J•···· Other Non-Manufacturing (9)
Other Durable Goods Manufacturing (8) •••••
4.5%
4.5%
3.0%
3.0%
1.5%
18.2%
13.6%
13.6%
12.1%
Mining & Metals (3)
Retail & Wholesale (3)
Consumer Goods (2)
Transportation Equipment (2)
Life Sciences (1)
Other Non-Durable Goods Manufacturing (1) ~-~-~~--T--r-~-~-~-r--,-~-~
0% 5% 1 0% 15% 20% 25% 30% 35% 40% 45% 50% 55% 60%
Percents do not equal100% due lo rounding.
Participant Distribution by Net Sales Revenue
The following chart displays the distribution of the participants based on Net Sales Revenue:
Net Sales Revenue (N = 60)
$25 Million< $150 Million
17%
Under $25 Million
8%
@ 2015 Mercer LLC
$150 Million< $600 Million
17%
$2.5 Billion and over 25%
$600 Million< $2.5 Billion
33%
15

CA-NP-205, Attachment K Page 21 of 38
NATENG 12015 Mercer OSPE National Engineering Compensation Survey
Participant Distribution by Operating Expenses/Budget
The following chart displays the distribution of the participants based on Operating Expenses/Budget:
Operating Expenses/Budget (N = 31)
$150 Million< $600 Million
$25 Million< $150 Million
6%
Under$25 Million 16%
13% $600 Million<
$2.5 Billion 26%
$2.5 Billion and over 39%
Spread of Actual Years from Graduation
Sample Overview
The table below indicates the spread of actual years from graduation for each engineering responsibility level:
Year(s) from Graduation
Engineering Level # ofOrgs. #of Obs. 10th%ile 25th%11e 50th%ile 75th%ile 90th%ile
Level A 8 139 2 3 4 7
LevelS 9 166 4 5 7 9 12
Level C 16 229 6 7 10 13 19
LeveiD 14 177 9 11 15 20 26
LeveiE 16 157 12 16 21 29 34
LeveiF 11 115 16 21 27 33 37
@ 2015 Mercer LLC 16

CA-NP-205, Attachment K Page 22 of 38
NATENG 12015 Mercer OSPE National Engineering Compensation Survey Sample Overview
Standard Work Week
The following chart indicates the number of hours in a standard work week for engineers in Eastern Canada:
Standard Work Week (N::: 7,106)
© 2015 Mercer LLC
37.5 Hours/Week
33%
40 Hours/Week
61%
Other 35 5%
Hours/Week 1%
17
CA-NP-205, Attachment K Page 23 of 38
NATENG 12015 Mercer OSPE National Engineering Compensation Survey Summary Findings
SUMMARY FINDINGS
Survey Trends and Highlights
The 2015 Mercer OSPE National Engineering Compensation Survey results represent salary data submitted by 66 organizations covering more than 7,100 incumbents, across six engineering responsibility levels. Mercer reviews all data to ensure the matches are accurate but a large change in sample can impact data.
Services (Non-Financial) Is the single largest category of employer in the survey; with more than quarter (25.7%) of employees falling into this industry super sector.
Mercer's presentation of findings is based on incumbent weighted statistics, unless otherwise noted. Organization weighted statistics are available in Mercer's reporting tool. The impact of sample size is a key consideration for the interpretation of survey data. II is important to use key scoping information. including industry, geographical region and company size when analyzing survey results from year to year.
When reviewing these results, users may find that pay levels for a particular engineering responsibility level are affected by a single employer that has matched a large number of engineers. We recommend that, where possible, users review organization weighted as well as incumbent weighted data in their analyses.
Consider the following: • Reviewing the data for the Consulting (client-facing) job type for Engineer level E, the median incumbent weighted base salary
is $107,765 while the organization weighted base salary is $119,878. This example demonstrates that the data reported have been impacted by one or two organizations with a few incumbent matches that are skewing incumbent weighted statistics.
© 2015 Mercer LLC 18

CA-NP-205, Attachment K Page 24 of 38
NATENG 12015 Mercer OSPE National Engineering Compensation Survey Summary Findings
Base Salary & Total Cash Compensation by Level The graph and table below illustrate average base salary and total cash compensation by engineering responsibility level:
$140 ,000
$120,000
$100,000 c: .!2 iii $80,000 1/) c: Q) c.. E $60,000 0 u c: nl Q)
$40,000 :a
$20,000 Level A
Base Salary & Total Cash Compensation by Engineering Responsibility Level
LevelS LeveiC LeveiD LeveiE
• Total Cash
• Base Salary
LeveiF
Base Salary & Total Cash Compensation by Industry Super Sector The following graph illustrates average base salary and total cash compensation by industry super sector for all engineering responsibility levels combined.
All Levels Combined Base Salary & Total Cash Compensation
by Primary Industry • Total Cash • Base Salary
$14o,ooo r ---------------------------------- - ----.
$120,000
c: $100,000 .!2 iii ~ $80,000 Q) c.. E $60,ooo 8 ~ $40,000 Q)
:a $20,000 ·
Consumer Goods
© 201 5 Mercer LLC
Energy High Tech Life Mining Other other Other Retail ServicesTransportation Sciences & Metals Durable Non-Durable Non-Mfg & (Non Equipment
Goods Mfg Goods Mfg Wholesale -Financial)
19

CA-NP-205, Attachment K Page 25 of 38
1: 0
:.:; ro rJ)
1: Q) a. E 0 0 1: ro Q)
~
NATENG 12015 Mercer OSPE Nallonal Engineering Compensation Survey Summary Findings
Base Salary & Total Cash Compensation by Job Type The following graphs show mean base salary and total cash compensation by job type for all incumbents and at each responsibility level:
All Levels Combined Base Salary & Total Cash Compensation by Job Type
• Total Cash
• Base Salary
$140,000
~120,000
~100,000
$80,000 -
$60,000 .
$40,000
$20,000 Admin. CS+IT C+l Cons. Cust. Enviro Main!. Mgml Mfg. Mrkt'g R+D QC Supl. T +E .., ·
• Administration and Support
• Computer Systems and Information Technology
• Construction and Installation
• Consulting (client-facing)
• Customer Support Service (Post-Sales Technical Assistance)
• Environmental, Health and Safety
• Maintenance and Servicing
© 2015 Mercer LLC
• Management
• Manufacturing, Operations and Production
• Marketing and Sales
• Research, Development and Design
• Quality Control and Quality Assurance
• Supply Chain Engineering (Logistics, Procurement and Contracts)
• Teaching, Training and Education
20

CA-NP-205, Attachment K Page 26 of 38
NATENG J2015 Mercer OSPE National Engineering Compensalion Survey Benefits and Turnover
Benefits Plans and Practices for Engineers
The following tables describe benefits plans and practices reported by 127 participating organizations in the survey. The categories of basic benefits in the survey (Health, Dental, Vision, Disability, and Life) are provided by the vast majority of organizations.
All participating organizations (N = 127) report that part-time engineers are eligible to receive benefits.
Thirty-nine percent of organizations self-insure health benefits, and 44% self-insure dental benefits.
Prevalence of Benefits for Engineers
Industry Sector
All Data
Banking/Financial Services
Consumer Goods
Energy
High Tech
Insurance/Reinsurance
Life Sciences
Mining & Metals
Other Durable Goods Manufacturing
Other Non-Durable Goods Manufacturing
Other Non-Manufacturing
Retail & Wholesale
Services {Non-Financial)
Transportation Equipment
Extended Health Coverage
N %of0rgs
121 95%
0 -%
0 -%
15 94%
19 100%
0 -%
2 -%
5 100%
7 88%
4 60%
10 91%
-%
52 96%
6 100%
Short-term Disability I
Dental Coverage
N % ofOrgs
120 94%
0 -%
0 -%
15 94%
19 100%
0 -%
2 -%
5 100%
8 100%
5 100%
11 100%
-%
49 91%
5 83%
VIsion Care
N % ofOrgs
106 65%
0 -%
0 -%
15 94%
19 100%
0 -%
2 -%
5 100%
6 75%
3 60%
9 82%
0 -%
45 83%
4 67%
Salary Continuance Long-term Disability Basic life Insurance
Industry Sector
All Data
Banking/Financial Services
Consumer Goods
Energy
High Tech
Insurance/Reinsurance
Life Sciences
Mining & Metals
Other Durable Goods Manufacturing
Other Non-Durable Goods Manufacturing
Other Non-Manufacturing
Retail & Wholesale
Services (Non-Financial)
Transportation Equipment
© 2015 Mercer LLC
N "k ofOrgs
104 82%
0 -%
0 -%
14 88%
18 95%
0 -%
-%
5 100%
6 75%
5 100%
9 82%
-%
40 74%
5 83%
N % ofOrgs N % ofOrgs
121 95% 125 98%
0 -% 0 -%
0 -% 0 -%
15 94% 16 100%
18 95% 19 100%
0 -% 0 -%
2 -% 2 -%
5 100% 5 100%
6 100% B 100%
5 100% 5 100%
11 100% 11 100%
-% 1 -%
51 94% 52 96%
5 83% 6 100%
21

CA-NP-205, Attachment K Page 27 of 38
NATENG 1 2015 Mercer OSPE National Engineering Compensation Survey Benefits and Turnover
Benefits Plans and Practices for Engineers
With the exception of Long-term Disability Insurance, participating companies tend to cover the entire cost of benefits offered. The table below outlines the Mean and Median company share of benefits cost. The Employee's Share of the cost can be calculated as 100% less the Company Share.
Cost Sharing of Benefits for Engineers
Extended Health Coverage Dental Coverage Vision Care
Company Share Company Share Company Share
Industry Sector N Mean Median N Mean Median N Mean Median
All Data 110 86.4% 100.0% 107 86.0% 100.0% 91 83.5% 100.0%
Banking/Financial Services 0 -% -% 0 -% -% 0 -% -%
Consumer Goods 0 -% -% 0 -% -% 0 -% -%
Energy 13 90.8% 100.0% 13 85.8% 100.0% 12 91.7% 100.0%
High Tech 18 80.0% 97.5% 18 83.5% 100.0% 17 77.6% 100.0%
Insurance/Reinsurance 0 -% -% 0 -% -% 0 -o/o -% Life Sciences 2 -% -% --% --% -% -%
Mining & Metals 3 93.3% -% 3 100.0% -% 2 -% -%
Other Durable Goods Manufacturing 6 90.8% 100.0% 7 85.0% 100.0% 6 94.2% 100.0%
Other Non-Durable Goods Manufacturing 3 95.0% -% 4 92.5% 92.5% 2 -% -%
Other Non-Manufacturing 9 88.3% 100.0% 9 91.8% 100.0% 7 78.6% 100.0%
Retail & Wholesale - % -% - % -% 0 -% -%
Services (Non-Financial) 49 87.9% 100.0% 46 84.7% 100.0% 40 80.9% 100.0%
Transportation Equipment 6 93.7% 100.0% 5 96.4% 100.0% 4 95.5% 100.0%
Short-tenn Disability I Basic Salary Continuance Long-tenn DlsabiUty Life Insurance
Company Share Company Share Company Share
Industry Sector N Mean Median N Mean Median N Mean Median
All Data 91 83.8% 100.0% 109 50.0% 50.0% 111 80.9% 100.0%
Banking/Financial Services 0 --% -% 0 --% -% 0 -% - %
Consumer Goods 0 --% -% 0 --% -% 0 -% -%
Energy 12 93.8% 100.0% 12 70.8% 100.0% 12 95.8% 100.0%
High Tech 17 79.4% 100.0% 17 35.3% 0.0% 18 80.6% 100.0%
Insurance/Reinsurance 0 -% -% 0 -% -% 0 -% -%
Life Sciences -% - % 2 -% --% 2 -% -%
Mining & Metals 3 100,0% -% 3 61.7% - % 3 66.7% -%
Other Durable Goods Manufacturing 5 90.0% 100.0% 8 81 .3% 100.0% B 88.8% 100.0%
Olher Non-Durable Goods Manufacturing 4 96.3% 100.0% 4 58.6% 67.5% 4 96.3% 100.0%
Olher Non-Manufacturing 7 86.1% 100.0% 10 68.5% 84.2% 9 72.2% 100.0%
Retail & Wholesale 1 -% -% -% -% 1 -% -%
Services (Non-Financial) 36 76.4% 100.0% 47 38.3% 0.0% 48 75.5% 100.0%
Transportation Equipment 5 100.0% 100.0% 5 60.0% 100.0% 6 100.0% 100.0%
Employee Share can be calculated by subtracting Company Share from 100%.
© 2015 Mercer LLC 22

CA-NP-205, Attachment K Page 28 of 38
NATENG 1 2015 Mercer OSPE National Engineering Compensation Survey Benefits and Turnover
Benefits Plans and Practices for Engineers
The table below outlines the prevalence of various levels of maximum annual amounts for vision care.
Maximum Annual Amount for Vision Care
Over 0$ 150$ 200$ 300$ 300$ Other
Industry Sector N % ofOrgs % ofOrgs % ofOrgs % ofOrgs % ofOrgs %of Orgs
All Data 100 4% 17% 30% 10% 7% 32%
Banking/Financial Services 0 -% -% -% -% -% -%
Consumer Goods 0 -% -% -% -% -% -%
Energy 15 0% 13% 33% 13% 13% 27%
High Tech 16 0% 22% 33% 6% 11% 28%
lnsu ranee/Reinsurance 0 -% -% -% -% -% -%
Life Sciences 2 -% -% -% -% -% -%
Mining & Metals 5 0% 40% 20% 0% 0% 40%
Other Durable Goods Manufacturing 6 0% 17% 67% 17% 0% 0%
Other Non-Durable Goods Manufacturing 2 --% -% -% -% -% -%
Other Non-Manufacturing B 0% 25% 25% 25% 13% 13%
Retail & Wholesale 0 -% -% -% -% -% -%
Services (Non-Financial) 40 10% 10% 23% 10% 5% 43%
Transportation Equipment 4 0% 25% 50% 0% 0% 25%
Fifty-six percent of organizations require their employees to make a co-payment on prescription drugs, and 12.5% indicated that they have a cap or maximum on prescription drug coverage.
Employee Co-Payments for Prescription Drugs
Employees Required Have Cap or Max Prescription to Make Co-Payment Max Coverage Drug Coverage Amount
Industry Sector N % ofOrgs N % ofOrgs N Mean Median
All Data 69 56% 15 13% 11 2,076.8 1,200.0
Banking/Financial Services 0 -% 0 -% 0
Consumer Goods 0 -% 0 --% 0
Energy 3 19% 7% 0
High Tech 8 42% 5%
Insurance/Reinsurance 0 -% 0 -% 0
Life Sciences 0 -% 0 -% 0
Mining & Metals 4 100% 0 0% 0
Other Durable Goods Manufacturing 5 63% 4 57% 3 1,193.3
other Non-Durable Goods Manufacturing 3 75% 0 0% 0
Other Non-Manufacturing 7 64% 0 0% 0
Retail & Wholesale -% 0 -% 0
Services (Non-Financial) 35 66% g 18% 7 2,041.0 1,200.0
Transportalion Equipment 3 60% 0 0% 0
© 2015 Mercer LLC 23
CA-NP-205, Attachment K Page 29 of 38
NATENG 1 2015 Mercer OSPE National Engineering Compensation Survey Benefits and Turnover
Benefits Plans and Practices for Engineers
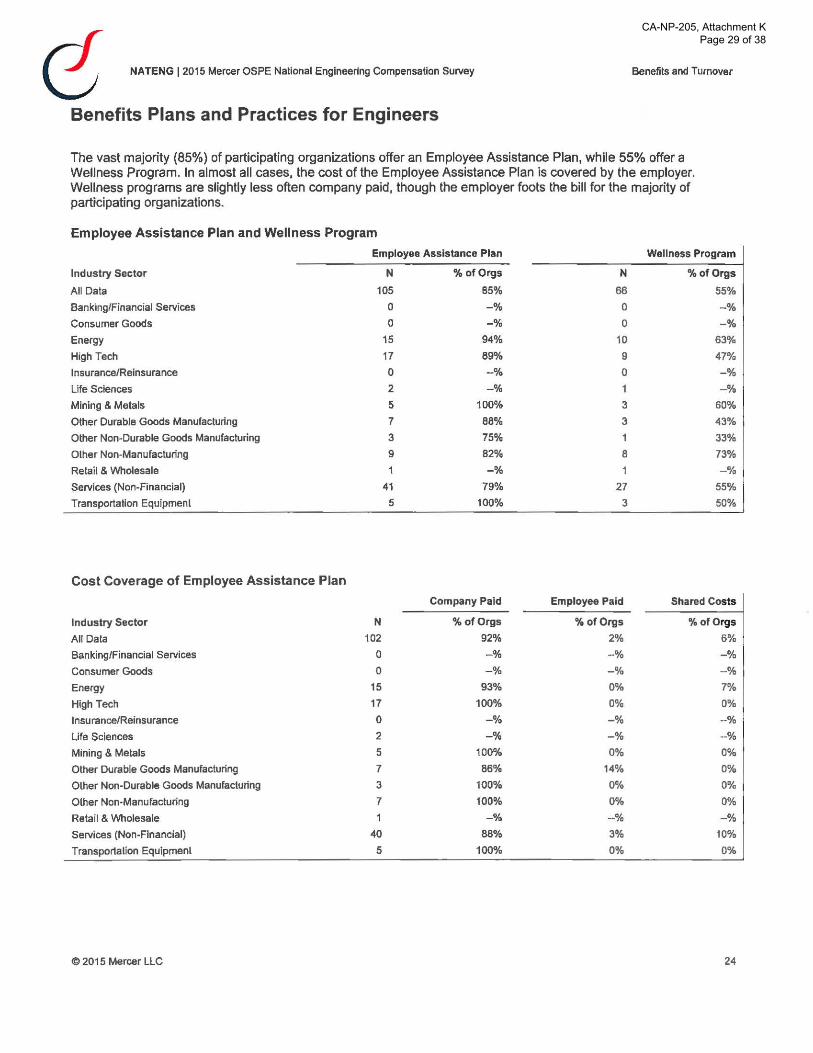
The vast majority (85%) of participating organizations offer an Employee Assistance Plan, while 55% offer a Well ness Program. In almost all cases, the cost of the Employee Assistance Plan is covered by the employer. Wellness programs are slightly less often company paid, though the employer foots the bill for the majority of participating organizations.
Employee Assistance Plan and Well ness Program
Employee Assistance Plan Wellness Program
Industry Sector N % ofOrgs N %ofOrgs
All Data 105 85% 66 55%
Banking/Financial Services 0 -% 0 -%
Consumer Goods 0 -% 0 -%
Energy 15 94% 10 63%
High Tech 17 89% 9 47%
Insurance/Reinsurance 0 -% 0 -%
Life Sciences 2 -% -%
Mining & Metals 5 100% 3 60%
Other Durable Goods Manufacturing 7 BB% 3 43%
Other Non-Durable Goods Manufacturing 3 75% 1 33%
Other Non-Manufacturing 9 82% 8 73%
Retail & Wholesale -% -%
Services (Non-Financial) 41 79% 27 55%
Transportation Equipment 5 100% 3 50%
Cost Coverage of Employee Assistance Plan
Company Paid Employee Paid Shared Costs
Industry Sector N %of0rgs % ofOrgs o/oofOrgs
All Data 102 92% 2% 6%
Banking/Financial Services 0 -% ·-% -%
Consumer Goods 0 -% -% -%
Energy 15 93% 0% 7%
High Tech 17 100% 0% 0%
Insurance/Reinsurance 0 -% -% --%
Life Sciences 2 -% -% --%
Mining & Metals 5 100% 0% 0%
Other Durable Goods Manufacturing 7 86% 14% 0%
Other Non-Durable Goods Manufacturing 3 100% 0% 0%
Other Non-Manufacturing 7 100% 0% 0%
Retail & Wholesale -% --% -%
Services (Non-Financial) 40 88% 3% 10%
Transportation Equipment 5 100% 0% 0%
@ 2015 Mercer LLC 24

CA-NP-205, Attachment K Page 30 of 38
NATENG 12015 Mercer OSPE National Engineering Compensation Survey Benefits and Turnover
Benefits Plans and Practices for Engineers
Cost Coverage of Wellness Program
Company Paid Employee Paid Shared Costs
Industry Sector N % ofOrgs % ofOrgs % ofOrgs
All Data 64 78% 5% 17%
Banking/Financial Services 0 -% -% -%
Consumer Goods 0 -% -% -%
Energy 10 80% 0% 20%
High Tech 9 67% 11% 22%
Insurance/Reinsurance 0 -% -% -%
Life Sciences --% -% -%
Mining & Metals 3 100% 0% 0%
Olher Durable Goods Manufacturing 3 33% 33% 33%
Other Non-Durable Goods Manufacturing -% -% -%
Other Non-Manufacturing 7 71% 14% 14%
Retail & Wholesale -% --% -%
Services (Non-Financial) 27 85% 0% 15%
Transportation Equipment 2 -% -% -%
© 2015 Mercer LLC 25

CA-NP-205, Attachment K Page 31 of 38
NATENG 12015 Mercer OSPE National Engineering Compensation Survey Benefits and Turnover
Benefits Plans and Practices for Engineers
Approximately two in five (39%) participating organizations offer a Healthcare Spending Account. The table below outlines the prevalence of this benefit practice and summary statistics of the maximum annual amount.
Healthcare Spending Account
".4 of Organizations Maximum Annual Amount Offering Healthcare
Industry Sector N Spending Account N Mean Median
All Data 126 39% 40 904.2 500.0
Banking/Financial Services 0 --% 0
Consumer Goods 0 -% 0
Energy 16 31% 4 800.0 350.0
High Tech 19 32% 5 620.0 450.0
Insurance/Reinsurance 0 -% 0
Life Sciences 2 -% 0
Mining & Metals 5 80% 3 583.3
Other Durable Goods Manufacturing B 13% 1
Other Non-Durable Goods Manufacturing 5 60% 2
Other Non-Manufacturing 11 45% 4 500.5 625.0
Retail & Wholesale 1 -% 0
Services (Non-Financial) 53 43% 21 1,062.6 800.0
Transportation Equipment 6 33% 0
© 2015 Mercer LLC 26

CA-NP-205, Attachment K Page 32 of 38
NATENG 12015 Mercer OSPE National Engineering Compensation Survey Benefits and Turnover
Benefits Plans and Practices for Engineers
Most (77%) participating organizations have a required minimum number of hours worked to determine eligibility for benefits. On average, the minimum requirement is 24.5 hours worked per week.
Minimum Hours Worked to Determine Eligibility for Benefits
"k of Organizations Minimum Weekly Hours Requiring a Minimum
Industry Sector N Number of Hours Worked N Mean Median
All Data 119 77% 89 24.5 24.0
Banking/Financial Services 0 -% 0
Consumer Goods 0 -% 0
Energy 15 67% 9 26.2 30.0
High Tech 19 95% 18 22.4 20.0
Insurance/Reinsurance 0 --% 0
Life Sciences 2 -% 2
Mining & Metals 5 100% 5 23.8 20.0
Other Durable Goods Manufacturing 6 83% 5 28.4 30.0
Other Non-Durable Goods Manufacturing 4 25%
Other Non-Manufacturing 9 67% 6 22.2 23.3
Retail & Wholesale -%
Services (Non-Financial) 52 77% 38 24.5 23.3
Transportation Equipment 6 67% 4 27.5 30.0
@ 2015 Mercer LLC 27
CA-NP-205, Attachment K Page 33 of 38
NATENG 12015 Mercer OSPE National Engineering Compensation Survey Benefits and Turnover
Benefits Plans and Practices for Engineers
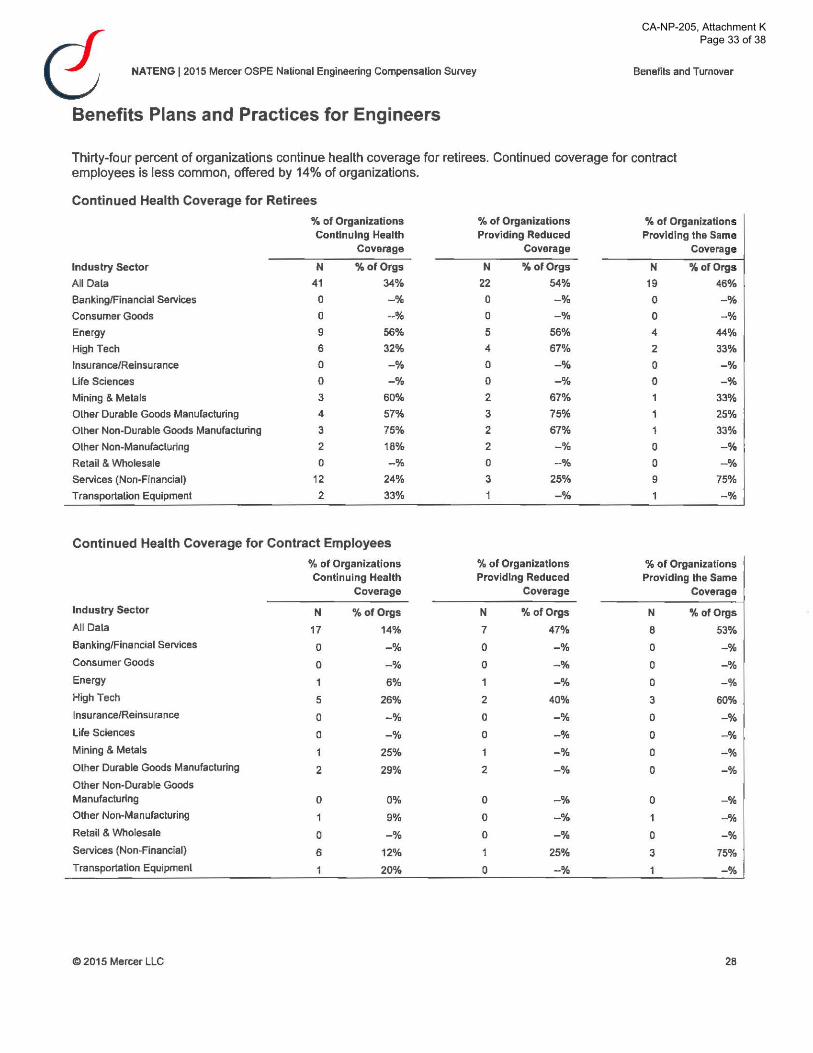
Thirty-four percent of organizations continue health coverage for retirees. Continued coverage for contract employees is less common, offered by 14% of organizations.
Continued Health Coverage for Retirees
% of Organizations % of Organizations % of Organizations Continuing Health Providing Reduced Providing the Same
Coverage Coverage Coverage
Industry Sector N %of0rgs N ".4 of Orgs N %of0rgs
All Data 41 34% 22 54% 19 46%
Banking/Financial Services 0 -% 0 -% 0 -% Consumer Goods 0 ·-% 0 -% 0 -% Energy 9 56% 5 56% 4 44%
High Tech 6 32% 4 67% 2 33%
Insurance/Reinsurance 0 -% 0 -% 0 -%
Life Sciences 0 -% 0 -% 0 -% Mining & Metals 3 60% 2 67% 33%
Other Durable Goods Manuracturing 4 57% 3 75% 25%
Other Non-Durable Goods Manufacturing 3 75% 2 67% 33%
Other Non-Manufacturing 2 18% 2 -% 0 -%
Retail & Wholesale 0 -% 0 --% 0 -%
Services (Non-Financial) 12 24% 3 25% 9 75%
Transportation Equipment 2 33% -% - %
Continued Health Coverage for Contract Employees
% of Organizations % of Organizations %of Organizations Continuing Health Providing Reduced Providing the Same
Coverage Coverage Coverage
Industry Sector N %of0rgs N % ofOrgs N % ofOrgs
All Data 17 14% 7 47% 8 53% Banking/Financial Services 0 -% 0 -% 0 -% Consumer Goods 0 -% 0 --% 0 -% Energy 6% 1 -% 0 -% High Tech 5 26% 2 40% 3 60% Insurance/Reinsurance 0 -% 0 -% 0 -% Life Sciences 0 -% 0 -% 0 - % Mining & Metals 25% 1 -% 0 -% Other Durable Goods Manufacturing 2 29% 2 -% 0 -% Other Non-Durable Goods Manufacturing 0 0% 0 -% 0 - % Other Non-Manufacturing 9% 0 -% -% Retail & Wholesale 0 -% 0 -% 0 -% Services (Non-Financial) 6 12% 25% 3 75% Transportation Equipment 20% 0 -% -%
@ 2015 Mercer LLC 26

CA-NP-205, Attachment K Page 34 of 38
NATENG 12015 Mercer OSPE National Engineering Compensation Survey Benefits and Turnover
Engineer Turnover Rates
Failure to retain critical talent can prove to be very costly to any organization. This is especially true when referring to highly skilled or specialized employees such as engineers. The section below summarizes turnover rates as reported in this years' survey and the primary reasons engineers left their organization. Wherever possible, summary statistics are broken out by gender and engineering level.
Actual annual turnover rate, for the period of January 1, 2014 to December 31, 2014, was calculated as follows:
(1) Calculate the average number of engineers:
~ Determine the number of engineers at the end of each month in the reporting period. ~Add the number of engineers at the end of each month for the 12~month reporting period. Exclude contractor staff.
- Divide this number by 12.
(2) Divide the total number of terminations and/or separations for the period by the average number of engineers and multiply by 100.
Seventy~four percent of participating organizations have multiple paths for career advancement of engineers.
Voluntary Turnover and Multiple Career Paths
Career Paths (N = 103) N
Single Career Path
Dual Career Path
More than Two Career Paths
Percents do not equal1 00% due to rounding.
26
57
20
%0rgs
25%
55%
19%
Turnover Rates by Responsibility level and Gender
Engineering Responsibility Level
A
B
c D
E
F All Levers
Engineering Responsibility Level
A
B
c D
E
F
All Levels
© 2015 Mercer LLC
N
33
40
43
40
35
33
59
N
31
40
41
39
35
33
58
Male
Mean Median
2.27% 0.00%
1.21% 0.00%
2.76% 1.00%
1.88% 0.30%
0.41% 0.00%
1.11% 0.00%
4.46% 3.00%
Male
Mean Median
0.46% 0.00%
0.31% 0.00%
0.71% 0.00%
0.49% 0.00%
0.38% 0.00%
0.16% 0.00%
1.59% 0,07%
Voluntary Turnover%
Female
N Mean Median
32 1.02% 0.00%
35 0.90% 0.00%
35 1.09% 0.00%
31 0.27% 0.00%
27 0.07% 0.00%
26 1.29% 0.00%
54 1.70% 1.00%
Involuntary Turnover%
Female
N Mean Median
31 0.04% 0.00%
34 0.01% 0.00%
34 0.01% 0.00%
32 0.21% 0.00%
27 0.01% 0.00%
26 0.00% 0.00%
51 0.36% 0.00%
29

CA-NP-205, Attachment K Page 35 of 38
NATENG 12015 Mercer OSPE National Engineering Compensation Survey Benefits and Turnover
Engineer Turnover Rates
Total Turnover% Engineering
Responsibility Male Female
Level N Mean Median N Mean Median
A 34 2.63% 0.00% 34 0.89% 0.00%
B 42 1.58% 0.00% 37 0.90% 0.00%
c 44 3.29% 1.00% 37 1.16% 0.00%
D 41 2.17% 0.00% 34 0.58% 0.00%
E 36 0.81% 0.00% 31 0 .25% 0.00%
F 36 1.18% 0.00% 31 1.08% 0.00%
All Levels 64 6.65% 4.00% 57 2.05% 0.58%
The table below indicates the primary reasons provided for Voluntary Turnover. Though the small sample size makes it difficult to draw conclusions with certainty, females appear less likely to report leaving due to Base Salary or Poor Fit with Job/Organization than males.
Reasons for Voluntary Turnover
Male Female Both
Reasons for Laavlng (N = 65) N % ofOrgs N % ofOrgs N % ofOrgs
Compensation 6 12.8% 2 7.1% 7 20.6%
Base Salary 11 23.4% 3 10.7% 9 26.5%
Variable Pay 0 0 .0% 0 0.0% 0 0 .0%
Benefits 3 6.4% 0 0.0% 0 0.0%
Personal 1 2.1% 3.6% 2 5.9%
Lack of Work/life Balance 2 4.3% 3.6% 7 20.6%
Personal/family 11 23.4% 6 21.4% 13 38.2%
Relocation 10 21 .3% 6 21.4% 13 38.2%
Career 1 2.1% 3.6% 2 5.9%
Poor fit with job 9 19.1% 2 7 .1% 3 8.8%
Career Change 11 23.4% 6 21.4% 12 35.3%
Job Satisfaction 7 14.9% 2 7 .1% 7 20.6%
Lack of career/training opportunities 6 12.8% 3 10.7% 9 26.5%
Return to school 5 10.6% 5 17.9% 7 20.6%
Organization 1 2.1% 2 7.1% 1 2.9%
Job Security 2 4.3% 0 0.0% 2 5.9%
Poor lit with organization 8 17.0% 3.6% 4 11 .8%
Relationship with direct supervisor/manager 2.1% 0 0 .0% 3 8 .8%
Trust/confidence in leadership 2 .1% 0 0.0% 1 2.9%
Uncertainty about organization's future 2.1% 0 0.0% 2 5.9%
Other 12 25.5% 5 17.9% 6 17.6%
Three responses were allowed for each respondent; therefore, the sum of the percent of organizations may be greater than 100%.
Other includes: Retirement; maternity leave, other leave; expats returned to country of origin; employee returning to home country; better opportunity at competitor; shortage of work; reorganization/retrenchment; lack of recognition; switch from consulting to industry; undisclosed.
© 2015 Mercer LLC 30

CA-NP-205, Attachment K Page 36 of 38
NATENG 12015 Mercer OSPE National Engineering Compensation Survey Engineering Responsibility Levels
Classification Guide of Engineering Responsibility Levels
(Reproduced with the permission of the Ontario Society of Professional Engineers)
Level of Respon~i!.!_tt_~-~ L.EV.:..E::.L.::...;....A:.__ _________ L_E_V_E_L_B _________ ----::-L-:-EV,.--,-EL_C ________ --j $56,227 $69,594 $88,874 Median Base
25th -75th %'i~l·e------- ~---- - - - - -- - -~-------------------l $53,820~$62, 1 OD
----., o'" - 9o'h %'ne- - -~ - $49,998-$70,228 ~-----~-------~-'---'--'----:-------:------,---------:-:-----:-:--------:--------::------:--------=-------:-:-------,--------l
Duties Receives training in the various Normally regarded as a continuing Generally would be a fully
Recommendations, Decisions and Commitments
Supervision Received
Leadership Authority and/or Supervision Exercised
Guide to Entrance Qualifications
phases of office, plant, field or portion of an engineer's training qualified professional engineer. laboratory engineering work as and development. Receives Carries out responsible and varied classroom instruction or on-the- assignments of limited scope and engineering assignments requiring job assignments. Tasks assigned complexity, usually minor phases general familiarity with a broad Include: preparation of simple of broader assignments. Uses a field of engineering and plans, designs, calculations, costs variety of standard engineering knowledge of reciprocal effects of and bills of material in accordance methods and techniques in the work upon other fields. with established codes, standards, solving problems. Assists more Problems usually solved by use of drawings or other specifications. senior engineers In carrying out combination of standard May carry out routine technical technical tasks requiring accuracy procedures, modification of surveys or inspections and in calculations, completeness of standard procedures, or methods prepare reports. data and adherence to prescribed developed in previous
Few technical decisions called for and these will be of routine nature with ample precedent or clearly der.ned procedures as guidance.
Works under close supervision. Work Is reviewed for accuracy and adequacy and conformance with prescribed procedures.
May assign and check work of one to live technicians or helpers. Does not supervise junior engineers.
Bachelor's degree in Engineering or Applied Science or its equivalent with zero to two years experience. Will not likely have their P.Eng.
testing, analysis, design or assignments. Participates in computation methods, planning to achieve prescribed
objectives.
Recommendations limited to solu lion of the problem rather than end results. Decisions made are normally within established guidelines.
Duties areassigned with detailed oral and occasionally written instructions, as to methods and procedures to be followed. Results are usually reviewed in detail and technical guidance is usually available.
May give technical guidance to one or two junior engineers or technicians assigned to work on a common project.
Bachelor's degree in Engineering or Applied Science or its equivalent, normally with two to four years working experience from the graduation level. May have a P.Eng.
Makes Independent studies, analyses, interpretations and conclusions. Difficult. complex or unusual matters or decisions are usually referred to more senior aulhority, Work is not generally supervised in detail and amount of supervision varies depending upon the assignment Usually technical guidance is available to review work programs and advise on unusual features of assignments. May give technical guidance to engineers of less standing or technicians assigned to work on a common project. Supervision over other engineers not usually a regular or continuing responsibility.
Bachelor's degree in Engineering or Applied Science or its equivalent, normally with four plus years related working experience from the graduation level. Typically holds a P.Eng.
Note: Above base salary compensation data are Incumbent weighted.
© 2015 Mercer L.LC 31
CA-NP-205, Attachment K Page 37 of 38
NATENG I 2015 Mercer OSPE National Engineering Compensation Survey Engineering Responsibility Levels
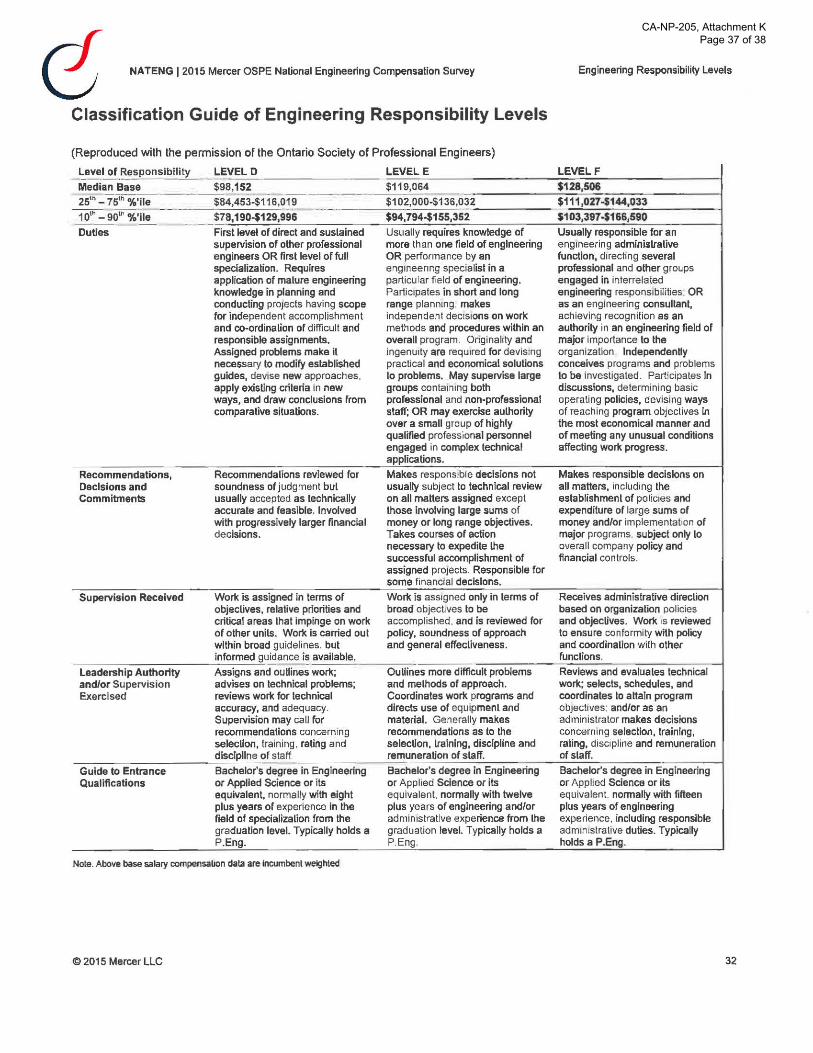
Classification Guide of Engineering Responsibility Levels
(Reproduced with the permission of the Ontario Society of Professional Engineers)
_L_~~-Responsibility
Median Base
LEVEL D $98,152
LEVEL E LEVEL F $11 9,064 $128,506
zs'" - 7s'" %~ --- ----s84,453-$1 1 s ,o~ ------- $1 oz,ooo-$1 3s,o~_z ___ __ ---'-s1_1_1.;..,,o_2_7-$-'--144--=-,o_3_3 ____ ---l
1 o'h - 901" %'lie - _. __ $~7:...:8;.!.,1:.:9~0....::-$:...:1.::.29:.!'.:..99:.:6:....__-_--_-_--_ _ _ ....::$~94__:c•c:__79;;:.4.:..-$~1:.:5~5.:::.,3:...:5.:..2 ______ $::__1:...:0~3'--=,3.:..97.:..-$..:.1.:..6:...;6.!.:,s:..:9~0------j Duties First level of direct and sustained Usually requires knowledge of Usually responsible for an
Recommendations, Decisions and Commitments
Supervision Received
supervision of other professional more than one field of engineering engmeering administrative engineers OR first level of full OR performance by an function, d1recl!ng several specialization. Requires eng1neenng specialist in a professional and other groups application of mature engineering particular field of engineering. engaged in interrelated knowledge in planning and Partic1pates in short and long engineering responsibilities. OR conducting projects having scope range plannang. makes as an engineering consultant, for independent accomplishment independent deCISions on work achieving recognition as an and co-ordination of difficult and methods and procedures within an authority in an engineering field of responsible assignments. overall program. Onginahty and major importance to the Assigned problems make il ingenUity are requ1red for devismg organization lndependenUy necessary to modify established practical and economical solutions conceives programs and problems guides, devise new approaches. to problems. May supervise large to be investigated. Participates In apply existing criteria in new groups contammg both discussions, determining basic ways, and draw conclusions from professional and non·professional operating policies, devising ways comparative situations. staff; OR may exercise authority of reaching program obJectives in
Recommenda!ions reviewed for soundness of judgment but usually accepted as technically accurate and feasible. Involved with progressively larger financial decisions.
over a small group of highly the most economical manner and qualified professional personnel of meeting any unusual conditions engaged in complex technical affecting work progress. applications. Makes responstble decisions not usually subject to technical review on all matters assigned except those Involving large sums of money or long range objectives. Takes courses of action necessary to expedite the successful accomplishment of assigned projects. Responsible for some financial decisions.
Makes responsible decisions on all matters, including the establishment of polic1es and expenditure of large sums of money and/or implemental•on of major programs. subject only to overall company policy and financial con trols_
Work is assigned in terms of Work is ass1gned only in terms of Receives administrative direction objectives, relative priorities and broad objectiVes to be based on organization policies critical areas that impinge on work accomplished. and is reviewed for and objectives. Work •s reviewed of other unils. Work is carried out policy, soundness of approach to ensure conformity with policy within broad guidelines. but and general effectiveness. and coordination with other
_______________________ in_~_or~m_e_d~g.u~idance i~ _a_va~i_la_b_le~·-----~~~-----~~-~~~------~ru~n_c~ti_o_n_s. __ ~~--~--~~~~ Leadership Authority Assigns and outlines work; Oullines more difficult problems Reviews and evaluales technical and/or Supervision advises on technical problems; and methods of approach. work; selects, schedules, and Exercised reviews work for technical Coordinates work programs and coordinates to attain program
accuracy, and adequacy. directs use of equipment and objectives: and/or as an Supervision may call for material. Generally makes administrator makes decisions recommendations concerning recommendations as to the concern1ng selection, training, selection, training , rating and selection, lraining, discipline and rating, discipline and remuneration discipline of staff remuneration of slaff. of slaff.
------------------------~----Guide to Entrance Qualifications
Bachelor's degree in Engineering Bachelor's degree in Engineering Bachelots degree in Engineering or Applied Science or its or Applied Science or its or Applied Science or its equivalent, normally with eight equivalent, normally with twelve equivalent. normally with fifteen plus years of experience in the plus years of engineering andlor plus years of engineering field of specialization from the administrative experience from the experience. including responsible graduation level. Typically holds a graduation level. Typically holds a adm1n1strative duties. Typically P.Eng. P.Eng_ holds a P.Eng.
Note_ Above base salary compensation data are incumbent weighted
@ 2015 Mercer LLC 32

CA-NP-205, Attachment K Page 38 of 38
NATENG 12015 Mercer OSPE National Engineering Compensation Survey Mercer Services
MERCER SERVICES
About Mercer Mercer helps clients understand, develop, implement, and quantify the effectiveness of their human resource programs and policies. Our goal is to help employers create measurable business results through their people.
We work with clients to address a broad array of their most important human resource issues, both domestically and globally. We have specialist expertise in all areas of human resource consulting, including compensation, employee benefits, communication, and human capital strategy. Of equal importance are our investment consulting expertise and the solutions we provide in program administration.
With more than 20,000 employees serving clients from more than 180 cities and 40 countries and territories worldwide, we have the local knowledge and worldwide presence to develop and implement global human resource solutions. Mercer's information services business is dedicated to helping our clients make decisions regarding HR-related matters by providing timely, comprehensive, and high-quality HR information and metrics for any major location around the world.
Marsh & McLennan Companies is a global professional services firm with annual revenues exceeding $11 billion. It is the parent company of Marsh Inc., the world's leading risk and insurance services firm; and Mercer Inc., a major global provider of consulting services. More than 50,000 employees provide analysis, advice, and transactional capabilities to clients in over 100 countries. Its stock (ticker symbol: MMC) is listed on the New York, Chicago, Pacific, and London stock exchanges. Marsh & McLennan Companies website address is www.mmc.com.
© 2015 Mercer LLC 33