C101-E150 UV TALK LETTER Vol - Shimadzu...Dual-beam instruments also eliminate the effect of light...
12
C101-E150 UV-VIS Spectroscopy and Fluorescence Spectroscopy (Part 2 of 2) ------- 02 Applications: Introduction of Examples of Chemiluminescence and Electroluminescence Analyses Using a Spectrofluorophotometer with an Automatic Spectral Correction Feature ------- 07 Q&A: What is the Difference between Quantum Yield and Quantum Efficiency? ------- 10 Vol. 18
Transcript of C101-E150 UV TALK LETTER Vol - Shimadzu...Dual-beam instruments also eliminate the effect of light...

C101-E150
© Shimadzu Corporation, 2017First Edition: November 2017
UV-VIS Spectroscopy and Fluorescence Spectroscopy (Part 2 of 2) ------- 02
Applications: Introduction of Examples of Chemiluminescence and Electroluminescence Analyses Using a Spectro�uorophotometer with an Automatic Spectral Correction Feature ------- 07
Q&A: What is the Difference between Quantum Yield and Quantum Ef�ciency? ------- 10
Vol. 18

Global Application Development Center, Analytical & Measuring Instruments Division
Kazuki Sobue
02 UV TALK LETTER Vol.18 03UV TALK LETTER Vol.18
UV-VIS Spectroscopy and Fluorescence Spectroscopy (Part 2 of 2)
UV-VIS spectrophotometers generate spectra using the mono-
chromator to change the wavelength of incident light and by
recording the transmitted light that passes through the sample
at each wavelength. A baseline measurement (solvent analysis) is
also conducted before analyzing the sample. The ratio of light
intensity recorded during baseline measurement to that
recorded during sample measurement is calculated, thereby
permitting accommodation for spectral emittance characteristics
of the light source, wavelength characteristics of the monochro-
mator, and wavelength sensitivity characteristics of the detector.
This ratio and associated relationships are expressed as given in
equation (1) below.
Where K1 is a constant.
Normally, a solvent that absorbs almost no UV-VIS region light is
used so that solvent absorption is near zero. UV-VIS spectropho-
tometers display transmittance as equation (1) multiplied by 100,
and absorbance as the base 10 logarithm of the inverse of equation
(1). Also, since these results are not affected by instrument charac-
teristics, they can be compared with measurements obtained using
different UV-VIS spectrophotometers. Dual-beam instruments also
eliminate the effect of light source �uctuations on recorded results
by recording the ratio of sample light beam-to-reference light beam
intensity. As for the differences between single- and dual-beam
instruments, refer to UV Talk Letter Vol. 9.
The con�guration of a spectro�uorophotometer can be illustrated
using the simple schematic of Shimadzu's RF-6000 spectro�uoro-
photometer shown in Fig. 2. The �ve main components of a
spectro�uorophotometer are the light source, excitation mono-
chromator, sample compartment, emission monochromator, and
detector. Since the �uorescence intensity is proportional to the
light source intensity, a high-intensity xenon (Xe) lamp is used as
the light source, as later covered in detail. The sample is irradiated
with monochromatic excitation light from the excitation mono-
chromator, which diffracts light from the light source to produce
monochromatic light. Spectro�uorophotometers are single-beam
instruments that do not generate a reference light beam, therefore
accommodating only a single cell in the sample compartment. The
emission monochromator diffracts �uorescence emitted by the
sample into light at different wavelengths. To reduce the effect of
excitation light on the �uorescence spectrum being recorded,
Shimadzu's RF-6000 is designed to detect �uorescence perpen-
dicular to the direction of the excitation light. This design capital-
izes on the phenomenon by which �uorescence produced by an
irradiated cell is emitted in all directions. The cells used in spectro-
�uorophotometers and UV-VIS spectrophotometers are also
different, as shown in Fig. 3. In spectro�uorophotometers, since
�uorescence is recorded perpendicular to the direction of excita-
tion light, a cell with four polished sides is required. UV-VIS
spectrophotometers require a cell with just two polished sides to
allow passage of incident light and transmitted light. In spectro-
�uorophotometers, �uorescence emitted by the sample is
detected after it is diffracted by the emission monochromator.
• Relationship Between a Spectrum and the Spectro�uorophotometer Con�guration
Fig. 1 Schematic of a UV-VIS Spectrophotometer Fig. 2 Spectro�uorophotometer Structure
In UV Talk Letter Vol. 17, we focused primarily on the principles and
characteristics of �uorescence. Here, we describe the spectro�uoro-
photometers used in �uorescence spectroscopy, focusing on their
con�gurations and the data they generate as compared to the data
generated by UV-VIS spectrophotometers. Also described is how
spectro�uorophotometers in particular can record multiple types of
data, including excitation spectra, �uorescence spectra, and 3D
spectra, and that data generated by each spectro�uorophotometer
include a coef�cient unique to that instrument, and recorded data
must be corrected according to this coef�cient.
1. Introduction
First, we will review the structure of a UV-VIS spectrophotometer.
Fig. 1 shows a simple schematic of Shimadzu's UV-2600 UV-VIS
spectrophotometer. The four main components of a UV-VIS
spectrophotometer are the light source, monochromator, sample
compartment, and detector. The light sources include a deuterium
(D2) lamp for generating ultraviolet light and a halogen (WI) lamp
for producing light in the visible to near-infrared region. A mono-
chromator splits the UV light or visible light produced by either
light source into monochromatic light. UV-VIS spectrophotom-
eters with a dual-beam optical system have a sample compart-
ment that can accommodate two cells: a sample cell for the
sample light beam and a reference cell for the reference light
beam. Light is passed through either the sample cell or reference
cell, and each beam is alternatively detected by the detector.
• Relationship Between Spectra and the UV-VIS Spectrophotometer Con�guration
2. About UV-VIS Spectrophotometers and Spectro�uorophotometers
Light source(Xe lamp)
Excitation monochromator
Emission monochromator
Detector
FluorescenceExcitation
light
Cell
Reference light beam
Sample light beam
Detector
Light source(D2 lamp)
Light source(WI lamp)
Monochromator
(Intensity of measured light)
(Intensity of baseline light)=
[K1×(Light source characteristics)×(Monochromator characteristics)×(1 - Sample absorption)×(Detector characteristics)]
[K1×(Light source characteristics)×(Monochromator characteristics)×(1 - Solvent absorption)×(Detector characteristics)]
= (1 - Sample absorption) (1)
=(1 - Sample absorption)
(1 - Solvent absorption)

Spectro�uorophotometers are primarily capable of recording two
spectra: �uorescence spectra and excitation spectra. When record-
ing �uorescence spectra, the emission monochromator scans a
range of wavelengths of emitted �uorescence, all measured while
the sample is irradiated with a �xed wavelength of excitation light
(the excitation monochromator isolating a single wavelength of
excitation light). When recording excitation spectra, �uorescence is
observed at a single wavelength (the emission monochromator
isolating one wavelength of �uorescence) while the excitation
monochromator scans through a range of wavelengths of excita-
tion light. The wavelength of excitation light that produces the
greatest �uorescence from the sample is recorded. A 3D spectrum
shows excitation wavelengths at which a sample emits light by
recording the �uorescence spectrum at each excitation wavelength,
and then changing the excitation wavelength by �xed amounts.
Data recorded by spectro�uorophotometers when measuring
excitation/�uorescence spectra include the characteristics of the
instrument. The excitation spectrum associated with the sample is
multiplied by the spectral radiant characteristics of the light source
and the wavelength characteristics of the excitation monochroma-
tor. However, since the emission monochromator is �xed at a
speci�c wavelength, the wavelength characteristics of the emission
monochromator and the wavelength sensitivity characteristics of
the detector do not have an effect at each recorded wavelength of
the excitation spectrum intensity. When an excitation spectrum that
includes instrument characteristics is called an "Apparent excitation
spectrum", it is expressed as shown in equation (2).
Where K2 is a constant.
Furthermore, the �uorescence spectrum of the sample is
multiplied by the wavelength characteristics of the emission
monochromator and the wavelength sensitivity characteristics of
the detector. However, since the excitation monochromator is
�xed at a speci�c wavelength, the spectral radiant characteristics
of the light source and the wavelength characteristics of the
excitation monochromator do not have an effect on each
recorded wavelength of the �uorescence spectrum intensity.
When the �uorescence spectrum that includes instrument
characteristics is called an "Apparent �uorescence spectrum", it
is expressed as shown in equation (3).
Where K3 is a constant.
Since the "Apparent excitation spectrum" and the "Apparent �uores-
cence spectrum" include instrument characteristics, the spectrum
shape of each will differ depending on the instrument model, and
may also change within the same instrument due to the instrument
changing over time. Consequently, instrument characteristics must
be removed from excitation spectra and �uorescence spectra.
Without going into great detail, instrument characteristics as
represented by [(Light source characteristics)×(Excitation mono-
chromator characteristics)] in equation (2) and [(Emission mono-
chromator characteristics)×(Detector characteristics)] in equation
(3) can be calculated for each individual spectro�uorophotometer
using a standard tungsten lamp of known intensity distribution
and a light quantum meter (rhodamine B in ethylene glycol). After
eliminating the instrument characteristics present in equation (2)
and equation (3), the results are referred to as a corrected excita-
tion spectrum and a corrected �uorescence spectrum, which are
represented as shown in equations (4) and (5), respectively.
The corrected excitation spectrum and corrected �uorescence spectrum are the excitation and �uorescence spectra of the sample with
instrument characteristics eliminated, and they can be compared among different instrument models, without changing as the instrument ages.
Fig. 3 Left: Cell with Two Polished Sides
Right: Cell with Four Polished Sides
Fig. 4 Absorbance and Fluorescence Inside a Cell
(Apparent �uorescence spectrum = K3×(Sample �uorescence spectrum)×(Emission monochromator characteristics)×(Detector characteristics)
(Apparent excitation spectrum = K2×(Light source characteristics)×(Excitation monochromator characteristics)×(Sample excitation spectrum)
(4)
(3)
(2)
A = log10 (I0/I) = εcl (6)
T (%) = (I/I0) × 100 (7)
F = (I0 − I)Φ = (1 − I/I0)ΦI0 (8)
Φ = Nem/Nabs (9)
(1/loge10) × loge(I0/I) = εcl (10)
I/I0 = e−2.303εcl (11)
F = (1− e−2.303εcl)ΦI0 (12)
F = 2.303εclΦI0 = 2.303 AΦI0 (13)
(5)
(Corrected excitation spectrum) =(Apparent excitation spectrum)
[(Light source characteristics)×(Excitation monochromator characteristics)]
= K2×(Sample excitation spectrum)
(Corrected �uorescence spectrum) =(Apparent �uorescence spectrum)
[(Emission monochromator characteristics)×(Detector characteristics)]
= K3×(Sample �uorescence spectrum)
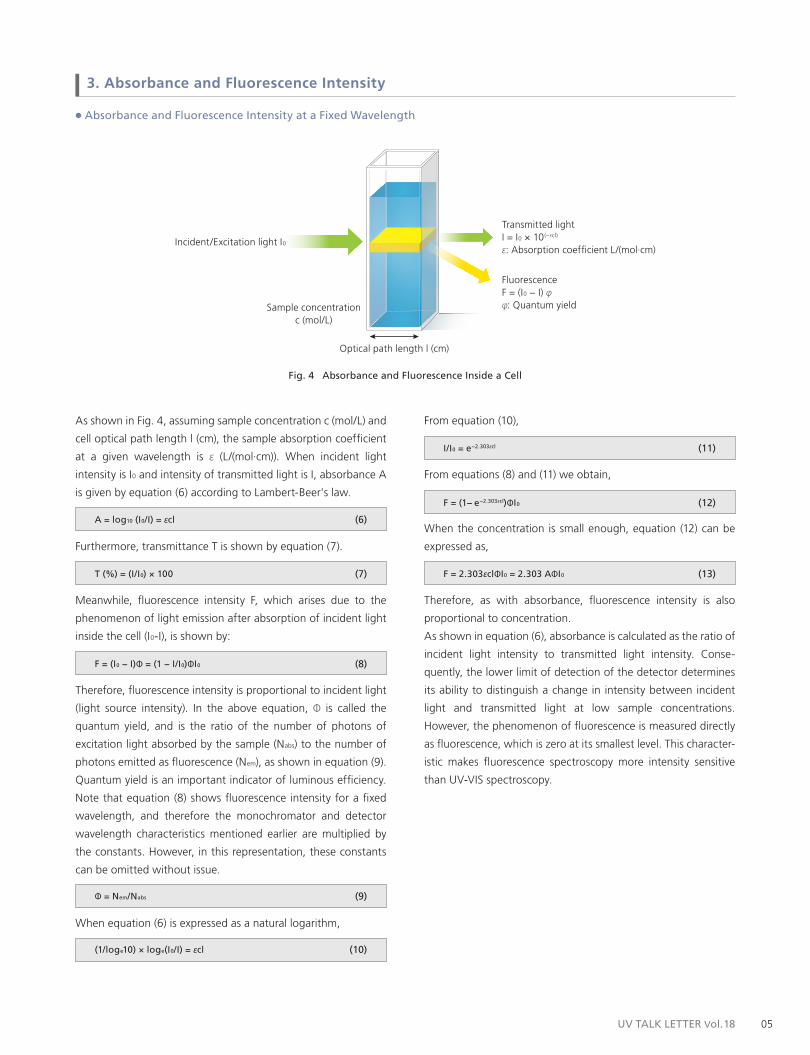
As shown in Fig. 4, assuming sample concentration c (mol/L) and
cell optical path length l (cm), the sample absorption coef�cient
at a given wavelength is ε (L/(mol∙cm)). When incident light
intensity is I0 and intensity of transmitted light is I, absorbance A
is given by equation (6) according to Lambert-Beer's law.
Furthermore, transmittance T is shown by equation (7).
Meanwhile, �uorescence intensity F, which arises due to the
phenomenon of light emission after absorption of incident light
inside the cell (I0-I), is shown by:
Therefore, �uorescence intensity is proportional to incident light
(light source intensity). In the above equation, Φ is called the
quantum yield, and is the ratio of the number of photons of
excitation light absorbed by the sample (Nabs) to the number of
photons emitted as �uorescence (Nem), as shown in equation (9).
Quantum yield is an important indicator of luminous ef�ciency.
Note that equation (8) shows �uorescence intensity for a �xed
wavelength, and therefore the monochromator and detector
wavelength characteristics mentioned earlier are multiplied by
the constants. However, in this representation, these constants
can be omitted without issue.
Therefore, as with absorbance, �uorescence intensity is also
proportional to concentration.
As shown in equation (6), absorbance is calculated as the ratio of
incident light intensity to transmitted light intensity. Conse-
quently, the lower limit of detection of the detector determines
its ability to distinguish a change in intensity between incident
light and transmitted light at low sample concentrations.
However, the phenomenon of �uorescence is measured directly
as �uorescence, which is zero at its smallest level. This character-
istic makes �uorescence spectroscopy more intensity sensitive
than UV-VIS spectroscopy.
When equation (6) is expressed as a natural logarithm,
From equation (10),
From equations (8) and (11) we obtain,
When the concentration is small enough, equation (12) can be
expressed as,
• Absorbance and Fluorescence Intensity at a Fixed Wavelength
3. Absorbance and Fluorescence Intensity
Optical path length l (cm)
Sample concentrationc (mol/L)
Transmitted lightI = I0 × 10(−εcl)
ε: Absorption coef�cient L/(mol∙cm)
FluorescenceF = (I0 − I) φφ: Quantum yield
Incident/Excitation light I0
04 UV TALK LETTER Vol.18 05UV TALK LETTER Vol.18
Spectro�uorophotometers are primarily capable of recording two
spectra: �uorescence spectra and excitation spectra. When record-
ing �uorescence spectra, the emission monochromator scans a
range of wavelengths of emitted �uorescence, all measured while
the sample is irradiated with a �xed wavelength of excitation light
(the excitation monochromator isolating a single wavelength of
excitation light). When recording excitation spectra, �uorescence is
observed at a single wavelength (the emission monochromator
isolating one wavelength of �uorescence) while the excitation
monochromator scans through a range of wavelengths of excita-
tion light. The wavelength of excitation light that produces the
greatest �uorescence from the sample is recorded. A 3D spectrum
shows excitation wavelengths at which a sample emits light by
recording the �uorescence spectrum at each excitation wavelength,
and then changing the excitation wavelength by �xed amounts.
Data recorded by spectro�uorophotometers when measuring
excitation/�uorescence spectra include the characteristics of the
instrument. The excitation spectrum associated with the sample is
multiplied by the spectral radiant characteristics of the light source
and the wavelength characteristics of the excitation monochroma-
tor. However, since the emission monochromator is �xed at a
speci�c wavelength, the wavelength characteristics of the emission
monochromator and the wavelength sensitivity characteristics of
the detector do not have an effect at each recorded wavelength of
the excitation spectrum intensity. When an excitation spectrum that
includes instrument characteristics is called an "Apparent excitation
spectrum", it is expressed as shown in equation (2).
Where K2 is a constant.
Furthermore, the �uorescence spectrum of the sample is
multiplied by the wavelength characteristics of the emission
monochromator and the wavelength sensitivity characteristics of
the detector. However, since the excitation monochromator is
�xed at a speci�c wavelength, the spectral radiant characteristics
of the light source and the wavelength characteristics of the
excitation monochromator do not have an effect on each
recorded wavelength of the �uorescence spectrum intensity.
When the �uorescence spectrum that includes instrument
characteristics is called an "Apparent �uorescence spectrum", it
is expressed as shown in equation (3).
Where K3 is a constant.
Since the "Apparent excitation spectrum" and the "Apparent �uores-
cence spectrum" include instrument characteristics, the spectrum
shape of each will differ depending on the instrument model, and
may also change within the same instrument due to the instrument
changing over time. Consequently, instrument characteristics must
be removed from excitation spectra and �uorescence spectra.
Without going into great detail, instrument characteristics as
represented by [(Light source characteristics)×(Excitation mono-
chromator characteristics)] in equation (2) and [(Emission mono-
chromator characteristics)×(Detector characteristics)] in equation
(3) can be calculated for each individual spectro�uorophotometer
using a standard tungsten lamp of known intensity distribution
and a light quantum meter (rhodamine B in ethylene glycol). After
eliminating the instrument characteristics present in equation (2)
and equation (3), the results are referred to as a corrected excita-
tion spectrum and a corrected �uorescence spectrum, which are
represented as shown in equations (4) and (5), respectively.
The corrected excitation spectrum and corrected �uorescence spectrum are the excitation and �uorescence spectra of the sample with
instrument characteristics eliminated, and they can be compared among different instrument models, without changing as the instrument ages.
Fig. 3 Left: Cell with Two Polished Sides
Right: Cell with Four Polished Sides
Fig. 4 Absorbance and Fluorescence Inside a Cell
(Apparent �uorescence spectrum = K3×(Sample �uorescence spectrum)×(Emission monochromator characteristics)×(Detector characteristics)
(Apparent excitation spectrum = K2×(Light source characteristics)×(Excitation monochromator characteristics)×(Sample excitation spectrum)
(4)
(3)
(2)
A = log10 (I0/I) = εcl (6)
T (%) = (I/I0) × 100 (7)
F = (I0 − I)Φ = (1 − I/I0)ΦI0 (8)
Φ = Nem/Nabs (9)
(1/loge10) × loge(I0/I) = εcl (10)
I/I0 = e−2.303εcl (11)
F = (1− e−2.303εcl)ΦI0 (12)
F = 2.303εclΦI0 = 2.303 AΦI0 (13)
(5)
(Corrected excitation spectrum) =(Apparent excitation spectrum)
[(Light source characteristics)×(Excitation monochromator characteristics)]
= K2×(Sample excitation spectrum)
(Corrected �uorescence spectrum) =(Apparent �uorescence spectrum)
[(Emission monochromator characteristics)×(Detector characteristics)]
= K3×(Sample �uorescence spectrum)
As shown in Fig. 4, assuming sample concentration c (mol/L) and
cell optical path length l (cm), the sample absorption coef�cient
at a given wavelength is ε (L/(mol∙cm)). When incident light
intensity is I0 and intensity of transmitted light is I, absorbance A
is given by equation (6) according to Lambert-Beer's law.
Furthermore, transmittance T is shown by equation (7).
Meanwhile, �uorescence intensity F, which arises due to the
phenomenon of light emission after absorption of incident light
inside the cell (I0-I), is shown by:
Therefore, �uorescence intensity is proportional to incident light
(light source intensity). In the above equation, Φ is called the
quantum yield, and is the ratio of the number of photons of
excitation light absorbed by the sample (Nabs) to the number of
photons emitted as �uorescence (Nem), as shown in equation (9).
Quantum yield is an important indicator of luminous ef�ciency.
Note that equation (8) shows �uorescence intensity for a �xed
wavelength, and therefore the monochromator and detector
wavelength characteristics mentioned earlier are multiplied by
the constants. However, in this representation, these constants
can be omitted without issue.
Therefore, as with absorbance, �uorescence intensity is also
proportional to concentration.
As shown in equation (6), absorbance is calculated as the ratio of
incident light intensity to transmitted light intensity. Conse-
quently, the lower limit of detection of the detector determines
its ability to distinguish a change in intensity between incident
light and transmitted light at low sample concentrations.
However, the phenomenon of �uorescence is measured directly
as �uorescence, which is zero at its smallest level. This character-
istic makes �uorescence spectroscopy more intensity sensitive
than UV-VIS spectroscopy.
When equation (6) is expressed as a natural logarithm,
From equation (10),
From equations (8) and (11) we obtain,
When the concentration is small enough, equation (12) can be
expressed as,
• Absorbance and Fluorescence Intensity at a Fixed Wavelength
3. Absorbance and Fluorescence Intensity
Optical path length l (cm)
Sample concentrationc (mol/L)
Transmitted lightI = I0 × 10(−εcl)
ε: Absorption coef�cient L/(mol∙cm)
FluorescenceF = (I0 − I) φφ: Quantum yield
Incident/Excitation light I0
04 UV TALK LETTER Vol.18 05UV TALK LETTER Vol.18

Global Application Development Center, Analytical & Measuring Instruments Division
Akara Hashimoto
06 UV TALK LETTER Vol.18 07UV TALK LETTER Vol.18
Fig. 1 Comparison of Corrected Spectrum and Uncorrected Spectrum
The intensity and position of spectral peaks recorded from the
same sample will differ when measured using different spectro-
�uorophotometers. This variation is caused by differences in the
characteristics of the spectro�uorophotometer instrument itself,
including differences in light source radiation characteristics,
optical system spectral characteristics, and other component
characteristics. Fig. 1 shows a corrected spectrum and an uncor-
rected spectrum in the same graph, indicating the differences in
spectrum shape and peak positions. Shimadzu's RF-6000
spectro�uorophotometer simultaneously records corrected
spectra without this instrument function as well as an uncor-
rected spectrum with this instrument function intact. Spectral
correction permits the comparison of data that are generated
using different instruments.
1. Automatic Spectral Correction
This article describes instrument con�guration, absorbance,
�uorescence intensity and spectrum correction for UV-VIS
spectrophotometers and spectro�uorophotometers, while
comparing the characteristics of each. A summary of the subject
matter covered is shown in Table 1. UV-VIS spectroscopy and
�uorescence spectroscopy both have distinguishing features
that, when understood, allow for better utilization of both
methods.
4. Conclusion
Applications
Introduction of Examples of Chemiluminescence and Electroluminescence Analyses Using a Spectro�uorophotometer with an Automatic Spectral Correction Feature
Some substances emit absorbed energy as light. This phenomenon is called luminescence, and is categorized based on the stimulat-
ing source of energy.
Photoluminescence is the name given to this phenomenon when light is the stimulus, chemiluminescence when a chemical reaction
is the stimulus, electroluminescence when electrical energy is the stimulus, and bioluminescence when biological energy is the stimu-
lus, as observed in �re�ies.
This section describes the automatic spectral correction feature that automatically corrects readings for instrument-speci�c charac-
teristics (instrument function), along with examples of electroluminescence (electrical energy stimulus) and chemiluminescence
(chemical reaction stimulus) analyses.
5000.0
4000.0
3000.0
2000.0
1000.0
0.0
Fluo
resc
ence
inte
nsity
Corrected spectrum
Uncorrected spectrum
350.0 400.0 500.0 600.0 700.0 800.0
nm
Taking apparent excitation spectrum Ex(λ), light source intensity
L(λ), and excitation monochromator wavelength characteristics
M(λ) (where λ represents wavelength), the apparent excitation
spectrum is expressed as shown in equation (14).
The corrected excitation spectrum from equation (16) matches
the shape of the absorptance spectrum [1-α(λ)] described using
transmittance calculated with a UV-VIS spectrophotometer.
Furthermore, if excitation spectrum intensity is linear, then
concentration is suf�ciently low, and according to the previous
section equation (16) becomes,
The shape of this spectrum matches that of the spectrum
displayed for absorbance.
Where K4 is a constant, and α(λ) is the proportion of incident
light that passes through the cell (1/100 of transmittance). From
equation (14), the corrected excitation spectrum is expressed as
given by equation (15).
When quantum yield is �xed and not dependent on wavelength,
it can be treated as a constant.
• Corrected Excitation Spectrum and Absorptance Spectrum
Ex(λ) = K4×[L(λ)×M(λ)−α(λ)×L(λ)×M(λ)]×Φ(λ)
= K4×[1−α(λ)]×L(λ)×M(λ)×Φ(λ)(14)
(Corrected excitation spectrum) = Ex(λ)/[M(λ)×L(λ)]
= K4×[1−α(λ)]×Φ(λ)(15)
(Corrected excitation spectrum) = K5×[1−α(λ)] (16)
(Corrected excitation spectrum) = K5×2.303ε(λ)cl
= K6×A(λ) (17)
K6 = K5×2.303 (18)
K5 = K4×Φ(λ) (17)
Table 1 Comparison of UV-VIS Spectroscopy and Fluorescence Spectroscopy
Fluorescence Measurement
Instrumentconfiguration
Advantages
UV-VIS Absorbance Measurement
• High sensitivity as fluorescence (luminous phenomenon) starts
from zero and is detected directly (three or more significant
figures more sensitive than UV-VIS absorbance measurements*).
• Selective due to substances having different excitation and
fluorescence wavelengths.
Disadvantages
• Substances that absorb light in the UV-VIS region may not
necessarily fluoresce.
• Excitation and fluorescence spectra include the instrument
characteristics of the monochromators and detector.
• Any substance that exhibits absorbance in the UV-VIS region can
be measured.
• Baseline measurement allows for sample spectra to be recorded
without including instrument characteristics.
• Spectra and absorbances recorded on different UV-VIS
spectrophotometers will basically match each other.
• Detects the ratio of (difference between) incident light and
transmitted light. Lower limit of detection is derived from
whether the difference in intensity between incident and
transmitted light is apparent.
• Sensitivity is lower than fluorometric methods.
Other
• Corrected excitation spectra have the same shape as absorbance
spectra.
• The energy difference between vibrational energy levels of the
excited state is reflected in excitation spectra, and the energy
difference between vibrational energy levels of the ground state
is reflected in fluorescence spectra.
• The energy difference between vibrational energy levels of the
excited state is reflected in UV-VIS spectra.
Emission
monochrom
ator
Sample
compartm
ent
Excitationm
onochromator
Detector
Light source
Sample
compartm
ent
Detector
Light source
Monochrom
ator
*: The Japan Society for Analytical Chemistry, Hisanori Imura, Kazuya Kikuchi, Naoki Hirayama, Kotaro Morita, Hitoshi Watarai. Practical Analytical Technology Series, Instrument Analysis (Absorbance and Fluorescence Analysis), Kyoritsu Shuppan Co., Ltd.
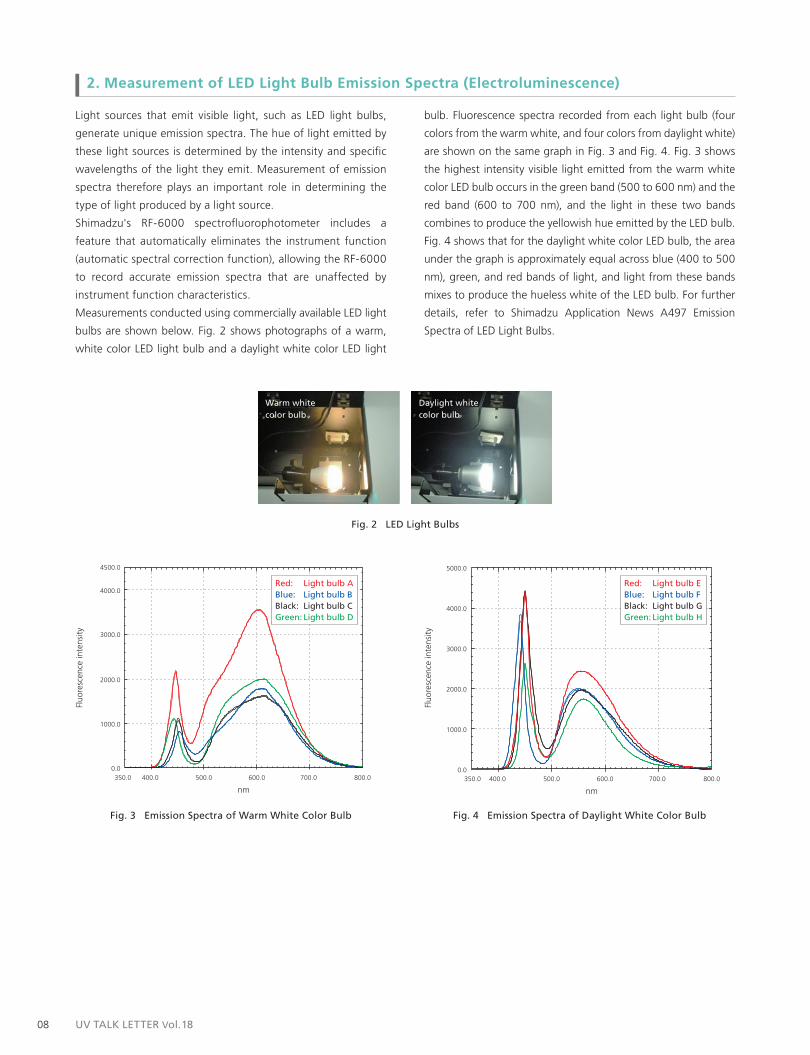
Fig. 4 Emission Spectra of Daylight White Color BulbFig. 3 Emission Spectra of Warm White Color Bulb
Fig. 2 LED Light Bulbs
Light sources that emit visible light, such as LED light bulbs,
generate unique emission spectra. The hue of light emitted by
these light sources is determined by the intensity and speci�c
wavelengths of the light they emit. Measurement of emission
spectra therefore plays an important role in determining the
type of light produced by a light source.
Shimadzu's RF-6000 spectro�uorophotometer includes a
feature that automatically eliminates the instrument function
(automatic spectral correction function), allowing the RF-6000
to record accurate emission spectra that are unaffected by
instrument function characteristics.
Measurements conducted using commercially available LED light
bulbs are shown below. Fig. 2 shows photographs of a warm,
white color LED light bulb and a daylight white color LED light
bulb. Fluorescence spectra recorded from each light bulb (four
colors from the warm white, and four colors from daylight white)
are shown on the same graph in Fig. 3 and Fig. 4. Fig. 3 shows
the highest intensity visible light emitted from the warm white
color LED bulb occurs in the green band (500 to 600 nm) and the
red band (600 to 700 nm), and the light in these two bands
combines to produce the yellowish hue emitted by the LED bulb.
Fig. 4 shows that for the daylight white color LED bulb, the area
under the graph is approximately equal across blue (400 to 500
nm), green, and red bands of light, and light from these bands
mixes to produce the hueless white of the LED bulb. For further
details, refer to Shimadzu Application News A497 Emission
Spectra of LED Light Bulbs.
2. Measurement of LED Light Bulb Emission Spectra (Electroluminescence)
This article introduced examples of electroluminescence and chemiluminescence analysis. The spectra presented in this article were subjected
to automatic spectral correction, and can therefore be considered as true spectra with the effects of instrument function eliminated.
4. Summary
Fig. 5 Luminescent Process of Peroxyoxalate Chemiluminescence
Fig. 6 Glow Sticks Fig. 7 Fluorescence Spectra of Glow Sticks
Peroxyoxalate chemiluminescence is caused by a chemical reaction between an oxalate ester and hydrogen peroxide within a �uorescent
dye solution. This luminescence is characterized by high luminous ef�ciency and long duration of luminosity. The luminescent process is
shown in Fig. 5.
3. Peroxyoxalate Luminescent Process and Spectral Measurement of Glow Stick Fluorescent Pigment (Chemiluminescence)
As shown in Fig. 5, the oxalate ester is oxidized by hydrogen
peroxide to produce ROH and 1,2-dioxetanedione.
1,2-Dioxetanedione is a high-energy reaction intermediate that
exchanges electrons with the �uorescent pigment as it breaks
down to carbon dioxide. When the electrons return to the
�uorescent pigment, they enter the lowest unoccupied molecu-
lar orbital, elevating the �uorescent pigment to an excited state.
The �uorescent pigment then releases light (hν) on returning to
its ground state. The wavelength of the light released differs
depending on the �uorescent pigment.
Three commercially marketed glow sticks are shown in Fig. 6. In
these glow sticks, oxalate ester and �uorescent pigment solution
are placed in a sealed thin-walled glass container �xed within a
polyethylene tube that itself contains hydrogen peroxide
solution and added catalyst. Bending the polyethylene tube
breaks the glass container, causing the solutions to mix and the
glow stick to �uoresce. Polycyclic aromatics are commonly used
as the �uorescent pigments in glow sticks, and the color of light
emitted by glow sticks varies depending on the wavelength of
light emitted when the �uorescent pigment returns to its ground
state from an excited state.
Fig. 7 shows emission spectra for yellow-green, yellow, and red glow sticks. The color used to represent each spectrum on the graph
corresponds to the color of the glow stick.
4500.0
4000.0
3000.0
2000.0
1000.0
0.0350.0 400.0 500.0 600.0 700.0 800.0
nm
5000.0
4000.0
3000.0
2000.0
1000.0
0.0350.0 400.0 500.0 600.0 700.0 800.0
nm
Fluo
resc
ence
inte
nsity
Fluo
resc
ence
inte
nsity
Daylight white color bulb
Warm white color bulb *: Dye refers to a �uorescent pigment.
O
O
C C
OR
RO
Oxalate ester
+ H2O2
Hydrogenperoxide
2ROH +O
O
C
C
O
O
1,2-Dioxetanedione
O
O
C
C
O
O
+ Dye 2CO2 + Dye*
Dye* Dye +
R =NO2
O2N
Cl
Cl
Cl
etc.
3000.0
2000.0
1000.0
0.0400.0 500.0 600.0 700.0 800.0
nm
Fluo
resc
ence
inte
nsity
hν
Red: Light bulb EBlue: Light bulb FBlack: Light bulb GGreen: Light bulb H
Red: Light bulb ABlue: Light bulb BBlack: Light bulb CGreen: Light bulb D
08 UV TALK LETTER Vol.18 09UV TALK LETTER Vol.18

10 UV TALK LETTER Vol.18 11UV TALK LETTER Vol.18
Fig. 1 Absorbance Spectra of Uranine in Ethanol (Red)
and Rhodamine B in Ethanol (Blue)
Fig. 2 Fluorescence Spectra of Uranine in Ethanol (I)
and Rhodamine B in Ethanol (II)
Fig. 3 Absolute Method Procedure (1) SbEx (2) SbEm (3) SsEx (4) SsEm
Q&A
QA Quantum yield is the name given to the number of photons
of light emitted as �uorescence by a �uorescent substance
relative to the number of photons of excitation light absorbed by
the substance. There are two methods used for calculating
quantum yield: the relative method and the absolute method.
Quantum yields calculated by these methods are referred to as
relative quantum yield (or quantum yield) and absolute quantum
yield (or quantum ef�ciency), respectively.
Measuring quantum yield by the relative method relies on the
use of a �uorescent substance of known quantum yield as a
standard sample for calculating the quantum yield of an
unknown sample. The formula used is similar to that shown in
equation (1).
Here, φ is quantum yield, Abs is absorbance at the excitation
wavelength, F is area under the graph of the corrected �uores-
cence spectrum, n is solvent refractive index, and D is the
dilution ratio used in sample dilution for a �uorescence spectrum
measurement. In formula (1), st refers to the standard sample
and un refers to the unknown sample. When the relative method
is used, a standard sample of known quantum yield must �rst be
chosen. Then, in addition to using a spectro�uorophotometer to
measure the �uorescence spectrum of the standard and
unknown samples, a UV-VIS spectrophotometer is required to
measure absorbance at the excitation wavelength. As the
recording of �uorescence spectra using a high-concentration
sample can result in concentration quenching, diluted samples
are used. As a rough guide for sample dilution, absorbance no
greater than 0.05 Abs at the excitation wavelength is recom-
mended. The absorbance spectra of uranine in ethanol and
rhodamine B in ethanol are shown in Fig. 1, and the �uorescence
spectra are shown in Fig. 2. The spectra show that when using
the relative method, calculation of quantum yield requires the
�uorescence spectra of two samples. For further details, refer to
Application News No. A504.
Measurement by the absolute method requires the use of an
integrating sphere to calculate the number of photons absorbed
and emitted by an unknown sample based on the area of
scattered excitation light and �uorescence under the graph.
These numbers are used to calculate the quantum yield. The
formula used is similar to that shown in equation (2).
Table 1 compares the respective advantages and disadvantages of using quantum yield and quantum ef�ciency, respectively, for analysis.
Here, SsEm and SbEm refer to the surface area under the graph of
the corrected �uorescent spectrum recorded for the sample and
blank solution (solvent only), and SsEx and SbEx refer to the area
under the graph of scattered excitation light for the sample and
blank solution, respectively. The procedure used involves �rst
recording the �uorescence spectrum of a blank solution to
measure the �uorescence and excitation light scattered by the
solvent. Next, the �uorescence spectrum of the sample is
recorded to measure the excitation light scattered by the sample
and �uorescence emitted by the sample. The denominator of
equation (2) corresponds to the amount of excitation light
absorbed by the sample, and the numerator corresponds to the
amount of �uorescence emitted by the sample. These values are
used to calculate the quantum ef�ciency. Fig. 3 shows the
�uorescence spectra of a quinine sulfate solution (solvent: 1.0 N
sulfuric acid) and the solvent. These graphs indicate that when
calculating quantum yield by the absolute method, in addition to
the �uorescence spectrum of the sample and solvent, measure-
ment of the scattered excitation light is also required. For further
details, refer to Application News No. A496.
What is the difference between quantum yield and quantum ef�ciency?
)()()()( 2
2
st
un
st
un
un
st
st
unstun D
Dnn
AbsAbs
FF
××××= φφ (1)
Abs
.
0.1200
0.1000
0.0500
0.0000400.0 450.0 500.0 550.0 600.0
nm
(I)
Inte
nsity
4500.00
4000.00
3000.00
2000.00
1000.00
0.00450.0 500.0 600.0 700.0550.0 650.0
Fluorescence wavelength (nm)
(II)
Inte
nsity
3000.00
2000.00
1000.00
0.00450.0 500.0 600.0 700.0550.0 650.0
Fluorescence wavelength (nm)
)(xsxb
mbms
ESESESES
−
−=φ (2)
4000.0
3000.0
2000.0
1000.0
0.0
Blankmeasurement
300.0 400.0 500.0 600.0 680.0nm
4000.0
3000.0
2000.0
1000.0
0.0
Samplemeasurement
300.0 400.0 500.0 600.0 680.0nm
Scattered light Fluorescence
(1)
(2)
(3)
(4)
Fluo
resc
ence
inte
nsity
Fluo
resc
ence
inte
nsity
Table 1 Comparison of Quantum Yield and Quantum Ef�ciency
Quantum Yield(Relative Quantum Yield)
Advantages
Disadvantages
Quantum Efficiency(Absolute Quantum Yield)
• Simple comparison of fluorescence spectra.
• Inexpensive, requiring only a cell with four
polished sides.
• Standard sample is not required.
• Absorbance measurement is not required.
• Requires a standard sample of known
quantum yield.
• Requires absorbance measurement of both
standard and unknown samples.
• After measuring absorbance, sample dilution
may be necessary.
• Integrating sphere is expensive.
• Labor-intensive management of integrating
sphere deterioration and the need to
conduct spectral correction.

C101-E150
© Shimadzu Corporation, 2017First Edition: November 2017
UV-VIS Spectroscopy and Fluorescence Spectroscopy (Part 2 of 2) ------- 02
Applications: Introduction of Examples of Chemiluminescence and Electroluminescence Analyses Using a Spectro�uorophotometer with an Automatic Spectral Correction Feature ------- 07
Q&A: What is the Difference between Quantum Yield and Quantum Ef�ciency? ------- 10
Vol. 18