C values of glycolytic amino acids as indicators of ...
20
Submitted 15 June 2019 Accepted 19 August 2019 Published 18 September 2019 Corresponding author Yiming V. Wang, [email protected] Academic editor David Nelson Additional Information and Declarations can be found on page 15 DOI 10.7717/peerj.7701 Copyright 2019 Wang et al. Distributed under Creative Commons CC-BY 4.0 OPEN ACCESS 13 C values of glycolytic amino acids as indicators of carbohydrate utilization in carnivorous fish Yiming V. Wang 1 , Alex H.L. Wan 2 , Åshild Krogdahl 3 , Mark Johnson 2 and Thomas Larsen 1 1 Department of Archaeology, Max Planck Institute for the Science of Human History, Jena, Germany 2 Aquaculture Nutrition and Aquafeed Research Unit and Irish Seaweed Research Group, Ryan Institute, National University of Ireland, Galway, Ireland 3 Department of Basic Sciences and Aquatic Medicine, Faculty of Veterinary Medicine, Norwegian University of Life Sciences, Oslo, Norway ABSTRACT Background. Stable isotope analysis of single amino acids (AA) is usually applied in food web studies for tracing biosynthetic origins of AA carbon backbones and establishing trophic positions of consumers, but the method is also showing promise for characterizing quantity and quality of dietary lipids and carbohydrates. Methods. To investigate whether changes in high- and low-digestible carbohydrates af- fect δ 13 C values of glycolytic AA, i.e., AA carbon backbones sourced from the glycolytic pathway, we compared Atlantic salmon (Salmo salar ) from a feeding experiment with and without dietary inclusion of the red macroalga Palmaria palmata. The Control and experimental diets had similar relative proportions of macronutrients, but their ingredients differed; in the experimental treatment, 15% Palmaria inclusion substituted proteins from fishmeal and carbohydrates from corn starch. Results. We found that 13 C values of the glycolytic AA were highly sensitive to substitution of corn starch with Palmaria. The δ 13 C offsets of glycolytic AA between salmon and their diets were significantly greater in the Palmaria inclusion than Control treatment. This greater offset can be attributed to the different utilization of high- vs. low-digestible carbohydrate sources, i.e., corn starch vs. Palmaria, in the two treatments, and metabolic routing of dietary lipids. In addition, similar δ 13 C values of essential AA between treatments indicate similar nutrient assimilation efficiency for all terrestrial (pea protein concentrate and wheat gluten meal) and marine (fishmeal and red alga) derived protein sources. These results show that δ 13 C AA analysis is a promising tool for improving our understanding of how carnivorous fish utilize macronutrient and route metabolic intermediates to tissue. Subjects Aquaculture, Fisheries and Fish Science, Biochemistry, Ecology Keywords Naturally occurring 13 C isotope variability, Stable isotope fingerprinting of amino acids, Salmo salar , Protein metabolism, Non-essential amino acids, Palmaria palmata, Assimilation, Starch, Compound specific isotopes, High- and low-digestible carbohydrates INTRODUCTION Compound specific stable isotope analysis (CISA) of proteinogenic amino acids (AA) is an emerging tool for dietary reconstruction of finfishes. While stable carbon isotope analysis How to cite this article Wang YV, Wan AHL, Krogdahl Å, Johnson M, Larsen T. 2019. 13 C values of glycolytic amino acids as indicators of carbohydrate utilization in carnivorous fish. PeerJ 7:e7701 http://doi.org/10.7717/peerj.7701
Transcript of C values of glycolytic amino acids as indicators of ...

Submitted 15 June 2019Accepted 19 August 2019Published 18 September 2019
Corresponding authorYiming V. Wang, [email protected]
Academic editorDavid Nelson
Additional Information andDeclarations can be found onpage 15
DOI 10.7717/peerj.7701
Copyright2019 Wang et al.
Distributed underCreative Commons CC-BY 4.0
OPEN ACCESS
13C values of glycolytic amino acids asindicators of carbohydrate utilization incarnivorous fishYiming V. Wang1, Alex H.L. Wan2, Åshild Krogdahl3, Mark Johnson2 andThomas Larsen1
1Department of Archaeology, Max Planck Institute for the Science of Human History, Jena, Germany2Aquaculture Nutrition and Aquafeed Research Unit and Irish Seaweed Research Group, Ryan Institute,National University of Ireland, Galway, Ireland
3Department of Basic Sciences and Aquatic Medicine, Faculty of Veterinary Medicine, Norwegian Universityof Life Sciences, Oslo, Norway
ABSTRACTBackground. Stable isotope analysis of single amino acids (AA) is usually appliedin food web studies for tracing biosynthetic origins of AA carbon backbones andestablishing trophic positions of consumers, but the method is also showing promisefor characterizing quantity and quality of dietary lipids and carbohydrates.Methods. To investigate whether changes in high- and low-digestible carbohydrates af-fect δ13C values of glycolytic AA, i.e., AA carbon backbones sourced from the glycolyticpathway, we compared Atlantic salmon (Salmo salar) from a feeding experiment withand without dietary inclusion of the red macroalga Palmaria palmata. The Controland experimental diets had similar relative proportions of macronutrients, but theiringredients differed; in the experimental treatment, 15% Palmaria inclusion substitutedproteins from fishmeal and carbohydrates from corn starch.Results. We found that 13C values of the glycolytic AA were highly sensitive tosubstitution of corn starch with Palmaria. The δ13C offsets of glycolytic AA betweensalmon and their diets were significantly greater in the Palmaria inclusion than Controltreatment. This greater offset can be attributed to the different utilization of high- vs.low-digestible carbohydrate sources, i.e., corn starch vs.Palmaria, in the two treatments,and metabolic routing of dietary lipids. In addition, similar δ13C values of essential AAbetween treatments indicate similar nutrient assimilation efficiency for all terrestrial(pea protein concentrate and wheat gluten meal) and marine (fishmeal and red alga)derived protein sources. These results show that δ13CAA analysis is a promising tool forimproving our understanding of how carnivorous fish utilize macronutrient and routemetabolic intermediates to tissue.
Subjects Aquaculture, Fisheries and Fish Science, Biochemistry, EcologyKeywords Naturally occurring 13C isotope variability, Stable isotope fingerprinting of aminoacids, Salmo salar , Protein metabolism, Non-essential amino acids, Palmaria palmata,Assimilation, Starch, Compound specific isotopes, High- and low-digestible carbohydrates
INTRODUCTIONCompound specific stable isotope analysis (CISA) of proteinogenic amino acids (AA) is anemerging tool for dietary reconstruction of finfishes. While stable carbon isotope analysis
How to cite this article Wang YV, Wan AHL, Krogdahl Å, Johnson M, Larsen T. 2019. 13C values of glycolytic amino acids as indicatorsof carbohydrate utilization in carnivorous fish. PeerJ 7:e7701 http://doi.org/10.7717/peerj.7701

of AA is predominantly applied for tracing biosynthetic origins of AA (Larsen et al., 2009;Larsen et al., 2013; O’Brien, Fogel & Boggs, 2002; Scott et al., 2006), a number of recentstudies show that the method has the potential to characterize a consumer’s intake of lipidsand carbohydrates (Leigh, Papastamatiou & German, 2018; Newsome et al., 2011; Newsomeet al., 2014; Whiteman et al., 2018). For example, CSIA has been applied to characterizeassimilation and digestion of diets with varyingmacromolecular composition in e.g., tilapiaand sharks, which in turn can be used to understand a species’ nutritional requirementsand ability to use resources in its environment (Leigh, Papastamatiou & German, 2018;Newsome et al., 2011; Whiteman et al., 2018). The origins of AA building blocks are highlydiverse. Of the 20 proteinogenic AA, half of them are classified as nutritionally essentialsince animals cannot synthesize their carbon backbones, depending instead on essentialEAA from the diet itself (McMahon et al., 2010; Reeds, 2000). This also means that theδ13C values of these AA typically match those in source protein with little or no isotopicoffsets (Jim et al., 2006; McMahon et al., 2010; O’Brien, Fogel & Boggs, 2002). Some aquaticconsumers may also rely on EAA supplemented from gut microbes but this pathway isusually confined to herbivores feeding on nutritionally insufficient diets (Arthur et al.,2014; Newsome et al., 2011). Metabolic routing of the other 10 proteinogenic AA, thenon-essentials (NEAA), are much more complex than for the EAA because their carbonskeletons may either be incorporated directly into proteinogic tissue or synthesized denovo from metabolic intermediates. While the term non-essential implies that animals cansynthesize them at a rate that meets the cellular demand for protein synthesis, it is welldocumented that adequate amounts of dietary NEAA are required for maximum growthand optimum health (Horvath et al., 1996; Womack & Rose, 1947). Thus, post-ingestive denovo synthesis of NEAA carbon skeletons may vary according to quality and supply ofdietary proteins (Newsome et al., 2011).
Animals synthesizeNEAA carbon backbones fromglycolytic or Krebs cycle intermediates(Berg et al., 2015). The carbon intermediates for the glycolytic AA, glycine (Gly), serine(Ser), and alanine (Ala), are thought to derive predominantly from carbohydrates andlipids (Fernandes, Nadeau & Grootes, 2012; Newsome et al., 2014; Wang et al., 2018). Forexample, naturally occurring stable carbon isotope (δ13C) variations of Ala are correlatedto human sugar consumption (Choy et al., 2013), and δ13C values of Gly and Ser are highlysensitive biomarkers of aquatic and terrestrial lipid origins in captive Atlantic salmon(Wang et al., 2018). In contrast, the Krebs cycle intermediate AA, aspartic acid (Asx),glutamic acid (Glx), and proline (Pro), are thought to be sourced predominantly fromdietary proteins and lipids (Fernandes, Nadeau & Grootes, 2012; Newsome et al., 2014).How species synthesize NEAA from carbon intermediates depends on their digestivephysiology and nutritional requirements. A study on carnivorous leopard sharks showedthat a dietary shift from squid to tilapia did not affect their AA metabolism despite thediets’ substantial differences in carbohydrate content (Whiteman et al., 2018). In contrast, astudy with bonnethead shark showed that glycogen synthesized from dietary carbohydrateswere used as intermediates for NEAA synthesis (Leigh, Papastamatiou & German, 2018).These different metabolic responses for sharks raise the question of how carnivorous bonyfishes utilize dietary macronutrients, and whether we can use naturally occurring markers
Wang et al. (2019), PeerJ, DOI 10.7717/peerj.7701 2/20

for assessing metabolic responses to dietary changes. It is becoming increasingly importantto understand how carnivorous fish species respond to dietary change because both wildand domesticated fishes are experiencing dramatic changes in the food or prey they eat.For example, Atlantic salmon is strictly carnivorous in the wild, but the proportion ofplant-based ingredients in salmon aquafeed is approaching 80% (Gatlin et al., 2007). Noother fish have gone through comparable changes in feeding ecology in the last decades,thus, it is important understanding the metabolic fate of the plant carbohydrate as well astheir effect on fish health (Hemre, Mommsen & Krogdahl, 2002).
Carbohydrates are not essential for Atlantic salmon since they are obligate carnivores(Krogdahl et al., 1999), but they are a cheap source of energy for aquafeed production, andhave useful pellet binding properties (Hemre & Krogdahl, 1996). While excessive inclusionof digestible carbohydrates in the feed may cause glycogen accumulation in the liverand impair the salmon’s hepatic function (Aksnes, 1995; Brudeseth, 1996; Frøystad et al.,2006; Hemre, Mommsen & Krogdahl, 2002; Tan et al., 2009), no or very low carbohydrateinclusions will reduce protein retention (Hemre et al., 1995) in part because glucose formedfrom carbohydrates can divert AA away from oxidative pathways (Cowey, De la Higuera& Adron, 1977; Sanchez-Muros et al., 1995). The main carbohydrates sources in aquafeedfor Atlantic salmon have, until now, derived from extruded maize, wheat and other plant-based starch in the forms of amylose and amylopectin (Krogdahl, Sundby & Bakke, 2011).These gelatinized starches are easier to digest compared to glucose and other mono- andpolysaccharides (Bogevik, 2015). Furthermore, a high inclusion of complex carbohydratesmay limit utilization of gelatinized starches (Hemre, Mommsen & Krogdahl, 2002). Despitethese less desirable nutritional properties of complex carbohydrates, macroalgae mealis now under investigation as a potential feed additive to promote salmon health anddigestion (Øverland, Mydland & Skrede, 2017), and already exists in commercial feedproducts including OceanFeedTM (Ocean Harvest, Gortnaloura, Ireland) and DigestSea R©
and Algimun R© (Olmix, Brittany, France). In a scientific feeding trial with Atlantic salmon,the inclusion of the red marine intertidal macroalgae Palmaria palmata, also known as reddulse, significantly decreased alanine transaminase activity, which indicated an improvedliver health (Wan et al., 2016). However, since P. palmata is rich in hardly digestiblecarbohydrates such as cellulose, hemicellulose and xylans (up to 60%) (Jiao et al., 2012),it is unclear how the inclusion of macroalgae affect carbohydrate utilization, lipid andcarbohydrate interaction as well as AA synthesis in Atlantic salmon.
In this study we investigate how varying proportions of high- and low-digestiblecarbohydrates affect δ13CNEAA values by analyzing Atlantic salmon and their diets in acontrolled feeding experiment (Wan et al., 2016). The two diets in our study have similarrelative proportions of macronutrients; i.e., the diets were isonitrogenous, isolipidic andisoenergetic (Table 1), but with different carbohydrate and protein sources. The controldiet comprised of 19% corn starch and 41% fishmeal, and the experimental diet of 8%corn starch, 36% fishmeal and 15% P. palmata (hereafter Palmaria) meal (Table 1).While protein quality is similar between the diets, the carbohydrates are different becausePalmaria consists mainly of mono- and polysaccharides, i.e., low-digestible carbohydrates(i.e., high in neutral detergent fibre) (Table 1). Neither feed intake nor growth performance
Wang et al. (2019), PeerJ, DOI 10.7717/peerj.7701 3/20

Table 1 Atlantic salmon (Salmo salar) diet composition and proximate composition for both controland Palmaria palmata inclusion experiment modified afterWan et al. (2016).
Control Palmaria inclusion
Diet formulation; %Fishmeala 40.74 35.75Fish oila 20.00 20.41Palmaria palmata – 15.00Extruded corn starchb (high-digestible carbohydrates) 18.76 8.34Wheat glutenc 9.00 9.00Pea protein concentratec 9.00 9.00Mineral & vitamin premixd 2.00 2.00Antioxidante 0.50 0.50Proximate compositionf;Moisture, % 6.3 6.6Crude protein, % 40.7 40.6Crude lipid, % 25.1 25.5Ash, % 8.3 9.9Gross energy, MJ Kg−1 26.2 26.1
Notes.Palmaria proximate composition: moisture 9%; crude protein 22%; crude lipid 1%, ash 25% and gross energy 15 MJ kg−1.And the estimated neutral detergent fibre, i.e., carbohydrates that resist to digestion and absorption, from Palmaria is 43%.
aUnited fish products Ltd., Donegal, Ireland.bLaboratory grade, Sigma–Aldrich Company Ltd., UK.cPurified feed ingredients, Roquette, France.dPremier nutrition products Ltd., UK. (Manufacturers analysis: Ca-12.09%, Ash-78.71%, Na-8.86%, Vitamin A-1.0µg kg−1,Vitamin D3 0.10%, Vitamin-E 7.0 g kg−1, Cu-250 mg kg −1, Mg 15.6 g kg−1 and P 5.2 g kg−1).
eBarox plus liquid, Kemin Europa N.V., Belgium.fn= 4.
differed significantly between the two diet groups (Wan et al., 2016). We hypothesize thatsubstitution of high- with low-digestible carbohydrates, i.e., substitution of corn starchwith Palmaria, will decrease overall carbohydrate digestibility and availability, which inturn affect howmetabolic intermediates are routed in the glycolysis pathway. The glycolyticAA are synthesized from two intermediates in glycolysis: 3-phosphoglyerate (Gly and Ser)and pyruvate (Ala) (Moran et al., 2012). We focus on the glycolytic AA because previousstudies have shown that they are particularly sensitive biomarkers of carbohydrate andlipid sourcing and metabolism. These macronutrients also serve as the primary energysources, and increased reliance of carbohydrates for energy may lead to a correspondingdecrease in the demand of lipids for energy. Thus, shifts metabolic routing in the glycolyticpathway is likely to affect δ13C values of glycolytic AA because lipids are generally 5–8%depleted in 13C compared to carbohydrates and protein. By decreasing the fraction ofhigh-digestible carbohydrates, we posit that downstream products directly associatedwith the glycolysis pathway would become more 13C enriched in the Palmaria thancontrol treatment (Control) because lipid derived intermediates would be routed to energyrather than tissue formation. We also analyzed the EAA to test whether EAA assimilationefficiency and protein preference would be similar for terrestrial (i.e., wheat gluten, peaprotein concentrate) and marine (i.e., fishmeal, Palmaria) derived protein sources. Finally,
Wang et al. (2019), PeerJ, DOI 10.7717/peerj.7701 4/20

to obtain the supporting information of the fate of dietary macromolecules, we alsomeasured bulk carbon and nitrogen isotopes in the diet and fish.
MATERIAL AND METHODSSource of salmon fillet and diet protein ingredientsThe feeding trial was conducted at the Carna Research Station, Ryan Institute, NUIGalway, Ireland, where inclusion of red (P. palmata) macroalga was compared to theControl group fed on a basal diet formulation. The salmon were fed on the experimentaldiets for 14 weeks to ensure that at least half of the muscle carbon pool would reflect thenew experimental diets (Jardine et al., 2004). At the end of trials, fish were euthanized byconcussion, and pithing of the cranium. Feeding trial was carried out under the oversightof National University of Ireland Galway’s Animal Care Research Ethics. Details of theexperimental design and diet compositions for the feeding study was previously publishedin (Wan et al., 2016). In short, the original feeding experiments were a factorial 4 × 1design with varying macroalgae percentage (0%, 5%, 10% and 15%) as the main factor.For this study, we only included salmon from the Control group and 15% macroalgaeinclusion group. For each treatment, we analyzed three fish from each of three differenttanks. The Control group were fed on ∼40% of fishmeal as the main source of protein.Both diets were isonitrogenous (40%), isolipidic (25%) and isoenergetic (26 MJ kg−1). Theexperimental group were fed alternative diet substituted with 15% of dried macroalgaeinto the diet by decreasing fishmeal by 5% and extruded corn starch by 10%, while thecompositions of other ingredients remained unchanged (Wan et al., 2016). Both Controland experimental diets also comprised two commonly used terrestrial protein sources:pea protein concentrate and wheat gluten meal at the same inclusion rate (9%). No AAwere added to the diet formula. A summarized description of the diet information andproximate composition for both Control and P. palmata inclusion experiment is presentedin Table 1 (modified after Wan et al., 2016). The effect of different experimental diets ongrowth performance, morphometric indices, and feed parameters (i.e., weight gain, feedconversion ratio, and specific growth rate etc.) was monitored throughout the experimentto ensure satisfactory growth rate (Fig. 1). In short, there were no significant differencesin the growth parameters (final weight and weight gain) and growth performance indicesbetween the Control and the Palmaria inclusion diets (Wan et al., 2016). Fillet musclesamples were collected after the fish was euthanized by a sharp blow to cranium andfollowed by pithing of the brain. Mixed sex salmon smolt were sourced from DerryleaHoldings Ltd. (Lough Fee, Connemara, Ireland) and the detailed information of fish carewas described in (Wan et al., 2016).
Stable isotope analysesWe measured the carbon stable isotope ratios of the individual amino acids (δ13CAA)of salmon and diet at Leibniz-Laboratory for Radiometric Dating and Stable IsotopeResearch in Kiel, Germany. Freeze-dried fish fillet were homogenized and approximately4 mg of each sample were analyzed for compound specific stable isotope analyses(Wang et al., 2018). For the diet samples, three replicate samples of each compound diet
Wang et al. (2019), PeerJ, DOI 10.7717/peerj.7701 5/20

Time (Weeks)0 2 4 6 8 10 12 14
(g)
thgieW nae
M
150
200
250
300
350
400
450
Palmaria_addControl
Figure 1 Growth weight curve (mean± SD, n = 3) of Atlantic salmon smolt for the both the Controland Palmaria palmata inclusion treatments during the fourteen-week feeding trial.
Full-size DOI: 10.7717/peerj.7701/fig-1
and individual dietary components (each homogenized, ∼10 mg each) were analyzed forCSIA on a Gas Chromatogram (GC) connected to a MAT 253 (Thermo-Fisher Scientific(Bremen) GmbH, Bremen, Germany) Isotope Ratio Mass Spectrometer (IRMS). Thedetailed procedure for AA hydrolyses and derivatization, carbon correction and datacalibration as well as the GC temperature setting is described in Wang et al. (2018). Inshort, each sample was hydrolyzed in 1mL of 6 N HCl at 110 ◦C in a heating block for20 h. To remove lipophilic compounds before derivatization, we vortexed the hydrolyzedsamples with 2ml n-hexane/DCM (6:5, v/v) for 30 s and subsequently discarded the solventfrom the aqueous phase. The AA were derivatized to N -acetyl methyl esters following theprotocols by Larsen et al. (2013) and Corr, Berstan & Evershed (2007). We also derivatizedand analyzed a mixture of pure AA with known δ13C values under the same conditionsas the samples to calculate correction factors specific to each AA to account for carbonaddition and fractionation during derivatization (Larsen et al., 2013).
Isotope data are expressed in delta (δ) notation:
δiEsample=
(iEjE
)sample
−
(iEjE
)ref(
iEjE
)Ref
.
For the certain element E, the ratio of heavy (i) to light (j) isotope are measured inboth sample and references (Coplen & Shrestha, 2016). Since isotope values are smallnumbers, they are multiplied by 1000 and expressed as per mil (h). Calibration ofour internal standard AA-mixture was carried out against the known δ13C values ofA4 mixture (available from A. Schimmelmann, Biogeochemical Laboratories, Indiana
Wang et al. (2019), PeerJ, DOI 10.7717/peerj.7701 6/20

University, USA). The isotope ratios are expressed relative to international standardsVienna Pee Dee Belemnite (VPDB) for carbon. In regard to analytical uncertainty, theaverage reproducibility for the internal reference standard nor-leucine (Nle) was 0.3h(n= 3 for each batch) and the in-house AA standards ranged from 0.2h for Pro to 0.6hfor Ala (n = 4–7 for each batch). We were able to analyze the following 15 AA: NEAA;alanine (Ala), asparagine/aspartic acid (Asx), glutamine/glutamic acid (Glx), glycine (Gly),proline (Pro), tyrosine (Tyr) and serine (Ser), and EAA; histidine (His), isoleucine (Ile),leucine (Leu), lysine (Lys), methionine (Met), phenylalanine (Phe), threonine (Thr), andvaline (Val). See Fig. S1 online for a chromatogram of salmon muscle generated from theGC-Combustion-Isotope Ratio Mass Spectrometer (GC-C-IRMS).
Duplicates of compound diets and individual protein ingredients were analyzed forbulk carbon and nitrogen at the Stable Isotope Facility of the Experimental EcologyGroup, GEOMAR, Kiel, Germany. Approximately 100 µg dry mass of each sample wasweighed into tin capsules and analyzed on a customised elemental analyzer (EA 1110,Fisons Instruments, Milan, Italy) connected to a ThermoElectron DeltaPlus AdvantageIRMS (Hansen & Sommer, 2007). The isotope ratios are expressed relative to internationalstandards; VPDB for carbon and atmospheric air for nitrogen. For the detailed descriptionof the calibration of the data, see description previously in Wang et al. (2018). In short,calibration of internal standard was carried out against certified reference material (IAEA-N1, IAEA-N2, IAEA-N3 for δ15N and IAEA-CH-3, IAEA-CH6, IAEA-CH-7 for δ13C).Internal standard conducted for bulk δ13C and δ15N analyses during the sample sequenceyielded 1σ = 0.2h and 0.2h, respectively. Because lipids have more negative δ13C valuesthan proteins, it is important to account for the large variability in lipid content, whichcan affect the δ13C values of bulk tissue and lead to false interpretation. Thus, the negativeδ13C values are commonly corrected by extracting lipids from samples prior to isotopeanalyses, or applying a mathematical correction after isotope analyses based on sample C:Nratios (Logan et al., 2008; Logan & Lutcavage, 2008). We opted for the latter and appliedposterior correction to the δ13C values if the fishmeal samples C:N ratio was greater than3.5, following Logan et al. (2008). Given that the fishmeal is non-tissue specific and ofmarine origins, we used the all-tissue correction parameters for marine fish (Logan et al.,2008). A similar posterior correction was also applied to fish muscle as previously describedand published inWang et al. (2018).
Statistical analysesAll statistical analyses were performed using R version 3.4.3 (R Core Team, 2017)(Supplementary Information). All values in the text are given as mean and itscorresponding standard deviation (SD). For each tank, the mean δ13CAA values of fishare based on triplicate fish analyses. Isotope offset between fish muscle (F) and diet(113CF−D) were calculated for all amino acid and bulk isotopes of each treatment as113CF−D= δ
13CF−δ13CD, where the δ13CF and δ13CD represent the δ13C values of the fish
(i.e., Atlantic salmon) and diet (both compound diet and individual protein ingredients),respectively. Assuming independent variables, the error term for 113CF−D are propagated
according to√SD2
F+SD2D (Ku, 1966). We used univariate Analysis of Variance (ANOVA)
Wang et al. (2019), PeerJ, DOI 10.7717/peerj.7701 7/20

performed on the output from Multivariate Analysis of Variance (MANOVA) to accesswhich dependent variables (δ13CAA values) are significantly different between groups (Rfunction: summary.aov). The P-adjusted values from this ANOVA decomposition test wasobtained using p. adjust function with FRD method (Benjamini & Hochberg, 1995). Wedid not perform student t -test for comparing the bulk isotope values of two compounddiet as we only have duplicate runs for each diet. The student t -tests were performedto compare the mean EAA 113CF−D values of both treatments. Unless otherwise stated,statistical significance is assessed at P < 0.01. Due to our small sample numbers, we chosea 0.01 significance level (α) to decrease the probability of Type I error. The statistical testsresults are presented in the Supplementary Information.
RESULTSAmino acid and bulk carbon isotope values of compound diets andprotein ingredientsAmong the four different dietary ingredients, δ13CAA values of fishmeal were the highest forall AA except for Lys and Met, which were slightly lower than those of Palmaria by 1–2h.In general, δ13C values (both AA and bulk) of marine sourced proteins (i.e., fishmeal andPalmaria) were much higher than the terrestrial protein sources (Fig. 2 and Tables S1 andS2) with the exception that the Gly δ13C values of Palmaria is slightly lower than that ofwheat gluten but higher than pea protein. Accordingly, δ13CAA and δ13Cbulk values of thecompound diets are in between those of the marine and terrestrial dietary sources (Fig. 2and Table S1). For the NEAA, the δ13C range was widest for Pro, Ser, and Gly (∼13 h)and narrowest for Ala and Tyr (∼6 h). For the EAA, the range was widest for Met (∼12h) and narrowest for Phe (∼6 h). Among all AA in the individual ingredients, Ser, Glyand Thr were the most 13C-enriched in both treatments, whereas Tyr, Phe, and Leu werethe most 13C-depleted (Fig. 2). In general, δ13CAA and δ13Cbulk values of marine sourcedprotein fishmeal and Palmaria were more similar except for Ser and Gly (up to 8.9hdifference). Likewise, individual AA δ13C and δ13Cbulk values of wheat gluten were similarto those of pea protein concentrate except for Gly and Ile (Fig. 2). Although the mean bulkδ13C value of the Palmaria containing diet was 1.1h lower than that of the Control diet,δ13Cbulk values of fish muscle for both Control and Palmaria inclusion groups are identical(both δ13C = 20.2h) (Fig. 2 and Table S1).
δ13CNEAA offsets between fish muscle and compound dietsTherewas a large variability in 13CF-D offset (113CF−D) between fish and the compound dietfor the individualNEAA. The113CF−D values of all NEAA except Asx (∼0h) showedmuchgreater variability, ranging from Ala (−6.8h) to Ser (5.9h) (Figs. 2A and 2B). Moreover,113CF−D values of the NEAA were typically higher than their respective compound diet,with the exception of Ala in both treatments andGly in theControl treatment. Furthermore,113CF−D values of glycolytic amino acids and Tyr in Palmaria treatment were significantlydifferent from those in Control diet treatment (ANOVA, P-adjusted < 0.01, Table S3).In contrast, there was no difference between two treatments for Krebs cycle AA Glx, Asxand Pro (ANOVA, P-adjusted=0.03, 0.153 and 0.25, respectively, Table S4). The NEAA
Wang et al. (2019), PeerJ, DOI 10.7717/peerj.7701 8/20

Ser Gly Ala Glx Asx Pro Tyr Thr Lys His Ile Met Val Phe Leu bulk
airamlaP dda_
Control
FishMealPea protein
Wheat gluten
Palmaria palmata
teid dnuopmoC
stneidergnI
Essential amino acidsGlycolytic amino acids
Krebs amino acids
C (‰
)
Figure 2 δ13CAA and δ13Cbulk values (mean± SD) of compound diet and individual dietary proteincomponents for both Control and experimental Palmaria palmata inclusion treatments. Labels for thecompound diets for both Control and experimental fish trials: Control and Palmaria_add; The dietary in-gredients are fishmeal, pea protein concentrate, wheat gluten, and P. palmata. For visual clarity, the aminoacids for individual dietary ingredients are connected by lines of different colors.
Full-size DOI: 10.7717/peerj.7701/fig-2
113CF−D values in Palmaria fed fish were generally larger (e.g., up to 3.4h for Gly) thanthose of the Control fed fish. The patterns observed for 113CF−D values of all NEAA alsomirrored the patterns observed in the 113CF−D of bulk samples (Figs. 3A and 3B).
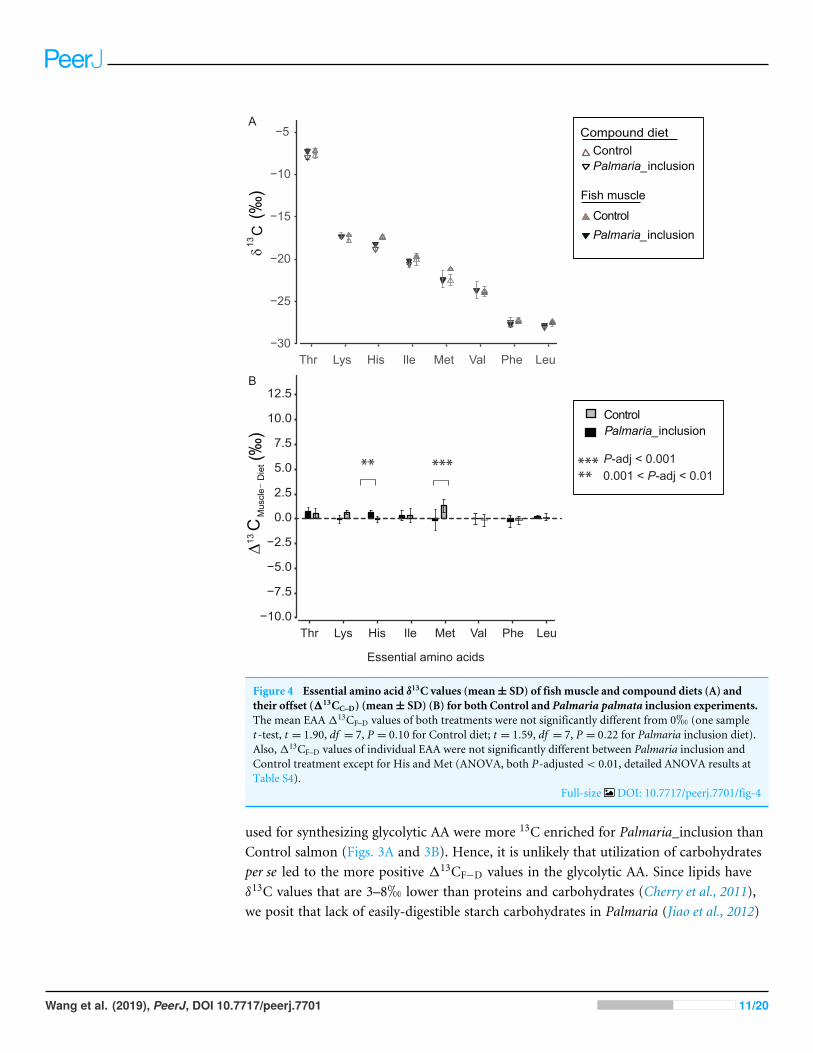
δ13CEAA offsets between fish muscle and compound dietsThe δ13CEAA patterns of fish muscle largely to reflect that of the compound diets insteadof individual protein components for both treatments (Fig. 4A and Fig. S2). The δ13CEAA
values of the fish muscle and compound diet are almost identical, resulting in a mean offsetof 0.34h and 0.18h, respectively for Control and Palmaria inclusion group (Figs. 4A and4B). The mean EAA 113CF−D values of both treatments were not significantly differentfrom 0h (one sample t -test, t = 1.90, df = 7, P = 0.099 for Control diet; t = 1.59, df = 7,P = 0.213 for Palmaria inclusion diet). There was no apparent isotopic offset betweensalmon muscle (fish) and diets (113CF−D) for EAA (Figs. 4A and 4B) except for Metbeing 1.3 ± 0.7h more positive than the compound diet in the Control diet group. Also,113CF−D values of individual EAA were not significantly different between Palmariainclusion and Control treatment except for His and Met (ANOVA, both P-adjusted <0.01, detailed ANOVA results at Table S4).
DISCUSSIONOur isotopic results show that Atlantic salmon from the two experiments utilized themacronutrients differently because substitution of high- with low-digestible carbohydratesled to more positive offsets between fish and their diets (113CF−D) of the glycolytic AA,Ser, Gly and Ala. In our study, the starch fraction of the diets (i.e., 19% for Control vs.8% for Palmaria_inclusion experiment) was the greatest variable that influenced113CF−D
because both lipid sources were kept consistent and proteins were functionally similarbetween the two compound diets (Wan et al., 2016). Therefore, we argue that the primary
Wang et al. (2019), PeerJ, DOI 10.7717/peerj.7701 9/20

Ser Gly Ala Glx Asx Pro Tyr
** *** ** **
A
B
Glycolytic amino acids Krebs amino acids
Palmaria_inclusionControl
*** P** P
Ser Gly Ala Glx Asx Pro Tyr
Palmaria_inclusionControl
Palmaria_inclusionControl
Compound diet
Fish muscle
Bulk
Bulk
C(‰
)13
CM
uscl
eD
iet(‰
)13
−
Figure 3 Non-essential amino acid and bulk δ13C values (mean± SD) of fish muscle and compounddiets (A) and their offset (113CF–D) (mean± SD) for both Control and Palmaria palmata inclusion ex-periments (B). Glycolytic amino acids and Tyr113CF–D values in Palmaria treatment were significantlydifferent from those in Control diet treatment (ANOVA, P-adjusted< 0.01, Table S3). In contrast, therewas no difference between two treatments for Krebs cycle amino acids Glx, Asx and Pro (ANOVA, P-adjusted= 0.03, 0.153 and 0.25, respectively, Table S3). We did not perform statistical comparison be-tween the bulk samples as we only measured bulk isotopes of fish and diet twice each.
Full-size DOI: 10.7717/peerj.7701/fig-3
cause for the greater discrimination factor of the three glycolytic AA can be ascribed toinclusion of low-digestible carbohydrates.
The more negative bulk δ13C values of the Palmaria than Control compound diet(Fig. 3A) can largely be attributed to two factors: (1) Gly and Ser are 13C depleted by8–10h in Palmaria compared to fishmeal proteins (Fig. 2), and (2) bulk Palmaria is ca.10h more 13C depleted (−20h, this study, Table S1) than corn starch (−10h, Tieszen &Fagre, 1993). Despite the more negative values of these compounds and ingredients in thePalmaria diet, the 113CF−D values of bulk and the three glycolytic AA are larger for thePalmaria than theControl salmon group (Figs. 3A and 3B), indicating that the intermediates
Wang et al. (2019), PeerJ, DOI 10.7717/peerj.7701 10/20
Thr Lys His Ile Met Val Phe Leu
Essential amino acids
*****
B
A
Palmaria_inclusionControl
*** P** P
Thr Lys His Ile Met Val Phe Leu
Palmaria_inclusionControl
Palmaria_inclusionControl
Compound diet
Fish muscle
C(‰
)13
CM
uscl
eD
iet(‰
)13
−
Figure 4 Essential amino acid δ13C values (mean± SD) of fish muscle and compound diets (A) andtheir offset (113CC–D) (mean± SD) (B) for both Control and Palmaria palmata inclusion experiments.The mean EAA113CF–D values of both treatments were not significantly different from 0h (one samplet -test, t = 1.90, df = 7, P = 0.10 for Control diet; t = 1.59, df = 7, P = 0.22 for Palmaria inclusion diet).Also,113CF–D values of individual EAA were not significantly different between Palmaria inclusion andControl treatment except for His and Met (ANOVA, both P-adjusted< 0.01, detailed ANOVA results atTable S4).
Full-size DOI: 10.7717/peerj.7701/fig-4
used for synthesizing glycolytic AA were more 13C enriched for Palmaria_inclusion thanControl salmon (Figs. 3A and 3B). Hence, it is unlikely that utilization of carbohydratesper se led to the more positive 113CF−D values in the glycolytic AA. Since lipids haveδ13C values that are 3–8h lower than proteins and carbohydrates (Cherry et al., 2011),we posit that lack of easily-digestible starch carbohydrates in Palmaria (Jiao et al., 2012)
Wang et al. (2019), PeerJ, DOI 10.7717/peerj.7701 11/20

increased the demand for dietary lipids as an energy source and correspondingly decreasedthe fraction of lipids available for biosynthesizing NEAA intermediates.
A recent study comparing Atlantic salmon fed compound diets with isotopically distinctlipid sources found that lipids are sourced to glycolytic rather than Krebs AA (Wanget al., 2018). This result indicates that carbon for acetyl CoA, an upstream precursor ofKrebs cycle AA, is sourced more from protein- than lipid-derived building blocks. In ourstudy, we found no 113CF−D difference in Krebs AA between the two treatments furthercorroborating that Krebs AA are sourced more from proteins than lipid and carbohydrates.It is possible that the decrease in digestible starch content also increased gluconeogenesis,i.e., generation of glycolytic metabolites from AA oxidation. How this pathway affect thediscrimination factor for the glycolytic AA in an obligate carnivore is unclear. A studywith calorie restricted rats demonstrated that increased AA oxidation led to a 113CF−D
decrease in proteins and their constituent NEAA and EAA (Huneau et al., 2019). As alreadymentioned above, we observe a general 113CF−D increase rather than decrease in thePalmaria treatment for the NEAA (significant for half of them) and no change for the EAA(Fig. 4 and Table S3). Thus, we find it less likely that Palmaria inclusion led to increased AAoxidation. Finally, we rule out the possibility that relative differences in the abundance ofdietary AA contributed to the different discrimination factors between the two treatmentsbecause the molar balance between the two composite diets are almost identical (Table S5).
Interestingly, 113CF−D values were positive for Ser and Gly and negative for Alaindicating that pyruvate was more 13C depleted than 3-phosphoglycerate. Severalprocesses could have contributed to this contrasting 13C-offset between the two glycolyticintermediates. Pyruvate is a major substrate for oxidative metabolism, and a branchingpoint for synthesis of lactate, fatty acid, alanine and Krebs cycle intermediates (McCommis& Finck, 2015). While pyruvate in Atlantic salmon is mainly produced via the glycolyticpathway, it can also be produced by conversion of lactate and oxaloacetate (Kanehisa etal., 2016). How these multiple pathways contribute to isotopic discrimination of pyruvaterelative to 3-phosphoglycerate is exceedingly complex because isotopic discriminationdepends on the intrinsic fractionation of a reaction and the relative flow of intermediatesthrough that reaction pathway. For Atlantic salmon, glycolysis appears to be the mainpathway for synthesizing both pyruvate and 3-phosphoglycerate because change in thestarch fraction of the diets from 19% to 8% and consequent change in lipid metabolismled to similar directional change in the isotope discrimination factor.
Enhanced gut microbial activity in the Palmaria treatment perhaps offers an alternativeexplanation for the more positive 113CF−D values of the glycolytic AA in the Palmariatreatment. Such activity would lead to increased loss of 13C depleted CO2 resulting in more13C enriched metabolic intermediates for NEAA biosynthesis (Larsen et al., 2016). Thisalternative possibility rests on the premise that the greater viscosity and lower digestibilityof the seaweed carbohydrates compared to corn starch slowed down gut transit time andincreased microbial digestion of dietary carbohydrates, i.e., seaweed inclusion changed thesalmons’ gut microbiome to facilitate carbohydrate digestion and metabolism (Gajardo etal., 2016). However, we find the putative effect of microbial activity on the discriminationfactor less likely because Palmaria inclusion did not appear to affect growth performance
Wang et al. (2019), PeerJ, DOI 10.7717/peerj.7701 12/20

(Wan et al., 2016) indicating that the fish did not lack energy or metabolic intermediates.Finally, the offset in δ15N values between fish muscle and diet between the two groups(115NF−D values) are the same further suggesting no enhanced microbial activity in thePalmaria_inclusion experiment (Table S1).
Unlike the other NEAA, the 113CF−D of Asx is ∼0h for both the Control andPalmaria salmon, which is an unusual finding in fish feeding studies (McMahon et al.,2010; Newsome et al., 2011; Whiteman et al., 2018). The virtually identical δ13CAsxvaluesbetween salmon and their compound diets does not necessarily mean that Asx was routedexclusively from dietary sources to muscle tissue because Atlantic salmon do produceenzymes for catalysing the interconversion of oxaloacetate and glutamate to aspartateand α-ketoglutarate (Kanehisa et al., 2016). If salmon indeed synthesized Asx de novo, 13Cfractionation during Asx synthesis coincidently led to similar δ13C values between dietand de novo synthesized Asx. Further feeding studies varying all three macronutrients (i.e.,protein, lipid and carbohydrates) would be needed to explain the isotope discriminationfactor of Asx.
We also compared 113CF−D values of EAA between Atlantic salmon and their proteinsources to investigate EAA assimilation of terrestrial and marine protein sources. For theEAA, δ13CEAA values between fish muscle and their compound diets are mostly identicalin both treatments except for Met (Figs. 4A and 4B). This finding corroborates withprevious findings that EAA is passed on from dietary sources to fish without alternationof their carbon skeletons (McMahon et al., 2010). Our study indicates that there was nopreferential EAA assimilation of any of the three protein source in the compound dietsbecause δ13CEAA values in salmon were similar between the two treatments and to thecompound diets. This finding was expected given that feed conversion ratios (FCR forControl, 1.28 ± 0.10; and for Palmaria diet, 1.32 ± 0.03) during the feeding trial werecomparable across the macroalgal inclusion diet and Control diet (Wan et al., 2016). Ournear zero113CF−D values for all EAA in both feeding experiments rule out, unsurprisingly,EAA supplementation by gut microbes to host (McMahon et al., 2010).
Both protein digestibility and availability in commercial aquafeeds are designed to ensuremaximumgrowth and feed utilization. This was also the case for the diets in our feeding trial(Wan et al., 2016); hence, both our diets had almost identical AA composition (see TableS5). It is also evident from the AA composition data that there are apparent AAmismatchesbetween salmon and their diets. This raises the question whether these mismatchescorrelate with NEAA discrimination factors, because dietary deficiencies could lead tohigher synthesis rates of particular NEAA to meet metabolic demands. We did not findsuch correlations (R2
= 0.0003 for Control and R2= 0.08 for Palmaria diet, respectively),
which underlines that discrimination factors are determined by multiple factors. Our studyhighlights that one of those factors is metabolic utilization of dietary macromolecules; inour case how carbohydrate availability presumably affect lipid utilization. Other factorsthat could affect metabolic demands are infection, recoveries from injury, physical activitiesand digestive processes (Dunstan et al., 2019). In addition, proteomics studies show thatsynthesis and degradation rates of individual proteins in fish vary greatly (Doherty et al.,
Wang et al. (2019), PeerJ, DOI 10.7717/peerj.7701 13/20

2012). Since the AA composition vary between proteins, this is another factor that maylead to a disproportionally greater turnover of certain AA than others.
One potential bias in using δ13CAA to assess dietary routing in salmon is whether theAA yield from acid protein hydrolysis in the laboratory is comparable to the yield from thesalmons’ digestive system. Given that we have an analytical uncertainty of approximately0.5h and a dynamic range between terrestrial and marine derived AA of 7–12h, ourresults suggests that this bias is very small because no EAA except Met have significantlydifferent δ13CEAA values between salmon muscle tissues and compound diets in theControl group. In this case, Met of fish muscle has slightly higher δ13C values than theircompound diet by 1.3 ± 0.7h. This result may be caused by methionine loss during acidhydrolysis (Jennings & Lewis, 1969) or analytical uncertainty due to the low abundance ofMet (Fig. S1). Alternatively, 13C fractionation of methionine may occur when it is used forother purposes than protein synthesis, e.g., for synthesizing cysteine used for producingpancreatic proteases (Holm, Fossum & Eide, 1973).
CONCLUSIONSOur previous study (Wang et al., 2018) demonstrated that δ13C values of the glycolytic AAare sensitive markers of lipid origins (i.e., terrestrial vs. marine). By comparing treatmentswhere corn meal was replaced by macroalga, we show that glycolytic AA are sensitive tothe dietary carbohydrate sources and digestibility. The most parsimonious explanationfor the more positive 113CF−D values of the glycolytic AA in the Palmaria treatment isa decreased sourcing of lipid derived intermediates to AA synthesis because Palmariacarbohydrates are more 13C depleted than corn starch. While more feeding studies arewarranted for understanding metabolic routing of macronutrients, our findings show howcharacterization of δ13CAA variability can be used to trace relative contributions of dietarycarbohydrates, proteins and lipids for de novo NEAA biosynthesis for carnivorous bonyfish raised under normal feeding and husbandry conditions. Furthermore, our resultsindicate δ13CAA analysis can provide supplementary information on the gut microbiome’srole in carbohydrate digestion and metabolism. The wider adoption of compound specificisotope analysis, particularly for AA, can greatly improve our understanding of nutrientutilization during the fish growth of different aquaculture species and life stages (Le Vay &Gamboa-Delgado, 2011; Newsome et al., 2011; Whiteman et al., 2018). Feeding studies suchas ours also help in validating assumptions and limitations on how to interpret δ13CNEAA
values in ecological studies.
ACKNOWLEDGEMENTSThe authors would like to thank Robert Priester for the laboratory assistance and KarstenGramenz and Dr. Nils Andersen at the Leibniz Laboratory, Kiel for technical assistance. Weare grateful for Prof. Yoshito Chikaraishi and one anonymous reviewer for their valuablecomments, which improved the manuscript.
Wang et al. (2019), PeerJ, DOI 10.7717/peerj.7701 14/20

ADDITIONAL INFORMATION AND DECLARATIONS
FundingThis work was supported by the Cluster of Excellence 80 ‘‘The Future Ocean’’. The ‘‘FutureOcean’’ is funded within the framework of the Excellence Initiative by the DeutscheForschungsgemeinschaft (DFG) on behalf of the German federal and state governments.Yiming V.Wang was supported by the German FederalMinistry of Education and Research(BMBF) [grant No. 03F0722A] during 2017–2018. Thomas Larsen is supported by BMBF[grant No. 07F00805A]. Alex H.L. Wan was supported by Grant-Aid [Agreement No.MFFRI/07/01] under the Sea Change Strategy with the support of the Marine Instituteand also National Development Plan 2007–2013 grant to the Department of Agriculture,Food and the Marine, Ireland. The funders had no role in study design, data collection andanalysis, decision to publish, or preparation of the manuscript.
Grant DisclosuresThe following grant information was disclosed by the authors:Cluster of Excellence 80 ‘‘The Future Ocean’’.Excellence Initiative by the Deutsche Forschungsgemeinschaft (DFG) on behalf of theGerman federal and state governments.German Federal Ministry of Education and Research (BMBF): 03F0722A.BMBF: 07F00805A.Department of Agriculture, Food and the Marine, Ireland: MFFRI/07/01.
Competing InterestsThe authors declare there are no competing interests.
Author Contributions• Yiming V. Wang and Thomas Larsen conceived and designed the experiments, analyzedthe data, contributed reagents/materials/analysis tools, prepared figures and/or tables,authored or reviewed drafts of the paper, approved the final draft.• Alex H.L. Wan performed the experiments, analyzed the data, contributedreagents/materials/analysis tools, prepared figures and/or tables, approved the finaldraft.• Åshild Krogdahl approved the final draft, editorial view and critical comments anddiscussion on Atlantic salmon physiology.• Mark Johnson performed the experiments, contributed reagents/materials/analysis tools,approved the final draft.
Animal EthicsThe following information was supplied relating to ethical approvals (i.e., approving bodyand any reference numbers):
NUI Galway Animal Care Research Ethics Committee is the NUI Galway’s governingbody in Institutional Animal Care andUse. The fish feeding trial reported in themanuscriptdoes not require Animal Care Research Ethics Committee’s approval as it did not
Wang et al. (2019), PeerJ, DOI 10.7717/peerj.7701 15/20

conduct any procedures on the animals while they were alive, e.g., tissue harvest. Thisis a conventional feeding trial and only comprise conventional animal husbandry (feeding,growing andweighing) andwere euthanised by trained individuals using approvedmethodsunder Irish/EU regulation, e.g., i.e., concussion to the cranium and pithing of the brain.
Data AvailabilityThe following information was supplied regarding data availability:
The raw data is available at GitHub: https://github.com/alsjmonsoon/Salmon-Feeding-Study. The code is available as Supplemental File.
Supplemental InformationSupplemental information for this article can be found online at http://dx.doi.org/10.7717/peerj.7701#supplemental-information.
REFERENCESAksnes A. 1995. Growth, feed efficiency and slaughter quality of salmon, Salmo salar L.,
given feeds with different ratios of carbohydrate and protein. Aquaculture Nutrition1:241–248 DOI 10.1111/j.1365-2095.1995.tb00050.
Arthur KE, Kelez S, Larsen T, Choy CA, Popp BN. 2014. Tracing the biosyntheticsource of essential amino acids in marine turtles using δ13C fingerprints. Ecology95:1285–1293 DOI 10.1890/13-0263.1.
Benjamini Y, Hochberg Y. 1995. Controlling the false discovery rate: a practical andpowerful approach to multiple testing. Journal of the Royal Statistical Society SeriesB (Methodological) 57:289–300 DOI 10.1111/j.2517-6161.1995.tb02031.x.
Berg JM, Stryer L, Tymoczko JL, Gatto GJ. 2015. Biochemistry. New York: W.H.Freeman and Company.
Bogevik AS. 2015. Xylanase supplementation in fish feed. Tromsø: Nofima, 15.Brudeseth L. 1996.Hydrolysis of carbohydrates in intestinal mucosa of atlantic salmon
(Salmo salar) and mink (Mustela vision) Dr. Scient. Oslo: Norwegian School ofVeterinary Science.
Cherry SG, Derocher AE, Hobson KA, Stirling I, Thiemann GW. 2011. Quantifyingdietary pathways of proteins and lipids to tissues of a marine predator. Journal ofApplied Ecology 48:373–381 DOI 10.1111/j.1365-2664.2010.01908.x.
Choy K, Nash SH, Kristal AR, Hopkins S, Boyer BB, O’Brien DM. 2013. The car-bon isotope ratio of alanine in red blood cells is a new candidate biomarkerof sugar-sweetened beverage intake. The Journal of Nutrition 143:878–884DOI 10.3945/jn.112.172999.
Coplen TB, Shrestha Y. 2016. Isotope-abundance variations and atomic weights ofselected elements: 2016 (IUPAC Technical Report). Pure and Applied Chemistry88:1203–1224 DOI 10.1515/pac-2016-0302.
Wang et al. (2019), PeerJ, DOI 10.7717/peerj.7701 16/20

Corr LT, Berstan R, Evershed RP. 2007. Development of N-acetyl methyl ester deriva-tives for the determination of δ13C values of amino acids using gas chromatography-combustion-isotope ratio mass spectrometry. Analytical Chemistry 79:9082–9090DOI 10.1021/ac071223.
Cowey C, De la Higuera M, Adron J. 1977. The effect of dietary composition and ofinsulin on gluconeogenesis in rainbow trout (Salmo gairdneri). British Journal ofNutrition 38:385–395 DOI 10.1079/BJN19770103.
Doherty MK, Brownridge P, OwenMAG, Davies SJ, Young IS, Whitfield PD. 2012. Aproteomics strategy for determining the synthesis and degradation rates of individualproteins in fish. Journal of Proteomics 75:4471–4477 DOI 10.1016/j.jprot.2012.03.025.
Dunstan RH,MacdonaldMM,Murphy GR, Thorn B, Roberts TK. 2019.Modelling ofprotein turnover provides insight for metabolic demands on those specific aminoacids utilised at disproportionately faster rates than other amino acids. Amino Acids51:945–959 DOI 10.1007/s00726-019-02734-1.
Fernandes R, NadeauM-J, Grootes PM. 2012.Macronutrient-based model for dietarycarbon routing in bone collagen and bioapatite. Archaeological and AnthropologicalSciences 4:291–301 DOI 10.1007/s12520-012-0102-7.
FrøystadMK, Lilleeng E, Sundby A, Krogdahl Å. 2006. Cloning and characteriza-tion of α-amylase from Atlantic salmon (Salmo salar L.). Comparative Biochem-istry and Physiology Part A: Molecular & Integrative Physiology 145:479–492DOI 10.1016/j.cbpa.2006.08.003.
Gajardo K, Rodiles A, Kortner TM, Krogdahl Å, Bakke AM,Merrifield DL, SørumH. 2016. A high-resolution map of the gut microbiota in Atlantic salmon (Salmosalar): a basis for comparative gut microbial research. Scientific Reports 6:30893DOI 10.1038/srep30893.
Gatlin DM, Barrows FT, Brown P, Dabrowski K, Gaylord TG, Hardy RW, HermanE, Hu G, Krogdahl A, Nelson R, Overturf K, Rust M, SealeyW, Skonberg D,Souza EJ, Stone D,Wilson R,Wurtele E. 2007. Expanding the utilization ofsustainable plant products in aquafeeds: a review. Aquaculture Research 38:551–579DOI 10.1111/j.1365-2109.2007.01704.
Hansen T, Sommer U. 2007. Increasing the sensitivity of δ13C and δ15N abundancemeasurements by a high sensitivity elemental analyzer connected to an isotoperatio mass spectrometer. Rapid Communications in Mass Spectrometry 21:314–318DOI 10.1002/rcm.2847.
Hemre G-I, Krogdahl Å. 1996. Effect of handling and fish size on secondary changes incarbohydrate metabolism in Atlantic Salmon, Salmo salar L. Aquaculture Nutrition2:249–252 DOI 10.1111/j.1365-2095.1996.tb00067.
Hemre G-I, Mommsen TP, Krogdahl Å. 2002. Carbohydrates in fish nutrition: effects ongrowth, glucose metabolism and hepatic enzymes. Aquaculture Nutrition 8:175–194DOI 10.1046/j.1365-2095.2002.00200.
Hemre G-I, Sandnes K, Lie Ø, Torrissen O,Waagbø R. 1995. Carbohydrate nutrition inAtlantic salmon, Salmo salar L.: growth and feed utilization. Aquaculture Research26:149–154 DOI 10.1111/j.1365-2109.1995.tb00896.
Wang et al. (2019), PeerJ, DOI 10.7717/peerj.7701 17/20

HolmH, FossumK, EideWB. 1973. Chemical and biological evaluation of proteinquality of locally produced and processed full-fat soya bean flour from threetanzanian villages. Journal of the Science of Food and Agriculture 24:333–341DOI 10.1002/jsfa.2740240310.
Horvath K, JamiM, Hill I, Papadimitriou J, Magder LS, Chanasongcram S.1996. Isocaloric glutamine-free diet and the morphology and function ofrat small intestine. Journal of Parenteral and Enteral Nutrition 20:128–134DOI 10.1177/0148607196020002128.
Huneau J-F, Mantha OL, Hermier D, Mathé V, Galmiche G, Mariotti F, Fouillet H.2019. Natural isotope abundances of carbon and nitrogen in tissue proteins andamino acids as biomarkers of the decreased carbohydrate oxidation and increasedamino acid oxidation induced by caloric restriction under a maintained proteinintake in obese rats. Nutrients 11(5):1087 DOI 10.3390/nu11051087.
Jardine TD, MacLatchy DL, FairchildWL, Cunjak RA, Brown SB. 2004. Rapid carbonturnover during growth of Atlantic Salmon (Salmo salar) smolts in sea water, andevidence for reduced food consumption by growth-stunts. Hydrobiologia 527:63–75DOI 10.1023/B:HYDR.0000043182.56244.f6.
Jennings DM, Lewis OAM. 1969.Methionine loss during protein hydrolysisof plant material. Journal of Agricultural and Food Chemistry 17:668–669DOI 10.1021/jf60163a019.
Jiao G, Yu G,WangW, Zhao X, Zhang J, Ewart SH. 2012. Properties of polysac-charides in several seaweeds from Atlantic Canada and their potential anti-influenza viral activities. Journal of Ocean University of China 11:205–212DOI 10.1007/s11802-012-1906.
Jim S, Jones V, Ambrose SH, Evershed RP. 2006. Quantifying dietary macronu-trient sources of carbon for bone collagen biosynthesis using natural abun-dance stable carbon isotope analysis. British Journal of Nutrition 95:1055–1062DOI 10.1079/BJN20051685.
Kanehisa M, Furumichi M, TanabeM, Sato Y, Morishima K. 2016. KEGG: newperspectives on genomes, pathways, diseases and drugs. Nucleic Acids Research45:D353–D361 DOI 10.1093/nar/gkw1092.
Krogdahl Å, Nodrum S, SørensenM, Brudeseth L, Røjsø C. 1999. Effects of dietcomposition on apparent nutrient absorption along the intestinal tract and ofsubsequent fasting on mucosal disaccharidase activities and plasma nutrientconcentration in Atlantic salmon Salmo salar L. Aquaculture Nutrition 5:121–133DOI 10.1046/j.1365-2095.1999.00095.
Krogdahl A, Sundby A, Bakke AM. 2011. Gut secretion and digestion. In: Farrell AP,ed. Encyclopedia of fish physiology: from genome to environment. London: Elsevier,1301–1311.
KuHH. 1966. Notes on the use of propagation of error formulas. Journal of Research ofthe National Bureau of Standards 70C:263–273 DOI 10.6028/jres.070c.025.
Wang et al. (2019), PeerJ, DOI 10.7717/peerj.7701 18/20

Larsen T, Taylor DL, LeighMB, O’Brien DM. 2009. Stable isotope fingerprinting: anovel method for identifying plant, fungal or bacterial origins of amino acids. Ecology90:3526–3535 DOI 10.1890/08-1695.1.
Larsen T, Ventura M, Andersen N, O’Brien DM, Piatkowski U, McCarthyMD. 2013.Tracing carbon sources through aquatic and terrestrial food webs using amino acidstable isotope fingerprinting. PLOS ONE 8:e73441DOI 10.1371/journal.pone.0073441.
Larsen T, Ventura M, Maraldo K, Triado-Margarit X, Casamayor EO,Wang YV,Andersen N, O’Brien DM. 2016. The dominant detritus-feeding invertebrate inArctic peat soils derives its essential amino acids from gut symbionts. Journal ofAnimal Ecology 85:1275–1285 DOI 10.1111/1365-2656.12563.
Le Vay L, Gamboa-Delgado J. 2011. Naturally-occurring stable isotopes as direct mea-sures of larval feeding efficiency, nutrient incorporation and turnover. Aquaculture315:95–103 DOI 10.1016/j.aquaculture.2010.03.033.
Leigh SC, Papastamatiou YP, German DP. 2018. Seagrass digestion by a notorious‘carnivore’. Proceedings of the Royal Society B: Biological Sciences 285:20181583DOI 10.1098/rspb.2018.1583.
Logan JM, Jardine TD, Miller TJ, Bunn SE, Cunjak RA, Lutcavage ME. 2008. Lipidcorrections in carbon and nitrogen stable isotope analyses: comparison of chem-ical extraction and modelling methods. Journal of Animal Ecology 77:838–846DOI 10.1111/j.1365-2656.2008.01394.
Logan JM, Lutcavage ME. 2008. A comparison of carbon and nitrogen stable isotoperatios of fish tissues following lipid extractions with non-polar and traditionalchloroform/methanol solvent systems. Rapid Communications in Mass Spectrometry22:1081–1086 DOI 10.1002/rcm.3471.
McCommis KS, Finck BN. 2015.Mitochondrial pyruvate transport: a historicalperspective and future research directions. The Biochemical Journal 466:443–454DOI 10.1042/BJ20141171.
McMahon KW, Fogel ML, Elsdon TS, Thorrold SR. 2010. Carbon isotope fractionationof amino acids in fish muscle reflects biosynthesis and isotopic routing from dietaryprotein. Journal of Animal Ecology 79:1132–1141DOI 10.1111/j.1365-2656.2010.01722.
Moran LA, Horton RH, Scrimgeour G, Perry M, Rawn D. 2012. Principles of biochem-istry. London: Pearson.
Newsome SD, Fogel ML, Kelly L, Del Rio CM. 2011. Contributions of direct incor-poration from diet and microbial amino acids to protein synthesis in Nile tilapia.Functional Ecology 25:1051–1062 DOI 10.1111/j.1365-2435.2011.01866.x.
Newsome SD,Wolf N, Peters J, Fogel ML. 2014. Amino acid δ13C analysis showsflexibility in the routing of dietary protein and lipids to the tissue of an omnivore.Integrative and Comparative Biology 54:890–902 DOI 10.1093/icb/icu106.
O’Brien DM, Fogel ML, Boggs CL. 2002. Renewable and nonrenewable resources:amino acid turnover and allocation to reproduction in lepidoptera. Proceedings
Wang et al. (2019), PeerJ, DOI 10.7717/peerj.7701 19/20

of the National Academy of Sciences of the United States of America 99:4413–4418DOI 10.1073/pnas.072346699.
ØverlandM,Mydland LT, Skrede A. 2019.Marine macroalgae as sources of protein andbioactive compounds in feed for monogastric animals. Journal of the Science of Foodand Agriculture 99:13–24 DOI 10.1002/jsfa.9143.
R Core Team. 2017. R: a language and environment for statistical computing. Vienna: RFoundation for Statistical Computing. Available at https://www.R-project.org/ .
Reeds PJ. 2000. Dispensable and indispensable amino acids for humans. The Journal ofNutrition 130:1835S–1840S DOI 10.1093/jn/130.7.1835S.
Sanchez-Muros MJ, Garcia-Rejon L, Lupianez JA, HigueraI M. 1995. Long-termnutritional effects on the primary liver and kidney metabolism in rainbow trout,Oncorhynchus mykiss (Walbaum): adaptive response to a high-protein/non-carbohydrate diet and starvation of glucose 6-phosphate dehydrogenase activity.Aquaculture Nutrition 1:213–220 DOI 10.1111/j.1365-2095.1995.tb00046.
Scott JH, O’Brien DM, Emerson D, Sun H, McDonald GD, Salgado A, Fogel ML.2006. An examination of the carbon isotope effects associated with amino acidbiosynthesis. Astrobiology 6:867–880 DOI 10.1089/ast.2006.6.867.
Tan Q,Wang F, Xie S, Zhu X, Lei W, Shen J. 2009. Effect of high dietary starchlevels on the growth performance, blood chemistry and body composition ofgibel carp (Carassius auratus var. gibelio). Aquaculture Research 40:1011–1018DOI 10.1111/j.1365-2109.2009.02184.
Tieszen LL, Fagre T. 1993. Carbon isotopic variability in modern and archaeologicalmaize. Journal of Archaeological Science 20:25–40 DOI 10.1006/jasc.1993.1002.
Wan AHL, Soler-Vila A, O’Keeffe D, Casburn P, Fitzgerald R, JohnsonMP. 2016. Theinclusion of Palmaria palmatamacroalgae in Atlantic salmon (Salmo salar) diets:effects on growth, haematology, immunity and liver function. Journal of AppliedPhycology 28:3091–3100 DOI 10.1007/s10811-016-0821-8.
Wang YV,Wan AHL, Lock E-J, Andersen N,Winter-Schuh C, Larsen T. 2018. Knowyour fish: a novel compound-specific isotope approach for tracing wild and farmedsalmon. Food Chemistry 256:380–389 DOI 10.1016/j.foodchem.2018.02.095.
Whiteman JP, Kim SL, McMahon KW, Koch PL, Newsome SD. 2018. Amino acidisotope discrimination factors for a carnivore: physiological insights from leopardsharks and their diet. Oecologia 188:977–989 DOI 10.1007/s00442-018-4276-2.
WomackM, RoseWC. 1947. The role of proline, hydroxyproline, and glutamic acid ingrowth. Journal of Biological Chemistry 171:37–50.
Wang et al. (2019), PeerJ, DOI 10.7717/peerj.7701 20/20