C ULTURE & C LIMATE S URVEY. Sample Employee Survey Report Findings ACME Widgets.
21
CULTURE & CLIMATE SURVEY
-
Upload
gabriel-hart -
Category
Documents
-
view
216 -
download
0
Transcript of C ULTURE & C LIMATE S URVEY. Sample Employee Survey Report Findings ACME Widgets.
CULTURE & CLIMATE
SURVEY

Sample
Employee Survey Report Findings
ACME Widgets
Introduction: Sample Indices Measured• Career development and training
• Commitment/retention
• Communication
• Employee involvement
• Leadership
• Management practices
• Operating practices
• Teamwork
• Trust and respect
• Work/personal balance
• Brand image
Introduction: Sample Survey Facts• Included 54 multiple-choice items, 3 open-ended questions, and 4 demographic items
• Distributed to all employees
• Overall response rate of 93% (668 of 716 surveys returned)
• HQ response rate of 96% (587* of 614 surveys returned)
• Branch response rate of 60% (61* of 102 surveys returned)

Sample Results: Rating Scale• Five-point rating scale• 1 = low; 5 = high• Analysis groupings*:
Positive = 4 or 5 Neutral = 3 Negative = 1 or 2
* Total percentages may not add up to 100 due to rounding and/or missing data.

Sample Results: Average Index RatingsIndex Average Rating
Leadership 3.98
Comittment/ Retention 3.97
Work/ Personal Balance 3.85
Brand Image 3.76
Management Practices 3.74
Trust and Respect 3.60
Communication 3.58
Employee Involvement 3.58
Operating Practices 3.38
Career Development 3.28
Teamwork 3.20
Scale
1 = Low5 = High

Results: Critical Outcomes
Key Drivers
Critical Outcomes • Provide overall/directional indicators of employee attitudes and morale
• Measure general perceptions (not specific)
• Tend to be strongly correlated with business outcomes (e.g., financial, operational, retention)

Results: Key Drivers of Critical OutcomesCritical Outcomes
• Provide overall/directional indicators of employee attitudes and morale
• Measure general perceptions (not specific)
• Tend to be strongly correlated with business outcomes (e.g., financial, operational, retention)
Key Drivers • Based on multiple regression analysis
• Identify what is “driving” the critical outcomes
• Provide more specific measures (i.e., measures “what?” and “how?”)
• Improvements on perceptions of key drivers are likely to result in improvements on the critical outcomes
• Can help to target specific action steps

Sample Results: Key DriversThis organization is effectively managed
• Relative to competitors, our clients consider out brand image to be positive
• People across different organizational units readily share information, knowledge, ideas, and best practices
• The decision-making process is quick and efficient in my unit
• The appropriate people are usually involved in making decisions
Scale: 1 = Low, 5 = High Positive = 4 or 5, Neutral = 3, Negative = 1 or 2
9%61% 28%
22%42% 35%
20%53% 27%
16%52% 33%

Sample Results: Key DriversThis organization is effectively managed
• I am satisfied with the training and development opportunities providedin this organization
• I am appropriately challenged in my job
• Communications within the organization are generally clear and concise
• My direct manager communicates the reasons behind important decisions
Scale: 1 = Low, 5 = High Positive = 4 or 5, Neutral = 3, Negative = 1 or 2
20%53% 27%
24%48% 28%
19%60% 21%
14%73% 13%
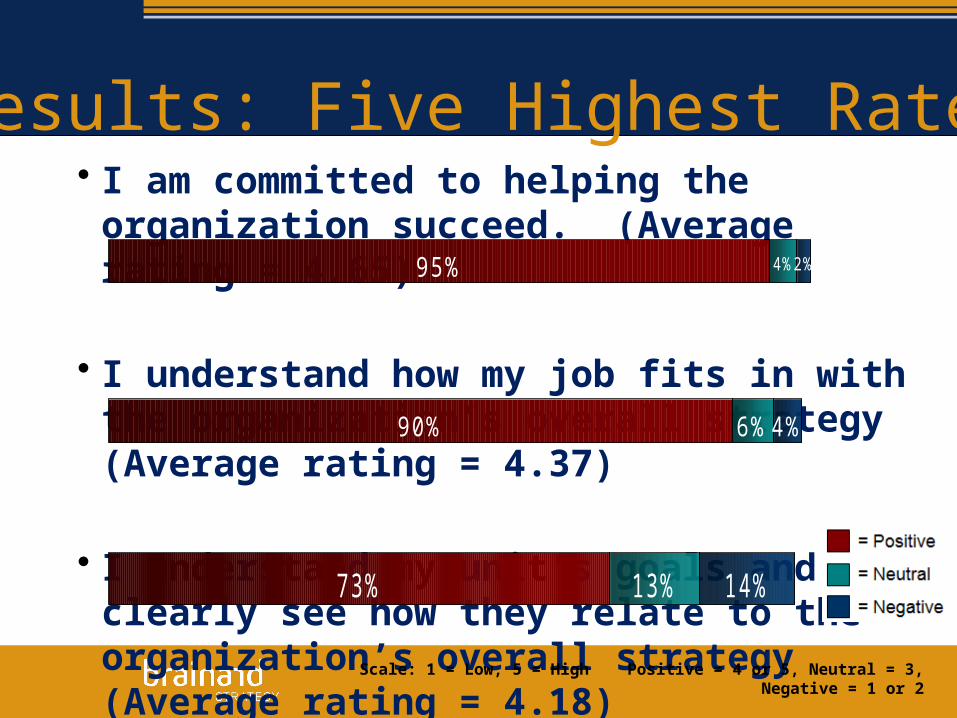
Sample Results: Five Highest Rated Items• I am committed to helping the organization succeed. (Average rating = 4.65)
• I understand how my job fits in with the organization’s overall strategy (Average rating = 4.37)
• I understand my unit’s goals and clearly see how they relate to the organization’s overall strategy (Average rating = 4.18)
Scale: 1 = Low, 5 = High Positive = 4 or 5, Neutral = 3, Negative = 1 or 2
14%73% 13%
2%95% 4%
4%90% 6%
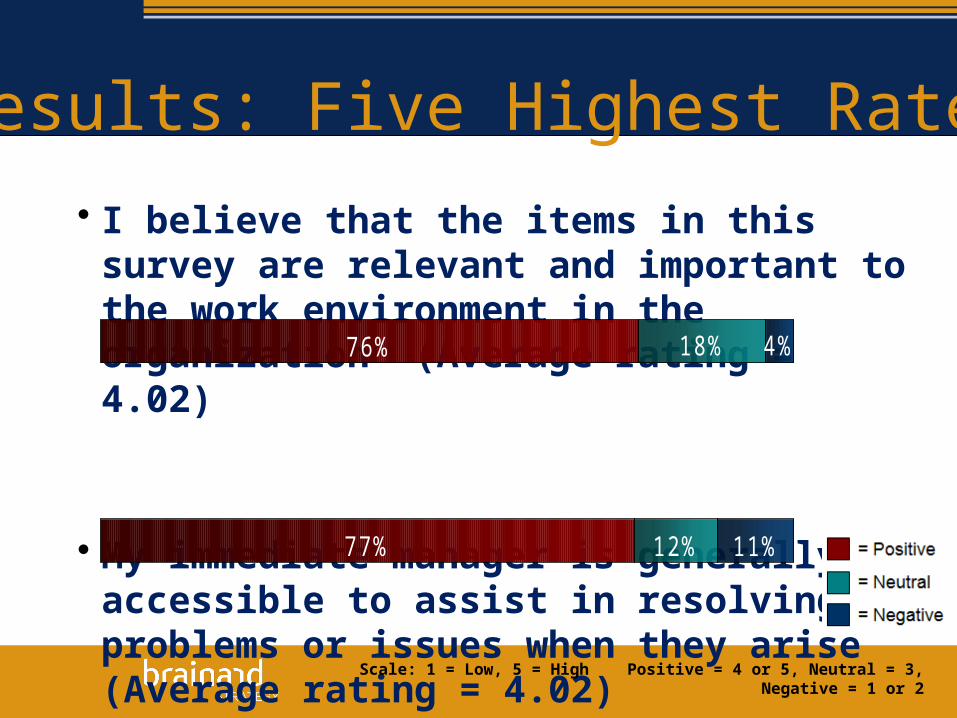
Sample Results: Five Highest Rated Items
• I believe that the items in this survey are relevant and important to the work environment in the organization (Average rating = 4.02)
• My immediate manager is generally accessible to assist in resolving problems or issues when they arise (Average rating = 4.02)
Scale: 1 = Low, 5 = High Positive = 4 or 5, Neutral = 3, Negative = 1 or 2
4%76% 18%
11%77% 12%

Sample Results: Five Lowest Rated Items• To what extent does the organization support you in managing your career? (Average rating = 3.13)
• How do you rate teamwork across the organization at the present time? (Average rating = 3.14)
• Diverse viewpoints are sought out and valued (Average rating = 3.18)Scale: 1 = Low, 5 = High Positive = 4 or 5, Neutral = 3, Negative = 1 or 2
27%38% 34%
24%36% 39%
23%39% 39%

Sample Results: Five Lowest Rated Items• Effective teamwork is recognized and rewarded in the organization (Average rating = 3.19)
• All employees are treated fairly (Average rating = 3.19)
Scale: 1 = Low, 5 = High Positive = 4 or 5, Neutral = 3, Negative = 1 or 2
24%40% 36%
26%44% 30%

Sample Highlights From Open-Ended Comments• Overall, people indicated that they are motivated by the challenge and excitement associated with the entrepreneurial nature of their job activities, and appreciate the opportunity to interact with many intelligent and knowledgeable individuals
• Many people reported that the organization’s current technology is not sufficient to support their needs and the needs of the business. In addition, people feel that the expense reimbursement system is cumbersome and inefficient

Sample Highlights From Open-Ended Comments• Many respondents stated that a lack of communication is one of the greatest challenges in the organization. Specifically, people feel that decisions that impact their day-to-day jobs are not clearly communicated by management. However, some respondents indicated that communication has improved over the last several years.
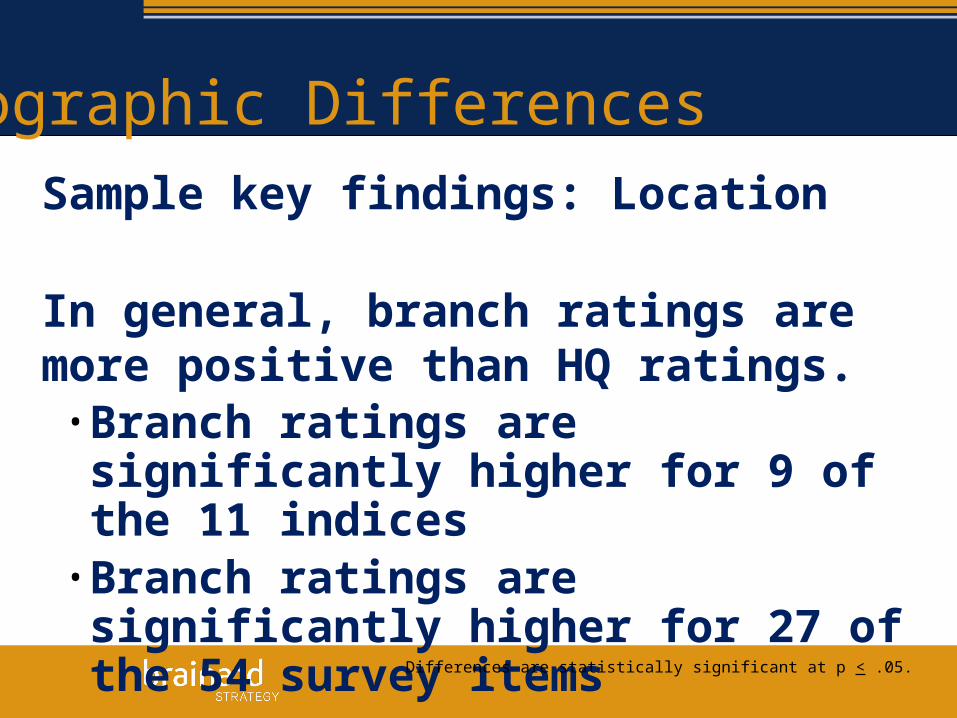
Demographic DifferencesSample key findings: Location
In general, branch ratings are more positive than HQ ratings.
• Branch ratings are significantly higher for 9 of the 11 indices
• Branch ratings are significantly higher for 27 of the 54 survey items
Differences are statistically significant at p < .05.

Demographic DifferencesSample key findings: Location
Index* HQ Branch
Career Development and Training 3.21 3.48 Commitment/ Retention 3.94 4.24
Communication 3.39 3.64 Employee Involvement 3.36 3.72 Management Practices 3.60 3.87
Operating Practices 3.36 3.60 Work/ Personal Balance 3.66 4.11
Trust and Respect 3.43 3.75 Brand Image 3.62 3.83
* Differences are statistically significant at p < .05; no significant differences were detected for Leadership or Teamwork.
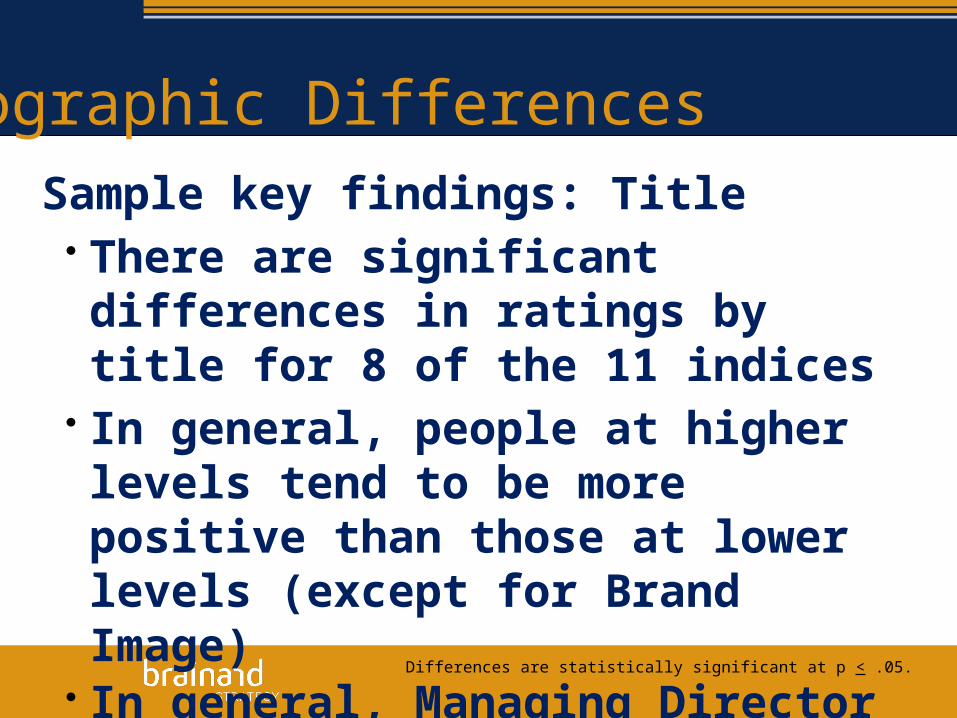
Demographic DifferencesSample key findings: Title• There are significant differences in ratings by title for 8 of the 11 indices
• In general, people at higher levels tend to be more positive than those at lower levels (except for Brand Image)
• In general, Managing Director (MD) ratings are aligned with Senior Vice President (SVP) ratings, and Vice President (VP) ratings are aligned with “other” ratings
Differences are statistically significant at p < .05.
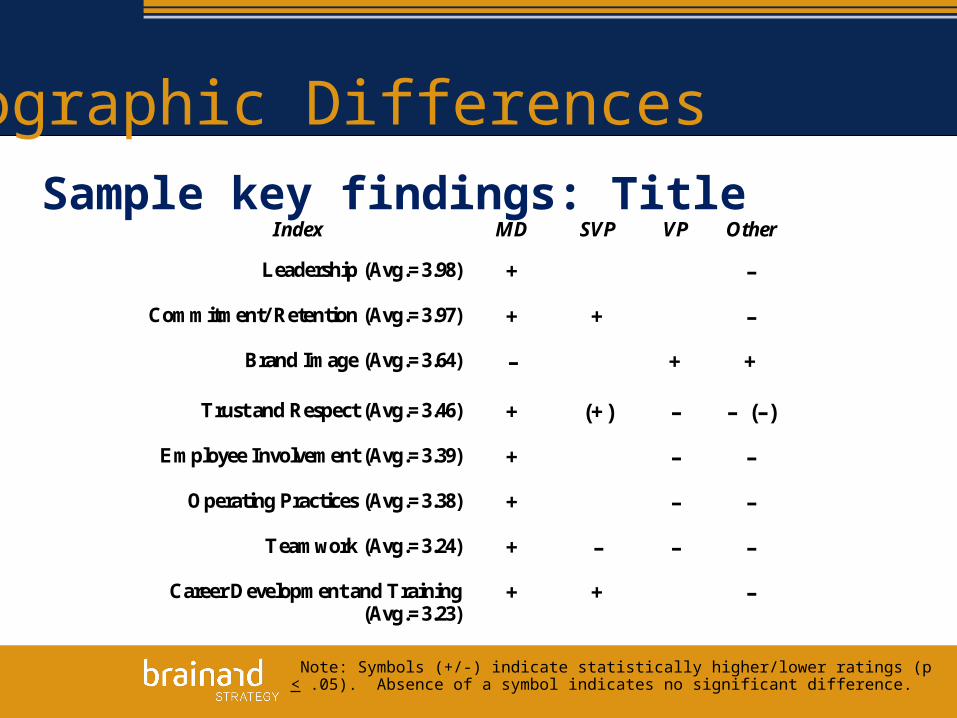
Demographic DifferencesSample key findings: Title
Index MD SVP VP Other
Leadership (Avg.=3.98)
+ –
Commitment/ Retention (Avg.=3.97)
+ + –
Brand Image (Avg.=3.64) –
+ +
Trust and Respect (Avg.=3.46)
+ (+) – – (–)
Employee Involvement (Avg.=3.39)
+ – –
Operating Practices (Avg.=3.38)
+ – –
Teamwork (Avg.=3.24)
+ – – –
Career Development and Training (Avg.=3.23)
+ + –
Note: Symbols (+/-) indicate statistically higher/lower ratings (p < .05). Absence of a symbol
indicates no significant difference.

Demographic DifferencesSample key findings: Tenure• There are significant differences in ratings by tenure for 3 of the 11 indices, with those having longer tenure tending to be more positive
Note: Symbols (+/-) indicate statistically higher/lower ratings (p < .05). Absence of a symbol indicates no significant difference.
Index <1 yr 1–3 3–5 5–10 >10 yrs
Leadership (Avg.=3.98)
– +
Commitment/ Retention (Avg.=3.97)
– – +
Operating Practices (Avg.=3.38)
+ – +