
C R E AT I N G T H E I D E A L T I N G T H E I D E A L S H ... · D uring the past year, a number...
28
W H AT CONSUMERS WANT IN T H E P H Y S I C A L A N D V I R T U A L S T O R E W H AT CONSUMERS WANT IN T H E P H Y S I C A L A N D V I R T U A L S T O R E C R E ATING THE IDEAL SHOPPING EXPERIENCE C R E ATING THE IDEAL SHOPPING EXPERIENCE INDIANA UNIVERSITY An Indiana University-KPMG Study
-
Upload
truongxuyen -
Category
Documents
-
view
213 -
download
1
Transcript of C R E AT I N G T H E I D E A L T I N G T H E I D E A L S H ... · D uring the past year, a number...

W H A T C O N S U M E R S W A N T I N T H E
P H Y S I C A L A N D V I R T U A L S T O R E
W H A T C O N S U M E R S W A N T I N T H E
P H Y S I C A L A N D V I R T U A L S T O R E
C R E A T I N G T H E I D E A L
S H O P P I N G E X P E R I E N C E
C R E A T I N G T H E I D E A L
S H O P P I N G E X P E R I E N C E
INDIANA UNIVERSITY
An Indiana University-KPMG Study

Table of Contents
1 Preface
2 Introduction
4 Delivering the Basics
8 Optimizing the Experience: Product Categories
12 Optimizing the Experience: Consumer Segments
16 Technology Traps
19 Hearing the Voice of the Customer
23 Realizing the Potential of Technology
24 Study Methodology / Participant Demographics
SP R E F A C E
IN
DI
AN
A
UN
IV
ER
SI
TY
—
K
PM
G
ST
UD
Y
11
uccessful retailers know that the customer is the
ultimate judge of the quality of a shopping experience. Everyday, shoppers decide which merchant is doing the best
job serving their needs. Consumers enjoy more choice than ever before�in stores, brands, and channels�and have
access to an ever-increasing amount of information upon which to base their buying decisions. Capturing the pur-
chasing power of these sophisticated consumers is a difÞcult and constant challenge for retailers.
The Indiana University Center for Education and Research in Retailing (IU Center) and KPMG�s Retail Industry
practice share the belief that successful retailers in the future will be those that are focused on their customers and
are able to deliver the best shopping experience in both traditional and nonstore environments. The value proposi-
tion is complex�encompassing price, quality, information, selection, convenience, service, and entertainment�and
providing the right balance is not an easy task. Technology can be a very useful tool
in helping to create the right value proposition, but understanding how consumers
react to technology, and when technology should be used in the shopping process, is
critical to success. The IU Center and KPMG are pleased to present Creating the
Ideal Shopping Experience, a research study that measures consumers� acceptance of
technology and, more importantly, offers insights on how consumers want to shop.
The IU Center is dedicated to educating future retail leaders and executing leading-
edge research for the beneÞt of the retail industry. KPMG, a key partner of the IU
Center, delivers understandable business advice through a wide range of assurance,
tax, and consulting services. We would like to acknowledge IU�s Professor
Raymond Burke as the primary researcher in this project and to thank him for his
research contributions, including the design and analysis of the study.
We hope you Þnd this study interesting and thought-provoking. Ultimately, we hope
you�re able to use the Þndings to help you create the ideal shopping experience, so that you can capture the loyalty
and buying power of your customers�both today and in the future.
Theresa Williams
Director, Center for Education and Research in Retailing
Indiana University Kelley School of Business
Mark J. Larson
National Partner in Charge�Retail Industry Practice
KPMG
During the past year, a number of high-ßying online
shopping companies hit hard times. Some, like Toysmart.com and Living.com, have gone bankrupt. Others, like
Peapod and CD-NOW, ran out of capital and were acquired. Even Amazon.com, the premier online shopping com-
pany, has stumbled in recent months with sales of books and music down 4 percent over the Þrst two quarters.
These events bring to mind earlier failures of online shopping initiatives, including interactive television in the
1990s and videotex in the 1980s.
Companies also have struggled to Þnd the best applications of technology in conventional retail stores. While UPC
scanning and automated teller machines (ATMs) achieved widespread acceptance, other technologies have not met
retailers� expectations. Interactive kiosks, for example, have ßuctuated in popularity over the years, getting a boost
every time a new technology is incorporated (such as videodisk players, touch screens, bar code readers, and Web
access). But there are disappointments, such as Kmart�s SolutionsTM in-store kiosk, Ernst Home Center�s special
order kiosk, and the MicroMall catalog shopping kiosk. In 1993, Ted Turner�s Checkout Channel, a network of Þve-
inch color monitors positioned by the checkout counters in 840 grocery stores, was discontinued. That same year,
VideOcart went bankrupt after installing LCD screens and computers on the handlebars of shopping carts in 220
stores.
Before retailers invest more time and money in developing, deploying, and promoting retail technologies, these
questions should be asked:
◗ What role do consumers want technology to play in the shopping process?
◗ Are people overwhelmed by the technical innovations and want simpler rather than more sophisticated shopping
experiences?
◗ Have companies already tapped out the most promising applications of technology?
From the customer�s perspective, there are costs as well as beneÞts associated with new technologies. They often
are confusing, take time to learn, are prone to failure, and can raise the prices of goods and services. From the retail-
er�s perspective, technology is expensive to adopt and maintain and can become obsolete quickly. Clearly, it is nec-
essary to understand which technologies and applications create value for speciÞc consumer segments and product
categories in order to optimize the shopping experience.
To address these issues, the Indiana University Center for Education and Research in Retailing and KPMG conduct-
ed a national survey of consumers� perceptions of the desired role of technology in the shopping experience. The
goals of the research were to:
◗ Determine what would be the ideal shopping experience from the customer�s perspective.
◗ Identify how media work together to move consumers through the purchase process.
◗ Help retailers optimize the online and in-store shopping experience by identifying the most important features of
the customer interface for speciÞc product categories and consumer segments.
IN
DI
AN
A
UN
IV
ER
SI
TY
—
K
PM
G
ST
UD
Y
2
I N T R O D U C T I O N
The IU-KPMG study was conducted using an online panel of consumers because Internet users are familiar with
interactive technologies and can provide early indications of consumer interest in new retail applications. It is
important to note that this group tends to be younger, have higher income, and be better educated than the general
population. Therefore, the Þndings may be a better reßection of the opinions of the next generation of consumers
rather than today�s average shopper.
The study covers a broad range of features associated with the shopping process common in retailing today, such as
providing printed circulars and sales assistants, to innovations just emerging from the research labs. The study asked
shoppers to evaluate 128 different aspects of the shopping experience with 58 online and 70 in-store attributes.
Shoppers rated their preference for many kinds of product information, including product speciÞcations, pho-
tographs, video clips, expert ratings, consumer discussion forums, and brand and price comparisons. They evaluated
a variety of options for advertising, promotions, pricing, personalization, customization, and e-mail messaging.
People assessed several different online and in-store technologies, including agent technology, multimedia, 3-D sim-
ulations, kiosks, handheld computers, and electronic signs. The study explores the role of people in the shopping
process, including guest greeters, sales assistants, cashiers, and customer service representatives. Additionally, the
IU-KPMG study sought shoppers� preferences for various checkout, payment, fulÞllment, and return options.
Given the growing importance of multi-channel retailing, respondents were asked how they would like to use a
combination of media�including the Internet, television, catalogs, wireless devices, public kiosks, and the physical
retail store�at each stage in the purchase process. Then they evaluated a number of concepts integrating the online
and in-store shopping experience, such as having online access to prices, promotions, and inventory of a local retail
store; purchasing products online and picking them
up at a store; and shopping in-store and having the
merchandise delivered to their homes.
Of course, it would be difÞcult to construct a single
ideal shopping experience because consumers shop
differently for different types of products. Therefore,
separate groups of consumers with recent shopping
experience in ten different product categories inde-
pendently evaluated the shopping features. The cate-
gories included durable goods (major appliances;
small appliances and consumer electronics; furniture
and lighting; hardware, paint and wallpaper), nondurable goods (groceries, and health and beauty care products;
school and ofÞce supplies), soft goods (weekend apparel; weekday apparel), and entertainment products (toys and
games; music, movies, and books).
The following report summarizes the key Þndings from this research and highlights the major implications for retail
practice in the 21st century.
Raymond R. Burke
E.W. Kelley Professor of Business Administration
Director, Customer Interface Lab
Indiana University
IN
DI
AN
A
UN
IV
ER
SI
TY
—
K
PM
G
ST
UD
Y
3
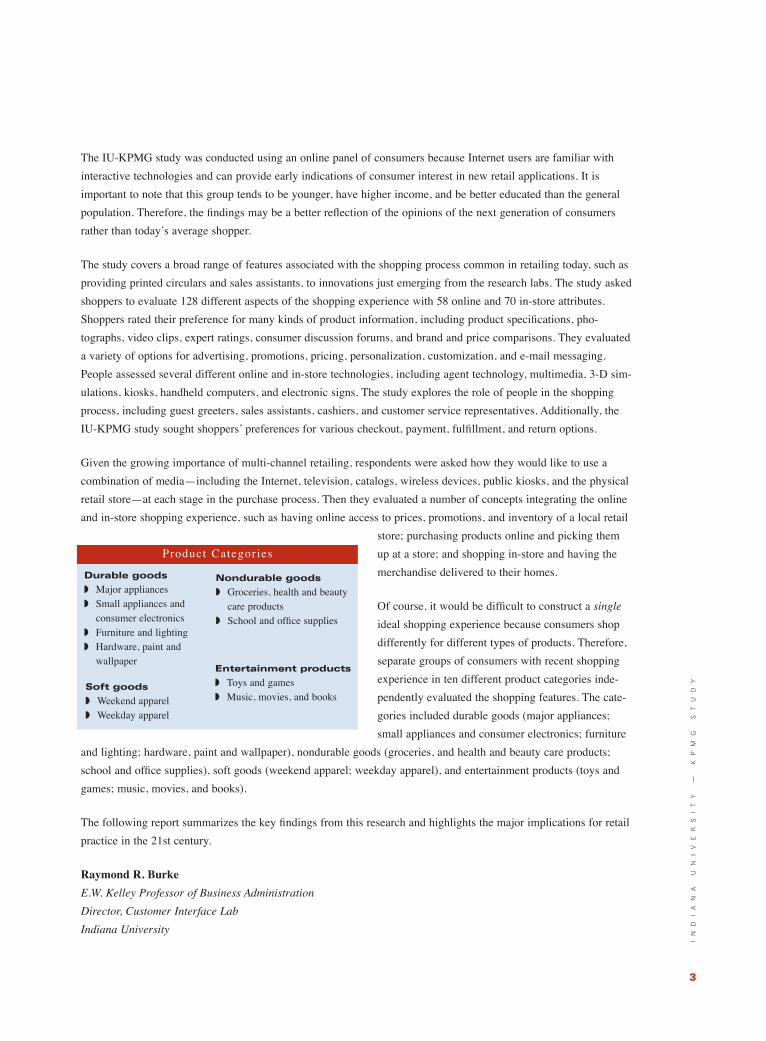
Durable goods
◗ Major appliances◗ Small appliances and
consumer electronics◗ Furniture and lighting◗ Hardware, paint and
wallpaper
Product Categories
Soft goods
◗ Weekend apparel◗ Weekday apparel
Nondurable goods
◗ Groceries, health and beautycare products
◗ School and ofÞce supplies
Entertainment products
◗ Toys and games◗ Music, movies, and books

Given the incredible number of options available
to retailers when designing an online or in-store shopping experience, Where should one start? What is the founda -
tion of an ideal shopping experience? We started by asking the consumer.
In our study, respondents were asked to assume that they were shopping for one of ten different product types and to
design the shopping experience any way they wanted, with the specific features they desired most.
People classified each of the online and in-store features into one of five categories:
◗ must have— critical feature that the consumer could not do without
◗ should have — important but would sacrifice under some circumstances
◗ nice to have —desirable but not necessary
◗ indifferent —didn’t care about one way or the other
◗ prefer not to have—undesirable feature that would not be included in an ideal shopping experience.
People were told to assume that these features were being provided by the retailer at no additional cost to them.
Consumers have clear and consistent opinions about which features must be provided. While there is some interest
in technology, people are much more focused on the fundamental elements of the shopping process. They want to
purchase quality products at a good price from an attractive selection of alternatives. They want a fast and conve-
nient shopping experience with excellent service and sufficient product information. The specific features customers
desire most are described in the following sections. Online shopping, in-store shopping, and multi-channel integra-
tion are discussed in turn.
Shopping online
When shopping on the Internet,
almost all consumers insist on know-
ing the prices of products sold online
and most want to know the prices at
the closest retail store. In addition,
online shoppers like access to prod-
uct specifications and instructions,
warranty information, and a list of
the products currently on sale.
Consumers want to be able to pay for
products by entering their credit-card
number on a secure Web page,
receive an e-mail message confirm-
ing that the order was received and
D E L I V E R I N G T H E B A S I C S
4
Online shopping features that consumers must have
P roduct info r m a t i o n ( % )
Online product prices 92.9
Product prices and promotions at the closest retail store 64.3
Product specifications, usage instructions, and warranty information 57.3
Online list of product promotions 50.4
Payment, fulfillment, and customer service
Toll-free telephone access to customer service 78.6
Products shipped to home or office 77.6
E-mail order confirmation 72.6
Secure, Web credit-card payment 69.3
E-mail shipping confirmation 66.5
E-mail access to customer service 58.0
Online shipment tracking 55.7
Returns shipped back to retailer 52.4

shipped, and then track their shipment using the Web. Most shoppers would like products shipped to their homes
or ofÞces, and assume that there is a process to ship back unsatisfactory or defective products to the retailer. If
they need help, shoppers want to be able to call a customer service representative on a toll-free telephone number
or communicate via e-mail. The table on the previous page lists the percentage of consumers who reported that
they must have each of these features.
While each of the features mentioned in the table is important for all ten product categories, there are signiÞcant
variations in some ratings. For example, more than twice as many respondents said they must have detailed prod-
uct speciÞcations, usage instructions, and warranty information for major appliances (78%) than for music, movies
and books (37%). On the ßip side, people are more willing to ship back unsatisfactory music, movies, and books
(62%) than major appliances (43%), furniture and lighting (47%), or hardware, paint and wallpaper (47%).
There are several features that most consumers feel should be provided by online retailers but that are not
absolutely necessary.1 These include information on what products are in stock, detailed product photographs,
product price and feature comparisons, a list of new items carried by the Web site, and expert ratings of product
quality. Several features concerning the integration of the online and in-store shopping experience fall into this
category, including being able to check on a local store�s inventory, printing store coupons, getting travel direc-
tions to the closest retail store, and being able to
put a 24-hour courtesy hold on an item that the
store has in stock.
Consumers also feel that retailers should provide
several features to improve the convenience of
shopping. These include saving shipping and
billing information for one-click ordering, saving
a list of prior purchases for proof-of-purchase
and warranty repairs, e-mail notiÞcation of sale
items, and being able to pick up and return
online purchases at a local retail store. Many
consumers want the option of placing an online
order by calling a toll-free number, being billed
by the retailer on delivery, and having a retailer�s
agent pick up defective or unsatisfactory
products.
In-store shopping
When shopping in the physical retail store, con-
sumers feel that it�s essential for the store to pro-
vide knowledgeable, helpful sale assistants. If
there is a question or problem, shoppers want to
be able to speak to a customer service represen-
tative, either in person or on the telephone. When
checking out, shoppers want cashiers to be avail-
able who can scan and bag products, accept payment, and provide a printed receipt. They want the store to accept
IN
DI
AN
A
UN
IV
ER
SI
TY
—
K
PM
G
ST
UD
Y
51 In the following discussion, any reference to the percentage of customers who felt that they should have a particular featurealso includes those customers who indicated that they must have the feature.
Online shopping features that consumers
should have
Product information (%)
Online product inventory (what�s in stock) 83.3
List of new items carried by Web site 76.5
Comparison of product prices across online stores 66.9
Detailed product photographs 65.9
Comparison of product features across brands 60.5
Expert ratings of product quality 57.3
Shopping aids
Web site saves list of purchases for proof-of-purchase and warranty repairs 67.9
Web site saves shipping and billing information for one-click ordering 57.4
E-mail notiÞcation of sale items 54.1
Clicks-and-mortar integration
Online information on local store�s inventory 76.1
Product returns to local retail store 73.4
Ability to print coupons for local retail store 68.1
Travel directions to local store 60.1
Product pickup at local retail store 56.3
Ability to place 24-hour courtesy hold on product in local store 52.9
Payment, fulfillment, and returns
Retailer�s agent picks up product returns 67.4
Order online by calling toll-free number with credit-card number 63.0
Pay retailer when merchandise is delivered 56.6
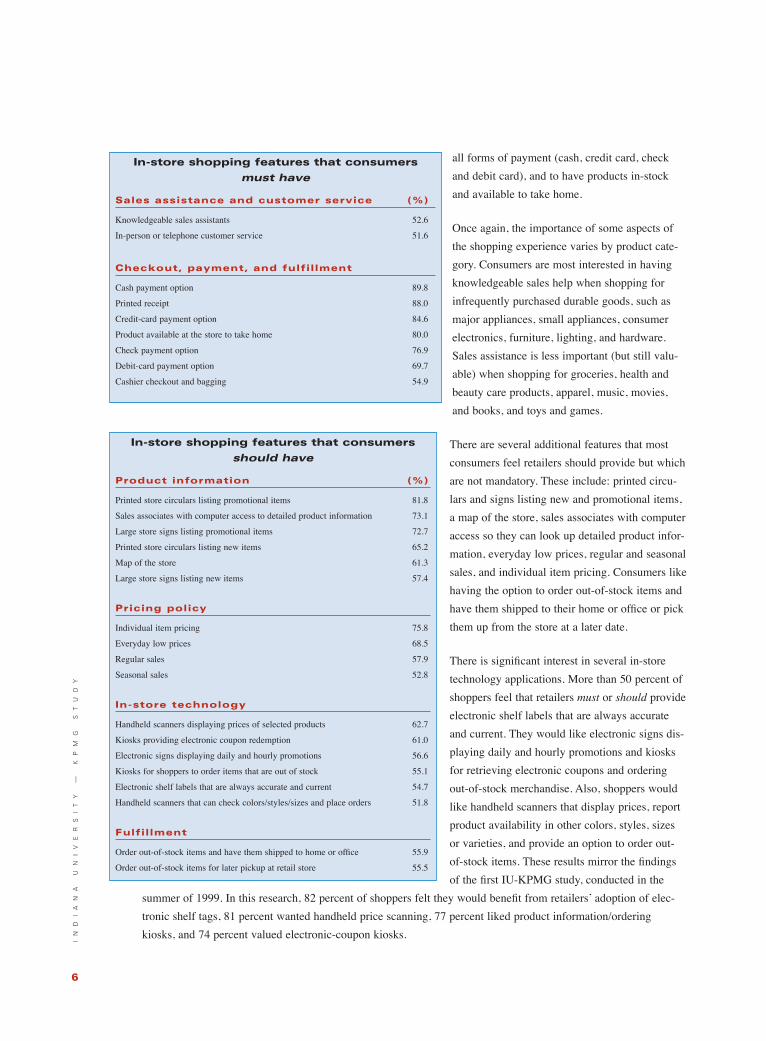
all forms of payment (cash, credit card, check
and debit card), and to have products in-stock
and available to take home.
Once again, the importance of some aspects of
the shopping experience varies by product cate-
gory. Consumers are most interested in having
knowledgeable sales help when shopping for
infrequently purchased durable goods, such as
major appliances, small appliances, consumer
electronics, furniture, lighting, and hardware.
Sales assistance is less important (but still valu-
able) when shopping for groceries, health and
beauty care products, apparel, music, movies,
and books, and toys and games.
There are several additional features that most
consumers feel retailers should provide but which
are not mandatory. These include: printed circu-
lars and signs listing new and promotional items,
a map of the store, sales associates with computer
access so they can look up detailed product infor-
mation, everyday low prices, regular and seasonal
sales, and individual item pricing. Consumers like
having the option to order out-of-stock items and
have them shipped to their home or ofÞce or pick
them up from the store at a later date.
There is signiÞcant interest in several in-store
technology applications. More than 50 percent of
shoppers feel that retailers must or should provide
electronic shelf labels that are always accurate
and current. They would like electronic signs dis-
playing daily and hourly promotions and kiosks
for retrieving electronic coupons and ordering
out-of-stock merchandise. Also, shoppers would
like handheld scanners that display prices, report
product availability in other colors, styles, sizes
or varieties, and provide an option to order out-
of-stock items. These results mirror the Þndings
of the Þrst IU-KPMG study, conducted in the
summer of 1999. In this research, 82 percent of shoppers felt they would beneÞt from retailers� adoption of elec-
tronic shelf tags, 81 percent wanted handheld price scanning, 77 percent liked product information/ordering
kiosks, and 74 percent valued electronic-coupon kiosks.
IN
DI
AN
A
UN
IV
ER
SI
TY
—
K
PM
G
ST
UD
Y
6
In-store shopping features that consumers
must have
Sales assistance and customer service (%)
Knowledgeable sales assistants 52.6
In-person or telephone customer service 51.6
Checkout, payment, and fulfillment
Cash payment option 89.8
Printed receipt 88.0
Credit-card payment option 84.6
Product available at the store to take home 80.0
Check payment option 76.9
Debit-card payment option 69.7
Cashier checkout and bagging 54.9
In-store shopping features that consumers
should have
Product information (%)
Printed store circulars listing promotional items 81.8
Sales associates with computer access to detailed product information 73.1
Large store signs listing promotional items 72.7
Printed store circulars listing new items 65.2
Map of the store 61.3
Large store signs listing new items 57.4
Pricing policy
Individual item pricing 75.8
Everyday low prices 68.5
Regular sales 57.9
Seasonal sales 52.8
In-store technology
Handheld scanners displaying prices of selected products 62.7
Kiosks providing electronic coupon redemption 61.0
Electronic signs displaying daily and hourly promotions 56.6
Kiosks for shoppers to order items that are out of stock 55.1
Electronic shelf labels that are always accurate and current 54.7
Handheld scanners that can check colors/styles/sizes and place orders 51.8
Fulfillment
Order out-of-stock items and have them shipped to home or ofÞce 55.9
Order out-of-stock items for later pickup at retail store 55.5

Multi-channel shopping
Many retailers have expanded from selling their goods and services through a single channel, such as bricks-and-
mortar stores or the Internet, to a number of different channels, including catalogs, television shopping channels,
public kiosks, and even cell-phones and handheld computers. Some of the pioneers in multi-channel retailing have
reported that those customers who use multiple channels spend signiÞcantly more than single-channel shoppers. But
what are the best ways to use these media to attract and retain customers?
Shoppers were asked to tell us which channels they would prefer to use when shopping for ten different product cat-
egories. They could select any
combination of channels for each
of the four steps in the purchase
process: (1) Þnding out about
new products, (2) searching for
information on speciÞc products,
(3) comparing and evaluating
alternatives, and (4) purchasing
and paying for products. They
also were asked how they would
like to receive products and
return unsatisfactory items: by
having them shipped through the
mail and/or visiting a retail store.
The study ascertained that a
majority of consumers want to
use multiple channels when shopping. More than three-fourths (82%) prefer to use more than one channel to learn
about new products, 77 percent to search for product information, 74 percent to compare and evaluate alternatives,
and 63 percent to purchase and pay for products. More than half (59%) of consumers would like the option of
receiving merchandise through the mail or a store visit, and 39 percent would like to be able to return products
through both channels. Consumers are less interested in using multiple channels when shopping for frequently pur-
chased goods, such as groceries and health and beauty care products.
The survey reveals that the various media can play different roles in moving shoppers through the purchase process.
On the one hand, consumers prefer to visit a retail store to learn about new products (76%), purchase and pay for
merchandise (91%), receive products (91%) and return unsatisfactory items (89%). On the other hand, they are most
enthusiastic about using the Internet to search for product information (90%) and compare and evaluate alternatives
(83%).
Consumers prefer to use media that can accurately portray the characteristics of the speciÞc products they are buy-
ing. For example, consumers like to use the Internet to Þnd out about and search for information on products like
music, movies, books, and consumer electronics, presumably because of the detailed information that is available
online. Catalogs are more popular for weekend apparel and furniture and lighting, where visual quality is important.
Television is a preferred medium for learning about products that have a sensory or entertainment element, like toys,
games, music, and videos. In-store visits are more appealing for expensive and infrequently purchased items such as
appliances, furniture, hardware, paint and wallpaper, as well as weekday apparel and groceries.
IN
DI
AN
A
UN
IV
ER
SI
TY
—
K
PM
G
ST
UD
Y
7
Consumer Preference for Multi-Channel Shopping
100%
90%
80%
70%
60%
50%
40%
30%
20%
10%
0%
In-store visit Internetfrom home
Mail-order,catalog
Television Public kiosk Cell-phone,mobile,palm
Find out about new productsSearch for product informationCompare and evaluate productsPurchase and pay for products
Per
cent
of C
onsu
mer
s W
antin
g to
Use
Cha
nnel

Consumers are in general agreement that three
aspects of the shopping experience�product quality, value provided, and product selection�are critically important
no matter what type of product is being purchased. These attributes are rated as being very important by 74 percent,
69 percent, and 66 percent of respondents, respectively. For most other shopping dimensions, there are distinct dif-
ferences between product categories in consumer importance ratings. To explore these differences, the results of the
study are examined using discriminant analysis.2
As shown in the Þgure, the ten product categories fall into three different groups. The Þrst group, shown on the left
side of the diagram, are the infrequently purchased, durable goods: major appliances, small appliances, consumer
electronics, furniture, lighting, hardware, paint, and wallpaper. When buying these items, consumers want retailers
to provide detailed product information and excellent service. A second group of products, shown in the lower-right-
hand quadrant of the diagram, are the frequently purchased, nondurable goods: groceries, health and beauty care
items, and school and ofÞce supplies. These shoppers emphasize the importance of having a fast and convenient
shopping experience. The third set of products cluster in the upper-right-hand quadrant, and consist of entertainment
products�music, movies, books, toys and games�and weekend and weekday apparel. When shopping for these
products, consumers want to have a fun and entertaining shopping experience. Shoppers also feel it�s important to
maintain their privacy when buying these personal and lifestyle-oriented products.
O P T I M I Z I N G T H E E X P E R I E N C E :P R O D U C T C A T E G O R I E S
IN
DI
AN
A
UN
IV
ER
SI
TY
—
K
PM
G
ST
UD
Y
8
Product information
Fun ofshopping
Privacy
Speed ofshoppingConvenience
Service
School, office supplies
Groceries, HBC
Weekend apparel
Weekday apparelToys, games
Furniture, lighting
Major appliances
Small appliances, consumer electronics
Hardware, paint, wallpaper
Music, movies, books
Discriminant Analysis: Product Differences in the Importance of Shopping Attributes
2 This procedure generates a set of statistical functions that provide the best discrimination between the ten product categoriesbased on linear combinations of the attribute importance ratings. Each of the arrows in the diagram represents a shoppingattribute, where the attribute�s importance for a particular product category is reßected by the distance of the category along theattribute dimension.

As noted earlier, the evaluations of many individual shopping features depend on the speciÞc type of product being
purchased. These interactions are explored in more detail in the following sections.
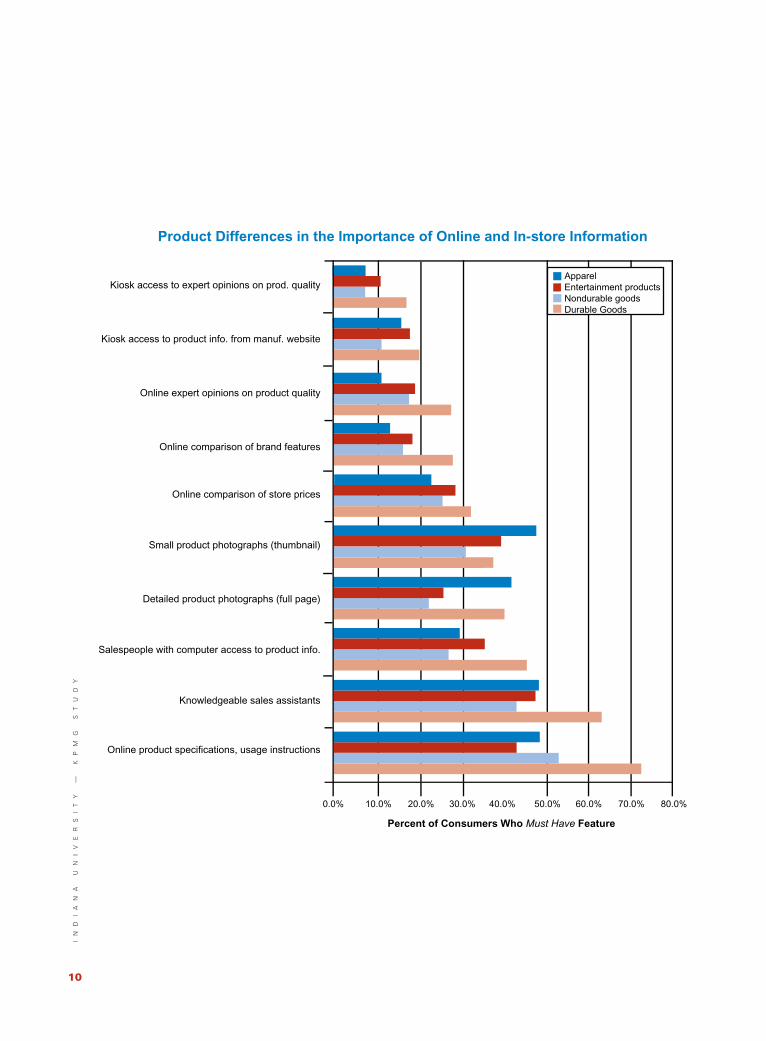
Product information
Some of the most dramatic differences between product categories concern product information. Across a range of
online and in-store shopping features, consumers express a greater interest in having access to detailed product
information for durable goods�such as major appliances, small appliances and consumer electronics�than for fre-
quently purchased products like groceries, school and ofÞce supplies, apparel and music. When shopping on the
Internet, respondents emphasize the importance of having product speciÞcations, a comparison of store prices and
brand features, and expert ratings of product quality. When shopping in the retail store, they want knowledgeable
sales assistants who can look up product information on a computer, and kiosks that can provide access to manufac-
turers� Web sites and expert ratings of product quality. The Þgure on the next page shows how consumers rate vari-
ous kinds of information for the four broad product types.
While facts and Þgures are important for appliances and consumer electronics, the visual appearance of products is
critical when shopping for products with a strong aesthetic component, such as furniture, lighting, and apparel. For
example, 50 percent of furniture shoppers indicated that Web sites must provide full-page product photographs, and
36 percent said that sites should allow shoppers to view 3-D product images that can be rotated 360 degrees.
Consumers want the option to view thumbnail photographs of all product types because this makes it easy to search
quickly through a large number of items. They especially like thumbnails for apparel, toys, and games.
Noninteractive media are especially popular for frequently purchased products, such as groceries, health and beauty
care products, school and ofÞce supplies, and weekend apparel. For example, 75 percent of grocery shoppers feel
that retailers should display large signs with a list of promotions, 81 percent for school and ofÞce supplies, and 78
percent for weekend apparel. When shopping for school and ofÞce supplies, 88 percent of shoppers like to receive
printed circulars listing items on promotion.
Shopping aids
There are several online and in-store shopping aids that are rated as being particularly desirable for one or more
product types. Internet shoppers feel they must have the ability to check inventories for products frequently pur-
chased online such as weekday apparel (52%), weekend apparel (46%), music, movies, and books (52%) and toys
and games (45%). For these same product categories, approximately one-fourth of the respondents want the option
to place one-click orders. People have a greater interest in custom-designing their own ideal product when purchas-
ing lifestyle-oriented items, such as furniture, lighting, music, and apparel.
IN
DI
AN
A
UN
IV
ER
SI
TY
—
K
PM
G
ST
UD
Y
9
IN
DI
AN
A
UN
IV
ER
SI
TY
—
K
PM
G
ST
UD
Y
10
0.0%
Kiosk access to expert opinions on prod. quality
Kiosk access to product info. from manuf. website
Online expert opinions on product quality
Online comparison of brand features
Online comparison of store prices
Small product photographs (thumbnail)
Detailed product photographs (full page)
Salespeople with computer access to product info.
Knowledgeable sales assistants
Online product specifications, usage instructions
ApparelEntertainment productsNondurable goodsDurable Goods
Product Differences in the Importance of Online and In-store Information
Percent of Consumers Who Must Have Feature
10.0% 20.0% 30.0% 40.0% 50.0% 60.0% 70.0% 80.0%

Fulfillment
Different products have different physical characteristics and handling requirements that affect how consumers
would like to receive and return merchandise. For example, approximately three-fourths of consumers are enthusias-
tic about having their online purchases of major appliances and furniture delivered because these items are large and
heavy and would be difÞcult for shoppers to transport themselves. However, they are less enthusiastic about having
to ship these items back to the retailer if there is a problem. Instead, many consumers feel that retailers should
arrange to pick up the defective merchandise. People also express some interest in using a drive-through warehouse
to pick up and return durable goods, perhaps because they are familiar with home improvement centers that use a
warehouse format.
Other Elements of the shopping experience
After people rated 128 different features of the online and in-store shopping experience, they were asked to tell us in
their own words what else they would want. More than half of the respondents made suggestions. The most frequent
comments are summarized in the following Þgure for Þve representative product categories.
The dominant
suggestion for
eight out of the
ten product cate-
gories is for
retailers to pro-
vide knowledge-
able, helpful,
courteous sales-
people. The
importance of
having good
salespeople is
mentioned by
about forty per-
cent of the
respondents
shopping for
major appliances and furniture and lighting and more than one-third of the respondents shopping for groceries, and
health and beauty care products. Many shoppers qualify their comments by saying that they only want sales assis-
tance when it is needed and that they would prefer not to have pushy salespeople.
Shoppers for weekend apparel want an attractive store, with large Þtting rooms, and other amenities and suggest that
stores include areas serving food and drink and provide places for children to play. The sensory aspects of the shop-
ping experience also are important for entertainment and lifestyle products. Shoppers want to be able to sample or
try out products when shopping for music, movies and books, toys and games, and furniture and lighting.
Consumers made several suggestions that are speciÞc to just one or two product categories. For example, when buy-
ing groceries and health and beauty care products, shoppers want a fast shopping experience with no checkout lines.
When buying appliances, they want timely, reliable delivery. Some people asked to see product demonstrations
when shopping for small appliances and consumer electronics.
IN
DI
AN
A
UN
IV
ER
SI
TY
—
K
PM
G
ST
UD
Y
11
Knowledgeable,helpful, courteous
sales people
45%
40%
35%
30%
25%
20%
15%
10%
5%
0%
Consumer Perceptions of the Ideal Shopping Experience
Clean, well-lit store;large fitting rooms;
food & drink; children's area
Competitive, lowprices
Fast shopping; nolines at checkout
Sample, try outproducts
Major appliancesFurniture and lightingGroceries and HBCWeekend apparelMusic, movies and books
Per
cent
of C
onsu
mer
s R
eque
stin
g F
eatu
re
The four demographic variables�age, gender, educa-
tion, and income�affect shoppers� preferences for online and in-store shopping features. The following sections dis-
cuss how these attributes inßuence the way shoppers would like to shop.
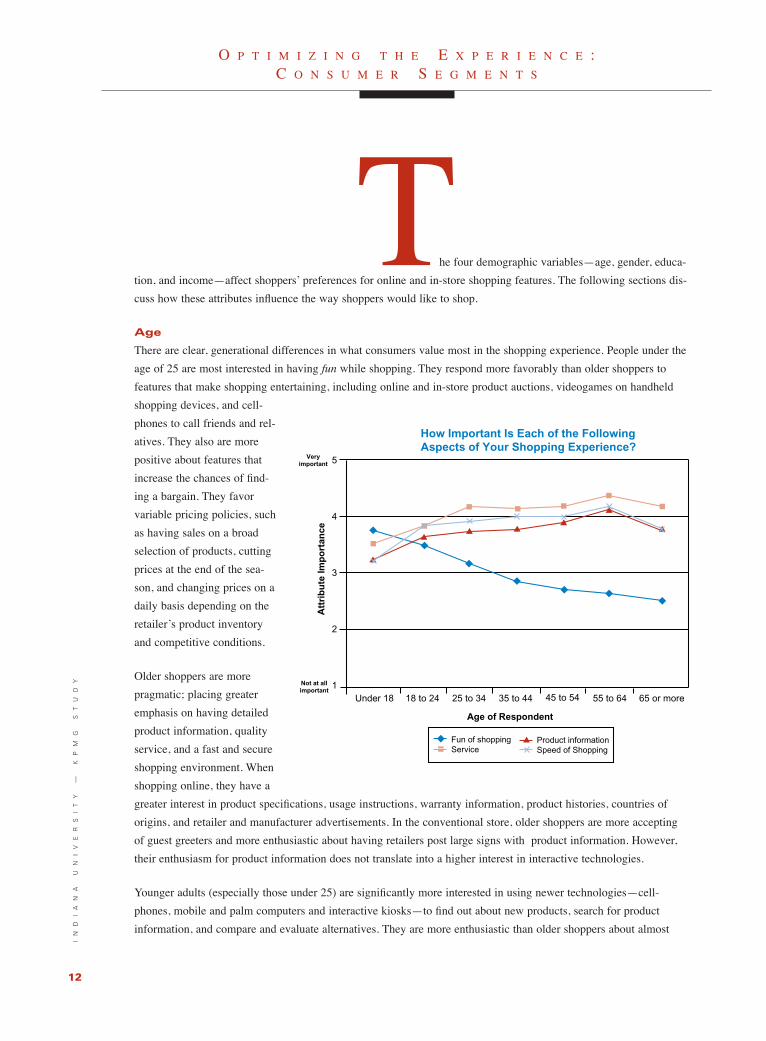
Age
There are clear, generational differences in what consumers value most in the shopping experience. People under the
age of 25 are most interested in having fun while shopping. They respond more favorably than older shoppers to
features that make shopping entertaining, including online and in-store product auctions, videogames on handheld
shopping devices, and cell-
phones to call friends and rel-
atives. They also are more
positive about features that
increase the chances of Þnd-
ing a bargain. They favor
variable pricing policies, such
as having sales on a broad
selection of products, cutting
prices at the end of the sea-
son, and changing prices on a
daily basis depending on the
retailer�s product inventory
and competitive conditions.
Older shoppers are more
pragmatic; placing greater
emphasis on having detailed
product information, quality
service, and a fast and secure
shopping environment. When
shopping online, they have a
greater interest in product speciÞcations, usage instructions, warranty information, product histories, countries of
origins, and retailer and manufacturer advertisements. In the conventional store, older shoppers are more accepting
of guest greeters and more enthusiastic about having retailers post large signs with product information. However,
their enthusiasm for product information does not translate into a higher interest in interactive technologies.
Younger adults (especially those under 25) are signiÞcantly more interested in using newer technologies�cell-
phones, mobile and palm computers and interactive kiosks�to Þnd out about new products, search for product
information, and compare and evaluate alternatives. They are more enthusiastic than older shoppers about almost
O P T I M I Z I N G T H E E X P E R I E N C E :C O N S U M E R S E G M E N T S
IN
DI
AN
A
UN
IV
ER
SI
TY
—
K
PM
G
ST
UD
Y
12
5
4
3
2
1Under 18 18 to 24 25 to 34 35 to 44 45 to 54 55 to 64 65 or more
Age of Respondent
Att
rib
ute
Imp
ort
ance
Not at allimportant
Veryimportant
How Important Is Each of the Following Aspects of Your Shopping Experience?
Fun of shoppingService
Product informationSpeed of Shopping

every application of interactive kiosks and handheld shopping devices, including applications that:
◗ Provide access to product information, product locations, customer evaluations, and expert ratings.
◗ Personalize the shopping experience.
◗ Expand the selection of available products.
◗ Entertain by using auctions and videogames.
◗ Provide price and promotional information and electronic coupons.
Younger adults also are more positive about (or tolerant of) one-to-one marketing practices than older consumers.
When shopping online, younger people are more interested in receiving personalized product offers and discounts,
custom-designing products, and seeing the proÞles of other shoppers who have previously purchased items. When
shopping in physical stores, they are more receptive to frequent-shopper discounts, and having a salesperson make
product suggestions based on their computerized purchase history (in addition to the personalization applications for
kiosks and handheld shopping devices noted earlier).
Surprisingly, younger consumers do not differ signiÞcantly from older shoppers in their interest in shopping online
or in conventional retail stores. This runs counter to the general intuition that young shoppers are migrating fastest
from bricks to clicks. It is important to note, however, that this research was conducted over the Internet, so the
study may have missed the views of those consumers who have been slow to adopt online shopping.
With the current media focus on the Internet, it�s easy to forget the importance of television for the younger genera-
tion of consumers. People under the age of 35 are more interested in using television to Þnd out about new products,
search for product information, and compare and evaluate products than older shoppers. They also place a greater
emphasis on seeing pictures of products when shopping online, which suggests that younger people may be more
attuned to visual information.
When shopping online
and in conventional
stores, older shoppers
favor the more familiar
methods of checkout,
payment, product fulÞll-
ment, and customer ser-
vice. For example, when
shopping online, they
prefer to enter a credit-
card number on a secure
Web page, have the mer-
chandise shipped to their
home or ofÞce, and
interact with customer service people via the telephone. In the physical store, they like having a cashier scan and
bag products, accept payment, and provide a printed receipt. They want the merchandise to be available immediately
to take home and resolve any problems by speaking to an onsite customer service representative.
Younger consumers are more willing to try new and alternative methods of checkout, payment, product fulÞllment,
and customer service. For example, they are signiÞcantly more positive about each of the shopping options depicted
in the table.
IN
DI
AN
A
UN
IV
ER
SI
TY
—
K
PM
G
ST
UD
Y
13
Checkout and payment
FulÞllment
Customer service
◗ Fax or call in credit-card number
using a toll-free number.
◗ Swipe credit card through PC�s
keyboard reader.
◗ Pay retailer on delivery.
◗ Pickup product at local retail
store, afÞliated convenience or
drug store, or drive-thru depot.
◗ Customer service through two-
way text chat window, two-way
voice (using PC), or one-way
videoconferencing.
◗ Use self-checkout system to scan,
bag, and pay for merchandise.
◗ Scan products with handheld
device while shopping, and pay
cashier or ATM machine at
checkout.
◗ Product shipped to home or
ofÞce, or available for pickup at
retail store, in two to three days.
◗ Customer feedback through print-
ed evaluation cards, kiosk ques-
tionnaire, or Web questionnaire.
Shopping online Shopping in-store
When shoppers are asked what else they would include in their ideal shopping experience, younger shoppers (under
35) are more likely to suggest eliminating overaggressive or pushy salespeople and, in fact, want retailers to make it
easier for them to Þnd items themselves. In contrast, older consumers are more interested in the facilities and sug-
gest that retailers offer to sell refreshments and provide play areas for children.
Gender
Men and women have distinctly different views of what would constitute an ideal shopping experience. Men
express a greater interest in using various types of technology in the shopping process. They are more positive about
using the Internet, cell phones, mobile and palm computers, and interactive kiosks than women. In contrast, female
shoppers express a greater interest in using catalogs at each stage in the shopping process: to learn about new items,
search for product information, compare brands, and make purchases.
In online and in-store shopping environments, women are consistently more focused on price, promotions, and
coupons than men. A greater percentage of women say that they must have online product prices, a list of sale items,
personalized product discounts, and the ability to view prices and print out coupons for the local retail store. They
also are more interested in receiving e-mail notiÞcation of sales. When shopping in conventional stores, women
want printed circulars and store signs listing promotions. They also express a greater interest in using kiosks that
offer electronic coupons that are automatically deducted at the register. When asked about their ideal pricing policy,
female shoppers are more enthusiastic about variable pricing strategies, including high-low pricing, end-of-season
markdowns, and even daily and hourly promotions displayed on electronic signs.
In contrast, men express somewhat greater interest in product information, perhaps because they shop less frequent-
ly. When shopping online, they are more interested in information on product histories and countries of origin, com-
plementary products, comparisons of brand features, and unedited consumer evaluations. They are more tolerant of
online advertising, and more interested in viewing a map of the local retail store with product locations. When visit-
ing the physical store, they show a greater interest in using handheld shopping devices to scan an item�s UPC code
and display unedited consumer evaluations, and to e-mail product information from the store to their home PCs for
later review.
Women are more interested than men in a variety of features that increase shopping convenience. When shopping
online, they are more receptive to using an electronic shopping list or having the Web site save a list of past pur-
chases to simplify reordering. Women like being able to speak to a real person (customer service representative)
when placing an order or requesting assistance. Compared to men, they have a greater interest in being able to check
if a local store has an item in stock and then placing a 24-hour courtesy hold on the item. Women are more insistent
that online stores notify them through e-mail when orders are received and shipped and are more interested in alter-
native means of returning products such as having a retailer�s agent pick up the product or returning it to an afÞliat-
ed convenience store or drugstore.
When shopping in a conventional store, women are more interested than men in all forms of assistance by salesper-
sons. They are more receptive to using kiosks and handheld devices that allow them to order items that are out-of-
stock. They want a cashier to be available to scan and bag merchandise, accept all forms of payment, and provide a
printed receipt. If an item is out of out-of-stock, women are more interested than men in having the item shipped to
the home or ofÞce or returning to the store in a few days to pick up the merchandise.
IN
DI
AN
A
UN
IV
ER
SI
TY
—
K
PM
G
ST
UD
Y
14
Compared to female shoppers, men are more tolerant of technology that could increase the time and effort required
to shop. When shopping online, men are more interested than women in Web sites that allow them to custom-design
products. They are more willing to access customer service using a PC�s two-way voice or one-way videoconferenc-
ing capabilities. In the physical store, they have fewer concerns than women about removing item pricing and are
more comfortable with having receipts e-mailed to them or made available on a private Web site. They also are
more interested in online and in-store product auctions (the latter using handheld shopping devices).
Education
Education plays an important role in determining consumers� perceptions of the ideal shopping experience. Higher
education consumers are more comfortable using nonstore channels (e.g., the Internet and catalogs) to Þnd out about
new products, search for product information, purchase products, and have the merchandise delivered. When shop-
ping in conventional stores, they are more likely to use credit cards (while lower education shoppers are more inter-
ested in debit cards) and are more willing to have out-of-stock items delivered or available for pickup at a later date
from the retail store.
Lower education consumers are signiÞcantly more accepting of most forms of intrusive communications. When
shopping online, they are more tolerant of retailers� and manufacturers� product advertisements displayed on a Web
site and are more willing to receive e-mail notices alerting them to when new items and sales items are being
offered. These consumers also are more positive about receiving unsolicited communications within the physical
store. They like the idea of being greeted by a customer service representative when entering the store and are more
interested in receiving printed store circulars and seeing large signs featuring new and promotional items. They also
are more willing than higher education shoppers to be exposed to product advertisements in the store, on conven-
tional (e.g., printed signs) and electronic (e.g., handheld shopping devices) media.
Lower education shoppers are signiÞcantly more positive about in-store technologies that provide personalized prod-
uct suggestions and promotions. They are more willing to have a salesperson look up their past purchases on a com-
puter terminal and make recommendations or use a handheld device to scan a product�s UPC code and display a list
of complementary items, a rating of how well the product Þts their personal proÞle, or personalized product promo-
tions. Higher and lower education consumers do not differ in their interest in using convenience-oriented personal-
ization features, such as saving shopping lists and billing information to facilitate replenishment
purchases.
Higher education consumers resist some attempts to increase the complexity of the shopping experience. For exam-
ple, they would prefer not to have prices change daily based on store inventory and competitive conditions. They
also are less interested in using a kiosk to custom design their own ideal product.
Income
In general, education level was a better predictor than income of respondents� preferences for speciÞc shopping fea-
tures. However, income did play a signiÞcant role in a few relationships. Higher income consumers ($60k+) have a
greater interest in seeing detailed photographs of products when shopping online and checking product inventories
in local stores. They also are somewhat more interested than lower income shoppers in using credit cards as a
method of payment. When shoppers are asked what else they would include in their ideal shopping experience,
higher income consumers are 28 percent more likely than lower income consumers to suggest increased levels of
customer service.
IN
DI
AN
A
UN
IV
ER
SI
TY
—
K
PM
G
ST
UD
Y
15

Consumers have mixed feelings about technolo-
gy. They are enthusiastic about the power of personal computers but struggle with the complexity of new technolo-
gies and the continual threat of obsolescence. People marvel at how the Internet can provide extensive product
information and vast product assortments but feel overwhelmed by the clutter. Shoppers like to receive personalized
and relevant marketing messages but fear that they�ll lose their privacy as businesses build vast, centralized data
warehouses.
The IU-KPMG study revealed that consumers
are generally positive or at least neutral about
most of the aspects of the shopping experi-
ence that were tested. However, there is a sig-
niÞcant percentage of shoppers who are nega-
tive about several aspects of the shopping
experience, including intrusive communica-
tions, personalization, variable pricing poli-
cies, technology-intensive shopping aids, and
alternative methods of checkout and payment.
The following table lists those shopping fea-
tures that at least 10 percent of consumers
would prefer not to have.
Intrusive communications
Advertising is an important part of consumer
marketing. It informs and entertains con-
sumers, promotes products, and subsidizes
many of the traditional and interactive media
channels. Therefore, it is not surprising that
most consumers are positive or at least neu-
tral when asked about their preference for
online and in-store advertising. However,
almost a third of shoppers say that they would
prefer not to be exposed to one or more forms
of advertising tested. Consumers also have
mixed emotions about other types of intrusive
communications. Most shoppers like being
greeted by a store representative when enter-
ing a retail store and receiving e-mail notices
alerting them when new items become avail-
able. Yet, a segment of consumers say that
they would prefer not to have such interac-
tions with the retailer.
T E C H N O L O G Y T R A P SI
ND
IA
NA
U
NI
VE
RS
IT
Y
—
KP
MG
S
TU
DY
16
Shopping features that some consumers
would prefer not to have
Communications (%)
Online advertisements for products sold by a Web site 16.7
Store representative who welcomes guests and can answer questions 14.1
E-mail notiÞcation of new items 13.2
Handheld device displaying ads for products near your location 12.7
Manufacturers� online product advertisements 10.4
Personalization
Handheld scanner that evaluates product Þt with shopper�s preferences 21.1
Salesperson who can look up past purchases, make recommendations 16.0
Online proÞles of shoppers who previously bought speciÞc products 13.5
Web site that saves shipping and billing information for one-click ordering 12.5
Handheld device that displays personalized offers based on past purchases 12.3
Pricing
In-store prices that change daily based on stock levels/competition 36.2
Shelf pricing but no item pricing 26.6
In-store auction where you bid for products using handheld device 22.8
Store that sells products at discount to its most frequent shoppers 12.4
Shopping aids
Store-supplied handheld games for children 25.0
Store-supplied cell-phones to call friends/relatives for opinions 19.1
Store-supplied cell-phones to call sales assistants 12.4
Online customer service through one-way videoconferencing 11.1
Checkout and payment
In-store purchase receipt available on private Web site 36.4
In-store purchase receipt e-mailed to you 29.4
Pay for online purchases by faxing credit-card number to retailer 28.5
Scan products with handheld device while shopping, pay ATM 22.3
Self-scan and bag products at checkout, pay ATM 22.0
Pay for online purchases by swiping credit-card through keyboard reader 19.1

Shoppers have different opinions about product information and product advertising, the former being seen as more
objective, relevant, and desirable than the latter. When shopping online, 88 percent of respondents feel that a Web
site must or should have detailed product information, while only 20 percent have a similar desire to see product
advertising. In the physical store, 46 percent of consumers strongly favor store signs with product information and
almost the same amount (40%) are positive about in-store advertisements. Consumers place greater emphasis on
having detailed, objective product information when shopping online because they have no physical interaction with
the product.
Shoppers are more receptive to the idea of receiving e-mail notiÞcation of sale items than new items, with 54 per-
cent saying that retailers must or should provide this feature. Consumers are consistently more positive about shop-
ping features that provide a tangible beneÞt, such as a price discount.
While the results of this research generally are positive for advertisers, one should not assume that consumers will
tolerate further increases in the volume of advertising. The proliferation of advertising and other unsolicited commu-
nications on the Internet, in retail stores, and on handheld and wireless devices will continue to reduce advertising
effectiveness, and may cause the large group of indifferent consumers (38 percent for online ads, 24 percent for in-
store, and 32 percent for mobile) to turn decidedly negative.
Personalization and privacy
In recent years, retailers have sought to strengthen their relationships with customers through one-to-one marketing
programs. These programs collect individual-level data on the unique needs, preferences, and shopping habits of
consumers and attempt to personalize retailing activities to better satisfy shoppers� requirements. In this study, seven
online and nine in-store personalization features were evaluated.
Most consumers are positive or indifferent about the various personalization features tested. The Þve most popular
personalization options involve the Internet. Consumers are receptive to having a Web site keep track of their past
purchases to provide proof-of-purchase for returns and warranty repairs (68%), display personalized promotions
(50%), and simplify reordering (46%). People also like having a Web site that saves shipping and billing informa-
tion for one-click ordering (58%) and allows customers to construct a personal shopping list (46%). Each of these
features provides a signiÞcant consumer beneÞt and helps to overcome some of the inherent bandwidth and cus-
tomer-interface limitations of the Internet.
However, a segment of shoppers have reservations about letting businesses collect and use individual-level customer
data to tailor their marketing programs. People have the strongest negative reactions to personalization options that
make product recommendations based on a customer�s preference proÞle. For example, 21 percent of shoppers dis-
like having a handheld scanner tell them which products match their personal proÞle, 16 percent oppose having a
salesperson make recommendations based on their past purchases, and 14 percent object to having shoppers� proÞles
available online. Some shoppers also have reservations about one-click ordering, perhaps due to concerns about the
security of their credit-card information.
When evaluating these features, consumers differentiate between personalization by the manufacturer or retailer and
personalization by the consumer (also known as customization). Customization features include options to build per-
sonal shopping lists and custom-design products (online and in-store), and add items to a gift registry. Looking
across the 16 features tested, almost 50 percent of consumers objected to at least one of the personalization features,
IN
DI
AN
A
UN
IV
ER
SI
TY
—
K
PM
G
ST
UD
Y
17
while less than 20 percent disliked one or more of the customization features. These results are consistent with earli-
er research indicating that consumers prefer one-to-one marketing options that give them control over the acquisi-
tion, dissemination, and use of their personal information.
Variable pricing
Across all product categories, 36 percent of shoppers dislike the idea of having product prices change on a daily
basis depending on product inventory and competition compared to 25 percent with a more positive view. A smaller
group of shoppers dislike in-store auctions and loyalty programs that discount products for frequent shoppers. Not
surprisingly, people who shop and purchase products more frequently are more positive about stores running regular
sales, providing frequent shopper discounts, and changing prices on a regular basis, while infrequent shoppers tend
to favor everyday low prices.
Some shoppers also dislike having price labeling on shelf Þxtures as a substitute for individual item pricing. This is
of greatest concern to apparel shoppers, with more than 30 percent opposing this practice. Again, this conÞrms earli-
er research that consumers want to be able to Þnd prices quickly and easily while shopping.
Technology-intensive shopping aids
Some high-tech shopping features are seen by shoppers as being more trouble than they are worth. For example,
while it is technically possible to provide online customer service through one-way videoconferencing, 55 percent of
shoppers are indifferent or dislike this feature.
People also are not that interested in carrying and using a networked, palm computer or Web-enabled cell phone
during their shopping trip. For example, while many shoppers feel retailers should provide store maps on large signs
(61%) or kiosks (49%), only 18 percent of shoppers are enthusiastic about viewing a store map on a handheld
device. The highest rated applications of mobile devices are those that display coupons for products as shoppers
pass nearby and notify shoppers when they are next in line at the cash register. Shoppers are more enthusiastic about
using a specialized handheld device that can scan a product�s UPC label and display item pricing (63%), check if
other colors, styles and sizes of a product are available (52%), keep a running total of purchases (49%), and allow
self checkout (46%).
Of course, many online and in-store technologies can provide value for certain niche segments and applications. For
example, 24 percent of households with two or more young children favor having the store provide handheld
videogames for children compared to 14 percent for the total sample. This option was particularly attractive for
adults who are shopping for apparel (presumably because kids dislike buying clothes and would enjoy an electronic
babysitter).
Checkout and payment
We conclude this section with a discussion of alternative methods of checkout and payment. Many of these new
approaches are appealing to a particular segment of consumers or when shopping for a speciÞc type of product.
However, in almost every case, consumers favor the status quo. For example, overwhelming, Internet shoppers pre-
fer to enter a credit-card number on a secure Web page rather than swipe their card through a keyboard reader or fax
the number to the retailer. People shopping in conventional retail stores prefer to have a cashier scan and bag their
merchandise and accept payment rather than interact with an ATM. Almost all shoppers want to get a paper receipt
instead of a digital receipt sent as an e-mail attachment or available on a private Web site.
IN
DI
AN
A
UN
IV
ER
SI
TY
—
K
PM
G
ST
UD
Y
18
Consumers spoke with a clear voice about what
they want and do not want in their ideal shopping experience. The Þve key lessons are summarized below.
1. Technology Is a Means, Not an End
It�s easy to become enamored with new technologies. Vendors introduce a continuous stream of innovations, trade
shows dazzle us with ßashy demos, the media trumpets the virtues of new technologies, and the stock market
rewards early adopters. During the last two years, retailers rushed to develop Web sites, fearing that they would be
left behind by the digital revolution. Now they are embracing mobile e-commerce and in-store technologies.
Forrester Research reports that over 80 percent of retailers plan to roll out in-store kiosks by 2002.
But consumers tell us that they are not interested in technology for its own sake. People want the basics in their
ideal shopping experience. When shopping online, they look for accurate product and pricing information, conve-
nient and secure ordering, order tracking, reliable delivery, and accessible customer service. In retail stores, shop-
pers want knowledgeable and courteous sales help, clean and attractive facilities, competitive prices, fast checkout,
and convenient payment options. People rarely mentioned technology when they were asked to describe their shop-
ping nirvana.
However, technology can play a role in enhancing the shopping experience. We found, for example, that a large per-
centage of consumers are enthusiastic about having at least one application of each of the in-store technologies test-
ed. Looking across applications, 84 percent of shoppers felt that retailers must or should provide interactive kiosks,
89 percent requested electronic signs, and 73 percent asked for handheld shopping applications. However, there are
substantial differences in the ratings of each different application of the technology. For example, 63 percent of
shoppers wanted retailers to provide a handheld device that could perform price checks, but only 12 percent would
use the same device to participate in an in-store auction or call a friend or relative for advice.
This response suggests that it is not the technology per se, but how it is used to create value for customers, that will
determine its success. Several of the technology applications tested are perceived as less convenient than conven-
tional shopping aids. For example, most shoppers prefer to see what�s on sale by looking at a printed circular or
conventional signage rather than using a kiosk or a handheld device. Technology applications are rated highest when
they make shopping more convenient. Nearly two-thirds of the respondents like being able to clip and redeem
coupons electronically from a kiosk rather than having to cut them out of a newspaper and carry them to the check-
out counter. The same percentage want to self-scan products to verify prices rather than having to Þnd a sales assis-
tant to run a price check.
What about all of the other, high-tech features that were tested? Many of these have been hyped as the latest revolu-
tion in electronic shopping�software agents, discussion forums, online auctions, multimedia, 3-D shopping, text
chat, and voice chat, among others. From the customer�s perspective, they fall in the netherworld of indifference.
Most consumers didn�t care if they are provided or feel they are nice to have but not essential. In some cases, shop-
pers are happy with an existing alternative. In others, the technology is seen as not sufÞciently developed. Many of
these innovations will require signiÞcant reÞnement and consumer education to deliver their beneÞts.
H E A R I N G T H E V O I C E O F T H E C U S T O M E R
IN
DI
AN
A
UN
IV
ER
SI
TY
—
K
PM
G
ST
UD
Y
19
2. We Want to Shop Differently for Different Types of Products
We�ve seen retailers in the physical world become successful selling a variety of different products from one, conve-
nient location. Mass retailers, warehouse clubs, power centers and shopping malls have all achieved some degree of
success by providing one-stop shopping. Retailers create destinations; leveraging existing customer trafÞc to sell
more products. Why not use the same strategy on the Internet, selling a variety of products from a single Web site?
Following this reasoning, Amazon.com has expanded from selling books and music to a wide range of consumer
products.
The IU-KPMG study suggests that using the same shopping interface to sell a diverse set of products is likely to
result in a poor shopping experience. Shoppers value different features when shopping for different kinds of prod-
ucts. For products purchased infrequently, like appliances and electronics, consumers want detailed product informa-
tion and expert evaluations. For products purchased frequently, like groceries and school and ofÞce supplies, con-
sumers want a fast and convenient shopping trip with instant fulÞllment. Additionally, for apparel and entertainment
products like toys, books, and music, shoppers would
like a pleasant and entertaining shopping experience
with an extensive product selection. In the latter case,
there is more interest in seeking variety and learning
about new items. Objective information has limited
value because product evaluation is a more subjective
experience.
The beneÞts of one-stop shopping are reduced on the
Internet because online search costs are much lower
than in the physical world. At the same time, the risks
of using a one size Þts all shopping interface are much
greater. The electronic interaction is a degraded experi-
ence compared to conventional shopping, so it�s critical
to understand what cues consumers use to make deci-
sions and create an appropriate customer interface.
3. Don’t Treat Us Alike
During the last year, e-commerce companies went on a
spending spree to acquire customers, with sales and
marketing expenses often equaling or exceeding rev-
enues. They ran extravagant ad campaigns, gave shop-
pers substantial price discounts, and offered free ship-
ping; all in the hopes of cementing relationships with as many customers as possible. These high acquisition costs
were supposed to be offset by the repeat business of loyal shoppers.
Unfortunately, customer loyalty can�t be taken for granted. Different shoppers have different needs and wants and
they will go where they are best served. We found, for example, that women want features that make shopping more
convenient and provide better value while men are more enamored with new technical innovations. Younger con-
sumers place more emphasis on the visual experience and the fun of shopping while older consumers want more
IN
DI
AN
A
UN
IV
ER
SI
TY
—
K
PM
G
ST
UD
Y
20
detailed product information, faster shopping, and better service. By going after the mass market, these companies
guarantee that many shoppers will not be satisÞed with the experience. Rather than staying for the long haul, shop-
pers switch to the Þrst competitor who offers a better deal.
How can retailers satisfy a diverse group of shoppers? By giving them a choice. Coca Cola learned this lesson when
it replaced Classic Coke with what it thought was a better tasting new Coke. The consumer outcry forced the com-
pany to reintroduce the original. In the future, the trend will be for companies to give shoppers more control over
the experience, allowing them to tailor it to their unique style of shopping.
4. Help Us Make the Best Use of Each Channel
The initial success of several online shopping ventures led many consultants to predict that conventional retail stores
would be driven out of business. The research reveals that the Internet is not a substitute for the physical store but
instead is a valuable complement. Consumers want to use a variety of media in the process of purchasing goods and
services. They might see something new on television or in a catalog, then search the Internet for product informa-
tion, and Þnally visit a store to make a purchase. Retailers should explore how best to use technology to move con-
sumers through each of the stages in the purchase process.
Consumers are enthusiastic about several shopping features
that make it easier to shop across multiple channels. They like
being able to use the Internet to check prices, promotions, and
inventory in the closest retail store. They appreciate having
the option to buy online and pick up the product at the closest
store, shop in the store and have the merchandise delivered to
home, and return merchandise to the store or through the mail.
Retailers need to integrate channels so that consumers can
move transparently between the
various media.
This is not to say that the experience should be identical in
each medium. For example, several features that are popular
online are not as desirable when delivered in the store through
a kiosk or handheld device. Consumers are in a different
frame of mind and have different informational needs when
shopping online and in the physical store. This suggests that
retailers should exercise caution when attempting to Web
enable their stores. Rather than simply providing Web access
in the store, they should optimize the interface for the in-store
shopping environment.
5. Personalization Does Not Guarantee Our Loyalty
Many conventional and online retailers have invested in customer-relationship management, personalization, and
one-to-one marketing programs in the hopes of building customer loyalty and increasing customer retention.
Retailers believe that by tailoring their marketing activities to the unique needs and wants of individual shoppers,
they can do a better job of serving their customers.
IN
DI
AN
A
UN
IV
ER
SI
TY
—
K
PM
G
ST
UD
Y
21
While personalization can create customer value and reinforce loyalty, most applications have been simplistic and
retailer-centric. There are several reasons why personalization programs have failed to achieve their goals:
Convenience
One of the most popular methods of personalization is the frequent-shopper program, which rewards repeat cus-
tomers with price discounts. Some programs require shoppers to carry a special loyalty card and present it at the
point-of-purchase so that their purchases can be tracked across all forms of payment. Others require consumers to
save their receipts and turn them in at a special service desk. For people who do participate, this reduces the conve-
nience of shopping by adding extra steps to the process. For those people who don’t, it raises issues of fairness by
charging higher prices. It’s not surprising that some of the most popular personalization options increase the conve-
nience of shopping, such as saving a transaction log to simplify returns and warranty repairs.
Privacy
Most people don’t have to pay their friends to reveal their names, addresses, and hobbies. Yet, this is what most
retailers do when they sign shoppers up for their frequent shopper programs. They give people a discount in
exchange for information. Why? Because shoppers often don’t see any other tangible benefit for participating in
these programs. Quite the contrary, consumers worry that the information will be distributed to other companies
without their knowledge and permission, which may lead to junk mail, spam and telephone solicitation.
For personalization to be effective, retailers must build trust with the consumer. Shoppers want to know what infor-
mation is being collected and how it will be used. They would like the option to view and edit personal information
and to control its dissemination. Shoppers expect to see tangible benefits for providing personal data that are com-
mensurate with the amount and type of data provided.
Prediction
At the core of most personalization programs is an algorithm that attempts to predict which products, services, and
messages a consumer will respond most favorably towards. Often, this prediction is based on a statistical model of
the shopper’s past purchases and demographic profile. While this approach can improve the chances that shoppers
will respond to an offer, most consumers still receive a mountain of irrelevant and potentially irritating product rec-
ommendations and promotional messages. Prediction is poor because (1) the forecasts are based on an incomplete
record of shoppers’category purchases; (2) the purchase history may include items purchased for someone other
than the shopper; (3) consumers’needs change over time and across situations; and (4) purchase histories and demo-
graphic profiles may not reflect consumers’attitudes and lifestyles.
Retailers need to move away from the practice of just offering consumers more of what they bought last time (or
giving them an incentive to switch to a competing product). Retailers need to understand better the full constellation
of consumer needs and the role of variety seeking so they can filter out what consumers truly have no interest in, but
retain a selection of items that will satisfy and potentially delight shoppers. They also need to expand the concept of
personalization to include situational influences and the life stage of shoppers; both of which are important purchase
drivers.
22
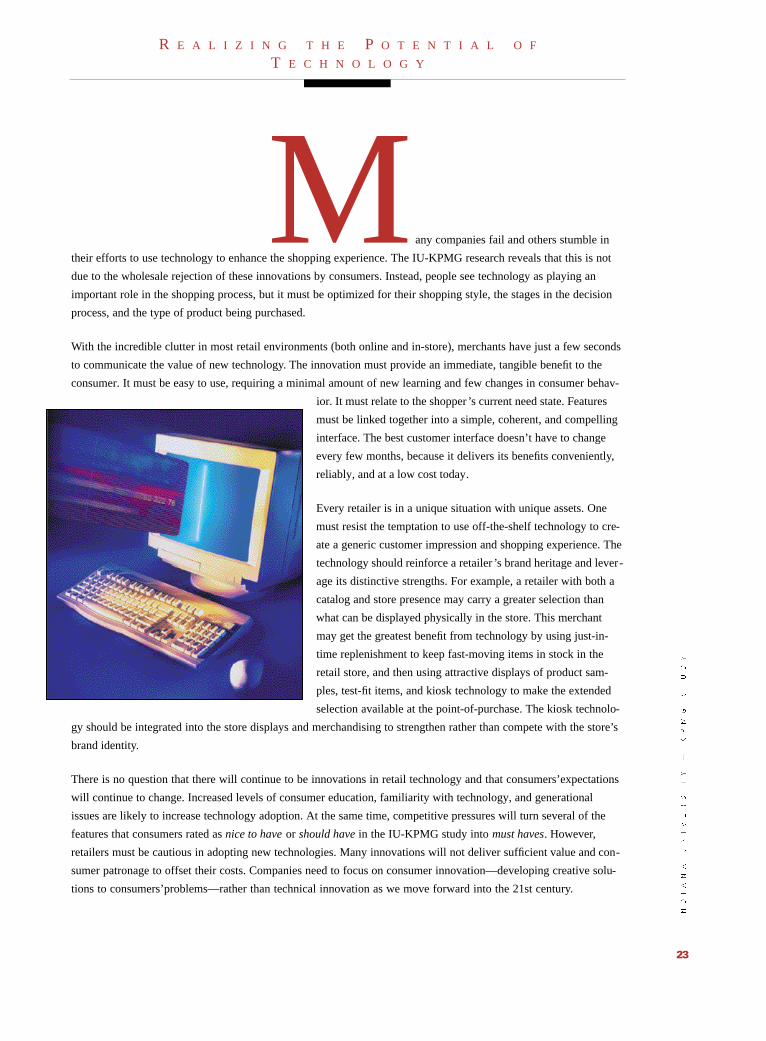
M any companies fail and others stumble in
their efforts to use technology to enhance the shopping experience. The IU-KPMG research reveals that this is not
due to the wholesale rejection of these innovations by consumers. Instead, people see technology as playing an
important role in the shopping process, but it must be optimized for their shopping style, the stages in the decision
process, and the type of product being purchased.
With the incredible clutter in most retail environments (both online and in-store), merchants have just a few seconds
to communicate the value of new technology. The innovation must provide an immediate, tangible benefit to the
consumer. It must be easy to use, requiring a minimal amount of new learning and few changes in consumer behav-
ior. It must relate to the shopper ’s current need state. Features
must be linked together into a simple, coherent, and compelling
interface. The best customer interface doesn’t have to change
every few months, because it delivers its benefits conveniently,
reliably, and at a low cost today.
Every retailer is in a unique situation with unique assets. One
must resist the temptation to use off-the-shelf technology to cre-
ate a generic customer impression and shopping experience. The
technology should reinforce a retailer ’s brand heritage and lever-
age its distinctive strengths. For example, a retailer with both a
catalog and store presence may carry a greater selection than
what can be displayed physically in the store. This merchant
may get the greatest benefit from technology by using just-in-
time replenishment to keep fast-moving items in stock in the
retail store, and then using attractive displays of product sam-
ples, test-fit items, and kiosk technology to make the extended
selection available at the point-of-purchase. The kiosk technolo-
gy should be integrated into the store displays and merchandising to strengthen rather than compete with the store’s
brand identity.
There is no question that there will continue to be innovations in retail technology and that consumers’expectations
will continue to change. Increased levels of consumer education, familiarity with technology, and generational
issues are likely to increase technology adoption. At the same time, competitive pressures will turn several of the
features that consumers rated as nice to have or should have in the IU-KPMG study into must haves. However,
retailers must be cautious in adopting new technologies. Many innovations will not deliver sufficient value and con-
sumer patronage to offset their costs. Companies need to focus on consumer innovation—developing creative solu-
tions to consumers’problems—rather than technical innovation as we move forward into the 21st century.
R E A L I Z I N G T H E P O T E N T I A L O F
T E C H N O L O G Y
23

Data were collected from NPD Group’s online con-
sumer panel during the May-June, 2000, time frame. The research was conducted in two phases. In the first phase,
10,000 consumers were contacted and asked if they had shopped for or purchased products (either online or in-
store) in each of ten broad categories during the last six months. The categories were (1) major appliances, (2) furni-
ture and lighting, (3) hardware, paint, and wallpaper, (4) small appliances and consumer electronics, (5) school and
office supplies, (6) toys and games, (7) music, movies, and books, (8) weekend apparel, (9) weekday apparel, and
(10) groceries and health and beauty care products.
Based on their responses, 4,000 people were selected to participate in the second phase of the survey. Each respon-
dent was screened to have shopped for, or purchased products, in one of the ten product categories during the last
six months. Respondents were asked to design their ideal shopping experience for one of the ten categories, and to
rate their interest in using various media at each stage in the shopping process. The survey also included questions
on consumer
demographics,
shopping habits,
and satisfaction.
The online survey
was completed by
2,120 consumers,
for an overall
response rate of
53 percent. Over
200 surveys were
completed for
each of the ten
categories, with
the exception of
furniture and
lighting, with 196
completes. The demographics of the sample reflected the characteristics of the online, U.S. population on most
dimensions. Sample percentages were within 5 percent of population statistics for age, 7 percent for gender, 2 per-
cent for income, 6 percent for education, and 4 percent for market size. Women were intentionally over-sampled
because of their significant role in retail spending.
S T U D Y M E T H O D O L O G Y / P A R T I C I P A N T
D E M O G R A P H I C S
24

25
Participant Demographics
A g e ( % )
Under 25 13.625 – 34 26.935 – 44 27.045 – 54 24.555 and over 8.0
G e n d e r ( % )
Male 39.1Female 60.9
Income lev e l ( % )
Under $25,000 10.0$25,000 - $34,999 14.2$35,000 - $44,999 12.5$45,000 - $59,999 21.0$60,000 - $74,999 14.9$75,000 - $99,999 14.5$100,000 and over 12.9
Education level attained ( % )
Some or no high school 2.1High school diploma 7.9Some college 24.2College diploma 38.5Postgraduate 27.3
Market size (MSA) ( % )
2,500,000 and over 26.61,000,000 – 2,499,999 26.3Under 1,000,000 29.6No MSA 17.5
Size of household ( % )
1 member 15.22 members 31.93 members 21.14 members 18.65 or more 13.2

© 2000 by the Trustees of Indiana University.
© 2000 KPMG LLP, the U.S. member firm of KPMG International, a Swiss association.All rights reserved. Printed in the U.S.A.


![I M ; E B Q G U C > H = H < H J - Beeline · 2020-05-18 · I j b e h ` _ g b _ d I m [ e b q g h f m ^ h ] h \ h j m I J : < B E : ^ _ g _ ]](https://static.fdocuments.in/doc/165x107/5f926ee2874c123aca2c4292/i-m-e-b-q-g-u-c-h-h-h-j-beeline-2020-05-18-i-j-b-e-h-g-b-.jpg)


![...2 H ] e Z \ e _ g b _ I : K I H J L H = J : F F. .......................................................................................................3 1. E ? < H C ...](https://static.fdocuments.in/doc/165x107/5fb48dfec0fcfc4f0561a2d5/-2-h-e-z-e-g-b-i-k-i-h-j-l-h-j-f-f-3.jpg)

![h k i b l Z l e v e h ] h i ^ b q k d h c j m i i u,Ÿрограмма-по... · F m g b p b i Z e v g h _ ^ ` _ l g h _ h e v g h _ a h \ Z l _ e v g h _ m q j _ ` ^ _ g b _ «](https://static.fdocuments.in/doc/165x107/5f679eedde772d0a8077de99/h-k-i-b-l-z-l-e-v-e-h-h-i-b-q-k-d-h-c-j-m-i-i-u-.jpg)


