C OST AND P ERFORMANCE R EPORT - FRTR OST AND P ERFORMANCE R EPORT ... C The P&T system has been...
16
COST AND PERFORMANCE REPORT Pump and Treat of Contaminated Groundwater at the Old Mill Superfund Site Rock Creek, Ohio September 1998 EPA Prepared by: U.S. Environmental Protection Agency Office of Solid Waste and Emergency Response Technology Innovation Office
Transcript of C OST AND P ERFORMANCE R EPORT - FRTR OST AND P ERFORMANCE R EPORT ... C The P&T system has been...

COST ANDPERFORMANCE
REPORT
Pump and Treat of Contaminated Groundwater at theOld Mill Superfund Site
Rock Creek, Ohio
September 1998
EPAPrepared by:
U.S. Environmental Protection AgencyOffice of Solid Waste and Emergency Response Technology Innovation Office

Old Mill Superfund Site
EPAU.S. Environmental Protection Agency
Office of Solid Waste and Emergency ResponseTechnology Innovation Office
TIO3.WP6\0327-01.stf134
SITE INFORMATION
Identifying Information Treatment Application
Old Mill Superfund SiteRock Creek, Ohio
CERCLIS #: OHD980510200
ROD Date: August 7, 1985
Type of Action: Remedial
Period of operation: September 1989 -Ongoing(Data collected through 1997)
Quantity of material treated duringapplication: 13 million gallons of groundwater[9]
Background
Historical Activity that GeneratedContamination at the Site: Illegal wastedisposal
Corresponding SIC Code: NA
Waste Management Practice ThatContributed to Contamination: NA
Location: Rock Creek, Ohio
Facility Operations: [4, 11]C The Old Mill Superfund site includes two
parcels of land, the Henfield property andthe Kraus property. The Henfield property isapproximately three acres in size, and theKraus property is approximately 10 acres insize (see Figures 1 and 2). The two parcelsare located across the road from each other,in a rural setting near the Village of RockCreek, Ohio. The site was used for illegaldisposal of drummed wastes for anundetermined number of years.
C In 1979, the U.S. EPA (EPA) and Ohio EPA(OEPA) found approximately 1,200 drumsof waste including oils, resins, and PCBs onthe Old Mill site. Drum and soil removalwas completed in November 1982 as aSuperfund emergency removal activity. The source removal actions at the Old Millsite included removal of drums containinghazardous materials, as well as excavationand off-site disposal of contaminated soil. Allowable Residual Contaminant (ARC)Criteria, or cleanup levels, were calculatedto determine the concentrations ofcontaminants that could remain in the soil.
No other contaminant sources, undergroundor above ground, were identified at the site.
C The site was listed on the National PrioritiesList (NPL) in September 1983.
C The Remedial Investigation (RI)/FeasibilityStudy (FS) was completed in 1984. Anaddendum to the RI was completed in 1985.
Regulatory Context:C Site activities are conducted under
provisions of the ComprehensiveEnvironmental Response, Compensation,and Liability Act (CERCLA) of 1980, asamended by the Superfund Amendmentsand Reauthorization Act (SARA) of 1986,§121, and the National Contingency Plan(NCP), 40 CFR 300 [4].
C On August 7, 1985, the EPA issued aRecord of Decision (ROD).
Remedy Selection: C Extraction of groundwater and treatment via
carbon filtration was selected as the remedyfor contaminated groundwater at this site. Effluent is discharged to a local waterway. An air stripper and collection trench wereadded to the remedy during remedialdesign [4].

SITE INFORMATION (CONT.)
Old Mill Superfund Site
EPAU.S. Environmental Protection Agency
Office of Solid Waste and Emergency ResponseTechnology Innovation Office
TIO3.WP6\0327-01.stf135
Site Logistics/Contacts
Site Lead: EPA Treatment System Vendor:
Remedial Project Manager:Ron Murawski*U.S. EPA Region 577 W. Jackson Blvd.Chicago, IL 60604-3590 Omprakash Patel (Site Manager)*(312) 886-2940 Roy F. Weston, Inc.
State Contact:Mike EberleOhio EPA216-963-1126
Aptus Environmental Services, Inc.Coffeyville, KS 67337(Construction Contractor)
Operations & Maintenance:
Suite 4003 Hawthorn ParkwayVernon Hills, IL 60061-1450(847) 918-4051
*Indicates primary contacts
MATRIX DESCRIPTION
Matrix Identification
Type of Matrix Processed Through theTreatment System: Groundwater
Contaminant Characterization [1,10]
Primary Contaminant Groups: VolatileOrganic Compounds (VOCs)
C Contaminants of concern at the site includeTCE, PCE, trans-1,2-DCE, and VC. Phthalates also were detected at the site.However, since initial sampling, phthalatecompounds have not been detected ingroundwater.
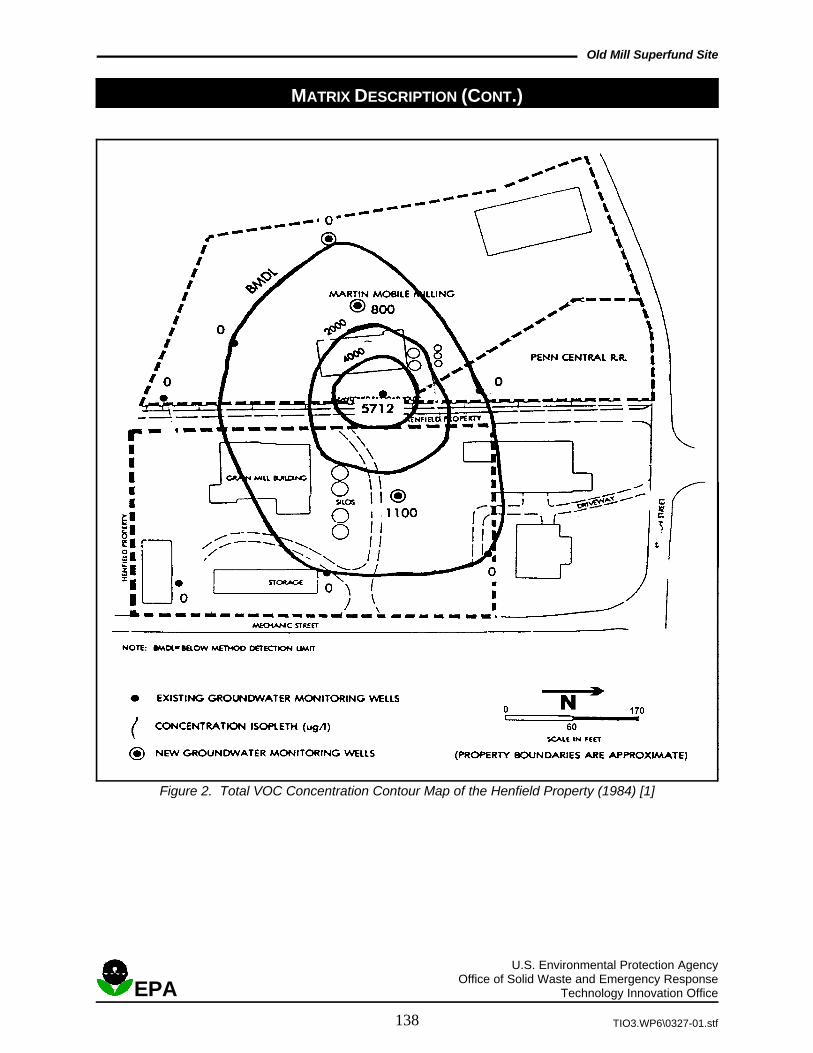
C Two separate plumes (depicted in Figures 1and 2) were identified at the site, one on theKraus parcel and one on the Henfieldparcel. The two plumes are notcommingled and are located over 1,000 feetapart. As originally detected, the Henfieldplume primarily consisted of halogenatedVOCs and the Kraus plume consisted ofbenzene and xylene.
C The maximum contaminant concentrationsdetected on the Henfield parcel were TCE(6,100 µg/L), PCE (300 µg/L), trans-1,2-DCE (460 µg/L), and VC (14 µg/L). The
maximum contaminant concentrationsdetected on the Kraus parcel wereethylbenzene (19,000 µg/L) and xylenes(43,000 µg/L). Halogenated compoundswere not originally detected in the plumelocated on the Kraus parcel. However,during construction activities, TCE andtrans-1,2-DCE were discovered in the soilsand groundwater on the Kraus parcel, andcontinue to be the primary contaminantswithin that plume.
C The initial plume at the Henfield parcelextended 150 to 250 feet downgradient fromthe site. The areal extent of this plume wasestimated during the remedial investigationto be 130,000 square feet. Based on aporosity of 30% and plume thickness of fivefeet, the volume of contaminatedgroundwater on the Henfield parcel wasestimated for this report at 1.5 milliongallons. Plume thickness was estimatedbased on the saturated thickness of theupper aquifer.

MATRIX DESCRIPTION (CONT.)
Old Mill Superfund Site
EPAU.S. Environmental Protection Agency
Office of Solid Waste and Emergency ResponseTechnology Innovation Office
TIO3.WP6\0327-01.stf136
Contaminant Characterization (Cont.)
C The plume at the Kraus parcel was initially C Figures 1 and 2 depict total VOCestimated to be 110,000 square feet in areal contaminant contours for the Old Mill siteextent during the remedial investigation. (as detected during 1984 sampling events). Based on a porosity of 30% and a plume Note the orientation of the figures for laterthickness of five feet, the volume of discussion of groundwater characteristics.contaminated groundwater at the Krausparcel was estimated for this report at 1.2million gallons.
Matrix Characteristics Affecting Treatment Costs or Performance
Hydrogeology: [1, 3, 10]
Two distinct hydrogeologic units have been identified beneath this site. Groundwater movesacross the site at a relatively slow rate of 20 feet per year. The first hydrogeologiccharacterization depicted the site as primarily two interconnected soil groups. However, laterfindings during characterization efforts in 1985 showed that the site was actually two separateaquifers with an aquitard in between.
Groundwater is found at approximately five feet below ground surface. The majority of thegroundwater contamination is found in the upper unit. Groundwater flow is to the west-southweston the Henfield property and to the north-northwest on the Kraus property. Rock Creek is locatedapproximately 500 feet south of the site. Tables 1 and 2 include technical aquifer information andwell data, respectively.
Unit 1 Glacial till The upper unit is approximately 10 feet thick and consists of siltyglacial till. The aquifer is considered poor quality for domestic wellsupply. This unit is separated from the underlying shale unit by a lowconductivity layer of a clayey till that acts as an effective aquitard. The clayey till is approximately five feet thick.
Unit 2 Weathered This lower unit is approximately 16 feet thick and consists of aShale weathered shale with evident vertical fractures. The porosity of this
unit decreases with depth.
Table 1. Technical Aquifer Information
Unit Name (ft) (ft/day) (ft/day) Flow DirectionThickness Conductivity Average Velocity
Glacial Till 10 1.25 0.055 West-Southwest (Henfield)
Weathered Shale 16 0.22 NA West(Henfield)
Glacial Till (Kraus) 10 1.25 0.055 North-Northwest
Weathered Shale 16 0.22 NA North-Northwest(Kraus)
Source: [10]NA - not available

MATRIX DESCRIPTION (CONT.)
Old Mill Superfund Site
EPAU.S. Environmental Protection Agency
Office of Solid Waste and Emergency ResponseTechnology Innovation Office
TIO3.WP6\0327-01.stf137
Figure 1. Total VOC Concentration Contour Map of the Kraus Property (1984) [1]
MATRIX DESCRIPTION (CONT.)
Old Mill Superfund Site
EPAU.S. Environmental Protection Agency
Office of Solid Waste and Emergency ResponseTechnology Innovation Office
TIO3.WP6\0327-01.stf138
Figure 2. Total VOC Concentration Contour Map of the Henfield Property (1984) [1]

Old Mill Superfund Site
EPAU.S. Environmental Protection Agency
Office of Solid Waste and Emergency ResponseTechnology Innovation Office
TIO3.WP6\0327-01.stf139
TREATMENT SYSTEM DESCRIPTION
Primary Treatment Technology Supplemental Treatment Technology
Pump and treat (P&T) with air stripping Carbon adsorption, particulate filters
System Description and Operation
Table 2. Technical Well DataExtractionWell Name Unit Name Depth (ft) Design Yield (gpd)
Martin Sump* Glacial Till 7 1,000
Henfield Sump Glacial Till 7 1,175
Kraus Sump-1 Glacial Till 7 1,000
Kraus Mod-2 Glacial Till 7 900
Kraus A-Sump Glacial till 7 140
Henfield Well Lower Aquifer 25 700
Kraus Well-1 Lower Aquifer 25 215
Kraus Well-2 Lower Aquifer 25 100*The Martin Sump is located off site adjacent to the Henfield property in the downgradient part of the plume.Source: [3]
System Description [3]
C The P&T system has been designed toremediate plumes from both parcels. Thecurrent extraction system for both plumesconsists of three deep recovery wells toextract groundwater from the lower unit(lower aquifer) and five collection trenchesto collect groundwater from the upper unit(glacial till). The collection trenches areseven feet deep and total 1,055 feet inlinear length. The deep recovery wells areapproximately 25 feet deep with a 10-footscreen interval set at the bottom. Theextraction system was designed to removea total of five gpm from the aquifer. Thedeep recovery wells were placed in thecenter of the plumes and the collectiontrenches at the toe of the plumes. Extractedwater from both plumes is treated in onetreatment plant.
C The part of the extraction system on theKraus property required severalmodifications. The original extractionsystem consisted of two deep extractionwells and one collection trench. Duringconstruction, a new area of VOC-contaminated groundwater was discovered. Construction temporarily stopped while a
revised design was configured. Onceapproved by EPA, a second collectiontrench was constructed approximately 200feet downgradient of the first. Thiscollection trench is 73 feet long and wasplaced to capture the newly detectedgroundwater contaminants.
C In 1993, the plume of TCE and 1,2-DCE onthe Kraus property was observeddowngradient of the second collectiontrench. As a result, a third collection trenchwas constructed on the Kraus property, andplaced approximately 250 feet downgradientof the second trench. It is over 360 feetlong and is situated to completely interceptthe migrating plume. Two new monitoringwells were added to monitor groundwaterdowngradient of the third collection trench.
C During design of the treatment plant, arecycle line was incorporated to boostprocess flow from 5 gpm to 35 gpm throughthe stripping tower. This change allowed formore efficient blower sizing and strippingmedia selection.
C The initial, on-site treatment systemconsists of an 18-inch diameter air-strippingtower and two 1,000-pound granular
TREATMENT SYSTEM DESCRIPTION (CONT.)
Old Mill Superfund Site
EPAU.S. Environmental Protection Agency
Office of Solid Waste and Emergency ResponseTechnology Innovation Office
TIO3.WP6\0327-01.stf140
System Description and Operation (Cont.)
activated carbon adsorption units in series. C The extraction network continues to extractIn March, 1997, the two carbon units were groundwater from both the deep andreplaced by one 1,000-pound, granular shallow aquifers at a 20:80 ratio. Overall,activated carbon unit. Polypropylene groundwater extraction rates declinedsaddle-type packing media are used in the slightly during the first seven years ofstripping tower with a packing height of 14 operation, then increased by 30 percent infeet. the eighth year.
C A groundwater monitoring system consisting C The treatment train includes carbon filtrationof 18 wells on the Kraus property (including to remove any organic compounds, such asthe two new wells), eight wells on the phthalates, that may remain in the effluentHenfield property, and eight total from the air stripper. The operating historypiezometers on both properties is used to of the treatment plant indicates that verytrack contaminant movement and little, if any, material enters the carbongroundwater flow. treatment unit. As reported in each Annual
C Effluent from the treatment system is may be under-utilized. A new carbondischarged to Rock Creek under a NPDES adsorption tank was installed in March 1997,permit. Rock Creek is located 500 feet replacing two existing tanks. No othersouth of the site. carbon changes have occurred during the
System Operation [5-9,11]C Quantity of groundwater pumped from
aquifer by year:
Volume Pumped (gal)
Year Upper Unit Lower Unit
1990 1,377,424 495,777
1991 1,793,060 404,081
1992 1,186,225 269,540
1993 1,756,546 294,605
1994 1,235,491 327,780
1995 1,019,864 274,777
1996 1,455,491 277,132
1997 1,849,201 407,829
Performance Report, the activated carbon
life of the system.
C The extraction network on both propertieshas worked well with no reported cloggingproblems. Pumps within wet wellsassociated with the collection trenches havereportedly worked properly.
C From March 1990 to September 1997, thesystem was 99% operational.
C Air stripper media has not required changingduring this period of operation.
C Following the replacement of the old carbonunits with a new carbon unit, thegroundwater extraction rate increasedsignificantly.

TREATMENT SYSTEM DESCRIPTION (CONT.)
Old Mill Superfund Site
EPAU.S. Environmental Protection Agency
Office of Solid Waste and Emergency ResponseTechnology Innovation Office
TIO3.WP6\0327-01.stf141
Operating Parameters Affecting Treatment Cost or Performance
The major operating parameter affecting cost or performance for this technology is the extraction rate. Table 3 presents the value measured for this and other performance parameters.
Table 3. Performance Parameters
Parameter Value
Extraction Rate Avg. = 3.1 gpm (2.46 - 4.18)
Performance Standard (Effluent PCE 4.1 µg/LNPDES Limits) TCE 1.9 µg/L
TCA 3.8 µg/Ltrans-1,2-DCE 1.6 µg/L
Remedial Goals PCE 8.2 µg/L(Aquifer) TCE 15.0 µg/L
1,2-DCE 1.9 µg/Lethylbenzene 8,000 µg/L
Note: The average system extraction rate was 4,500 gpd based on 13million gallons of groundwater pumped and a 99% operation rate.
Source: [3]
Timeline
Table 4 presents a timeline for this application.
Table 4. Timeline
Start Date End Date Activity
8/85 --- ROD signed
2/87 --- Changes made to the remedial design
6/87 6/89 Extraction and collection system constructed, and contaminated soils removed
3/89 6/89 Additional collection trench and deep extraction well added to Kraus collection system based onfield sampling conditions during soils removal operations
9/89 --- Treatment system operations begun
4/94 7/94 Additional collection trench and monitoring wells added to the Kraus property
TREATMENT SYSTEM PERFORMANCE
Cleanup Goals/Standards Additional Information on Goals
Specific cleanup criteria were established during The cleanup goals for groundwater remediationthe design phase by OEPA and EPA personnel. at this site were based on achieving a 1 x 10Table 3 includes goals for contaminants of carcinogenic risk level [4]. concern. These goals must be met throughoutthe aquifer as measured in all on-site wells [4].
-5

TREATMENT SYSTEM PERFORMANCE (CONT.)
Old Mill Superfund Site
EPAU.S. Environmental Protection Agency
Office of Solid Waste and Emergency ResponseTechnology Innovation Office
TIO3.WP6\0327-01.stf142
Treatment Performance Goals [3]
C To contain the contaminant plume and C To reduce effluent contaminantprevent off-site migration of contaminants. concentrations to meet NPDES permit
requirements.Performance Data Assessment [5-13]
C The 1997 annual sampling data indicate that C The maximum concentrations ofthe P&T system has contained the plume;however, contaminant concentrations inmuch of the plume remain aboveestablished goals. Although additionalcollection trenches were required at theKraus property, no contaminants havemigrated off site. [9]
C After eight years of operation, levels of TCEand trans-1,2-DCE still exceed cleanupgoals. Figures 3 and 4 show concentrationsof TCE and 1,2-DCE in on-site samplingpoints on the Henfield Property. Figures 5and 6 depict TCE and 1,2-DCEconcentrations detected on the Krausproperty. Concentrations in Figure 6 are anaverage of two wells in the deep aquifer.
C The 1993 annual performance reportindicated that the plume of contaminants inthe shallow aquifer had migrated past thesecond collection trench. As a result, anadditional collection trench was added andappears to be providing adequatecontainment. No contaminants havemigrated off site.
C The Henfield plume has been containedwith the original collection trench and deepextraction well configuration. Nocontaminants have migrated downgradientof the Henfield site.
C Two hot spots in the vicinity of the Henfieldsump and Kraus modified sump remainproblematic at this site. As of March 1997,TCE concentrations in the Kraus modifiedsump and the Henfield sump were 1,400µg/L and 1,700 µg/L, respectively.
contaminants in the groundwater during theJuly 1997 sampling event were TCE (1,700µg/L), trans-1,2-DCE (730 µg/L), and PCE(93 µg/L).
C Figure 7 presents the removal of totalcontaminants through the treatment systemfrom 1990 to 1997. The P&T systemremoved approximately 124 pounds ofcontaminant mass during this period.
C Due to increased concentrations of TCE and1,1-DCE in the influent and increased flowthrough the treatment plant, the VOC massloading to the treatment plant has increasedin 1997.
C Groundwater level contour maps in annualreports indicate the deep extraction wellsare creating an inward gradient over theaffected areas. The collection trenches arealso creating an inward gradient in theirvicinity. Groundwater that naturally flowstoward the trenches is collected.
C As noted earlier, the second goal of thetreatment system is to removecontaminants from extracted groundwater tomeet discharge requirements of the NPDESpermit. Based on annual performancereports, discharge requirements have beenmet consistently. Phthalate compounds,which may require carbon treatment, havenot been detected in influent or effluentsampling.
C Total contaminant removal rates reported inannual performance reports have fluctuated;however, the trend of the contaminantremoval rate has declined exponentiallyfrom 0.08 lbs/day in July 1991 to 0.01lbs/day in September 1996. However, thecontaminant removal rate increased to 0.04lbs/day in 1997.

0
500
1000
1500
2000
May-90 Sep-91 Jan-93 Jun-94 Oct-95 Mar-97 Jul-98
Co
nce
ntr
atio
n (
ug
/L)
TCE in Henfield well 1,2-DCE in Henfield well
0
500
1000
1500
2000
2500
3000
3500
May-90 Sep-91 Jan-93 Jun-94 Oct-95 Mar-97 Jul-98
Co
nce
ntr
atio
n (
ug
/L)
TCE in Kraus modified sump 1,2-DCE in Kraus modified sump
TREATMENT SYSTEM PERFORMANCE (CONT.)
Old Mill Superfund Site
EPAU.S. Environmental Protection Agency
Office of Solid Waste and Emergency ResponseTechnology Innovation Office
TIO3.WP6\0327-01.stf143
Figure 3. TCE and 1,2-DCE Concentrations on the Henfield Property (Deep Aquifer)(July 1991 - October 1996) [6-9,12]
Figure 4. TCE and 1,2-DCE Concentrations on the Kraus Property (Shallow Aquifer)(July 1991 - July 1997) [6-9,12]

0
1000
2000
3000
4000
5000
May-90 Sep-91 Jan-93 Jun-94 Oct-95 Mar-97 Jul-98
Co
nce
ntr
atio
n (
ug
/L)
TCE in Henfield Sump 1,2-DCE in Henfield Sump
0
200
400
600
800
1000
May-90 Sep-91 Jan-93 Jun-94 Oct-95 Mar-97 Jul-98
Co
nce
ntr
atio
n (
ug
/L)
Average TCE Average 1,2-DCE
TREATMENT SYSTEM PERFORMANCE (CONT.)
Old Mill Superfund Site
EPAU.S. Environmental Protection Agency
Office of Solid Waste and Emergency ResponseTechnology Innovation Office
TIO3.WP6\0327-01.stf144
Figure 5. TCE and 1,2-DCE Concentrations on the Henfield Property (Shallow Aquifer)(July 1991 - July 1997) [6-9,12]
Figure 6. TCE and 1,2-DCE Concentrations on the Kraus Property (Deep Aquifer)(July 1991 - July 1997) [6-9,12]

0
0.02
0.04
0.06
0.08
0.1
0.12
0.14
0.16
0.18
0.2
Dec-88 May-90 Sep-91 Jan-93 Jun-94 Oct-95 Mar-97 Jul-98
Cu
mu
lati
ve M
ass
Rem
ove
d (
lb)
0
20
40
60
80
100
120
140
Mass Flux Mass Removed
TREATMENT SYSTEM PERFORMANCE (CONT.)
Old Mill Superfund Site
EPAU.S. Environmental Protection Agency
Office of Solid Waste and Emergency ResponseTechnology Innovation Office
TIO3.WP6\0327-01.stf145
Figure 7. Mass Flux Rate and Cumulative Mass (TCE, 1,2-DCE, and PCE) Removal(1990 - 1997) [6-9,12]
Performance Data Completeness
C Performance data for influent, effluent, and References 6 through 9 and 14 containgroundwater concentrations are available annual sampling data.quarterly from 1990.
C Contaminant mass removal and the volume limits, half of the detection limit was usedof groundwater treated annually was for evaluation purposes.provided in annual performance reports.
C Contaminant concentrations detected duringannual sampling events were used foranalyses performed in this report.
C When results were reported below detection
Performance Data Quality
The QA/QC program used throughout the remedial action met the EPA and the State of Ohiorequirements. All monitoring was performed using EPA-approved methods, and the vendor did not noteany exceptions to the QA/QC protocols.

Old Mill Superfund Site
EPAU.S. Environmental Protection Agency
Office of Solid Waste and Emergency ResponseTechnology Innovation Office
TIO3.WP6\0327-01.stf146
TREATMENT SYSTEM COST
Procurement Process
The U.S. Army Corps of Engineers (USACE) was responsible for oversight during construction activities. Woodward-Clyde was awarded the remedial design contract. The USACE contracted with AptusEnvironmental to perform remedial action activities. Roy F. Weston is the operations and maintenancecontractor for the treatment facility.
Cost Analysis
All costs for the investigation were borne by the U.S. EPA and OEPA. The U.S. EPA is responsible forO&M costs for the first 10 years, at which point the State of Ohio will assume responsibility.
Capital Costs [2] Operating Costs [2]Remedial Construction Cumulative Operating Costs (1989-1996)
Monitoring Wells, Sampling $138,000 Labor $787,132
Backfilling and Paving $474,000 Utilities $93,230
Groundwater Extraction $537,200 Analytical $478,308System
Groundwater Treatment $345,100Facility
Additional collection trench, $101,700monitoring wells (1994)
Total Remedial $1,596,000Construction
Maintenance $22,568
Miscellaneous $34,215
Report Preparation $224,547
Total Operating $1,640,000Expenses
Other CostsRemedial Design $954,235
Corps Oversight $49,968
Cost Data Quality
Actual capital and operating cost data were provided by the U.S. EPA Remedial Project Manager (RPM),including a detailed breakdown of the cumulative operating costs included in this report.
OBSERVATIONS AND LESSONS LEARNED
C Collection trenches were added to improve C The actual capital cost for this project wasplume containment. This modification approximately $286,000 more than theresulted in an increase of $286,000 to total original bid cost. An additional $184,000capital costs. $184,000 of this increase was was required during initial constructionincluded in the original remedial action activities and $102,000 was added in 1994. costs; $102,000 was added in 1994. This represents a 22% increase in capital
C The total cost of treatment using the P&Tsystem was $3,236,000, consisting of C The average annual O&M cost, based on$1,596,000 in capital costs and $1,640,000 the first eight years of operation, wasin cumulative operating costs through 1997. This corresponds to a cost of $26,100 perpound of contaminant removed and $250per thousand gallons of groundwatertreated.
costs over the original bid cost.
approximately $205,000 per year. This costincludes O&M costs, report preparationcosts, analytical costs, and capitalexpenditure costs [13].
C After eight years of P&T operation and theremoval of 124 pounds of contaminants

OBSERVATIONS AND LESSONS LEARNED (CONT.)
Old Mill Superfund Site
EPAU.S. Environmental Protection Agency
Office of Solid Waste and Emergency ResponseTechnology Innovation Office
TIO3.WP6\0327-01.stf147
from the groundwater, the cleanup goals C According to the RPM, the P&T system athave not been met. this site does not appear to have the typical
C In several wells, concentrations of contaminants have been identified after thecontaminants have increased above initial initial investigation and contaminantlevels. According to the RPM formerly concentrations have increased at timesassigned to the site, the reason for the during operations. The reasons for theseincrease in groundwater concentration is not events is not known at this time [2].known at this time; however, it potentially isdue to precipitation increase or a subsurface C A dual-stage carbon adsorption system wassource zone [2]. built into the treatment system to handle the
effect on groundwater contamination. New
anticipated levels of semivolatiles in theinfluent; however, the levels in the influentstream have not been above detection limitssince operations began. Consequently, theactivated carbon units have not beenutilized as intended and may not have beennecessary [11].
REFERENCES
1. Remedial Investigation Report for Old Mill, 8. Fifth Annual Performance EvaluationCH2M Hill, 1984. Report, Roy F. Weston, Inc., 1995.
2. Correspondence with Remedial Project 9. Sixth Annual Performance EvaluationManager. U.S. EPA Region V, May 7, Report, Roy F. Weston, Inc., 1996.1997.
3. Remedial Action Report, U.S. Army Corps Report, CH2M Hill, 1985.of Engineers, 1990.
4. Superfund Record of Decision, U.S. EPA,1985. 12. Seventh Annual Performance Evaluation
5. Eighth Quarterly Evaluation Report, Roy F.Weston, Inc., 1993. 13. Comments on the April 14, 1998
6. Third Annual Performance Evaluation Report, Ron Murawski and OmprakashReport, Roy F. Weston, Inc., 1993. Patel, May 18, 1998.
7. Fourth Annual Performance EvaluationReport, Roy F. Weston, Inc., 1994.
10. Addendum to the Remedial Investigation
11. Five Year Review, U.S. EPA, 1996.
Report, Roy F. Weston, Inc., April 1998
Preliminary Draft Cost and Performance
Analysis Preparation
This case study was prepared for the U.S. Environmental Protection Agency's Office of Solid Waste andEmergency Response, Technology Innovation Office. Assistance was provided by Eastern ResearchGroup, Inc. and Tetra Tech EM Inc. under EPA Contract No. 68-W4-0004.

148
This Page Intentionally Left Blank