![Science Fiction - McGill Physicspeter/534A/nano.pdfMelting Transition ~ 300 pN Duplex poly(dG-dC) 300 450 600 750 Molecular Extension [nm] b = 0.8 nm L = 778 nm b = 0.8 nm L = 462](https://static.fdocuments.in/doc/165x107/5fd531ec5a9c0b42f37dcb7f/science-fiction-mcgill-peter534ananopdf-melting-transition-300-pn-duplex.jpg)
C-L OPY j.ID:TA - Defense Technical Information Center · C-L OPY j.ID:TA DI f? _ __ Office of the...
23
C-L OPY j.ID:TA DI f? _ __ Office of the Chief of Naval Research Contract N00014-87-K-0326 Technical Report No. UWAIDME/RT-90/3 By---- N L Dtr ibutIon/ Avaid-L:biiitY Codes NAvali and/or N t Spec•al A SEM PROCEDURE FOR QUANTIFYING TRANSGRANULAR FRACTURE IN BRITTLE MATERIAL W.-J. Yang, C.-T. Yu and A. S. Kobayashi July 1990 The research reported in this technical report was made possible through support extended to the Department of Mechanical Engineering, University of Washington, by the Office of Naval Research under Contract N00014-K-0326. Reproduction in whole or in part is permitted for any purpose of the United States Government. IDISTF{IBUT1ON STATENTA Approved for public release; Di3tribtio'n Unlimited REPRODUCED BY U.S. DZPARTMENT OF COMMERCE NATIONAL TECHNICAL INFORMATION SERVICE SPRINGFIELD, VA 22161 0Jy 9 x
Transcript of C-L OPY j.ID:TA - Defense Technical Information Center · C-L OPY j.ID:TA DI f? _ __ Office of the...
C-L OPY j.ID:TADI f? _ __
Office of the Chief of Naval ResearchContract N00014-87-K-0326
Technical Report No. UWAIDME/RT-90/3 By----N L Dtr ibutIon/
Avaid-L:biiitY Codes
NAvali and/or
N t Spec•al
A SEM PROCEDURE FOR QUANTIFYING TRANSGRANULARFRACTURE IN BRITTLE MATERIAL
W.-J. Yang, C.-T. Yu and A. S. Kobayashi
July 1990
The research reported in this technical report was made possible through
support extended to the Department of Mechanical Engineering, University ofWashington, by the Office of Naval Research under Contract N00014-K-0326.Reproduction in whole or in part is permitted for any purpose of the UnitedStates Government.
IDISTF{IBUT1ON STATENTA
Approved for public release;Di3tribtio'n Unlimited
REPRODUCED BYU.S. DZPARTMENT OF COMMERCE
NATIONAL TECHNICALINFORMATION SERVICE
SPRINGFIELD, VA 22161 0Jy 9 x

DISCLAIMEI NOTICE
THIS DOCUMENT IS BEST
QUALITY AVAILABLE. THE COPY
FURNISHED TO DTIC CONTAINED
A SIGNIFICANT NUMBER OF
PAGES WHICH DO NOT
REPRODUCE LEGIBLY.
07-11-90A SEM PROCEDURE FOR UANTItFYING TRANSGRANUL.AR FRACT, URE
IN BRITTLE MATERIAL
Wein-Joe Yang, Chang-Te Yu and Albert S, KobayashiUniversity of Washington
Department of Mechanical EngineeringSeattle, WA 98195
ABSTRACT
A SEM procedure for quantifying the percentage area of transgranular fracture wasdeveloped for studying the fracture morphologies of stable and rapid crack growths inceramics and ceramic matrix composites. The procedure utilizes SEM line scanningprofiles which are scanned and then interpreted as percentage area of transgranularfracture and surface roughness through a special software. This procedure was used toquantify the percentage area of transgranular fracture and surface roughness which werecorrelated with the visual observations and profilometer measurements respectively, ofAl203 and SiCý/Al2 0 3 fracture specimens.
INTRODUCTION
Dynamic fracture of quasi-brittle metals and polymers are characterized by crack
velocity versus stress intensity factor (SIF) relations which represent a gamma curve
with distinct crack arrest SIF's ,[1-4 Conventional dynamic fracture tests show
unequivocally that unlike metals/polymers, such dynamic crack arrest SIF does not exist
in monolithic and some ceramic matrix composites[5-121. These results were generated
by blunt machined notches with larger stored energy prior to rapid crack propagation. Once
the excess driving force had been dissipated during rapid crack propagation under static
loading and the crack had entered a region of dynamic SIF. which is lower than KIc, crack
arrest was to be expected but such was not the case. Crack arrest, however, has been
observed in chevron-notched, SiCw/A1203 ceramic composites, three point bend
specimens, when loaded under an extremely small displacement rate of 0.01 mm/min. 1131.
The run-arrest events in these tests were characterized by small crack jumps of about
0.8 mm, which initiated at the sharp crack tip in the chevron notched specimens.
Recently, this lack of crack arrest was attributed to the small difference in the
fracture morphology associated with extremely slow and rapid crack extensions. This
postulate was tested by extensive fractography analysis of the statically and impact
loaded Al,03 specimens [14). Typical SEM pictures of the fracture surfaces from the
2
I
crack irtiation and the terminal phases of statically loaded A1,2 0 3 specimen showed that
while intergranular fracture was the dominant failure mode in both specimens, differing
amount of transgranular fracture was observed on the fracture surface. The percentage
areas of transgranular fracture decreased from an average of 16% during the initiation
phase to an average of 10% at slower crack propagation in the impacted specimen. For a
statically loaded specimen, the percentage areas of transgranular fracture during the
initiation and crack propagation phases were 5 and 2%. respectively. The higher
percentage areas of transgranular fracture during the initiation phase was attributed to
the higher crack velocity and the higher dynamic SIF due to the excessive driving force
generated by the blunt crack tip. This fractography analysis also showed that rapid crack
propagation is always accompanied by transgranular fracture regardless of the
magnitudes of the dynamic SIF and the crack velocity. Unfortunately, no comparison could
be made with the fracture morphology associated with stable crack growth since these
test resultz consisted of only rapid crack propagation events even in the statically loaded
specimen.
The above finding regarding transgranular fracture is consistent with those
observed by others 115,161 and more recently by Nose et al [17] who reported not only
transgranular failure of the A1203 matrix but also SiC whisker failure under rapid crack
propagation, i.e. pop-in, in the SiCw/A1203-matrix composite. In contrast, the fracture
morphology for stable crack growth in 1171 showed the dominance of intergranular failure
accompanied by SiC whisker pull-outs. The SIF for the former, i.e. pop-in fracture or rapid
crack propagation, remained a constant 5 MParm- while the SIF continued to increase to
about 9 MPa-/'m- with increased stable crack extension. In a previous paper 1181, Nose et al
also reported similar findings of a lower SIF of about 4 MPa4-m" associated with pop-in
fracture and a higher SIF varying from 4 to 5.5 MPa4F- associated with subcritical crack
growth in A1203.
Since the percentage area of transgranular fracture is relateti to the instantaneous
dynamic fracture toughness of ceramics and ceramic composites as the above results [14-
181 suggest, this quantity must be measured. This paper reports on a SEM procedure for
estimating the percentage area of transgranular fracture on the fracture surface of
ceramics and ceramic composite.
3

MENfOMGY
The procedure is based on the assumption that the plane of transgranular fracture
will be in the crack plane as Shown in Figure la. Intergranular fracture, on the other hand
is characterized with a tilt in the crack surface as shown by Figure 1(b). Figure 1(a) also
shows that this assumption cannot discriminate the intergranular fracture surface when
it coincides with the dominant crack plane.
The method of approach is to relate the topology of the fracture surface, i.e. the
non- or slightly tilted fracture surfaces whose lengths exceed the average grain size of
the ceramic matrix material. Stereophotogrammetry and profilometry are known
procedures [19] which can be used for this purpose. In this paper, we present a third
procedure which utilizes the line scanning profile of a scanning electron microscope
(SEM).
SEM Scanning Line Profile
The topography of the fracture surface in Figure 2(a) is first recorded by line
scanning of the intensity of the secondary electrons (SE) emitted by normal incidence of
the electron beam in a SEM. The relative variation in the SE intensity or the contrast is
recorded as the variation in the line scanning profile (LSP). This contrast increases with
the tilt of the fracture surface to the normal incident electron beam where a larger
number of SE's are emitted with a steeper tilt as shown schematically in Figure 2(b). The
ratio of SE's from the tilted to normal surfaces follows the secant law [20] with
negfigible change in contrast for tilt. The solid line indicates the SE signal collected by
the SEM detector. The dotted lines represent the local intensity of collection. The
simulated profile of Figure 2(c) is established by summing up the intensity of the signals.
At the intersections of segments, the profile is distorted by spikes which can be filtered
later during the spectral analysis.
Transgranular fracture area can be defined from the LSP record as a constant slope
segment with a length longer- than the average grain size where the contract increases
with an increasing tilt angle. For a ceramic matrix composite with whiskers, the
resultant spikes among the constant contrast in the LSP is also distorted by the whiskers
but can be filtered out in Mhe subsequent analysis.
4

A multit'jde of line scanning profiles (LSP) are therefore taken by usfig a JEOL SEM
T-330 instrument. The LSP's are then scanned by a AST-TURBOSCANIMAC-SCAN and
digitized for subsequent data analysis.
Spectral Analysis
Spectral analysis of the LSP is necessary to eliminate the spikes caused by the
grain boundaries and the distortion caused by whisker/fiber breakages and pullouts. Fast
Fourier transform (FFT) was used to compute the coefficients of a discrete Fourier series
and the frequency distribution of the random process. This spectral analysis also
provides the root mean square of the surface roughness which can be deduced from the
LSP.
Procedure
Figure 3 shows the flow chart for desermining the percentage area of transgranular
failure and the roughness. The first step is to obtain a series of LSP's under the same
contrast setting at the prescribed region. As mentioned previously, the LSP are scanned
by an AST-TURBOSCAN and digitized by the MAC-SCAN program which locates the Y-
coordinate in contrast setting along the X-coordinate of the scanning distance. The
program, LSP-SLOP then transforms the X-Y coordinate data file and calculates the
percentage area of transgranular failure. An input parameter to the LSP-SLOP program is
the length in the X-coordinate which must be excluded in order to eliminate material
inhomogeneities. such as fiber breakage, and unusual contrast. Another input length
parameter is the average grain size of the ceramic matrix which is needed to detect
segments of transgranular fracture. LSP-SLOP thus scans the lengths of all horizontal
and tilted line segments, which exceeds this average grain size, and computes the
percentage area of transgranular fracture. Details of the procedure and the softwares
involved are provided in [211.
QUANTITATIVE FRACTOGRAPHY OF AJ203 And SiC,/A203 COMPOSITE
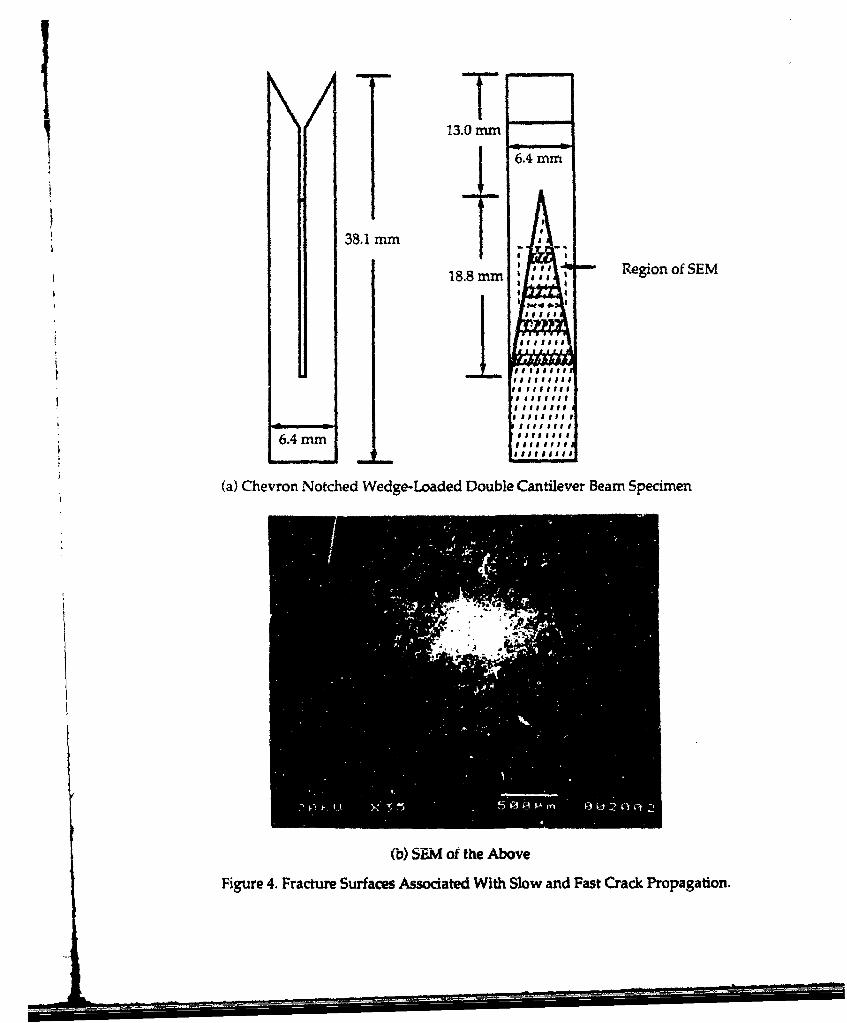
The specimen used to demonstrate the utility of this procedure is a wedge-loaded
double cantilever beam (WL-DCB) specimen with a long chevron notch as shown
schematically in Figure 4(a). The inherent rigidity of the WL-DCB specimen plus the long

chevron notch makes it ideal for studying stable crack growth followed by crack jump
with run-arrest under a slow displacement controlled loading. The latter is identified by
a distinct shade in the texture of the fracture surface as shown by the SEM photo in Figure
4(b),
LSP Versus SEM Photos
Figure 5 shows a SEM photograph of a A12 03 with a superimposed LSP along the
center line. A visual comparison of the SEM record and the LSP shows that the variation
in intensity of the LSP closely follows the variation of the surface topology as deciphered
from the photograph. Figure 6 shows a similar record for the SiCw/A1203 composite. The
whiskers and grain boundaries in Figure 6 appear brighter than the matrix grain surfaces
due to the higher conductivity of SiC and the static charges along the grain boundaries.
The LSP in Figure 5 contains less spikes than those of Figure 6 due to the lack of whiskers
in the former. If the peaks in the LSP's are removed, then the LSP in Figure 5 will be even
closer to the real surface profile. These peaks are removed by the spectral analysis as
mentioned previously. In all the SEM records studied, large transgranular fracture area
exhibited a constant slope, which is nearly equal to zero in Figures 5 and 6. and the
surrounding grain boundaries had little effact on the intensity of SE.
Processing LSP
Since the brightness control on the SEM has no effect on the contrast, it has no
influence on the LSP. Figure 7 illustrates this point where each LSP was taken under
100OX magnification with identical setting of the contrast level. The material and type
of fracture, i.e. stable versus rapid crack growth are denoted in the captions. By changing
the brightness level, the LSP will move up or down on the SEM screen without altering the
contrast level and thus many LSPs can be shown in one record as shown in Figure 7. On
the other hand, Figure 8 shows the scanned and digitized individual LSP's which are
processed by the LSP-SLOP and the FFT programs. A comparison of Figures 7 and 8 show
that the LSP's of a 25% SiCw/AI203 composite have more spikes but also exhibits a
smoother profle. Apparently, the LSP profile of A120 3 is much rougher than that of a 25%
SiCw/A1203 composite.
h6

Percentage Areas of Transgranular Fracture
Percentage area of transgranular fracture is calculated by the program LSP-SLOP.
Each processed LSP record provides a percentage area of transgranular fracture and the
root mean square of the roughness. Slight differences in the geometry and the loading
history are the probable cause for the differences, as shown in Table 1, between the two
specimens. The SEM photographs of the two 25% SiCw/A12 0 3 composite specimens shows
that the fractured surface of the first specimen is more distinct and has smoother rapid
crack growth zones than those of the second one. The slightly higher percentage area of
transgranular fracture in the first specimen is due to this slight difference in fracture
morphology. The percentage areas of transgranular fracture were obtained visually by
examining ten SEM records at 5000X magnification or two SEM records at 100OX
magnification and identifying the transgranular fracture area. This process is easier for
alumina than for SiCwtAI203 composite. The percentage areas of transgranular fracture
in AJ2 03 in Table I is very close to that obtained previously [14].
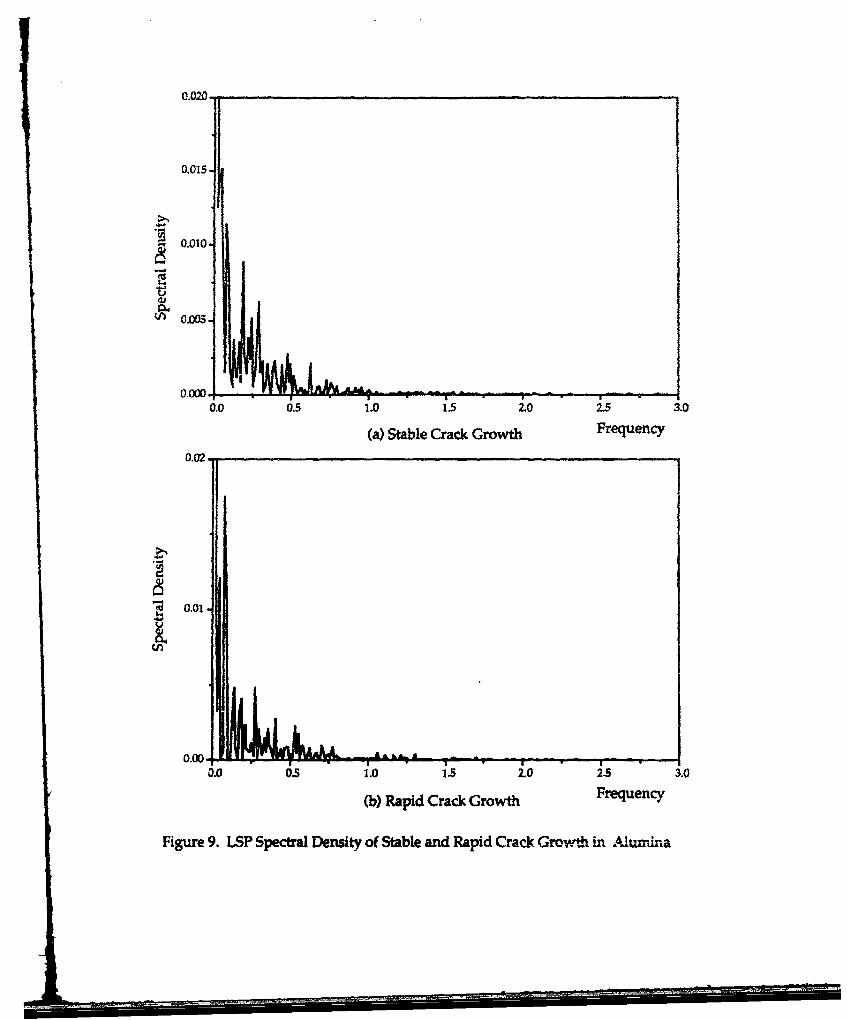
Roughness
Spectrum analysis was carried out by the FFT program. The LSP spectral density
plots of stable and rapid crack growth regions in the A12 0 3 and SiCw/A1203 composite are
shown in Figures 9 and 10. The spectral frequencies varied, but concentrated in the lower
which range varied from approximately 0.5 (lUrm) to a very low frequency. This frequency
corresponds to one grain size of 2j•m to 10Lm or higher.
Distortion of the LSP due to the edge effect and fiber perturbations lies in the
frequency range of 1.0 (llfm) and are higher since the whisker diameter is about 0.5;rm.
The length of the distorted intervals range from 0.51gm to li.m if the orientation of the
fibers is considered. The filtered frequency ranges from 1.0 (l4Lm) and above. In
contrast, A1203 has a lower intensity of distortion when the edge distortion is around
0.41Lm or lower and its effect on the whole spectral density area can thus be neglected.
As described previously, the area under the LSP spectral density distribution is
proportional to the root-mean-square of the profile. To minimize signal distortion, a
band-pass filter was inserted to purge the allasing frequencies prior to calculating this
7

area. Once the areas are obtained, a correction factor is muttiplied to find the root-
mean-square roughness. This 'correction' factor can be obtained by comparing the LSP's
of a polished surface with the measured roughness data obtained by a Federal 400
profilometer. For A1203 material, the roughness ranges from 0.30-0.32M•m in the stanole
crack region and 0.23 - 0.25Mm in the rapid crack growtn region. For the SiCw/Al2 03
composite, it is from 0.24 . 0.25M.m in the stable crack region and 0.20 - 0.21gm in tne
rapid crack growth region.
This procedure based on spectral density provides a technique of noncontact
profilometry. It has two main advantages. First, specimens will not be scratched by the
diamond probe used in conventional roughness measurement Second, this procedure is not
limited by the height of crack deflection of probe which has its range of stroke and height
deviations.
C -NCLUSKM
1. A SEM procedure for quantifying the percentage area of transgranular fracture and
roughness was established.
2. The percentage area of transgranular fracture in A12 0 3 and SiCw/Al203 composite in
the rapid crack growth region were lareger than those in the stable crack growth
region.
3. The fractured surfaces of SiCw/A1203 composite are smoother than the
corresponding surfaces in A12 0 3 .
4. LSP spectral analysis showed that crack deflection was more prevalent in the stable
crack growth region.
8

A0040VAEOJGEM4Erl
This research was supported by the Office of Naval Research Contract No. 0004-87-
K0326. The authors express gratitude to Drs. Yapa Rajapakse and Steve Fishman for
their patience and encouragemer. during the course of this investigation.
1. Kobayashi, T. and Daily. J.W., "Dynamic Photoelastic Determination of the a-KRelation for 4340 Alloy Steel," Crack Arrest Methodology and Applications. G.T.Hahnard, MF. Kanninen (eds). ASTM STP 711. 1980, pp. 189-210.
2. Kalthoff. J.F., Beinert, J.. Winkler, S. and Klemm, W., *Experimental Analysis ofDynamic Effects in Different Crack Arrest Test Specimens," G.T. Hahn and M.F.Kannin, (ads), ASTM STP 711, 1980. 109-127.
3. Daily, J.W., "Dynzamic Photoelastic Studies of Fracture." Experimental Mechanics. Vol.19, 1979, pp. 349-361.
4. Kobayashi, A.S.. Ramulu, M., Dadkhah, M.S., Yang, K.H., and Kang. B.S.-J., "DynamicFracture Toughness,* Intl. J- of Fracture, 30, 1986. pp. 275-285.
5. Kobayashi, A.S., Emery, A.F. and Liaw, B.M., "Dynarmic Toughness of Glass," FractureMechanics of Ceramics. Vol. 6 ads R.C. Bradt, AG. Evans, D.P.H. Hasselman and F.F.Lange, Plenum Press, 1983, pp 47-&6.
6. Kobayashi. A.S., Emery, A.F., and Law B.M., "Dynamic Fracture Toughness of ReactionBonded Silicon Nitrode," J. American ".oramic Soc., Vol. 66, No. 2, 1983, pp. 151-155.
7. Liaw, B.M., Kobayashi, A.S., and Emery, A.F., 'Effect of Loading Rates on DynamicFracture of Reaction Bonded Silico, Nitride," Fracture Mechanics: Seventh VolumeASTM STP 905, 1986, pp.'35-107.
8. Kobayashi, AS., Yang, K.-H. and Ermy, A F.. "Dynamic Fracture Testing of Alumina,"Impact Loading and Dynamic Behavior of Materials, C.Y. Chiem, H.-D. Kunze and L.W.Meyer (eds.) DGB Informationsgeseltschaft mgH, 1988, pp. 113-119.
9. Yang, K.-H., Kobayashi, A.S. and Emery, A.F., "Dynamic Fracture Characterization ofCeramic Matrix Composites," Journal de Physique, Colloque C3, suppl4ment au No. 9,1988, C3-223-230.
10. Yang, K.-Y., Kobayashi, A.S. and Emery, A.F., "Effects of Loading Rates andTemperature on Dynamic Fracture of Ceramics and Ceramic Matrix Composites,"American Ceramic Society Ceramic Materials and Components for Engines, V.J.Tannery and M.K. Ferber (eds.), 1989, pp, 766-775.
11. Kobayashi, A.S. and Yang, K.4L, "A Hybrid Technique for Hlghi-Teinperature DynamicFracture Analysis,* Proc. of lsmnartiotal Conflrence on Advanced MeasurementTechniques, London, August 25-27. 1987.
12. Yang, K.H. and Kobayashi, A.S.. "An Experimentai-Numerical Procedure for HighTemperature Dynamic Fracture Analysis," Computational Mechanics '86, ed. S.N.Atluri and G. Yagawa, Springer-Velag, 1986, pp 48.v.1-8.
13. Jenkins, M.G., Kobayashi, A.S., White, K.W. and Bradt, R.C., Craclc Initiation andArrest in SiC Whisker/A1203 Matrix Ceramic/Ceramic Composites," Journal ofAmerica Ceramic Society, Vol. 70. No. 6, June 1987, pp. 393-395.
14. Yang, K.H. and Kobayashi, A.S., 'Dynamic Fracture Responses of Alumina and TwoCeramic Composites," to be published In Journal of American Ceramic Society.
15. Mechotsky, J.J. and Freiman, S.W., "Fractographic Analysis at Delayed Failure inCeramics." Fractography and Materials Science. eds. I.N. Gilbertson and R.D. Zipp,ASTM STP 733, 1981, pp 246-258.
16. Heal"y, J.T. and Mecholsky. JJ., "Scanning Electron Microscopy Techniques and TheirApplication to Failure Analysis of Brittle Materials," Fractography of Ceramic andMetal Failures, ed. J.J. Mecholsky and S. R. Powell. ASTM STP 827, 1984, pp 157-181.
17. Nose, T., Uski, M., Fujii, T. and Kubo, H., "Toughening Behavior in SiC WhiskerReinforced AJ203 Ceramics." a paper presented at Ist International Ceramic Science& Technology Congress, Oct 31-Nov. 3, 1989, Anaheim. CA.
18. Nose, Tetsuro and Fujil. Toshimitsu, 'Evaluation of Fracture Toughness for CeramicMaterials by a Single-Edge-Precracked-Beam Method," Journal of the AmericanCeramric Society. Vol. 71, No. 5, pp 328-333, June 1988.
19. Underwood, E.E., "Recent Advances in Quantitative Fractography," FractureMechanics: Microstructure and Mlcromechanislms. eds. S.V. Nair, J.K. lien, R.C. Batesand 0. Buck, ASM International, 1969. pp 87-109.
20. Newbury, D.E. and Yokowitz, H., "Studies of the Distribution of Signals in SEM/EPMAby Monte Carlo Calculations in Electron Probe Microanalysis and Scanning ElectronMicroscopy. National Bureau of Standards, 1976, pp. 15- 43.
21. Yang, Wein-Jce. "Quantitative Fractography Study of Brittle Materials," a MSMEthesis submitted to the University of Washington, 1990.
ASK/oa/7!1 1/190
10

I
Table I. Percentage Areas of Transgranular Fracture
Procedure Crack GrowtthStable Rapid
This ProcedureA120 3
Specimen 1 (Region 1) 10% 17%Specimen 2 (Region 2) 12% 15%
Visual ProcessingSpecimen #1 13% 19%
This Procedure25% SiCwiAI2 03
Specimen #2 42% 73%Specimen #5 43% 58%
Visual Processing25% SiCw/Al203
Specimen #2 37% 73%
11

S~ Crack front
(a) Trans-and Intergranular Fracture
0 : Tilt angle
- Crack front
(b) Intergranular Fracture
Figure 1. Crack Propagation in Matrix Grain

!I
(a) Idealized 2-D Fracture Surface
/,•IT Contrast peak due to edge
7 -
bed secondary electron signal Contrast due to slope
(b) Secondary Electron Emission
(c) Simulated Fracture Surface
Figure 2. Fracture Surface Simulation by Secondary Electron Emission Profile
9'

Chevron Notched Fracture Surface
MAC-SCAN programPie iu Fl
Polished SurfaceF• Prga •-ID ne.rngranularE ogns Ratio Analysis Program "
Output Of
Spectrum andRougF . C o o
Figure 3. Flow Chart of Procedure
TT13.0 mm
6.4 mm
38.1 mm
t 8. Region of SEM18.8mm-
iit
|lIffllol
. a.1ca111t.
.a ateill|l
(a) Chevron Notched Wedge-Loaded Double Cantilever Beam Specimen
Co) SEM of the Above
Figure 4. Fracture Surfaces Associated With Slow and Fast Crack Propagation.

(a) Stable Crack Growth
.5
(b) Rapid Crack Growth
Pigure 5. SEM and LSP Traces of Alumina

(a) Stable Crack Growth
(b) Rapid Crack Growth
Figure 6. SEM arnd LSP Traces of SiC v/ AýO3 Composite

(a) Stable Crack Growth
(b) Rapid Crack Growth
Figure 7. Line Scanning Profiles of Stable and RapidCrack Growth in Alumina

15-
10~
X Coordinate (Pm)(a) Stable Crack Growth
20-
5s
10.
(U S
>4
X Coordinate Wp)(b) Rapid Crack Growth
Figure 8. Line Scantning Proffies of Stable and RapidCrack Growth in SiCawAl 2O3 Compoite
0.010
o .005.
0.0000.0 0.5 i.0 ;.5 2.0 is 3.0
(a) Stable Crack Growth Frequency
0.02.
~0.01.
0.00.11O0.0 Os 1.0 1.5 2-0 2.5 3.0
(b) Rapid Crack Growth Frequency
Figure 9. ISP Spectral Density of Stable and Rapid Crack Grow.th in Al1um-ina

0.02.
0.01
0.00.4Xja4 &qm -
0.0 os 1.0 1.5 .o 25 3.o
(a) Stable Crack Growth Frequency
0.02
0.01
0.000.0 0.5 ;.0 1.5 2.0 2s 3.0
(b) Rapid Crack Growth Frequency
Figure 10. 1SP Spectral Density of Stable and Rapid CrackGrow+th in SiC 'AI 2 03 Composite
SIMVPI:TY CLXSSIPP1CATION Of T141S PýAGC ("an.~ Dot* aotteod) _________________
I READl ISTRUMO?4SREPOR DCU14ENTATION PAGE BEFRECOMPJLETIGFORM
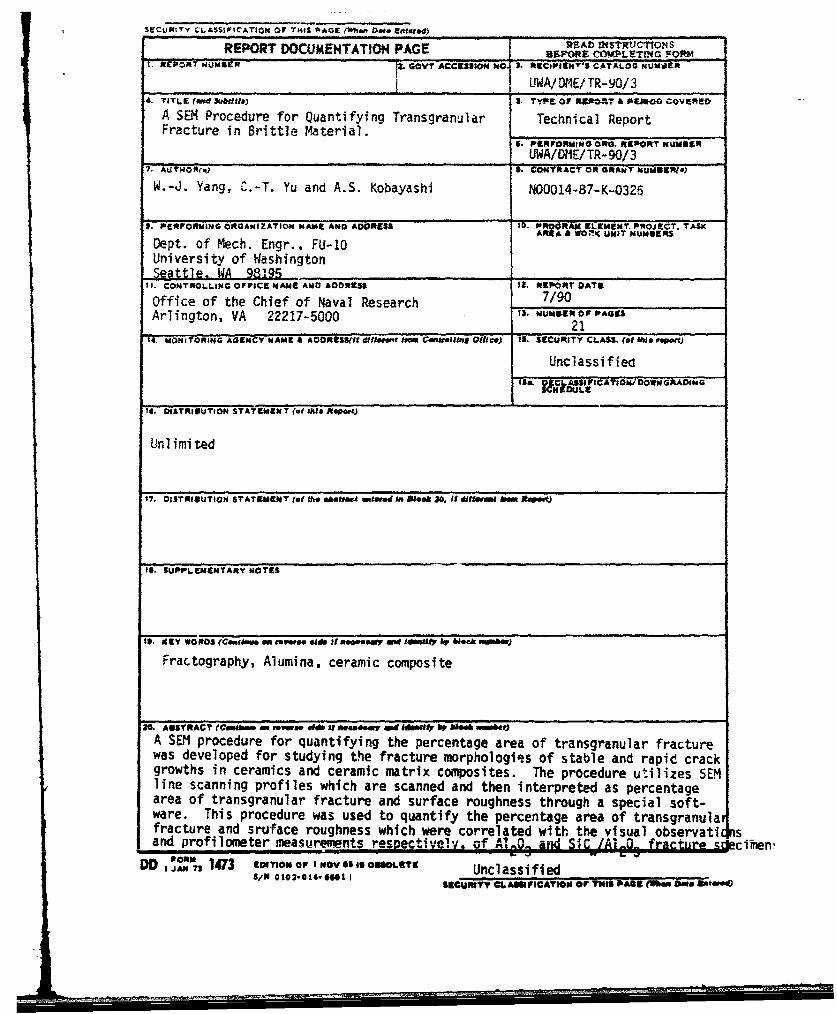
71UWA/ D!IE/ TR-90/ 34. TITL (&-W u~fia)S, TYPE Of R9004T 4 *9800 oveRED
A SEM Procedure for Quantifying Transgranular Technical Report
$- PERFORMING ORI. REPORT uUUSR't______________________________________ UWA/OIIE/ TR- 90/3
7. AUTWOR~a) 1. CONRA? ON GRANT uUmagive)
W. -J. Yang, C.-T. Yu and A.S. Kobayashi N00014-87-K-0326
9. PERFORtiING ORGANIZATION NAME AND ADDRESS 10. PROGRAM E5LEENT, PROJECT. TASXARE, a Wo' U.NIT NUMBERS
Dept. of Mech. Engr., FUJ-10University of Washington5RAttle. IWA 98195 _____________11. CONTROLLING OFFICE NAME AND ADDRES MS REPOR1T OATE
Office of the Chief of Naval Research 7/90Arlington, VA 22217-5000 21 UME P AE
1,1. MONiTfoRiNGr A0gEWCy NAME a AooReSS(I1 dollmete how C..u.IbW offce) IL. SECURITY CLASS, (of hde "P.n)
Uncl1ass if iea
M6 O4STRINUTION STATEMENT falt lAS. Rýl)
Unlimited
M7 DISTRIOUTION STATEMENT (of th* "&&act iland toAffa 1..* It 011enmI hem Mopet)
If. SUPPLEMENTARY NOTES
IS. KIEV WORDS (Cft1i*M* GM Mean. Otd. it 000 med lMWUb MO& 6 6804k IWA6)
Fractography, Alumina, ceramic composite
M0 A5STRACT r(uslM.. - ne'mao alid It 110066"W 40d ddIRUM 6? 6104k XM061A SEN procedure for quantifying the percentage area of transgranular fracturewas developed for studying the fracture morphologies of stable and rapid crackgrowths in ceramics and ceramic matrix composites. The procedure utilizes SEMline scanning profiles which are scanned and then interpreted as percentagearea of transgranular fracture and surface roughness through a special soft-ware. This procedure was used to quantify the percentage area of transgranulafracture and sruface roughness which were correlated with tevsa bevtland profilometer measurements resoectively 2f almj n jA rcueSclinen'
DD ,OAM"7 1473 EDTIm-oP r Inov soIS OU@LETE Unclassified
SECUOtTT CL AINIPICATMIOM OP THIS PAGE (WhO DO#. Epiw0"