C. Kurama, Ph.D., RE. - PCI · PDF fileThis paper investigates a “hybrid” precast...
24
Hybrid Post-Tensioned Precast Concrete Walls for Use in Seismic Regions Yahya C. Kurama, Ph.D., RE. Assistant Professor Civil Engineering and Geological Sciences University of Notre Dame Notre Dame, Indiana Recent research has shown that post-tensioned precast concrete lateral load resisting walls that do not emulate the behavior of monolithic cast-in-place reinforced concrete walls have desirable seismic characteristics such as a sell-centering capability and an ability to undergo nonlinear lateral displacements with little damage. The biggest disadvantage of these walls under earthquake loading is an increase in the lateral displacements as a result of small energy dissipation. This paper investigates a “hybrid” precast wall system that uses mild steel reinforcement in addition to the post-tensioning steel for flexural strength and inelastic energy dissipation. An analytical parametric study is conducted to compare the expected seismic behavior of a series of prototype walls with different amounts of mild steel and post-tensioning steel. Nonlinear dynamic time history analyses of the walls indicate that the use of mild steel reinforcement results in a considerable reduction in the lateral displacements of the walls under earthquake loading, particularly for walls in regions of high seismicity and with shorter periods of vibration. The results of these analyses are used to present preliminary design implications for the use of hybrid post-tensioned precast walls in seismic regions. I n recent years, a significant amount of research has been conducted on precast concrete wall systems for seismic regions of the United States as a part of the PRESSS (PREcast Seis mic Structural Systems) research pro gram 1 - 3 and other research programs. 4 One of the precast wall systems that has successfully emerged from the PRESSS program is the unbonded post-tensioned wall system. As an example, Fig. 1(a) shows the elevation and cross section of a six story wall, which is constructed by post-tensioning precast wall panels across horizontal joints using high strength post-tensioning bars that are not bonded to the concrete.” 2 The post-tensioning (PT) bars are placed inside oversize ducts that are not grouted, and they are anchored only at the roof and at the foundation. The 36 PCI JOURNAL
Transcript of C. Kurama, Ph.D., RE. - PCI · PDF fileThis paper investigates a “hybrid” precast...

Hybrid Post-TensionedPrecast Concrete Walls forUse in Seismic Regions
Yahya C. Kurama, Ph.D., RE.Assistant ProfessorCivil Engineering andGeological SciencesUniversity of Notre DameNotre Dame, Indiana
Recent research has shown that post-tensioned precast concrete lateralload resisting walls that do not emulate the behavior of monolithiccast-in-place reinforced concrete walls have desirable seismiccharacteristics such as a sell-centering capability and an ability toundergo nonlinear lateral displacements with little damage. Thebiggest disadvantage of these walls under earthquake loading is anincrease in the lateral displacements as a result of small energydissipation. This paper investigates a “hybrid” precast wall system thatuses mild steel reinforcement in addition to the post-tensioning steelfor flexural strength and inelastic energy dissipation. An analyticalparametric study is conducted to compare the expected seismicbehavior of a series of prototype walls with different amounts of mildsteel and post-tensioning steel. Nonlinear dynamic time historyanalyses of the walls indicate that the use of mild steel reinforcementresults in a considerable reduction in the lateral displacements of thewalls under earthquake loading, particularly for walls in regions ofhigh seismicity and with shorter periods of vibration. The results ofthese analyses are used to present preliminary design implications forthe use of hybrid post-tensioned precast walls in seismic regions.
In recent years, a significant amountof research has been conducted onprecast concrete wall systems for
seismic regions of the United States asa part of the PRESSS (PREcast Seismic Structural Systems) research program1-3and other research programs.4One of the precast wall systems thathas successfully emerged from thePRESSS program is the unbondedpost-tensioned wall system.
As an example, Fig. 1(a) shows theelevation and cross section of a sixstory wall, which is constructed bypost-tensioning precast wall panelsacross horizontal joints using highstrength post-tensioning bars that arenot bonded to the concrete.”2Thepost-tensioning (PT) bars are placedinside oversize ducts that are notgrouted, and they are anchored only atthe roof and at the foundation. The
36 PCI JOURNAL
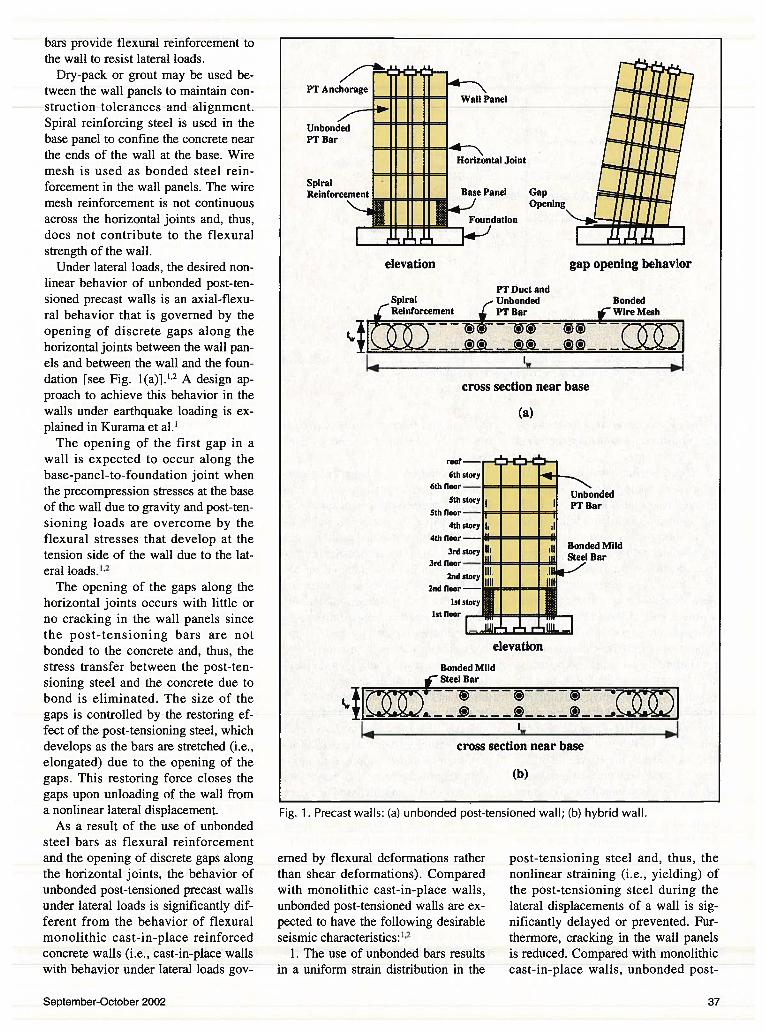
bars provide flexural reinforcement tothe wall to resist lateral loads.
Dry-pack or grout may be used between the wall panels to maintain construction tolerances and alignment.Spiral reinforcing steel is used in thebase panel to confine the concrete nearthe ends of the wall at the base. Wiremesh is used as bonded steel reinforcement in the wall panels. The wiremesh reinforcement is not continuousacross the horizontal joints and, thus,does not contribute to the flexuralstrength of the wall.
Under lateral loads, the desired nonlinear behavior of unbonded post-tensioned precast walls is an axial-flexural behavior that is governed by theopening of discrete gaps along thehorizontal joints between the wall panels and between the wall and the foundation [see Fig. 1(a)].1’2 A design approach to achieve this behavior in thewalls under earthquake loading is explained in Kurama et al.1
The opening of the first gap in awall is expected to occur along thebase-panel-to-foundation joint whenthe precompression stresses at the baseof the wall due to gravity and post-tensioning loads are overcome by theflexural stresses that develop at thetension side of the wall due to the lateral loads.12
The opening of the gaps along thehorizontal joints occurs with little orno cracking in the wall panels sincethe post-tensioning bars are notbonded to the concrete and, thus, thestress transfer between the post-tensioning steel and the concrete due tobond is eliminated. The size of thegaps is controlled by the restoring effect of the post-tensioning steel, whichdevelops as the bars are stretched (i.e.,elongated) due to the opening of thegaps. This restoring force closes thegaps upon unloading of the wall froma nonlinear lateral displacement.
As a result of the use of unbondedsteel bars as flexural reinforcementand the opening of discrete gaps alongthe horizontal joints, the behavior ofunbonded post-tensioned precast wallsunder lateral loads is significantly different from the behavior of flexuralmonolithic cast-in-place reinforcedconcrete walls (i.e., cast-in-place wallswith behavior under lateral loads gov
roof—
6th story6th floor
PT Bar
4th story
________________
Unbonded
5th floor— I
r5th
4th floor — IIBonded Mild
3rd story IllSteel Bar
3rd floor—’
2nd story :Ziid floor —
_________________
Iststory I I I i,I.1st floor .
1IIj
post-tensioning steel and, thus, thenonlinear straining (i.e., yielding) ofthe post-tensioning steel during thelateral displacements of a wall is significantly delayed or prevented. Furthermore, cracking in the wall panelsis reduced. Compared with monolithiccast-in-place walls, unbonded post-
elevation gap opening behavior
PT Duct and
cross section near base
(a)
IiiDr, r rLJelevation
Bonded MildSteel Bar
cross section near base
(b)
Fig. 1. Precast walls: (a) unbonded post-tensioned wall; (b) hybrid wall.
erned by flexural deformations ratherthan shear deformations). Comparedwith monolithic cast-in-place walls,unbonded post-tensioned walls are expected to have the following desirableseismic characteristics:”2
I. The use of unbonded bars resultsin a uniform strain distribution in the
September-October 2002 37

HYBRID PRECAST SYSTEMS
tensioned precast walls can undergolarge nonlinear lateral displacementswith little damage.
2. The restoring force provided bythe post-tensioning steel results in aself-centering capability of the wallsupon unloading (i.e., an ability to return to the original undisplaced position upon unloading from a large nonlinear displacement). This means thatthe residual (i.e., permanent) lateraldisplacements of an unbonded post-tensioned wall at the end of a severeearthquake are expected to be small.
The most significant disadvantageof unbonded post-tensioned precastwalls under seismic loading is that theamount of inelastic energy dissipationis small since the yielding of the post-tensioning steel is delayed or prevented due to the use of unbondedbars. As a result, the lateral displacements of an unbonded post-tensionedwall during an earthquake can be considerably larger than the displacements of a comparable monolithiccast-in-place reinforced concretewall.”4’5
In order to increase the amount ofenergy dissipation, the use of supplemental metallic-yield dampers alongvertical joints between two or morewalls has been investigated experimentally by Priestley et al.3 and analytically by Perez.6 The use of friction
dampers and viscous fluid dampers inthe walls was investigated by Kurama.4’5
As an alternative, this paper investigates a “hybrid” precast wall systemthat uses bonded mild steel reinforcement crossing the horizontal joints, inaddition to the unbonded post-tensioning steel. First, an analytical parametric investigation is conducted on thenonlinear behavior of twelve prototype walls with different amounts ofmild steel and post-tensioning steelunder combined gravity and lateralloads. Then, a series of nonlinear dynamic time history analyses are carried out to investigate the effect of themild steel on the expected behavior ofthe walls under earthquake loading.
Walls designed for regions withhigh seismicity (e.g., coastal California), as well as for regions with moderate seismicity (e.g., Boston, Massachusetts), are considered. The effectof the number of stories on the behavior of the walls is investigated. Basedon the results from the parametricanalyses, preliminary recommendations for the use of the walls as primary lateral load resisting systems inseismic regions are provided. Theserecommendations may be useful asbackground in the development ofseismic design guidelines for hybridprecast walls.
As an alternative to using supplemental energy dissipation devicessuch as metallic-yield, friction, andviscous fluid dampers, it is also possible to reduce the seismic displacements of unbonded post-tensionedprecast walls by using bonded deformed mild steel reinforcement crossing the horizontal joints, particularlythe base-panel-to-foundation joint asshown in Fig. 1(b). Properly designedand detailed mild steel reinforcementwill yield in tension and compressionduring the cyclic lateral displacementsof a wall, thus dissipating energy.
The concept of combining post-tensioning steel for flexural strength andself-centering with mild steel for inelastic energy dissipation has beenpreviously applied to beam-to-columnjoints in precast concrete lateral loadresisting frames at the National Institute of Standards and Technology(NIST)7-9and at the University of California at San Diego.3”°
As an example, Fig. 2 shows a hybrid precast frame beam-column sub-assemblage with multi-strand post-tensioning tendons and mild steel barsused through the beam-to-columnjoints. The mild steel bars are locatednear the top and bottom of the beamsin order to maximize the nonlinearstrains in the bars and, thus, theamount of energy dissipated during anearthquake.
The post-tensioning tendons and themild steel bars are placed inside ductspreformed in the beam and columnmembers as described by Stone et al.7and Stanton et al.8 Each beam has arectangular cross section at its endsand, near midspan, it has a trough atthe top and bottom. During construction, the mild steel bars are placed inthe trough and passed through the ductsat the end of the beam, which alignwith matching ducts in the column.
The bond between the post-tensioning tendons and the concrete is prevented inside the column and over acertain length at the ends of the beamsto delay the yielding of the tendonsand to reduce the cracking of the concrete. Similarly, the bond between themild steel bars and the concrete maybe prevented over a certain length at
Beam Beam
Fig. 2. Hybrid precast frame beam-column subassemblage.
38 PCI JOURNAL
the ends of the beams (by wrappingthe bars) to prevent fracturing of themild steel and reduce cracking of theconcrete during the deformations ofthe bars in tension. Adequate anchorage is provided to the mild steel barsby grouting the ducts inside the beamsand the column.
Previous experimental and analytical investigations3’7-’0of systems sirnilar to the system in Fig. 2 have shownthat hybrid precast frames possess excellent seismic characteristics, including self-centering capability and significant energy dissipation. Theresults of these investigations haveled to the successful development andapplication of guidelines for the design of hybrid precast frame structuresfor use in seismic regions.”13 Similarseismic design guidelines and recommendations are needed for hybrid precast walls.
In the hybrid precast wall system investigated in this paper, most of themild steel reinforcement is placed nearthe two ends of the wall [see Fig. 1(b)]similar to the placement of the mildsteel reinforcement near the top andbottom of the beams in Fig. 2. Ascompared with monolithic cast-in-place reinforced concrete walls withsimilar flexural strength and stiffness,the amount of mild steel that would beneeded in a hybrid precast wall issmaller because a portion of the wall’sresistance to lateral loads is providedby the post-tensioning steel.
Similar to the construction of thehybrid precast frame system describedabove, the mild steel bars are passedthrough preformed ducts in each wallpanel, which align with matchingducts in the other panels and the foundation. The mild steel reinforcement isanchored to the foundation and thewall panels by grouting the ducts, andis extended a sufficient height abovethe base of the wall, after which it maybe terminated [Fig. 1(b)].
In order to reduce cracking of theconcrete and prevent fracturing of themild steel, the bond between the steeland the concrete may be preventedover a certain height above the base-panel-to-foundation joint and at thepanel-to-panel joints by wrapping thereinforcement in a manner similar tothat shown in Fig. 2.
ANALYTICAL MODELING
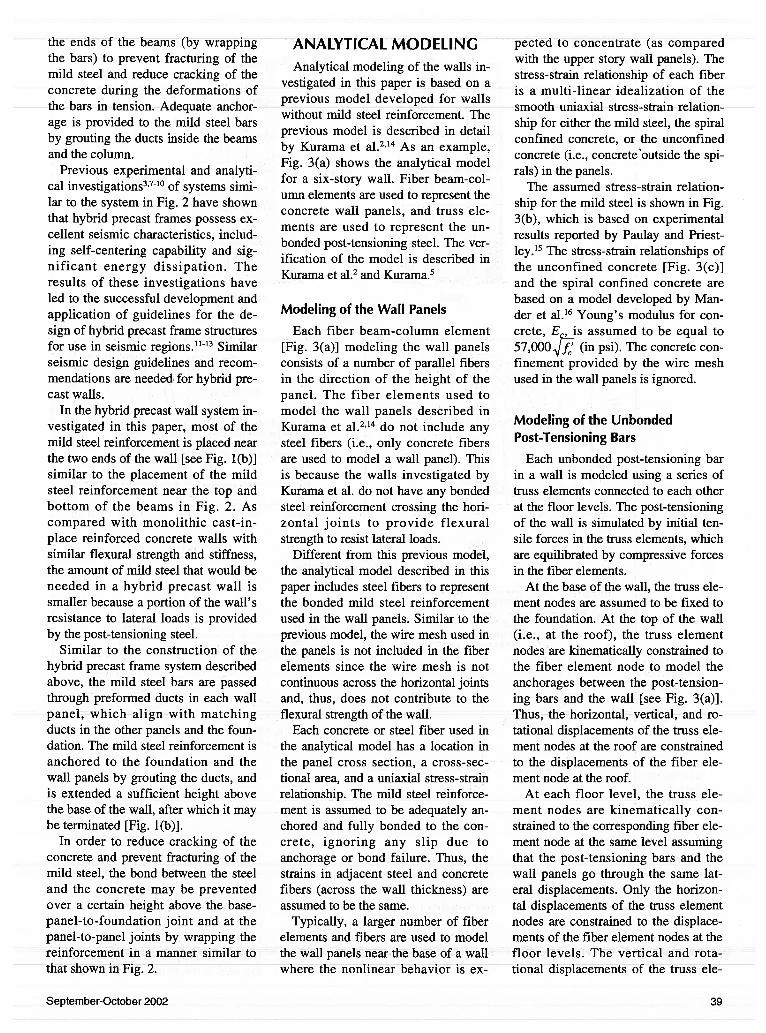
Analytical modeling of the walls investigated in this paper is based on aprevious model developed for wallswithout mild steel reinforcement. Theprevious model is described in detailby Kurama et al.2”4 As an example,Fig. 3(a) shows the analytical modelfor a six-story wall. Fiber beam-column elements are used to represent theconcrete wall panels, and truss elements are used to represent the Un-bonded post-tensioning steel. The verification of the model is described inKurama et al.2 and Kurama.5
Modeling of the Wall Panels
Each fiber beam-column element[Fig. 3(a)] modeling the wall panelsconsists of a number of parallel fibersin the direction of the height of thepanel. The fiber elements used tomodel the wall panels described inKurama et al.2”4 do not include anysteel fibers (i.e., only concrete fibersare used to model a wall panel). Thisis because the walls investigated byKurama et al. do not have any bondedsteel reinforcement crossing the horizontal joints to provide flexuralstrength to resist lateral loads.
Different from this previous model,the analytical model described in thispaper includes steel fibers to representthe bonded mild steel reinforcementused in the wall panels. Similar to theprevious model, the wire mesh used inthe panels is not included in the fiberelements since the wire mesh is notcontinuous across the horizontal jointsand, thus, does not contribute to the
.-.1 .-.c÷i-. 111Is,,AuraI L1L’1i5L.L1 ‘.ii Wa11.
Each concrete or steel fiber used inthe analytical model has a location inthe panel cross section, a cross-sectional area, and a uniaxial stress-strainrelationship. The mild steel reinforcement is assumed to be adequately anchored and fully bonded to the concrete, ignoring any slip due toanchorage or bond failure. Thus, thestrains in adjacent steel and concretefibers (across the wall thickness) areassumed to be the same.
Typically, a larger number of fiberelements and fibers are used to modelthe wall panels near the base of a wallwhere the nonlinear behavior is ex
pected to concentrate (as comparedwith the upper story wall panels). Thestress-strain relationship of each fiberis a multi-linear idealization of thesmooth uniaxial stress-strain relationship for either the mild steel, the spiralconfined concrete, or the unconfinedconcrete (i.e., concrete ‘outside the spirals) in the panels.
The assumed stress-strain relationship for the mild steel is shown in Fig.3(b), which is based on experimentalresults reported by Paulay and Priestley.’5 The stress-strain relationships ofthe unconfined concrete [Fig. 3(c)]and the spiral confined concrete arebased on a model developed by Mander et al.’6 Young’s modulus for concrete, E, is assumed to be equal to57,000 [j (in psi). The concrete confinement provided by the wire meshused in the wall panels is ignored.
Modeling of the UnbondedPost-Tensioning Bars
Each unbonded post-tensioning barin a wall is modeled using a series oftruss elements connected to each otherat the floor levels. The post-tensioningof the wall is simulated by initial tensile forces in the truss elements, whichare equilibrated by compressive forcesin the fiber elements.
At the base of the wall, the truss element nodes are assumed to be fixed tothe foundation. At the top of the wall(i.e., at the roof), the truss elementnodes are kinematically constrained tothe fiber element node to model theanchorages between the post-tensioning bars and the wall [see Fig. 3(a)].Thus, the horizontal, vertical, and rotational displacements of the truss element nodes at the roof are constrainedto the displacements of the fiber element node at the roof.
At each floor level, the truss element nodes are kinematically constrained to the corresponding fiber element node at the same level assumingthat the post-tensioning bars and thewall panels go through the same lateral displacements. Only the horizontal displacements of the truss elementnodes are constrained to the displacements of the fiber element nodes at thefloor levels. The vertical and rotational displacements of the truss ele
September-October 2002 39

0 0.004 0.008strain
(c)
ment nodes at the floor levels are notconstrained since the post-tensioningbars are not bonded to the concrete.
The stress-strain relationship of thetruss elements is a bilinear idealizationof the smooth stress-strain relationshipassumed for the post-tensioning steel,as shown in Fig. 3(d). The yield
strength of the truss elements is assumed to be equal to the linear limitstress (i.e., stress at the limit of proportionality) of the post-tensioningsteel stress-strain relationship, frn,.
The linear elastic stiffness of thetruss elements is assumed to be equalto Young’s modulus for the post-ten-
sioning steel, E. The post-yield stiffness of the truss elements, is determined by fitting a straight line tothe nonlinear portion of the post-tensioning steel stress-strain relationshipbetween the yield stress, f, and theultimate (i.e., peak) stress, f,,,. Sincethe steel is not bonded to the concrete,
L:jwall
node 1 IIp1 Ii
IIP I p I
I II I\
pP pp
-. - -- _ trusselement
pP p p
kinematicconstraint r - -
—
pP III pP ii
II
pP iiII IIpi IIp’ pp tlberelement
IIpI iipI iiI I
model(a)
7
6 f= 6.0 j L — Compression
4415 ksi
In‘n3 tensile strength and
stiffness2 for wails with mild
steel [see Fig. 3(e)]1
0
-——--
-1 .
0.08 -0.008 -0.004
Ilksi=6.895MPaI
.100-0.08 .0.04 0 0.04
strain
(b)
stress C
fpu=
fpy =
— smooth stress-strain relationship— — . bilinear approximation
Fig. 3.Analytical
model:(a) elevation;
(b) mild steel;(c) unconfined
concrete;(d) PT steel;(e) concretebehavior in
tension.
strain
tension
tensiOn
0.00414 e11 =
.0.145
-0.290
-0.435
(d)
r= 0.250.50
ra= 0.75r= 1.00 (i.e., emulative wall) stress (ksi)
(e)
40 PCI JOURNAL

Table 1. The prototype walls.
Note: UP = Unbonded post-tensioned wall; HY = Hybrid wall: EM = Emulative wall.
the maximum strains in the post-tensioning bars during an earthquake areexpected to remain well below thestrain e corresponding to f, and,thus, the behavior of the post-tensioning steel beyond r, is not modeled.
Modeling of Gap Opening
In unbonded post-tensioned precastwalls without bonded mild steel reinforcement crossing the horizontaljoints, the opening of discrete gaps atthe joints with little or no cracking inthe wall panels can occur since thepost-tensioning steel is not bonded tothe concrete. As a result of gap opening, large compressive stresses develop near the regions of a wall panelin contact with another panel or withthe foundation (i.e., contact regions),while the tensile stresses in a significant portion of the panel are equal orclose to zero.’7
The compressive behavior of thewall panels in the contact regions ismodeled using the uniaxial compressive stress-strain relationship of theconcrete fibers in the fiber beam-column elements. To model the gapopening behavior in walls withoutmild steel reinforcement, the tensilestrength and stiffness of the concretefibers representing the wall panels areset to zero as described in Kurama et
and verified in Kurama.5Thus, the gap opening displace
ments that occur at the horizontaljoints are modeled as distributed tensile deformations that occur in thefiber elements over the height of thewall panels. The reduction in the flexural stiffness of a wall as a result ofgap opening’2 is represented by thezero stiffness of the concrete fibersthat go into tension when the precompression stresses due to gravity and
post-tensioning forces are overcomeby the flexural stresses that develop atthe tension side of the wall due to lateral loads.
For walls with mild steel reinforcement crossing the horizontal joints, theopening of discrete gaps at the joints isrestricted since the mild steel reinforcement is assumed fully bondedand anchored to the concrete. Thesteel fibers that are used to representthe bonded mild steel bars in the wallpanels capture this effect in the analytical model.
While the tensile stresses in the wallpanels above and below a gap at a horizontal joint are expected to remainsmall, significant tensile stresses maydevelop (and cracking may occur) inthe panels away from the horizontaljoint as a result of the bond betweenthe mild steel reinforcement and theconcrete. To represent these stresses,the tensile strength of concrete is considered in the modeling of the wallpanels away from the horizontal joints[see Figs. 3(c) and 3(e)].
For walls with bonded mild steel reinforcement only (i.e., with no post-tensioning steel) emulating monolithiccast-in-place reinforced concretewalls, the tensile strength of concreteaway from the horizontal joints, fe,, isassumed to be equal to 7.5 JFJ(in psi).For walls with no mild steel (i.e., withpost-tensioning steel only), representing unbonded post-tensioned precastwalls, the tensile strength of concreteis assumed to be equal to zero for theentire wall as described above.
To achieve a smooth transition between the prototype walls with mildsteel only (i.e., emulative walls) andthe prototype walls with no mild steelinvestigated in this paper, the tensilestrength of concrete is assumed to decrease with the amount of mild steel
used in the walls as shown in Fig. 3(e).In Fig. 3(e), the amount of mild
steel used in the hybrid walls dividedby the amount of mild steel used in theemulative walls is referred to as r5.For example, for a hybrid system withone-half the amount of mild steel reinforcement used in the emulative system (i.e., rse = 0.50), the tensilestrength of concrete is assumed to beequal to 0.5ft 3.75
Advantages and Limitationsof the Analytical Model
A significant advantage of usingfiber beam-column elements for thewall panels is that a reasonably accurate model can be developed usingonly uniaxial stress-strain models forthe concrete, mild steel, and post-tensioning steel, and the dimensions ofthe wall. The model, referred to as thefiber wall model, accounts for theaxial-flexural interaction in the wall,the gap opening along the horizontaljoints, and the hysteretic behavior ofthe mild steel, post-tensioning steel,spiral confined concrete, and unconfined concrete (including cracking andcrushing of concrete). Note that buckling and low cycle fatigue fracture ofthe mild steel bars are not modeled.
The degradation (if any) in the flexural stiffness and resistance of thewalls due to increasing lateral displacements is modeled; however, anyadditional degradation under repeateddisplacement cycles to a constant amplitude is not captured.
As described in detail by Kurama etal.,”2 the desired behavior of unbonded post-tensioned precast wallsunder lateral loads is governed, primarily, by the opening of gaps alongthe horizontal joints and, to a smallerextent, by the axial-flexural deforma
- High seismicity Moderate seismicityFour-story Six-story j Ten-story . Six-storyp,, p. T p T p p, T : p p5 T
System Wall (%) (%) (see) Wall (%) (%) (see) Wall (%) (%) (sec) Wall (%) (%) (see)UP PH4 1.55 0 0.48 PH6 1.44 0 0.64 PH1O 1.43 0 0.99 PM6 0.41 0 0.99
— — —
— HH6-25 1.03 0.49 0.63 —— — . — . — — —
FlY — — — — HH6-50 0.68 0.96 0.61 — — —tHM6-50 0,22 0.32 0.98— — -
- HH6 7033 1 9 0 59 — — — — — -
EM EH4 0 1.94 0.43 EE16 0 1.83 0.58 EHIO 0 1.88 0.89 : EM6 0 0.62 0.97
September-October 2002 41
81 ft
IIi - t
12.5 In.f io.65
60.357.5
— I I ‘—fi=0.625f
(c) Wall PH1O (d) Wall PM6
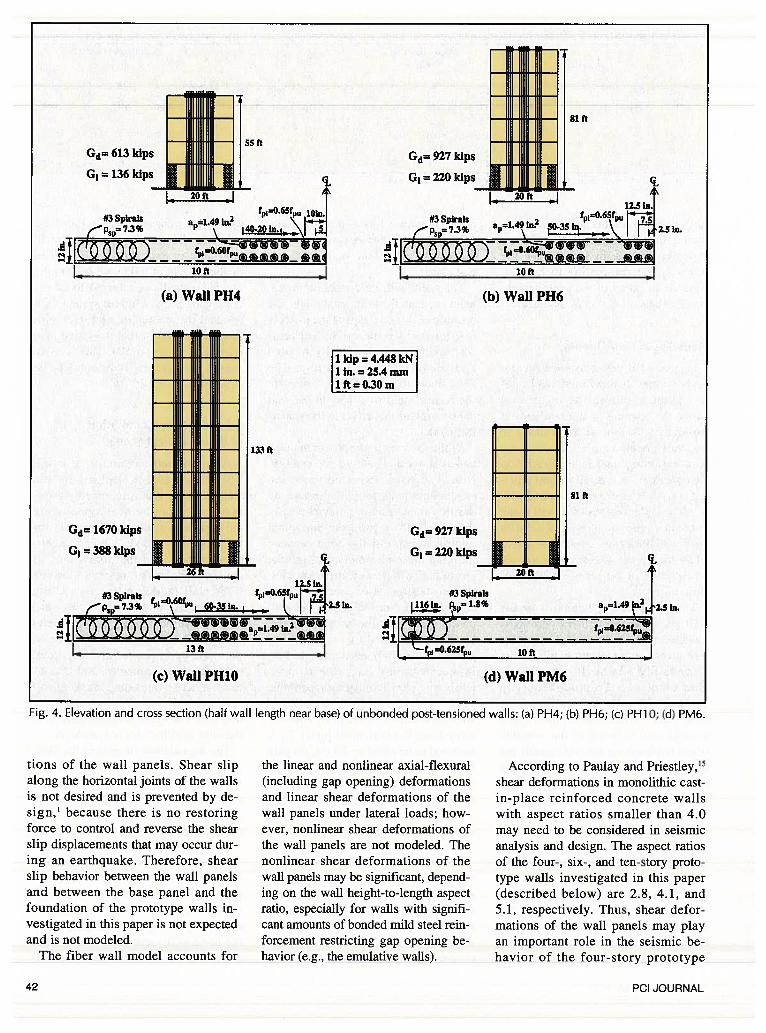
Hg. 4. Elevation and cross section (half wafl length near base) of unbonded post-tensioned walls: (a) PH4; (b) PH6; (C) PH1O; (d) PM6.
tions of the wall panels. Shear slipalong the horizontal joints of the wallsis not desired and is prevented by design,1 because there is no restoringforce to control and reverse the shearslip displacements that may occur during an earthquake. Therefore, shearslip behavior between the wall panelsand between the base panel and thefoundation of the prototype walls investigated in this paper is not expectedand is not modeled.
The fiber wall model accounts for
the linear and nonlinear axial-flexural(including gap opening) deformationsand linear shear deformations of thewall panels under lateral loads; however, nonlinear shear deformations ofthe wall panels are not modeled. Thenonlinear shear deformations of thewall panels may be significant, depending on the wall height-to-length aspectratio, especially for walls with significant amounts of bonded mild steel reinforcement restricting gap opening behavior (e.g., the emulative walls).
According to Paulay and Priestley,’5shear deformations in monolithic cast-in-place reinforced concrete wallswith aspect ratios smaller than 4.0may need to be considered in seismicanalysis and design. The aspect ratiosof the four-, six-, and ten-story prototype walls investigated in this paper(described below) are 2.8, 4.1, and5.1, respectively. Thus, shear deformations of the wall panels may playan important role in the seismic behavior of the four-story prototype
Gd=6l3kips
= 136 kipsGd= 927 kips
G1=22Okips jHJIIJ20ft
(a) Wall PH4
-
(b) Wall PH6
133 ft
1 kip = 4.448 kN1 in. = 25.4 mm1 ft = 0.30 m
2.5 In.
Gd= 1670 kips
388 kips
#3 SpIrals
4Psp=
F
81 ft
Gd= 927 kips
= 220 kips
#3 SpIrals
!4,.!• Pl.89’5
77c7c7cma± -
13 ft
El20ft
a,=1.49
Jf1=o.625f}
2.5 In.
lOft
42 PCI JOURNAL
Xx24ft= 192 ft 8 x 24 ft = 192 ftt4
HoUow-’ - GravftyLoad ra1Load-Core Frame Frame
Panels
•
--‘----+::T-Beam
1,..-L-Beam___________-.
— . I U —
(a)
8 x 24 ft = 192 ft
I I II III1111111— — — — —
14-- —
I 11111••I liii.
. — — — U — —
(b)
8 x 24 ft = 192 ftI.i.-
- U I U — -
U I U I
U U • • I
-
— I • • — —
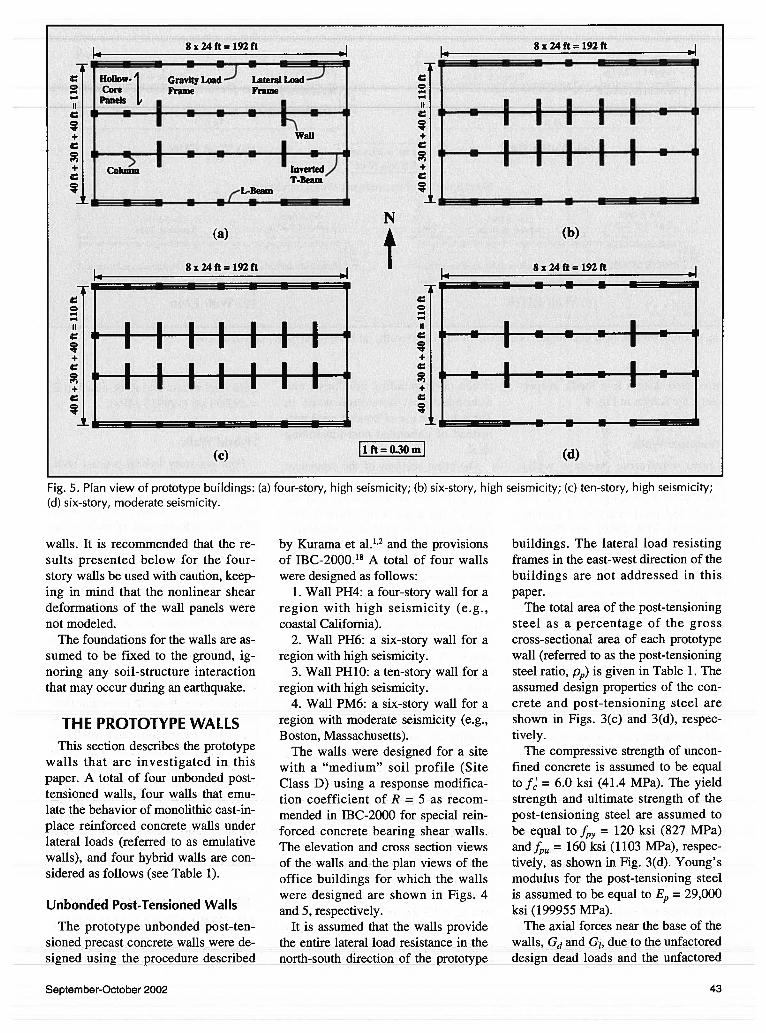
Fig. 5. Plan view of prototype buildings: (a) four-story, high seismicity; (b) six-story, high seismicity; (C) ten-story, high seismicity;(d) six-story, moderate seismicity.
walls. It is recommended that the resuits presented below for the four-story walls be used with caution, keeping in mind that the nonlinear sheardeformations of the wall panels werenot modeled.
The foundations for the walls are assumed to be fixed to the ground, ignoring any soil-structure interactionthat may occur during an earthquake.
THE PROTOTYPE WALLSThis section describes the prototype
walls that are investigated in thispaper. A total of four unbonded post-tensioned walls, four walls that emulate the behavior of monolithic cast-in-place reinforced concrete walls underlateral loads (referred to as emulativewalls), and four hybrid walls are considered as follows (see Table 1).
Unbonded Post-Tensioned WallsThe prototype unbonded post-ten
sioned precast concrete walls were designed using the procedure described
by Kurama et al.”2 and the provisionsof IBC-2000.’8A total of four wallswere designed as follows:
1. Wall PH4: a four-story wall for aregion with high seismicity (e.g.,coastal California).
2. Wall PH6: a six-story wall for aregion with high seismicity.
3. Wall PH1O: a ten-story wall for aregion with high seismicity.
4. Wall PM6: a six-story wall for aregion with moderate seismicity (e.g.,Boston, Massachusetts).
The walls were designed for a sitewith a “medium” soil profile (SiteClass D) using a response modification coefficient of R = 5 as recommended in IBC-2000 for special reinforced concrete bearing shear walls.The elevation and cross section viewsof the walls and the plan views of theoffice buildings for which the wallswere designed are shown in Figs. 4and 5, respectively.
It is assumed that the walls providethe entire lateral load resistance in thenorth-south direction of the prototype
buildings. The lateral load resistingframes in the east-west direction of thebuildings are not addressed in thispaper.
The total area of the post-tensioningsteel as a percentage of the grosscross-sectional area of each prototypewall (referred to as the post-tensioningsteel ratio, p) is given in Table 1. Theassumed design properties of the concrete and post-tensioning steel areshown in Figs. 3(c) and 3(d), respectively.
The compressive strength of unconfined concrete is assumed to be equalto f’ = 6.0 ksi (41.4 MPa). The yieldstrength and ultimate strength of thepost-tensioning steel are assumed tobe equal to f = 120 ksi (827 MPa)andf = 160 ksi (1103 MPa), respectively, as shown in Fig. 3(d). Young’smodulus for the post-tensioning steelis assumed to be equal to E = 29,000ksi (199955 MPa).
The axial forces near the base of thewalls, Gd and G1, due to the unfactoreddesign dead loads and the unfactored
=
+
+
=
N
4
=
=+
=+
=-4-4
+
(c) 11ft=0.30m1 (d)
-4‘-I
+
0
+
0
September-October 2002 43

Fig. 6. Cross section (half wall length near base) of emulative walls: (a) EH4; (b) EH6; (c) EH1 0; (d) EM6.
unreduced design live loads, respectively, are shown in Fig. 4.
Emulative Walls
Four emulative precast walls,namely, Walls EH4, EH6, EH1O, andEM6, were determined using the fourunbonded post-tensioned precastWalls PH4, PH6, PH1O, and PM6, respectively, described above.
One of the objectives of this paperis to compare the expected seismic behavior of walls with similar flexuralstrengths and initial stiffnesses (and,thus, similar linear elastic fundamentalperiods), but with different amounts ofenergy dissipation. Thus, the emulative walls investigated in the paperwere determined by replacing the unbonded post-tensioning steel in the Un-bonded post-tensioned walls with asufficient amount of bonded mild steelreinforcement to result in similar flexural strengths to resist lateral loads.
Note that there may be other methods to emulate the behavior of monolithic cast-in-place reinforced concretewalls, such as by using ductile connectors along the horizontal joints between the wall panels and between thewall and the foundation. These typesof walls are not considered in thispaper since the main focus of the research is to investigate the use of mildsteel reinforcement in the walls. Thus,the only significant difference be-
tween corresponding emulative andunbonded post-tensioned walls inTable 1 is the use of bonded mild steelinstead of unbonded post-tensioningsteel.
The cross sections of the emulativewalls are shown in Fig. 6 (for clarity,the spiral reinforcement used near thebase of the walls is not shown). Thetotal area of the mild steel reinforcement as a percentage of the grosscross-sectional area of each prototypewall (referred to as the mild steel ratio,PS) is given in Table I.
A nominal amount of mild steel (p30.25 percent) is distributed at 18 in.
(457 mm) spacing within approximately 70 percent of the wall length inthe middle. The remainder of the mildsteel is distributed at a reduced spacing within approximately 15 percentof the wall length near each end. Tosimplify the analysis of the prototypewalls, the mild steel reinforcement isassumed to extend over the entire wallheight. In practice, the reinforcementmay be terminated at a sufficientheight above the base of the wall;however, this is not investigated inthis paper.
The yield strength and ultimatestrength of the mild steel are assumedto be equal to f = 60 ksi (414 MPa)and f = 97 ksi (669 MPa), respectively, with the ultimate strengthreached at a strain of 0.06 as shown inFig. 3(b). Young’s modulus for the
mild steel is assumed to be equal to E529,000 ksi (199955 MPa).
Hybrid Walls
Four six-story hybrid precast wallsare considered based on the unbondedpost-tensioned walls and the emulativewalls described above. Hybrid WallsHH6-25, HH6-50, and HH6-75 have,approximately, 0.25, 0.50, and 0.75times, respectively, the amount ofmild steel reinforcement used in WallEH6 for a region with high seismicity.Similarly, Wall HM6-50 has, approximately, 0.50 times the amount of mildsteel reinforcement used in Wall EM6for a region with moderate seismicity.
The amount of the post-tensioningsteel used in the hybrid walls was determined so as to result in similar flexural strengths as Walls PH6 and PM6for regions with high and moderateseismicity, respectively. The crosssections of the hybrid walls are shownin Fig. 7 (for clarity, the spiral reinforcement used near the base of thewalls is not shown). The post-tensioning steel ratio, p, and the mild steelratio, p5, of the walls are given inTable 1.
BEHAVIOR OF THE WALLSUNDER LATERAI LOADING
Figs. 8 to 10 show the expected baseshear versus roof drift (V-i) behavior
No. 8 bars16 pairs @ 2.25 in.
ii
No. 5 bars5pafrs@ l8in.
— — — _a — — _s_ — ._ —
lOft
No. 8 bars15 pairs @ 2.5 in.
I_i
No. 5 bars5pafrs@lSin.
— — — -,
a. .wa.aaa.a — .a — —
loft
(a) Wall EH4 i n. = 25.4 (b) Wall EH61 ft=O.30m
Note: Spiral reinforcement not shown for clarity.
No. 8 bars No.5 bars2Opairs(l)2.25in. [email protected] frI IS
m—,-——-nn.e—— a—
II. IlL — ....* — h... — — — 1. — .....I.....
13 ft
No. 6 bars7 pairs @ 5.25 in.14
(c) Wall EH1O
No. 5 barsI- Spairs@l8in.
I—e.p.a
.. ._ a_a_....._ — — —
I lOft
(d) Wall EM6
44 PCI JOURNAL

Fig. 7. Cross section (half wall length near base) of hybrid walls: (a) HH6-25; (b) HH6-50; (c) HH6-75; (d) HM6-50.
of the prototype walls under combinedgravity loads and reversed cyclic lateral loads. The gravity loads acting oneach wall are assumed to be equal to1 .OOD + O.25L, where D and L are theunfactored design dead load and theunfactored unreduced design live load,respectively. This combination of deadand live loads is assumed to representthe amount of gravity load that may beacting on the walls during an earthquake.
The base shear, V. is equal to thesum of the lateral forces applied at thefloor and roof levels, and the roofdrift, A, is equal to the lateral displacement at the roof level divided by thewall height. The distribution of the lateral forces over the height of the wallsis assumed to be the same as the distribution of inertial forces correspondingto the fundamental (i.e., first) mode ofvibration from a linear elastic modalanalysis of each structure. Note thatinertial force distributions significantly different than the assumed fundamental mode distribution over theheight of the walls are possible duringa large earthquake (e.g., close to a uniform distribution); however, this is notinvestigated in this paper.
Fig. 8 shows the base shear versusroof drift relationships of the proto
type unbonded post-tensioned WallsPH4, PH6, PH1O, and PM6. The behavior of the walls is nearly nonlinearelastic, characterized by loading andunloading hysteresis curves that arevery close to each other. The extremely narrow hysteresis loops showthat the inelastic energy dissipation ofthe walls is small. A detailed investigation of the behavior of walls similarto the prototype unbonded post-tensioned walls in this paper can be foundin Kurama et al.”2
Similarly, Fig. 9 shows the baseshear versus roof drift relationships ofthe prototype emulative Walls EH4,EH6, EH1O, and EM6. Tne hystereticbehavior of the walls resemble the expected behavior of flexural monolithiccast-in-place reinforced concrete wallswith slightly pinched hysteresis loopsand considerable energy dissipation. 19-22
There are two important differences inthe behavior of the prototype emulativeand unbonded post-tensioned wallsunder cyclic lateral loading:
1. The emulative walls have muchfuller hysteresis loops, indicating significantly larger inelastic energy dissipation.
2. The emulative walls have lessself-centering capability, indicatingthe possibility of larger residual (i.e.,
permanent) lateral displacements afteran earthquake.
Note that Wall EM6 [Fig. 9(d)],which was designed for a region withmoderate seismicity, has a smalleramount of inelastic energy dissipationand a larger amount of self-centeringcapability than Wall EH6 [Fig. 9(b)1,which was designed for a region withhigh seismicity. This is because theamount of mild steel reinforcement inWall EM6 = 0.61 percent) is aboutone-third the amount of mild steel reinforcement in Wall EH6 (p = 1.88percent), whereas, as shown in Fig. 4,the axial force near the base of WallEM6 due to the design gravity load isthe same as that of Wall EH6 (see values for Gd and G1). The restoring effect of the gravity load in Wall EM6 islarge enough to provide a significantself-centering capability to the wall.
Fig. 10 shows the base shear versusroof drift relationships of the prototype hybrid Walls HH6-25, FIH6-50,HH6-75, and HM6-50. As expected,an increase in the amount of mild steelreinforcement results in an increase inthe amount of energy dissipation ofthe walls.
The thick red lines in Figs. 8 to 10show the base shear versus roof driftbehavior of the prototype walls under
1.a =1.49 in2fP=0.65f1
in.l=0.60f 50.40 in.
I 1
I.No. 5 bars
7 pairs @ 5.5 in.
• \jTrq T&
— .1. — — — —a—
No.5 bars5 pairs @ 18 in.
lOft
a=1.23 infPlO65( [Z4—0.60f 50.45 in.
2.5 in.II
(a) Wall HH6-25
[aNo. 8 bars
7 pairs @ 5.5 in.
-
1 in. = 25.4 mm1 ft = 0.30 m
No. 5 bars5 pairs @ 18 in.
lOft
(b) Wall HH6-50
Note: Spiral reinforcement not shown for darity.(j
in.f=O.65f
I2.5 in.II . L.f r.,-.-, a--v —
— —
—
L9.a.aa I.J*. — .L — — .._,_ — _._ —
[aNo.8 bars
11 pairs @3.5 in.
a=0.79 in
1-16in. f =0.625f_I_z_z_ ._-
No.5 bars5 pairs @ 18 in.
lOft
(c) Wall HH6-75
Qf.=O.62Sf •‘
f42Sin.—
j a_.. . — — ._ — — I_ — — I.. — — — — —
No.5 bars, 8 pairs @ 17 in.
10 ft
(d) Wall HM6-50
September-October 2002 45

0.
112
.3 0roof drift, A (percent)
1000
0.
F-1000
.3 0roof drift, A (percent)
-3 0roof drift, A (percent)
-3 0roof drift, A (percent)
0 3roof drift, A (percent)
I I I I
0 2roof drift, A (percent)
roof drift, A (percent)
(b)
0 2roof drift, A (percent)
1500
0
-1500
1000
-10003 -3
ikip 4.448 kN
Wall P116
— cyclic— monotonic
(b)(a)
• I I I
WaIIPHIO
—cyclic— monotomc
I I I i •
I,u
0.
.0
2
(c)
3 -2
(d)
1000
0
Fig. 8. Behavior ofunbonded post-tensioned walls
under lateral loads:(a) PH4; (b) PH6;
(C) PH1O; (d) PM6.
Fig. 9. Behavior ofemulative walls
under lateral loads:(a) EH4; (b) EH6;
(C) EH1O; (d) EM6.
E62:1500
0
-1500
1000
0
.1000
3 -3
Ii kip = 4.448 kN I50U
3
(a)I I I
Wall EfilO
•
I Eonic(c)
3 .2
(d)
46 PCI JOURNAL

1000
Fig. 10. Behavior ofhybrid walls underlateral loads:(a) HH6-25;(b) HH6-50;(C) HH6-75;(d) HM6-50.
combined gravity loads and mono-tonic lateral loads as obtained fromstatic push-over analyses. Fig. 11 provides comparisons between the pushover analysis results of correspondingunbonded post-tensioned, hybrid, andemulative walls.
Figs. 8 to 11 show that the differences in the behavior of the wallsunder monotonic lateral loading are insignificant as compared to the differences under cyclic lateral loading. Thesmall differences in the behavior of thewalls under monotonic lateral loadingoccur for two principal reasons:
1. The total post-tensioning force ina wall decreases as the area of thepost-tensioning steel is decreased(since the initial stress in the post-tensioning steel, f,,, is not varied asshown in Figs. 4 and 7). This resultsin an earlier reduction in the flexuralstiffness (i.e., earlier softening) of thewall due to earlier gap opening alongthe horizontal joints under lateralloads 2
2. As shown in Table 1, the total
area of the flexural steel (i.e., area ofthe post-tensioning steel plus area ofthe mild steel) in a wall increases asthe post-tensioning steel is replacedwith mild steel while keeping the flexural strength of the wall constant(since mild steel has significantlylower tensile strength than post-tensioning steel). This increase in thetotal steel area results in an increase inthe flexural stiffness of the wall. Notethat, as shown in Fig. 11, the effect ofthe steel area on the wall stiffness isgreater after the opening of gaps alongthe horizontal joints (i.e., the post-softening range), since the flexuralstiffness before gap opening (i.e., thepre-softening range) is governed bythe gross cross section of the wall.
The most significant effect of thedifferent amounts of mild steel andpost-tensioning steel on the behaviorof the walls under lateral loading is inthe shape of the hysteresis loops andthe amount of inelastic energy dissipation per cycle of loading. This is discussed in more detail below.
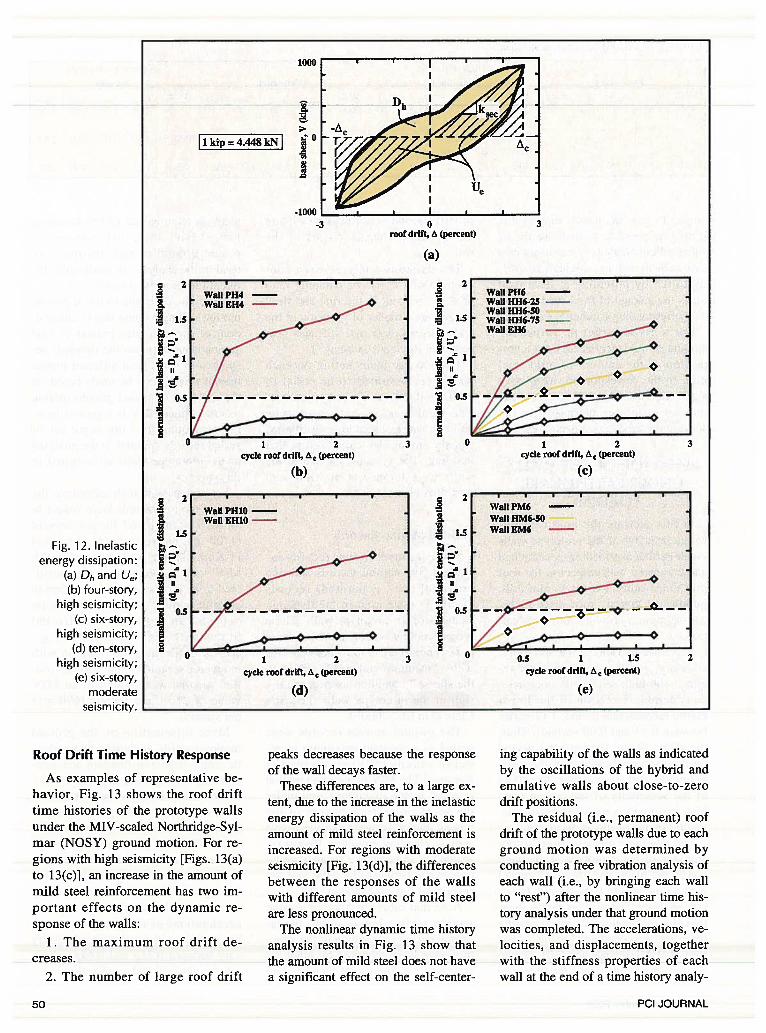
Inelastic Energy Dissipation
This section investigates the inelastic energy dissipation of the prototypewalls based on the reversed cyclic lateral load analysis results in Figs. 8 to10. For this purpose, the inelastic energy dissipation per loading cycle, Dh,is calculated as the area enclosed bythe base shear versus roof drift relationship during that cycle. As an example, the shaded region in Fig. 12(a)is used to determine Dh for the lastloading cycle (to ±4 = ±2.5 percent,where z is the maximum roof driftreached during the cycle) of Wall EH6in Fig. 9(b).
The inelastic energy dissipation percycle, Dh, is normalized with the energy absorbed by an “equivalent” linear elastic system, Ue, which is equalto the sum of the hatched triangularareas in Fig. 12(a). As described inKurama4 and IBC-2000,18the normalized inelastic energy dissipation, dh =
Dh/Ue, is a measure of the amount ofviscous damping in the equivalent linear elastic system that would result in
-1000-3
(a)
1000
0 3 -3 0 3roof drift, (percent) roof drift, (percent)
Ii kip = 4.448 kN
Wall 11116-75
(b)
500
0
— cyclic— monotonic
-1000 -500-3 0
roof drift, (percent)3
(c)
-2 0roof drift, (percent)
(d)
2
September-October 2002 47

Fig. 11. Behavior ofprototype walls
under monotonicloading:
(a) four-story,high seismicity;
(b) six-story,high seismicity;
(c) ten-story,high seismicity;
Cd) six-story,moderate
seism icity.
the same amount of energy dissipationas the nonlinear system.
Note that the behavior of the prototype walls is symmetric in the positiveand negative directions of loading and,thus, the amount of energy absorbedby the equivalent linear elastic systemin the positive direction is the same asthe energy absorbed in the negative direction. The stiffness of the equivalentlinear elastic system is assumed to bethe same as the secant stiffness, ksec,corresponding to the maximum positive and negative roof drift reachedduring the cycle, ± 4.
The normalized inelastic energy dissipation, d, of the four-story, six-story, and ten-story prototype walls inregions with high seismicity and thesix-story walls in regions with moderate seismicity are shown in Figs. 12(b)to 12(e), respectively. The horizontalaxes show the maximum roof driftreached during each loading cycle, k.The walls for regions with high seismicity are displaced to roof drift valuesof ±4, ±0.5, ±1.0, ±1.5, ±2.0, and±2.5 percent during each cycle and the
walls for regions with moderate seismicity are displaced to roof drift values of ±z = ±0.3, ±0.7, ±1.0, ±1.3,and ±1.7 percent (see Figs. 8 to 10).
Table 2 gives the normalized energydissipation of the hybrid and emulative walls divided by the normalizedenergy dissipation of the corresponding unbonded post-tensioned walls, rh
= dh/dh, during the first four roof driftcycles (i.e., rhP,1 to rh,4 in Table 2).
The results in Table 2 show that theinelastic energy dissipation of thewalls is significantly increased as a result of the use of mild steel reinforcement. For the six-story walls in regions with high seismicity, the energydissipation of the unbonded post-tensioned Wall PH6 can be increased toover two, three, and four times by providing 0.25, 0.50, and 0.75 times theamount of mild steel used in the emulative Wall EH6, respectively. The energy dissipation of the emulative wallis over five times that of the unbondedpost-tensioned wall.
A similar measure of inelastic energy dissipation is defined using the
relative energy dissipation ratio, I, inthe ACI Standard and Commentary“Acceptance Criteria for MomentFrames Based on Structural Testing”(T1.1-01 and T1.1R-01).23 It can beshown that the relative energy dissipation ratio, f3, is equal to 1/4 times thenormalized inelastic energy dissipation, dh, defined above.
In the ACT Standard T1.l-0l,23 thesmallest acceptable value of /3 is specified as 0.125, which corresponds to avalue of 0.5 for dh. The ACI Standardrecommends that if /3 is smaller than0.125, there may be inadequate damping for the frame as a whole, and theoscillations of the frame may continuefor a considerable time after an earthquake, possibly producing low-cyclefatigue effects and excessive displacements.
Similar guidelines on the requiredamount of energy dissipation need tobe developed for precast concrete wallsystems. In the absence of these guidelines, the shaded regions in Figs. 12(b)to 12(e) show the cases for which dh0.5 for the prototype walls. For a wide
t.softening range
range
750
500
Wall P114 —
Wall EH4 —
Wall P116 —
Wall 11116-25Wall 11116-50Wall 11116.75 —
WaIIEH6 —
1200
900
. 600
2300
0 - 0.5 1 1.5 2 2.5 3 0 0.5 1 1.5 2 2.5roof drift, (percent) roof drift, (percent)
(a) lkip=4.448kNI (b)
500
400
I300
i . 200
100
0
alIPM6-Wall HM6.50Wall EM6 —
roof drift, (percent)
(c)
0.5roof drift, 1 (percent)
1.5 2
(d)
48 PCI JOURNAL
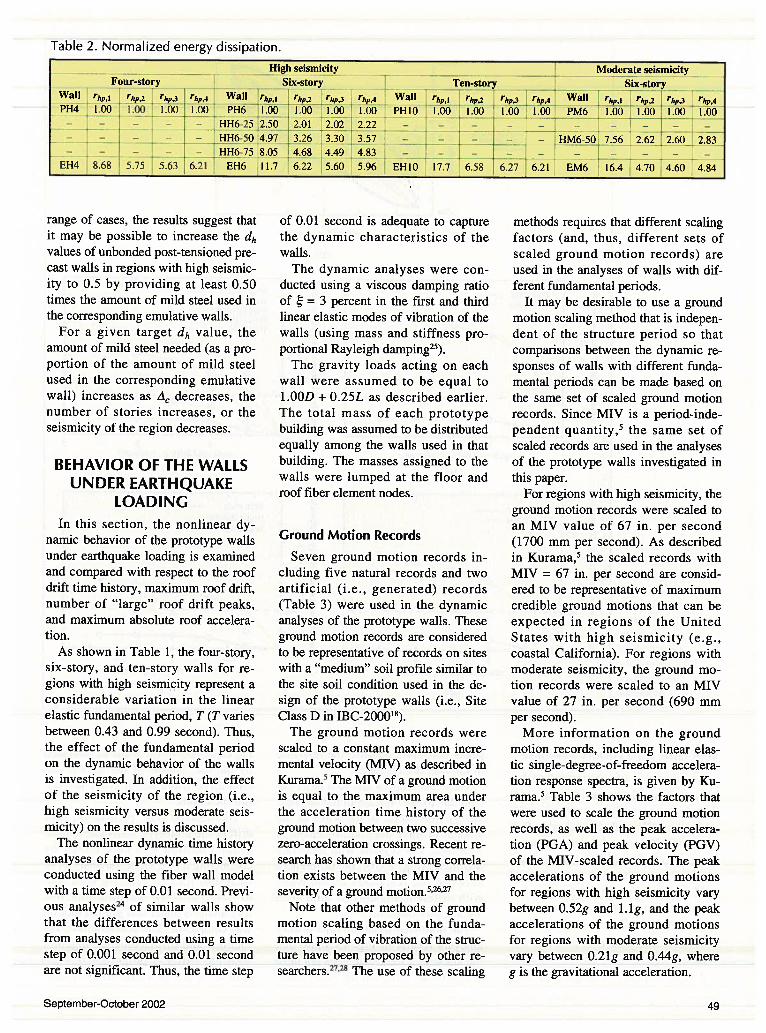
Table 2. Normalized energy dissipation.
High seismicity Moderate seismicityFour-story Six-story Ten-story Six-story
Wall Thp I r1. r,3 rh, 4 Wall r1 r5,2 rhP3 r Wall rhP 1 rh - rhp,3 r,1,,4 Wall TJjp5 1hp2 rh,,,,J T64
PH4 1.00 1.00 t:flOj1.OO PHÔ 1.OO_ j_l.00 1.00 I f’HIO 1.00 1.00 1.00 11X1 PM6 1.00 11)0 1.00 1.00— — — —
— HH6-25 .50 01 02 2.22 — — — —
— — — —
— 1H6-50 14.97 3.26 3.30 3.57 — — -
— J 6-50 7.56 2.62 2.60 2.83
—
LQ 4.68 4.49 4.83 — - —
EH4 8.68 5.75 5.63 6.21 EH6 11.7 6.22 5.60 5.96 EHIO 17.7 6.58 6.27 6.21 EM6 16.4 4.70 4.60 4.84
range of cases, the results suggest thatit may be possible to increase the dhvalues of unbonded post-tensioned precast walls in regions with high seismicity to 0.5 by providing at least 0.50times the amount of mild steel used inthe corresponding emulative walls.
For a given target dh value, theamount of mild steel needed (as a proportion of the amount of mild steelused in the corresponding emulativewall) increases as z decreases, thenumber of stories increases, or theseismicity of the region decreases.
BEHAVIOR OF THE WALLSUNDER EARTHQUAKE
LOADINGIn this section, the nonlinear dy
namic behavior of the prototype wallsunder earthquake loading is examinedand compared with respect to the roofdrift time history, maximum roof drift,number of “large” roof drift peaks,and maximum absolute roof acceleration.
As shown in Table 1, the four-story,six-story, and ten-story walls for regions with high seismicity represent aconsiderable variation in the linearelastic fundamental period, T (T variesbetween 0.43 and 0.99 second). Thus,the effect of the fundamental periodon the dynamic behavior of the wallsis investigated. In addition, the effectof the seismicity of the region (i.e.,high seismicity versus moderate seismicity) on the results is discussed.
The nonlinear dynamic time historyanalyses of the prototype walls wereconducted using the fiber wall modelwith a time step of 0.01 second. Previous analyses24 of similar walls showthat the differences between resultsfrom analyses conducted using a timestep of 0.001 second and 0.01 secondare not significant. Thus, the time step
of 0.01 second is adequate to capturethe dynamic characteristics of thewalls.
The dynamic analyses were conducted using a viscous damping ratioof 3 percent in the first and thirdlinear elastic modes of vibration of thewalls (using mass and stiffness proportional Rayleigh damping25).
The gravity loads acting on eachwall were assumed to be equal to1.OOD + 0.25L as described earlier.The total mass of each prototypebuilding was assumed to be distributedequally among the walls used in thatbuilding. The masses assigned to thewalls were lumped at the floor androof fiber element nodes.
Ground Motion Records
Seven ground motion records including five natural records and twoartificial (i.e., generated) records(Table 3) were used in the dynamicanalyses of the prototype walls. Theseground motion records are consideredto be representative of records on siteswith a “medium” soil profile similar tothe site soil condition used in the design of the prototype walls (i.e., SiteClass D in IBC-200018).
The ground motion records werescaled to a constant maximum incremental velocity (MIV) as described inKurama.5The MIV of a ground motionis equal to the maximum area underthe acceleration time history of theground motion between two successivezero-acceleration crossings. Recent research has shown that a strong correlation exists between the MIV and theseverity of a ground motion.5’26’27
Note that other methods of groundmotion scaling based on the fundamental period of vibration of the structure have been proposed by other researchers.27’28 The use of these scaling
methods requires that different scalingfactors (and, thus, different sets ofscaled ground motion records) areused in the analyses of walls with different fundamental periods.
It may be desirable to use a groundmotion scaling method that is independent of the structure period so thatcomparisons between the dynamic responses of walls with different fundamental periods can be made based onthe same set of scaled ground motionrecords. Since MIV is a period-independent quantity,5 the same set ofscaled records are used in the analysesof the prototype walls investigated inthis paper.
For regions with high seismicity, theground motion records were scaled toan MIV value of 67 in. per second(1700 mm per second). As describedin Kurama,5 the scaled records withMIV = 67 in. per second are considered to be representative of maximumcredible ground motions that can beexpected in regions of the UnitedStates with high seismicity (e.g.,coastal California). For regions withmoderate seismicity, the ground motion records were scaled to an MIVvalue of 27 in. per second (690 mmper second).
More information on the groundmotion records, including linear elastic single-degree-of-freedom acceleration response spectra, is given by Kurama.5 Table 3 shows the factors thatwere used to scale the ground motionrecords, as well as the peak acceleration (PGA) and peak velocity (PGV)of the MIV-scaled records. The peakaccelerations of the ground motionsfor regions with high seismicity varybetween 0.52g and 1.lg, and the peakaccelerations of the ground motionsfor regions with moderate seismicityvary between 0.21g and 0.44g, whereg is the gravitational acceleration.
September-October 2002 49
S I
Roof Drift Time History Response
As examples of representative behavior, Fig. 13 shows the roof drifttime histories of the prototype wallsunder the MIV-scaled Northridge-Sylmar (NOSY) ground motion. For regions with high seismicity [Figs. 13(a)to 13(c)], an increase in the amount ofmild steel reinforcement has two important effects on the dynamic response of the walls:
1. The maximum roof drift decreases.
2. The number of large roof drift
n 20
a1.5
1
.
0.5
peaks decreases because the responseof the wall decays faster.
These differences are, to a large extent, due to the increase in the inelasticenergy dissipation of the walls as theamount of mild steel reinforcement isincreased. For regions with moderateseismicity [Fig. 13(d)], the differencesbetween the responses of the wallswith different amounts of mild steelare less pronounced.
The nonlinear dynamic time historyanalysis results in Fig. 13 show thatthe amount of mild steel does not havea significant effect on the self-center-
ing capability of the walls as indicatedby the oscillations of the hybrid andemulative walls about close-to-zerodrift positions.
The residual (i.e., permanent) roofdrift of the prototype walls due to eachground motion was determined byconducting a free vibration analysis ofeach wall (i.e., by bringing each wallto “rest”) after the nonlinear time history analysis under that ground motionwas completed. The accelerations, velocities, and displacements, togetherwith the stiffness properties of eachwall at the end of a time history analy
Ii kip = 4.448 kN
1000
C)
-1000
0
0roof drift, (percent)
3
n 2
a1.5
1
0.5
(a)
2
1
0.5
0U 1 2 3cycle roof drift, (percent)
(b)
1 2 3cycle roof drift, (percent)
(c)
Fig. 12. Inelasticenergy dissipation:
(a) Dj, and Ue;(b) four-story,
high seismicity;(c) six-story,
high seismicity;(d) ten-story,
high seismicity;(e) six—story,
moderateseismicity.
I I
WaIIPM6 —
Wall HM6-50WaIIEM6 —
7.I—°-:-----:-°-..1 2
cycle roof drift, (percent)
(d)
0 0.5 1 1.5 2
cycle roof drift, t (percent)
(e)
50 PCI JOURNAL

Table 3. MIV-scaled ground motion records.
High seismicity Moderate seismicity
Recording station or Scale PGA 1 PGV MIV Scale PGA PGV MIVEarthquake method of generation factor (g) (infsec) (inisec) factor (g) (inJsec) (inJsec)
LPHO-LomaPriera, 1989 Hollister-South and Pine 1.40 0.52 L_35 67 0.56 0.21 14 27LAYE-Landers, 1992 Yermo-Fire Station 255 0.62 I 51 67 1.02 015 20 27
NONW-Nohide,1994 Newhall-LA County Fire St. 1.11 0.66 42 67 0.44 0.26 17 27SFOR-SanFernando, 1971 LA8244OrionBLlstfloor 3.72 0.95 44 67 1.49 0.38 18 27NOSY-Northridge, 1994 Sy1mno5p?) 1.15 0.97 58 67 0.46 0.39 23 27
G1M generated5 SEAOC Spectrum Compatible 1.01 1.0 107 67 0.40 0.40 43 27G2M-generated5 UsingKanai-TajimiFilter 1.07 1.1 112 67 0.43 0.44 45 27
Note: 1 in. = 25.4 mm.
sis, were used as initial conditions forthe subsequent free vibration analysis,which was continued until the oscillations of the wall were sufficientlysmall.
In general, the dynamic analyses ofthe prototype walls did not show significant residual drifts under the sevenMIV-scaled ground motions, even forthe emulative walls (the residual roofdrifts for Walls EH4, EH6, EH1O, andEM6 were smaller than 0.25, 0.099,0.070, and 0.0073 percent, respectively).
Note that the small residual roofdrift values obtained from the dynamic
analysis results of the emulative wallsare contrary to expectations, since thenonlinear static reversed cyclic analyses in Figs. 8 to 10 show that wallswith larger amounts of mild steel tendto have larger amounts of residualdrift upon unloading from a nonlinearlateral displacement. Furthermore,previous comparisons1’24between theexpected dynamic responses of Un-bonded post-tensioned precast wallsand monolithic cast-in-place reinforced concrete walls have shown significant residual drifts for the cast-in-place walls.
The differences in the estimatedresidual roof drift values between theprevious results1’24 and the results presented in this paper may be due toseveral factors, including:
1. The previous results are based onthe ground motion records in Table 3scaled to a constant peak acceleration,PGA, of 1.Og, resulting in significantly larger intensities for the LPHO,LAYE, and NONW ground motions.The largest residual drift values fromthe previous analyses were obtainedunder these records.
2. The increase in the post-softening
Fig. 13. Roof drifttime history:(a) four-story,high seismicity;(b) six-story,high seismicity;(c) ten—story,high seismicity;(d) six-story,moderate seismicity.
2.5
-2.5
2.5
(a) lin.=25.4mmf (b)
0
I-2.5
1.5
10
0 3 6 9 12time, t (seconds)
(C)
-L515 0 3 6 9 12
time, t (seconds)
(d)
15
September-October 2002 51

high seismicity.
stiffness (i.e., the stiffness in the post-softening range) (see Fig. 11) of thewalls as the amount of mild steel reinforcement is increased was not considered in the previous research. A largerpost-softening stiffness usually resultsin a larger self-centering capabilityand, thus, a smaller residual drift sincea larger amount of elastic energy isstored during the loading of thewall.2’29
3. In the previous research, the nonlinear behavior of the monolithic cast-in-place concrete walls was modeledusing a zero-length rotational spring element24 at the base of the walls. Thisrotational spring element is not sensitive to the restoring effect of the gravity loads applied on the walls. In thecurrent research, the nonlinear behavior of the walls is modeled using fiberbeam-column elements, which areaxial-flexural elements that can capturethe restoring effect of the gravity loads.
Note that despite the apparentlysmall residual drifts, the emulativewalls are expected to have significantly more damage (due to yieldingof the mild steel reinforcement andcracking of the concrete) than the Un-bonded post-tensioned walls. Thesmall residual drifts estimated for theemulative walls indicate that, uponunloading, the walls may have a sufficient amount of restoring energy (dueto gravity loads and increased post-softening stiffness) to yield the mildsteel reinforcement in compressionand close the cracks.
It is recommended that further research be conducted on the self-cen
tering capability of the emulative andhybrid walls. In particular, the nonlinear shear deformations of the wallpanels, which may be significant forWall EH4, were not included in theanalytical model as described earlier.The lateral displacements of WallEH4 due to the nonlinear shear deformations may be difficult to restoreduring and after an earthquake, resulting in larger residual drifts than estimated herein.
Maximum Roof Drift
The average maximum roof drift,
m’ from the dynamic analyses of theprototype walls are given in Table 4.The 21m value for each wall was determined by calculating the average ofthe maximum roof drift, Am, valuesobtained from the dynamic analyses ofthe wall under the seven MIV-scaledground motion records. The results arediscussed below.
Unbonded Post-Tensioned Walls— With the exception of the four-story Wall PH4, the Zm values for theprototype unbonded post-tensionedwalls are acceptable for the design anddetailing of the walls as described inKurama et al.1’2 The Am value forWall PH4 (which is equal to 4.21 percent) is too large, indicating that thewall may need to be redesigned; however, this is not done in this paper.
For the six- and ten-story walls inregions with high seismicity, the differences between the maximum lateraldisplacements of the unbonded post-tensioned and emulative walls are con-
siderable. The maximum roof drift values of the unbonded post-tensionedWalls PH6 and PHIO are, on average,43 and 44 percent larger than those ofthe corresponding emulative WallsEH6 and EHIO, respectively. Note thatthese results are similar to previous results reported by Kurama et al.”24
If desired, the maximum lateral displacements of the unbonded post-tensioned walls can be significantly reduced by using supplemental energydissipation. For this purpose, recentresearch4’5has shown that, on average,up to 60 percent reduction in the maximum roof drift of the walls can beachieved by using supplemental friction dampers and viscous fluiddampers distributed along the heightof the walls.
It may be possible to use these supplemental energy dissipation devicesto reduce the maximum lateral displacements of the prototype unbondedpost-tensioned Walls PH4, PH6, andPH1O to below the displacements ofthe corresponding emulative walls.
For regions with moderate seismicity, the maximum roof drift values ofWall PM6 are, on average, 7 percentlarger than those of Wall EM6. Thissuggests that the differences betweenthe maximum lateral displacements ofunbonded post-tensioned and emulative precast walls in regions with moderate seismicity are small.
Hybrid and Emulative Walls —
The dynamic analysis results indicatethat the decrease in the maximum roofdrift of the walls as a result of the useof bonded mild steel reinforcementcrossing the horizontal joints dependson the amount of the mild steel. Inorder to investigate this effect, Fig. 14shows the maximum roof drift of thesix-story prototype walls in regionswith high seismicity, Am, divided bythe maximum roof drift of the unbonded post-tensioned Wall PH6, Amp.This ratio is referred to as rdP =
Am/Limp.The horizontal axis in Fig. 14 shows
the mild steel ratio of the walls, p, divided by the mild steel ratio of the emulative Wall EH6, p, referred to asrse Ps1’Pse as described earlier. Eachdata marker () in Fig. 14 representsthe rd value for a wall determinedusing one ground motion, and the
1.2
0.8
C 0.6‘I
. 0.4 P116 11116-25 11116-50 11116-75 EH6
0.2— — — average
0 p
0 0.2 0.4 0.6 0.8normalized mild steel ratio, r = P1 P
Fig. 14. Normalized maximum roof drift for the six-story walls in regions with
52 PCI JOURNAL
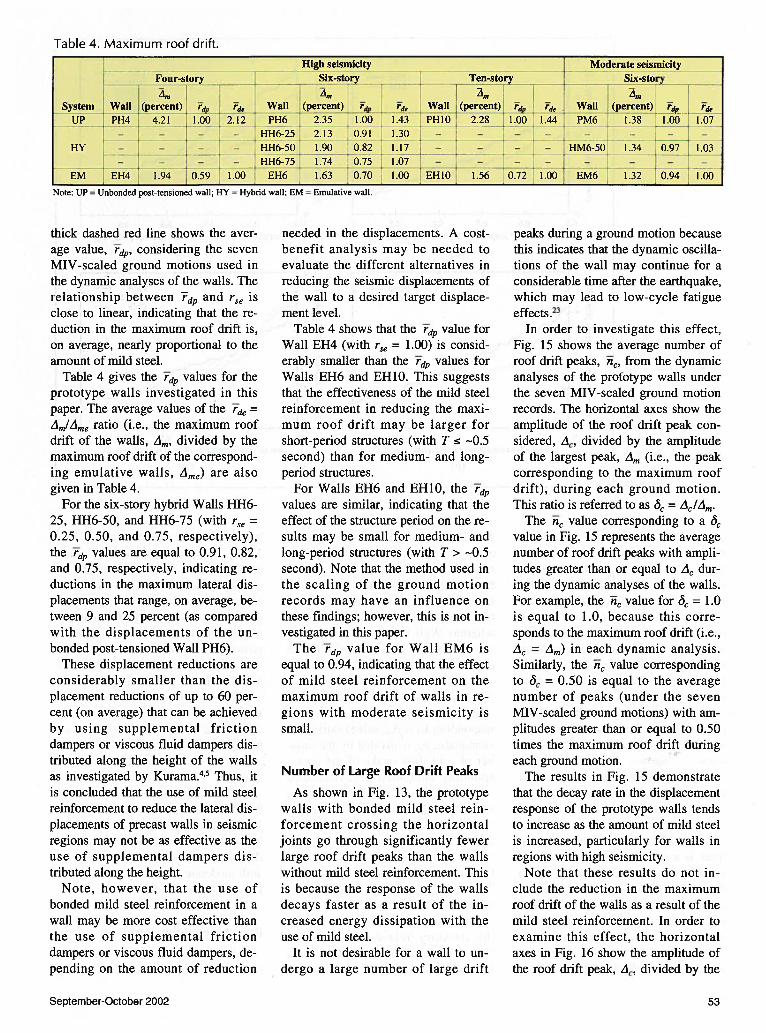
Table 4. Maximum roof drift.
Note: UP = Unbonded post-tensioned wall; HY = Hybrid wall; EM = Emulative wall.
thick dashed red line shows the average value, idp, considering the sevenMIV-scaled ground motions used inthe dynamic analyses of the walls. Therelationship between 3dp and rse 5
close to linear, indicating that the reduction in the maximum roof drift is,on average, nearly proportional to theamount of mild steel.
Table 4 gives the values for theprototype walls investigated in thispaper. The average values of the Fde =
ArnMme ratio (i.e., the maximum roofdrift of the walls, Am, divided by themaximum roof drift of the corresponding emulative walls, -1me) are alsogiven in Table 4.
For the six-story hybrid Walls HH6-25, HH6-50, and HH6-75 (with rse =
0.25, 0.50, and 0.75, respectively),the rdP values are equal to 0.91, 0.82,and 0.75, respectively, indicating reductions in the maximum lateral displacements that range, on average, between 9 and 25 percent (as comparedwith the displacements of the unbonded post-tensioned Wall PH6).
These displacement reductions areconsiderably smaller than the displacement reductions of up to 60 percent (on average) that can be achievedby using supplemental frictiondampers or viscous fluid dampers distributed along the height of the wallsas investigated by Kurama.4’5Thus, itis concluded that the use of mild steelreinforcement to reduce the lateral displacements of precast walls in seismicregions may not be as effective as theuse of supplemental dampers distributed along the height.
Note, however, that the use ofbonded mild steel reinforcement in awall may be more cost effective thanthe use of supplemental frictiondampers or viscous fluid dampers, depending on the amount of reduction
needed in the displacements. A cost-benefit analysis may be needed toevaluate the different alternatives inreducing the seismic displacements ofthe wall to a desired target displacement level.
Table 4 shows that the dp value forWall EH4 (with rse = 1.00) is considerably smaller than the Fd values forWalls EH6 and EH1O. This suggeststhat the effectiveness of the mild steelreinforcement in reducing the maximum roof drift may be larger forshort-period structures (with T —0.5second) than for medium- and long-period structures.
For Walls EH6 and EHIO, the 3dp
values are similar, indicating that theeffect of the structure period on the resuits may be small for medium- andlong-period structures (with T> —0.5second). Note that the method used inthe scaling of the ground motionrecords may have an influence onthese findings; however, this is not investigated in this paper.
The rdP value for Wall EM6 isequal to 0.94, indicating that the effectof mild steel reinforcement on themaximum roof drift of walls in regions with moderate seismicity issmall.
Number of Large Roof Drift Peaks
As shown in Fig. 13, the prototypewalls with bonded mild steel reinforcement crossing the horizontaljoints go through significantly fewerlarge roof drift peaks than the wallswithout mild steel reinforcement. Thisis because the response of the wallsdecays faster as a result of the increased energy dissipation with theuse of mild steel.
It is not desirable for a wall to undergo a large number of large drift
peaks during a ground motion becausethis indicates that the dynamic oscillations of the wall may continue for aconsiderable time after the earthquake,which may lead to low-cycle fatigueeffects.23
In order to investigate this effect,Fig. 15 shows the average number ofroof drift peaks, from the dynamicanalyses of the prototype walls underthe seven MIV-scaled ground motionrecords. The horizontal axes show theamplitude of the roof drift peak considered, A, divided by the amplitudeof the largest peak, m (i.e., the peakcorresponding to the maximum roofdrift), during each ground motion.This ratio is referred to as = Ac/Am.
The i value corresponding to avalue in Fig. 15 represents the averagenumber of roof drift peaks with amplitudes greater than or equal to A during the dynamic analyses of the walls.For example, the value for ô = 1.0is equal to 1.0, because this corresponds to the maximum roof drift (i.e.,
= Am) in each dynamic analysis.Similarly, the value correspondingto 5 = 0.50 is equal to the averagenumber of peaks (under the sevenMIV-scaled ground motions) with amplitudes greater than or equal to 0.50times the maximum roof drift duringeach ground motion.
The results in Fig. 15 demonstratethat the decay rate in the displacementresponse of the prototype walls tendsto increase as the amount of mild steelis increased, particularly for walls inregions with high seismicity.
Note that these results do not include the reduction in the maximumroof drift of the walls as a result of themild steel reinforcement. In order toexamine this effect, the horizontalaxes in Fig. 16 show the amplitude ofthe roof drift peak, A, divided by the
Hi,h séismlcity ‘
Four-story - Six-story—
System Wall (percent) ,, ij6 Wl (pt) e -
UP PH4 4.21 jj.00-2.12 P116 35 L00_jj.43- — — -.
— HH6-25 2.13 0.91 1.30
HY — — — — HH6-50 1.90 1 0.82: 1.17-
- HH6-75i34751.07EM EH4 1.94 0.59 1.00 EH6 1.63 0.70 1.00
Ten-story
fm
WaIl (percent)
PHIO 2.28
EHIO 1.56
rd rde
1.00 1.44
Moderate seismicity
Six-story
Wall L(pe1et) F,
PM6 138i.OOi.07
HM6-50; 1.34 I 0.97 1.03
EM6 1.32 0.94 1.000.72 1.00
September-October 2002 53
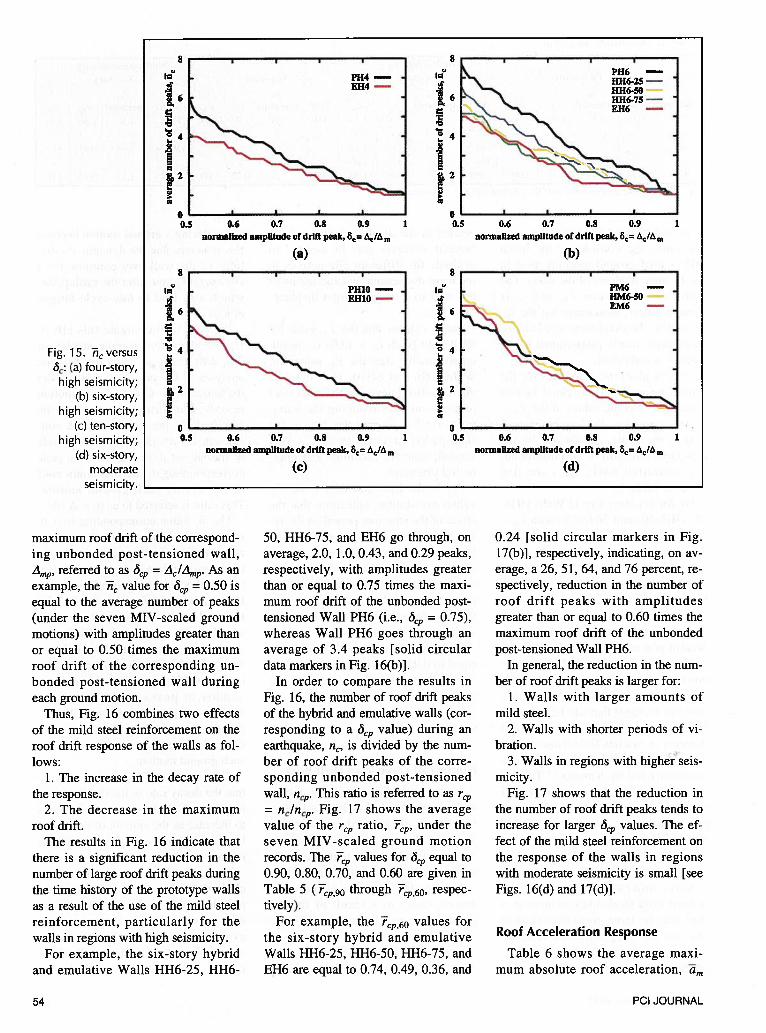
Fig. 15. 75 versusö: (a) four-story,high seismicity;
(b) six-story,high seismicity;
(C) ten—story,high seismicity;
(d) six-story,moderate
seismicity.
maximum roof drift of the corresponding unbonded post-tensioned wall,
referred to as = Ac/Amp. As anexample, the ñ, value for = 0.50 isequal to the average number of peaks(under the seven MIV-scaled groundmotions) with amplitudes greater thanor equal to 0.50 times the maximumroof drift of the corresponding unbonded post-tensioned wall duringeach ground motion.
Thus, Fig. 16 combines two effectsof the mild steel reinforcement on theroof drift response of the walls as follows:
1. The increase in the decay rate ofthe response.
2. The decrease in the maximumroof drift.
The results in Fig. 16 indicate thatthere is a significant reduction in thenumber of large roof drift peaks duringthe time history of the prototype wallsas a result of the use of the mild steelreinforcement, particularly for thewalls in regions with high seismicity.
For example, the six-story hybridand emulative Walls HH6-25, HH6-
50, HH6-75, and EH6 go through, onaverage, 2.0, 1.0, 0.43, and 0.29 peaks,respectively, with amplitudes greaterthan or equal to 0.75 times the maximum roof drift of the unbonded post-tensioned Wall PH6 (i.e., ô,,, = 0.75),whereas Wall PH6 goes through anaverage of 3.4 peaks [solid circulardata markers in Fig. 16(b)].
In order to compare the results inFig. 16, the number of roof drift peaksof the hybrid and emulative walls (corresponding to a t5,,, value) during anearthquake, n, is divided by the number of roof drift peaks of the corresponding unbonded post-tensionedwall, ne,,. This ratio is referred to as
= n/n. Fig. 17 shows the averagevalue of the ratio, 3,, under theseven MIV-scaled ground motionrecords. The values for 5,, equal to0.90, 0.80, 0.70, and 0.60 are given inTable 5 (p,9o through rCP,60, respectively).
For example, the cp6O values forthe six-story hybrid and emulativeWalls HH6-25, HH6-50, HH6-75, andEH6 are equal to 0.74, 0.49, 0.36, and
0.24 [solid circular markers in Fig.17(b)], respectively, indicating, on average, a 26, 51, 64, and 76 percent, respectively, reduction in the number ofroof drift peaks with amplitudesgreater than or equal to 0.60 times themaximum roof drift of the unbondedpost-tensioned Wall PH6.
In general, the reduction in the number of roof drift peaks is larger for:
1. Walls with larger amounts ofmild steel.
2. Walls with shorter periods of vibration.
3. Walls in regions with higheiseismicity.
Fig. 17 shows that the reduction inthe number of roof drift peaks tends toincrease for larger values. The effect of the mild steel reinforcement onthe response of the walls in regionswith moderate seismicity is small [seeFigs. 16(d) and 17(d)].
Roof Acceleration Response
Table 6 shows the average maximum absolute roof acceleration, m
In
4
normalized amplitude of drift peak, c tcm
(a)
8
In
Bn
t8
In
‘0Cj4
1
0.6 0.7 0.8 0.9normalized amplitude of drift peak, 6c m
(b)
In
IBaa
00.5 0.6 0.7 0.8 0.9
normalized amplitude of drift peak, 8= CIm
(c)
0.6 0.7 0.8 0.9normalized amplitude of drift peak, 6= c’m
(d)
54 PCI JOURNAL

8
Fig. 16. —nversus(a) four-story,high seismicity;(b) six-story,high seismicity;(C) ten—story,high seismicity;(d) six-story,moderateseismicity.
Fig. 17.versus(a) four—story,high seismicity;(b) six-story,high seismicity;(C) ten—story,high seismicity;(d) six-story,moderateseismicity.
In
IIn
I:a
a00.5
8
In
a6I..
I
0.6 0.7 0.8 0.9normalized amplitude of drift peak, 8cp’ mp
(a)8
(b)
0.6 0.7 0.8 0.9normalized amplitude of drift peak, 8cp’ cmp
(c)
00.5 0.6 0.7 0.8 0.9
normalized amplitude of drift peak, 5= tic/Am1,
1.4
I
(d)
EH4IPH4 —1.2a
. 1.0
0.8
0.6
0.4
0.2
1.2a
0
0
:::0.4
0.2a
£1
0.5 0.6 0.7 0.8 0.9normalized amplitude of drift peak, Ac/Amp
1
(a)
0.5 0.6 0.7 0.8 0.9normalized amplitude of drift peak, 6= Ac/Amp
(b)
a1.2
&1.0
00.8
‘p0.6
0.4
0.2
EH1O/PH1O —
1.4
a,,j 1.2
&. 1.00, 0.8
0.6
0.4
a
0.5 0.6 0.7 0.8 0.9
normalized amplitude of drift peak, C= Acmp
1
(c)
0.5 0.6 0.7 0.8 0.9
normalized amplitude of drift peak,8q= Ar/A,
(d)
September-October 2002 55

Table 5. Number of roof drift peaks.
High seismicity Moderate seismicityFour-story Six.story Ten.story Six.story
Wall 1cp,9O r,8o Tq,,70 1ep,6O Wall 1cp,7O 6[Wa p,9O 1cp,80 ‘cp,7O1ep.6O Wall p,9O r.8o cp,7O F,6oPH4 1.00 1.00 1.00 1.00 PH6 1.00 1.00 1.00 TPH1O 1.00 1.00 1.00 1.00 PM6f 1.00 1.00 1.00 1.00-
— ———HH6-25?ii0.63 0.58074 —. — — — — — — — — —
— ———--IHTH6-50 0.140.140.390.49 — HM6-500.82 0.87 0.81 1.25
HH6-75 0.00 0.140.160.36 — — — — —
EH4 0.00 0.00 0.12 0.18 EH6 0.00 0.00 0.13 0.24 EH1O 0.00 0.29 0.21 0.30 EM6 0.57 0.75 0.81 0.76
(where the absolute acceleration is calculated as the relative acceleration ofthe roof with respect to the groundplus the ground acceleration), from thedynamic analyses of the prototypewalls under the seven MIV-scaledground motion records.
In order to compare the responses,the maximum roof accelerations of thewalls during each ground motion, am,are divided by the maximum roof acceleration of the corresponding unbonded post-tensioned wall, amp. Thisratio is referred to as rap = am/amp.
Similarly, the rae ratio is calculatedby dividing the maximum roof accelerations of the walls, am, by the maximum roof acceleration of the corresponding emulative wall, ame. Theaverage values rap and ae based onthe results obtained using the sevenMIV-scaled ground motions are givenin Table 6.
The results indicate that, on average,there is a reduction in the maximumroof acceleration of the walls as theamount of mild steel reinforcement isincreased (except for Wall HH6-25).
PRELIMINARY DESIGNIMPLICATIONS
The results of this investigationshow that significant reductions in thelateral displacements of post-tensioned precast walls under earthquakeloading can be achieved by usingbonded mild steel reinforcementcrossing the horizontal joints of thewalls. Thus, hybrid precast concretewalls represent a viable primary lateral load resisting system for use inseismic regions.
The amount of mild steel reinforcement needed in a wall depends on theamount of reduction needed in the lateral displacements. As compared withmonolithic cast-in-place reinforced
concrete walls, the amount of mildsteel that would be needed in a hybridprecast wall is smaller because a portion of the flexural strength of the wallto resist lateral loads is provided bythe post-tensioning steel.
For the prototype walls investigatedin this paper, mild steel reinforcementis not needed for walls in regions withmoderate seismicity. For walls in regions with high seismicity, further research is needed to develop an approach for the seismic design of themild steel reinforcement to achieve atarget reduction in the lateral displacements, similar to the design approaches developed for walls withsupplemental friction dampers andviscous fluid dampers as described byKurama.4’5
The results presented in this paperindicate that considerable reductionsin lateral displacements of the wallscan be achieved by using at least 0.50times the amount of mild steel used inthe corresponding emulative wall.
The most important horizontal jointfor the use of the bonded mild steel reinforcement is the base-panel-to-foundation joint. The reinforcement usedin a wall should be properly anchoredto the foundation and should be extended to a sufficient height above thebase of the wall to allow for the development of the yield strength of thesteel in tension and compression at thebase-panel-to-foundation joint.
Note that the termination of the mildsteel reinforcement over the height of awall results in a reduction in the flexural strength of the wall cross sectionwhere the bars are terminated. Thismay lead to the opening of gaps alongthe upper floor joints of the wall largerthan the gaps along the lower floorjoints, even though the design momentis expected to decrease from the bottom (i.e., base) to the top of the wall.
The opening of large gaps along theupper floor joints of a wall is undesirable because the steel and concretestrains to attain a given lateral displacement at the roof would be greatlyincreased, resulting in the need for expensive special detailing. For example, heavy spiral reinforcement maybe needed to confine the concrete inthe upper story wall panels.
It would be more rational to ensurethat the gap opening decreases fromthe bottom to the top of a wall by extending the mild steel reinforcementused at the base up to a sufficientheight of the wall. Bar termination(i.e., cut-off) points may be staggeredto achieve a reasonable curtailmentpattern for the reinforcement over thewall height [see Fig. 1 (b)1. The designapproach developed for the mild steelreinforcement should include a procedure to determine where the bars maybe terminated.
CONCLUSIONSThis paper has investigated the ex
pected seismic behavior of twelve prototype precast walls with differentamounts of unbonded post-tensioningsteel and bonded mild steel reinforcement, including walls that emulate thebehavior of monolithic cast-in-placereinforced concrete walls (i.e., emulative precast walls). Based on the results of the investigation, the following conclusions can be drawn:
1. Nonlinear static reversed cycliclateral load analyses show that the inelastic energy dissipation of unbondedpost-tensioned precast walls can besignificantly increased by usingbonded mild steel reinforcementcrossing the horizontal joints. It maybe possible to increase the energy dissipation of the walls to considerablelevels by providing 0.50 to 0.75 times
56 PCI JOURNAL
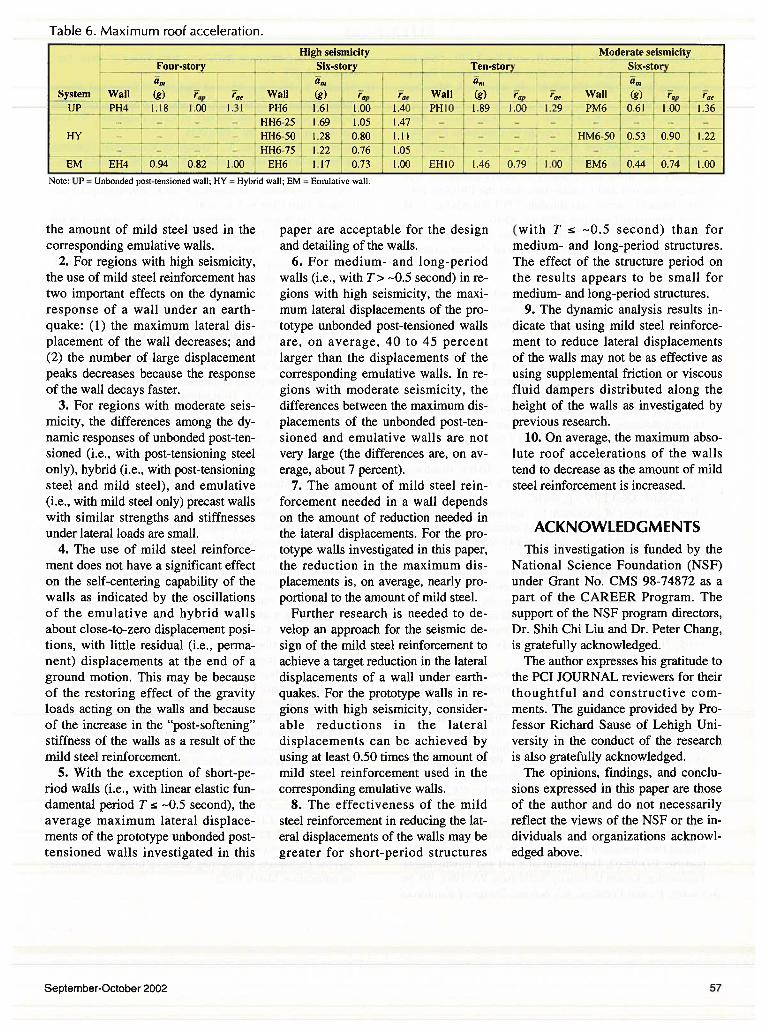
Table 6. Maximum roof acceleration.
Note: UP = Unbonded post-tensioned wall; HY = Hybrid wall; EM = Emulative wall.
the amount of mild steel used in thecorresponding emulative walls.
2. For regions with high seismicity,the use of mild steel reinforcement hastwo important effects on the dynamicresponse of a wall under an earthquake: (1) the maximum lateral displacement of the wall decreases; and(2) the number of large displacementpeaks decreases because the responseof the wall decays faster.
3. For regions with moderate seismicity, the differences among the dynamic responses of unbonded post-tensioned (i.e., with post-tensioning steelonly), hybrid (i.e., with post-tensioningsteel and mild steel), and emulative(i.e., with mild steel only) precast wallswith similar strengths and stiffnessesunder lateral loads are small.
4. The use of mild steel reinforcement does not have a significant effecton the self-centering capability of thewalls as indicated by the oscillationsof the emulative and hybrid wallsabout close-to-zero displacement positions, with little residual (i.e., permanent) displacements at the end of aground motion. This may be becauseof the restoring effect of the gravityloads acting on the walls and becauseof the increase in the “post-softening”stiffness of the walls as a result of themild steel reinforcement.
5. With the exception of short-period walls (i.e., with linear elastic fundamental period T —0.5 second), theaverage maximum lateral displacements of the prototype unbonded post-tensioned walls investigated in this
paper are acceptable for the designand detailing of the walls.
6. For medium- and long-periodwalls (i.e., with T> —0.5 second) in regions with high seismicity, the maximum lateral displacements of the prototype unbonded post-tensioned wallsare, on average, 40 to 45 percentlarger than the displacements of thecorresponding emulative walls. In regions with moderate seismicity, thedifferences between the maximum displacements of the unbonded post-tensioned and emulative walls are notvery large (the differences are, on average, about 7 percent).
7. The amount of mild steel reinforcement needed in a wall dependson the amount of reduction needed inthe lateral displacements. For the prototype walls investigated in this paper,the reduction in the maximum displacements is, on average, nearly proportional to the amount of mild steel.
Further research is needed to develop an approach for the seismic design of the mild steel reinforcement toachieve a target reduction in the lateraldisplacements of a wall under earthquakes. For the prototype walls in regions with high seismicity, considerable reductions in the lateraldisplacements can be achieved byusing at least 0.50 times the amount ofmild steel reinforcement used in thecorresponding emulative walls.
8. The effectiveness of the mildsteel reinforcement in reducing the lateral displacements of the walls may begreater for short-period structures
(with T —0.5 second) than formedium- and long-period structures.The effect of the structure period onthe results appears to be small formedium- and long-period structures.
9. The dynamic analysis results indicate that using mild steel reinforcement to reduce lateral displacementsof the walls may not be as effective asusing supplemental friction or viscousfluid dampers distributed along theheight of the walls as investigated byprevious research.
10. On average, the maximum absolute roof accelerations of the wallstend to decrease as the amount of mildsteel reinforcement is increased.
ACKNOWLEDGMENTSThis investigation is funded by the
National Science Foundation (NSF)under Grant No. CMS 98-74872 as apart of the CAREER Program. Thesupport of the NSF program directors,Dr. Shih Chi Liu and Dr. Peter Chang,is gratefully acknowledged.
The author expresses his gratitude tothe PCI JOURNAL reviewers for theirthoughtful and constructive comments. The guidance provided by Professor Richard Sause of Lehigh University in the conduct of the researchis also gratefully acknowledged.
The opinions, findings, and conclusions expressed in this paper are thoseof the author and do not necessarilyreflect the views of the NSF or the individuals and organizations acknowledged above.
High seismicity Moderate seismicity
Four-story Six-story Ten-story Sx-story
System Wall(g) a WalI(g) i Wall(g)
UP PH4 1.18 1.00 1.31 PH6 1.61 1.00 1.40 PHIO 1.89 1.00 1.29 PM6 0.61 1.00 1.36
— ——
— HH6-25’l.691.05 1.47 — — . — — —
HY —
— —— HH6-50 1.28 0.80 1.11 — — — — HM6-50 0.53 0.90 1.22
.---- HH6-75i.220.76i5-r--,-
EM EH4 0.94 0.82 1.00 EH6 1.17 0.73 1.00 EHIO 1.46 0.79 1.00 EM6 0.44 0.74 1.00
September-October 2002 57

REFERENCES
1. Kurama, Y., Pessiki, S., Sause, R., and Lu, L. W., “SeismicBehavior and Design of Unbonded Post-Tensioned PrecastConcrete Walls,” PCI JOURNAL, V. 44, No. 3, May-June1999, PP. 72-89.
2. Kurama, Y., Sause, R., Pessiki, S., and Lu, LW., “LateralLoad Behavior and Seismic Design of Unbonded Post-Tensioned Precast Concrete Walls,” ACI Structural Journal, V.96, No. 4, July-August 1999, pp. 622-632.
3. Priestley, M., Sritharan, S., Conley, J., and Pampanin, S., “Preliminary Results and Conclusions from the PRESSS Five-Story Precast Concrete Test Building,” PCI JOURNAL, V. 44,No. 6, November-December 1999, pp. 42-67.
4. Kurama, Y., “Simplified Seismic Design Approach for Friction-Damped Unbonded Post-Tensioned Precast ConcreteWalls,” ACI Structural Journal, V. 98, No. 5, September-October 2001, pp. 705-7 16.
5. Kurama, Y., “Seismic Design of Unbonded Post-TensionedPrecast Walls with Supplemental Viscous Damping,” ACIStructural Journal, V. 97, No. 4, July-August 2000, pp. 648-658.
6. Perez, F., “Lateral Load Behavior of Precast Concrete Wallswith Ductile Vertical Joint Connectors,” M.S. Thesis, Department of Civil and Environmental Engineering, Lehigh University, Bethlehem, PA, December 1998, 201 pp.
7. Stone, W., Cheok, G., and Stanton, J., “Performance of HybridMoment-Resisting Precast Beam-Column Concrete Connections Subjected to Cyclic Loading,” ACI Structural Journal, V.91, No. 2, March-April 1995, pp. 229-249.
8. Stanton, J.. Stone, W., and Cheok, G., “A Hybrid ReinforcedPrecast Frame for Seismic Regions,” PCI JOURNAL, V. 42,No. 2, March-April 1997, pp. 20-32.
9. Cheok, G., Stone, W., Kunnath, S., “Seismic Response of Precast Concrete Frames with Hybrid Connections,” ACJ Structural Journal, V. 95, No. 5, September-October 1998, pp. 527-539.
10. Nakaki, S. D., Stanton, J. F., and Sritharan, S., “An Overviewof the PRESSS Five-Story Precast Test Building,” PCI JOURNAL, V. 44, No. 2, March-April 1999, pp. 26-39.
11. Cheok, G., Stone, W., and Nakaki, S., “Simplified Design Procedure for Hybrid Precast Concrete Connections,” NISTIR5765, National Institute of Standards and Technology,Gaithersburg, MD, 1996, 81 pp.
12. ACT Innovation Task Group 1 and Collaborators, “Special Hybrid Moment Frames Composed of Discretely Jointed Precastand Post-Tensioned Concrete Members (ACI T1.2-XX) andCommentary (Tl .2R-XX) (draft),” ACI Structural Journal, V.98, No. 5, September-October 2001, pp. 77 1-784.
13. Stanton, J. and Nakaki, S., “Design Guidelines for PrecastConcrete Seismic Structural Systems,” PRESSS Report No.01/03-09, UW Report No. SM 02-02, Department of Civil Engineering, University of Washington, Seattle, WA, February2002.
14. Kurama, Y., Pessiki, S., Sause, R., Lu, L. W., and El-Sheikh.,M., “Analytical Modeling and Lateral Load Behavior of Un-bonded Post-Tensioned Precast Concrete Walls,” Research Report No. EQ-96-02, Department of Civil and EnvironmentalEngineering, Lehigh University, Bethlehem, PA, 1996, 191 pp.
15. Paulay, P., and Priestley, M., Seismic Design of Reinforced
Concrete and Masonry Buildings, John Wiley & Sons, Inc.,New York, NY, 1992.
16. Mander, J., Priestley, M., and Park, R., “Theoretical Stress-Strain Model for Confined Concrete,” Journal of StructuralEngineering, American Society of Civil Engineers, V. 114,No. 8, August 1988, pp. 1804-1826.
17. Allen, M., and Kurama, Y., “Design of Rectangular Openingsin Precast Walls Under Combined Vertical and Lateral Loads,”PCI JOURNAL, V. 47, No. 2, March-April 2002, pp. 58-83.
18. ICC, International Building Code 2000, International CodeCouncil, Falls Church, VA, 2000.
19. Au, A., and Wight, J., “Reinforced Concrete Structural Wallswith Staggered Opening Configurations Under ReversedCyclic Loading,” Report No. UMCE 90-05, Department ofCivil Engineering, University of Michigan, Ann Arbor, MI,April 1990, 241 pp.
20. Thomsen IV, J., and Wallace J., “Displacement-Based Designof RC Structural Walls: An Experimental Investigation ofWalls with Rectangular and T-Shaped Cross-Sections,” ReportNo. CU/CEE-95/06, Department of Civil and EnvironmentalEngineering, Clarkson University, Potsdam, NY, June 1995.
21. Sittipunt, C., and Wood, S., “Influence of Web Reinforcementon the Cyclic Response of Structural Walls,” ACI StructuralJournal, V. 92, No. 6, November-December 1995, pp. 745-756.
22. Taylor, C., Cote, P., and Wallace, J., “Design of Slender Reinforced Concrete Walls with Openings,” ACI StructuralJournal, V. 95, No. 4, July-August 1998, pp. 420-433.
23. ACT Innovation Task Group 1 and Collaborators, “AcceptanceCriteria for Moment Frames Based on Structural Testing(T1.l-01) and Commentary (T1.1R-01),” American ConcreteInstitute, Farmington Hills, MI, 2001, 10 pp.
24. Kurama, Y., Sause, R., Pessiki, S., Lu, L. W., and El-Sheikh,M., “Seismic Design and Response Evaluation of UnbondedPost-Tensioned Precast Concrete Walls,” Research Report No.EQ-97-01, Department of Civil and Environmental Engineering, Lehigh University, Bethlehem, PA, 1997, 184 pp.
25. Clough, R., and Penzien, J., Dynamics of Structures, McGraw-Hill, Inc., New York, NY, 1993.
26. Farrow, K., and Kurama, Y., “Capacity-Demand Index Relationships for Performance-Based Seismic Design,” StructuralEngineering Research Report #NDSE-01-02, Department ofCivil Engineering and Geological Sciences, University ofNotre Dame, Notre Dame, IN, November 2001, (available fordownload at www.nd.edu/—concrete).
27. Farrow, K., and Kurama, Y., “Ground Motion Scaling Methods for Different Structure Characteristics and Site Conditions,” Earthquake Engineering and Structural Dynamics(submitted for publication, March 2002).
28. Shome, N., and Cornell, C., “Normalization and Scaling Accelerograms for Nonlinear Structural Analysis,” Sixth U.S. National Conference on Earthquake Engineering, Seattle, WA,May-June 1988 (CD-ROM).
29. Farrow, K., and Kurama, Y., “Capacity-Demand Index Relationships for Performance-Based Seismic Design,” EarthquakeSpectra, Earthquake Engineering Research Institute (submittedfor publication, March 2002).
58 PCI JOURNAL

APPENDIX A — NOTATION
am = maximum absolute roof acceleration= average am under seven MIV-scaled ground mo
tionsame = maximum absolute roof acceleration of emula
tive wallamp maximum absolute roof acceleration of un
bonded post-tensioned walla = area of a post-tensioning bardh = normalized inelastic energy dissipationdhp = normalized inelastic energy dissipation of un
bonded post-tensioned wallD unfactored design dead load
= inelastic energy dissipation per loading cycle= Young’s modulus for concrete
E = Young’s modulus for post-tensioning steel= post-yield stiffness of truss elements modeling
post-tensioning barsE5 Young’s modulus for mild reinforcing steel
f’ = unconfined concrete compressive strength
f = concrete tensile strength
f = initial stress in post-tensioning bars
f = ultimate strength of post-tensioning steel
f = yield strength of post-tensioning steel= ultimate strength of mild reinforcing steel
f = yield strength of mild reinforcing steelg = gravitational accelerationGd = axial force near base of wall due to unfactored
design dead loadsG1 axial force near base of wall due to unfactored
unreduced design live loadsksec = secant stiffness of equivalent linear elastic sys
tem1 = wall lengthL = unfactored unreduced design live loadMIV = maximum incremental velocity
= number of roof drift peaks= average n, under seven MIV-scaled ground mo
tions= number of roof drift peaks of unbonded post-ten
sioned wallpeak ground accelerationpeak ground velocityam/a,,
average rae under seven MIV-scaled ground motions
rap = am/a
= average rap under seven MIV-scaled ground motions
=
= average i-1, under seven MIV-scaled ground motions
for 5= 0.60for ô,= 0.70for = 0.80for ,= 0.90
4mMmeaverage rde under seven MIV-scaled ground motions
r, AmMmprdp = average r, under seven MIV-scaled ground mo
tions
dhIdh for first roof drift cycledh/dh for second roof drift cycledh/dh for third roof drift cycledh/dhp for fourth roof drift cycle
Ps’Pseresponse modification coefficienttimewall thicknessfundamental (i.e., first) linear elastic periodenergy absorbed by equivalent linear elastic systembase shear forcerelative energy dissipation ratio
1IcMmproof driftmaximum roof drift reached during a loadingcycle/amplitude of roof drift peak
4n = maximum roof drift during dynamic response= average 4m under seven MIV-scaled ground mo
tions= maximum roof drift during dynamic response of
emulative wall
4mp = maximum roof drift during dynamic response ofunbonded post-tensioned wall
= strain corresponding tof= yield strain of post-tensioning steel= viscous damping ratio
p, = post-tensioning steel ratio= mild reinforcing steel ratio
Pse = mild reinforcing steel ratio of emulative wall= spiral reinforcement ratio
r,6o =
r7o —
rgo =
=
rde =
rde =
rhP
rhP, 1
rhP,2
rhP, 3
rhP,4
rse
R
twTUeV
13ococp4
PGA =
PGV =
rae —
rae —
September-October 2002 59