C I A L IS S U E P S AHEAICS - Improbable Research · One page is filled with 87 cartoon faces,...
5
0 2 74470 88921 07 > S P E C I A L I S S U E JULY | AUGUST 2010 (volume 16, number 4) $6.50 US | $9.50 CAN Chernoff Faces, Horse Calculus, Cocker’s Arithmetick…
Transcript of C I A L IS S U E P S AHEAICS - Improbable Research · One page is filled with 87 cartoon faces,...

0 274470 88921
07>
SPE
CIAL ISSUE
mathematics
JULY|AUGUST 2010 (volume 16, number 4) $6.50 US|$9.50 CAN
Chernoff Faces, Horse Calculus,
Cocker’s Arithmetick…
6 | Annals of Improbable Research | July–August 2010 | vol. 16, no. 4 www.improbable.com
Chernoff and the Face Value of NumbersA way to make statistics of good, and bad, demeanor by Alice Shirrell Kaswell, Improbable Research staff
A smiley-face is very expressive, statistically. By tweaking the eyes, mouth and other bits, you can literally put a meaningful face on any jumble of numbers. Herman Chernoff pointed this out in 1973 in the Journal of the American Statistical Association, in a monograph called
“The Use of Faces to Represent Points in K-Dimensional Space Graphically.”Susequently, folks took to calling these things Chernoff faces. Chernoff faces can make statistical analysis into a recognizably human activity.Most people, when shown some statistics, sigh and get boggled. But Herman Chernoff realized that almost everyone is good at reading faces. So he devised recipes to convert any set of statistics into an equivalent bunch of smiley-face drawings.
The face of Herman Chernoff, the inventor of Chernoff faces. Drawing: Nan Swift, Improbable Research staff.
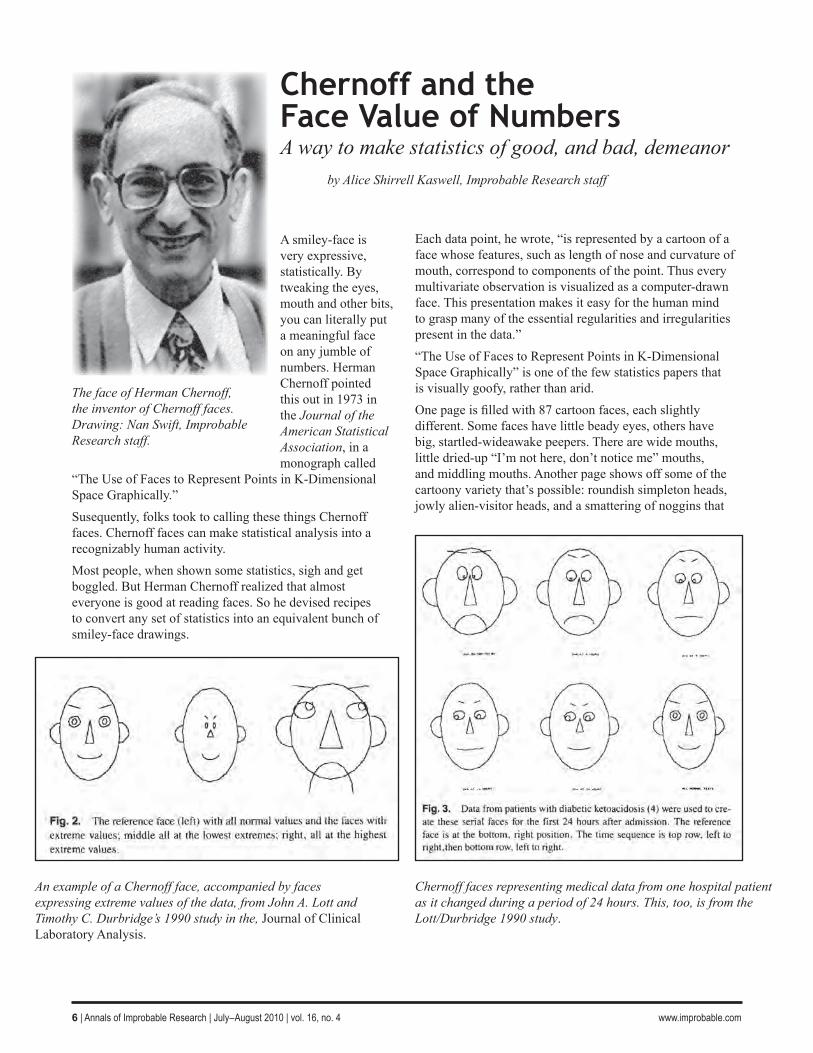
An example of a Chernoff face, accompanied by faces expressing extreme values of the data, from John A. Lott and Timothy C. Durbridge’s 1990 study in the, Journal of Clinical Laboratory Analysis.
Chernoff faces representing medical data from one hospital patient as it changed during a period of 24 hours. This, too, is from the Lott/Durbridge 1990 study.
Each data point, he wrote, “is represented by a cartoon of a face whose features, such as length of nose and curvature of mouth, correspond to components of the point. Thus every multivariate observation is visualized as a computer-drawn face. This presentation makes it easy for the human mind to grasp many of the essential regularities and irregularities present in the data.”“The Use of Faces to Represent Points in K-Dimensional Space Graphically” is one of the few statistics papers that is visually goofy, rather than arid.Onepageisfilledwith87cartoonfaces,eachslightlydifferent. Some faces have little beady eyes, others have big, startled-wideawake peepers. There are wide mouths, little dried-up “I’m not here, don’t notice me” mouths, and middling mouths. Another page shows off some of the cartoony variety that’s possible: roundish simpleton heads, jowly alien-visitor heads, and a smattering of noggins that

Annals of Improbable Research | July–August 2010 | vol. 16, no. 4 | 7 www.improbable.com
look froggy. Elsewhere, the study perhaps inevitably includes conventional statistics machinery — charts of numbers, differential and intergral calculus equations, and plenty of technical lingo.Chernoff discovered, by experiment, that people could comfortably interpret a face that expresses quite large amounts of data. “At this point,” he wrote, “one can treat up to 18 variables, but it would be relatively easy to increase that number by adding other features such as ears, hair, [and] facial lines.”The world has gone on to employ Chernoff faces a little, but not yet a lot. A 1981 report in the Journal of Marketing, for
example,usedthemtodisplaycorporatefinancialdata,withthis explanation: “From Year 5 to Year 1, the nose narrows as well as increases in length, and the eccentricity of the eyes increases. Respectively, these facial features represent a decrease in total assets, an increase in the ratio of retained earningstototalassets,andanincreaseincashflow.”A note at the very end of Chernoff’s 1973 paper hints at a practical reason why his idea would not catch on immediately: “At this time the cost of drawing these faces is about 20 to 25 cents per face on the IBM 360-67 at Stanford University using the Calcomp Plotter. Most of this cost is in the computing, and I believe that it should be possible to reduce it considerably.”
Chernoff faces representing data about a series of Swiss bank notes, some real, some forged, from Bernhard Flury and Hans Riedwyl,’s 1981 study in the Journal of the American Statistical Association. The main variables are: Xl length of the bank noteX2 width of the bank note, measured on the left sideX3 width of the bank note, measured on the right sideX4 width of the lower marginX5 width of the upper marginX6 length of the print diagonal from the lower left to the upper right corner

8 | Annals of Improbable Research | July–August 2010 | vol. 16, no. 4 www.improbable.com
Chernoff faces made from data gathered by measuring rocks, and presented in Chernoff’s original paper in the Journal of the American Statistical Association. The paper explains that “Eight measurements were made on each of 88 nummulited specimens from the Eocene Yellow Limestone Formation of northwestern Jamaica.”
Using Chernoff faces to present several years of a company’s financial data, from David L. Huff, Vijay Mahajan and William C. Black’s 1981 study in the Journal of Marketing.

Annals of Improbable Research | July–August 2010 | vol. 16, no. 4 | 9 www.improbable.com
References“The Use of Faces to Represent Points in K-Dimensional Space Graphically,” Herman Chernoff, Journal of the American Statistical Association, vol. 68, no. 342, 1973, pp. 361–8.“Facial Representation of Multivariate Data,” David L. Huff, Vijay Mahajan and William C. Black, Journal of Marketing, vol. 45, no. 4, Autumn 1981, pp. 53-9.“Use of Chernoff Faces to Follow Trends in Laboratory Data,” John A. Lott and Timothy C. Durbridge, Journal of Clinical Laboratory Analysis, 1990, pp. 459-63. The authors are at Ohio State University in the USA and the Institute of Medical and Veterinary Sciences in Adelaide, Australia.“Graphical Representation of Multivariate Data by Means of Asymmetrical Faces,” Bernhard Flury and Hans Riedwyl, Journal of the American Statistical Association, vol. 76, no. 376, December 1981, pp. 757-65. The authors are at the University of Berne, Switzerland.
< Chernoff faces representing data about several American cities, also, from the Flury/Riedwyl 1981 study.
The variables Flury and Ridwyl used in representing data about those American cities as Chernoff faces.
<