C h a p t e r sixteen © 2006 Prentice Hall Business Publishing Economics R. Glenn Hubbard, Anthony...
19
c h a p t e r c h a p t e r sixteen sixteen © 2006 Prentice Hall Business Publishing Economics R. Glenn Hubbard, Anthony Patrick O’Brien—1 st ed. Prepared by: Fernando & Yvonn Quijano Inflation, Unemployment, and Federal Reserve Policy
-
date post
20-Dec-2015 -
Category
Documents
-
view
214 -
download
1
Transcript of C h a p t e r sixteen © 2006 Prentice Hall Business Publishing Economics R. Glenn Hubbard, Anthony...
c h a p t e rc h a p t e r
sixteensixteen
© 2006 Prentice Hall Business Publishing Economics R. Glenn Hubbard, Anthony Patrick O’Brien—1 st ed.
Prepared by: Fernando & Yvonn Quijano
Inflation, Unemployment, and Federal Reserve Policy
2 of 26© 2006 Prentice Hall Business Publishing Economics R. Glenn Hubbard, Anthony Patrick O’Brien—1 st ed.
CH
AP
TE
R 1
6:
Infl
atio
n,
Un
emp
loym
ent
and
F
eder
al R
eser
ve P
oli
cyThe Discovery of the Short-Run Tradeoff Between Unemployment and Inflation
Phillips curve A curve showing the short-run relationship between the unemployment rate and the inflation rate.
LEARNING OBJECTIVE1
3 of 26© 2006 Prentice Hall Business Publishing Economics R. Glenn Hubbard, Anthony Patrick O’Brien—1 st ed.
CH
AP
TE
R 1
6:
Infl
atio
n,
Un
emp
loym
ent
and
F
eder
al R
eser
ve P
oli
cyThe Discovery of the Short-Run Tradeoff Between
Unemployment and Inflation
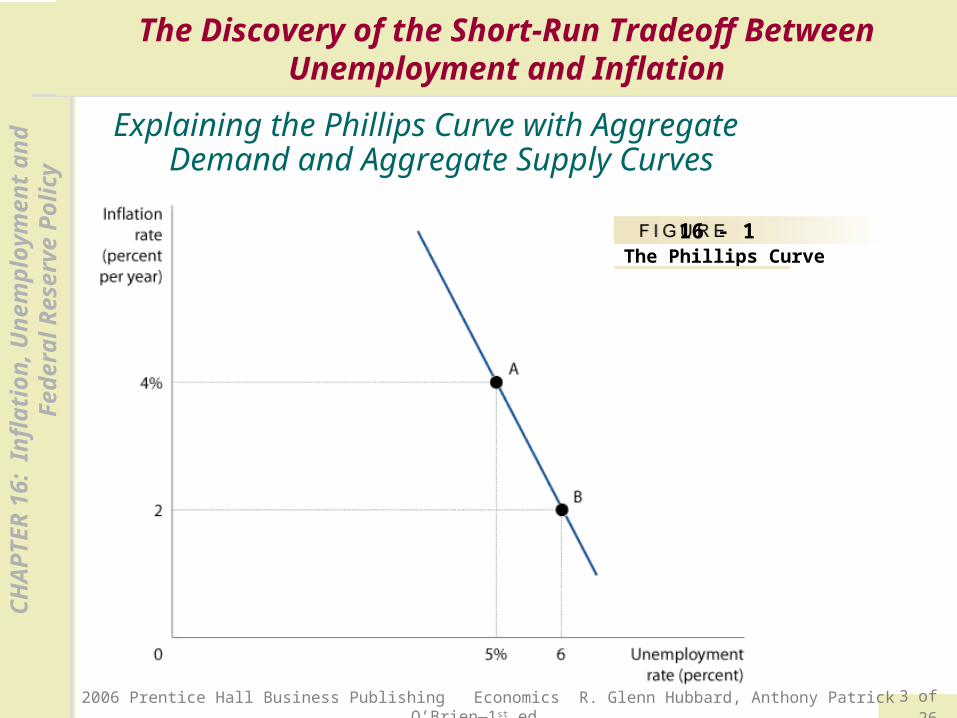
16 - 1The Phillips Curve
Explaining the Phillips Curve with Aggregate Demand and Aggregate Supply Curves
4 of 26© 2006 Prentice Hall Business Publishing Economics R. Glenn Hubbard, Anthony Patrick O’Brien—1 st ed.
CH
AP
TE
R 1
6:
Infl
atio
n,
Un
emp
loym
ent
and
F
eder
al R
eser
ve P
oli
cyThe Discovery of the Short-Run Tradeoff Between
Unemployment and Inflation
Is the Phillips Curve a Policy Menu?
Structural relationship A relationship that depends on the basic behavior of consumers and firms and remains unchanged over long periods.
The Policy Menu View of the Phillips Curve
16 - 1
LEARNING OBJECTIVE1
5 of 26© 2006 Prentice Hall Business Publishing Economics R. Glenn Hubbard, Anthony Patrick O’Brien—1 st ed.
CH
AP
TE
R 1
6:
Infl
atio
n,
Un
emp
loym
ent
and
F
eder
al R
eser
ve P
oli
cyThe Discovery of the Short-Run Tradeoff Between
Unemployment and Inflation
Is the Short-Run Phillips Curve Stable?
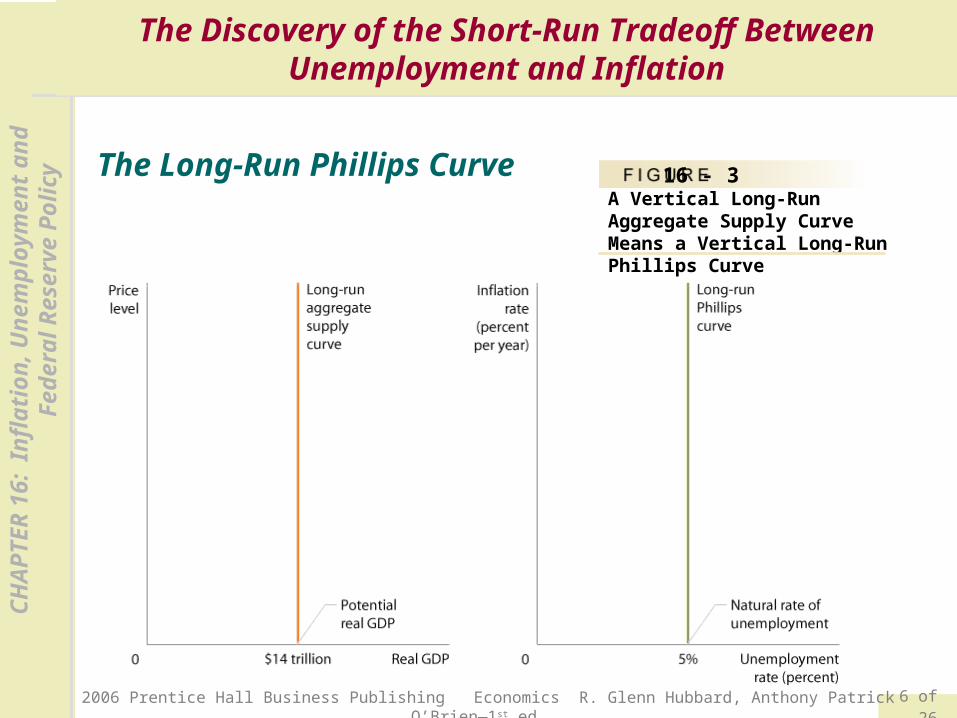
The Long-Run Phillips Curve
Natural rate of unemployment The unemployment rate that exists when the economy is at potential GDP.
6 of 26© 2006 Prentice Hall Business Publishing Economics R. Glenn Hubbard, Anthony Patrick O’Brien—1 st ed.
CH
AP
TE
R 1
6:
Infl
atio
n,
Un
emp
loym
ent
and
F
eder
al R
eser
ve P
oli
cyThe Discovery of the Short-Run Tradeoff Between
Unemployment and Inflation
The Long-Run Phillips Curve 16 - 3A Vertical Long-Run Aggregate Supply Curve Means a Vertical Long-Run Phillips Curve

7 of 26© 2006 Prentice Hall Business Publishing Economics R. Glenn Hubbard, Anthony Patrick O’Brien—1 st ed.
CH
AP
TE
R 1
6:
Infl
atio
n,
Un
emp
loym
ent
and
F
eder
al R
eser
ve P
oli
cyThe Discovery of the Short-Run Tradeoff Between
Unemployment and Inflation
The Role of Expectations of Future Inflation
NOMINAL WAGE
EXPECTED REAL WAGE
ACTUAL REAL WAGE
ACTUAL REAL WAGE
Expected P2009 = 105
Expected Inflation = 5%
Actual P2009 = 102
Actual Inflation = 2%
Actual P2009 = 108
Actual Inflation = 8%
$31.50
IF… THEN… AND…
actual inflation is greater than expected inflation,
the actual real wage is less than the expected real wage, the unemployment rate falls.
actual inflation is less than expected inflation,
the actual real wage is greater than the expected real wage,
the unemployment rate rises.
The Impact of Unexpected Price Level Changes on the Real Wage
16 – 1
The Basis for the Short-Run Phillips Curve
16 – 2
$31.50100 $30
105
$31.50100 $30.88
102
$31.50100 $29.17
108
8 of 26© 2006 Prentice Hall Business Publishing Economics R. Glenn Hubbard, Anthony Patrick O’Brien—1 st ed.
CH
AP
TE
R 1
6:
Infl
atio
n,
Un
emp
loym
ent
and
F
eder
al R
eser
ve P
oli
cyThe Short-Run and Long-Run Phillips Curves
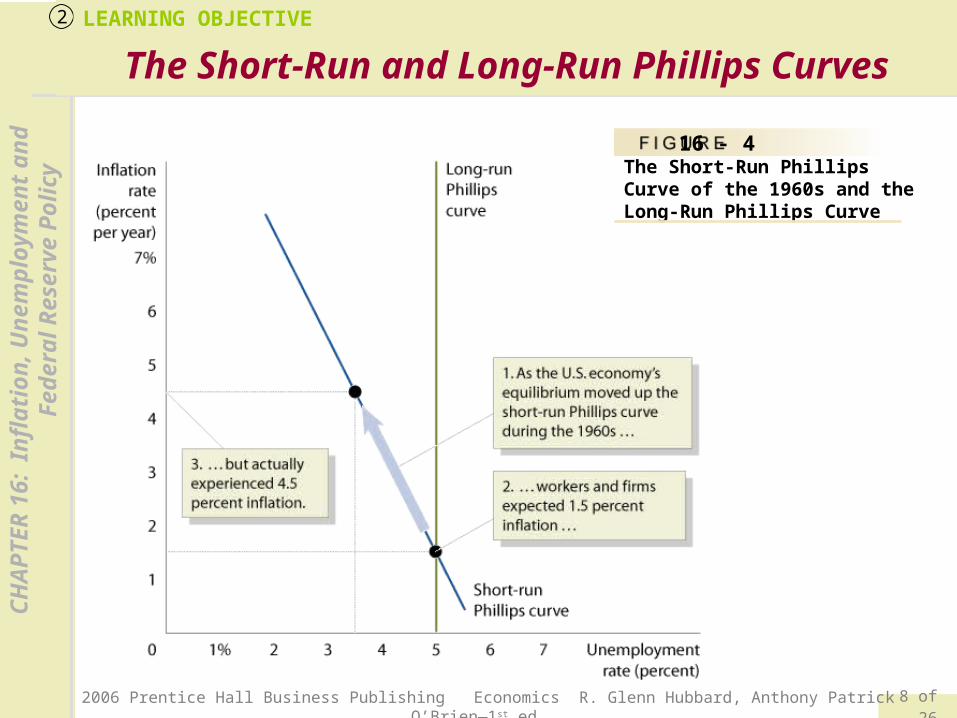
LEARNING OBJECTIVE2
16 - 4The Short-Run Phillips Curve of the 1960s and the Long-Run Phillips Curve
9 of 26© 2006 Prentice Hall Business Publishing Economics R. Glenn Hubbard, Anthony Patrick O’Brien—1 st ed.
CH
AP
TE
R 1
6:
Infl
atio
n,
Un
emp
loym
ent
and
F
eder
al R
eser
ve P
oli
cyThe Short-Run and Long-Run Phillips Curves
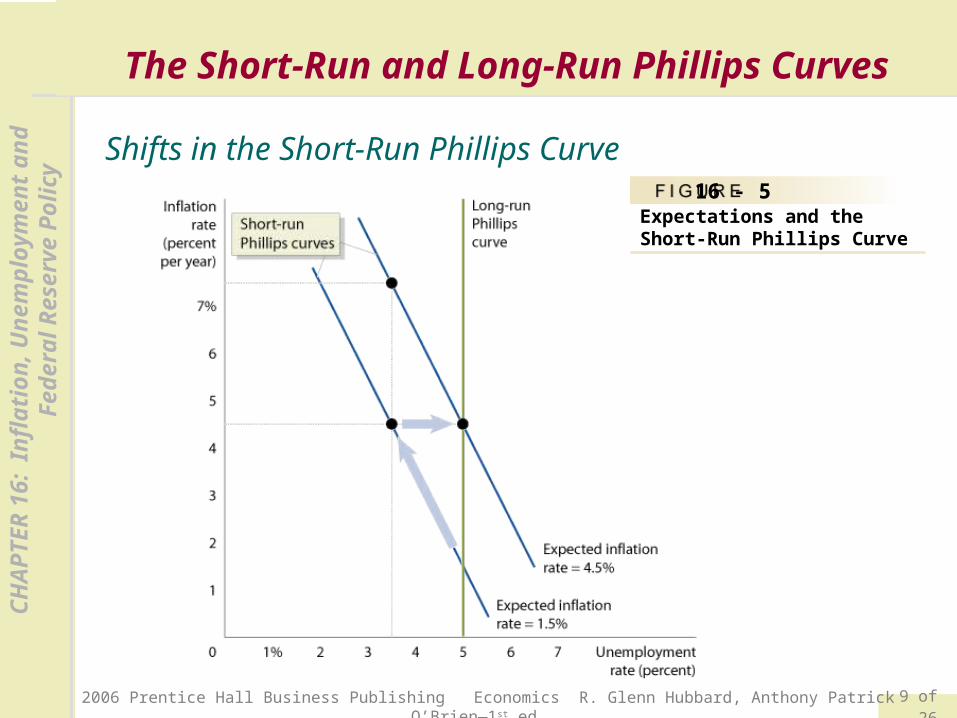
Shifts in the Short-Run Phillips Curve16 - 5
Expectations and the Short-Run Phillips Curve
10 of 26© 2006 Prentice Hall Business Publishing Economics R. Glenn Hubbard, Anthony Patrick O’Brien—1 st ed.
CH
AP
TE
R 1
6:
Infl
atio
n,
Un
emp
loym
ent
and
F
eder
al R
eser
ve P
oli
cyThe Short-Run and Long-Run Phillips Curves
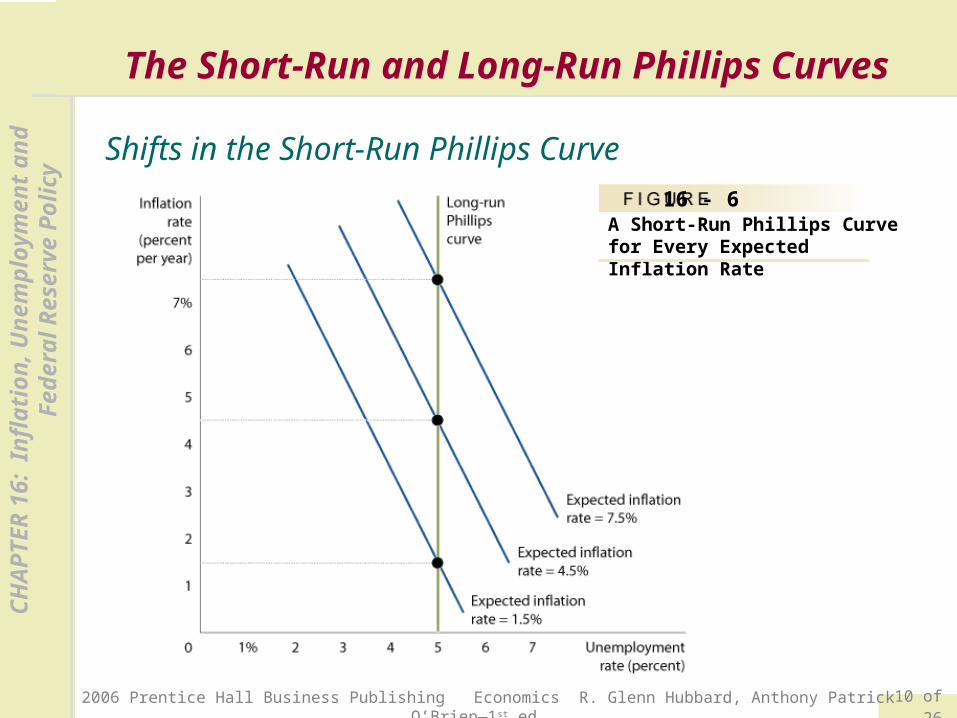
Shifts in the Short-Run Phillips Curve
16 - 6A Short-Run Phillips Curve for Every Expected Inflation Rate
11 of 26© 2006 Prentice Hall Business Publishing Economics R. Glenn Hubbard, Anthony Patrick O’Brien—1 st ed.
CH
AP
TE
R 1
6:
Infl
atio
n,
Un
emp
loym
ent
and
F
eder
al R
eser
ve P
oli
cyThe Short-Run and Long-Run Phillips Curves
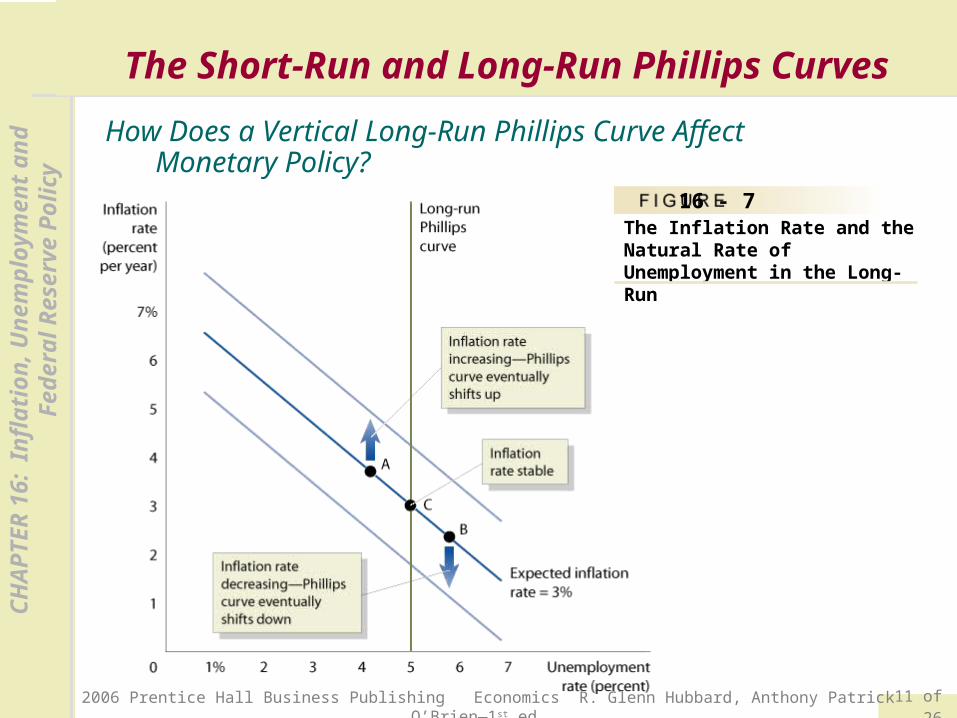
How Does a Vertical Long-Run Phillips Curve Affect Monetary Policy?
16 - 7The Inflation Rate and the Natural Rate of Unemployment in the Long-Run
12 of 26© 2006 Prentice Hall Business Publishing Economics R. Glenn Hubbard, Anthony Patrick O’Brien—1 st ed.
CH
AP
TE
R 1
6:
Infl
atio
n,
Un
emp
loym
ent
and
F
eder
al R
eser
ve P
oli
cy
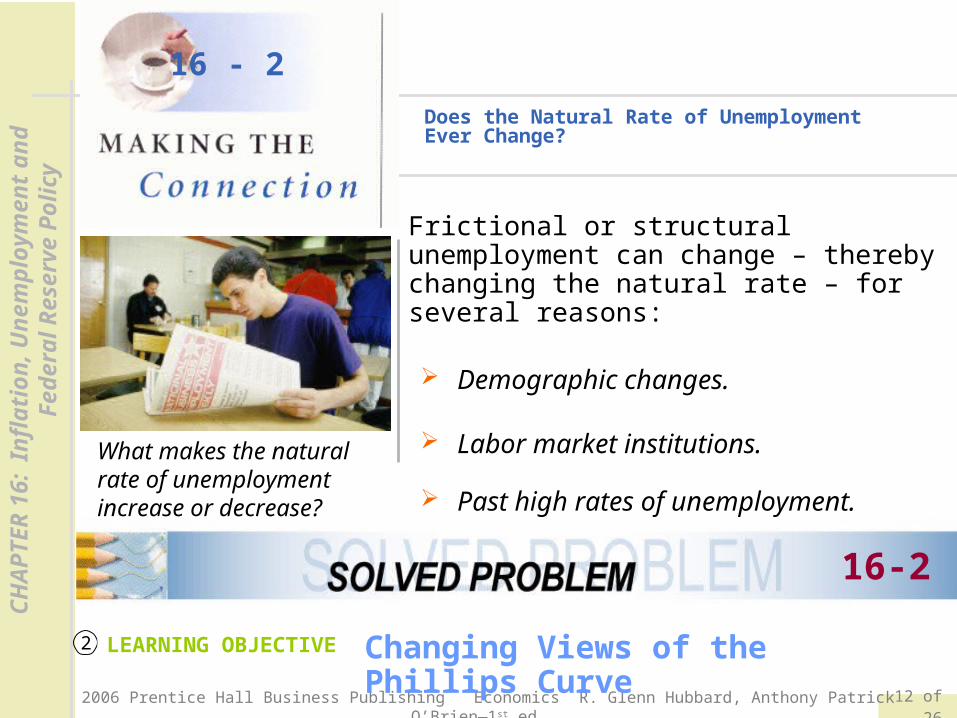
Does the Natural Rate of Unemployment Ever Change?
16 - 2
16-2
LEARNING OBJECTIVE2 Changing Views of the Phillips Curve
Frictional or structural unemployment can change – thereby changing the natural rate – for several reasons:
Demographic changes.
Labor market institutions.
Past high rates of unemployment.What makes the natural rate of unemployment increase or decrease?
13 of 26© 2006 Prentice Hall Business Publishing Economics R. Glenn Hubbard, Anthony Patrick O’Brien—1 st ed.
CH
AP
TE
R 1
6:
Infl
atio
n,
Un
emp
loym
ent
and
F
eder
al R
eser
ve P
oli
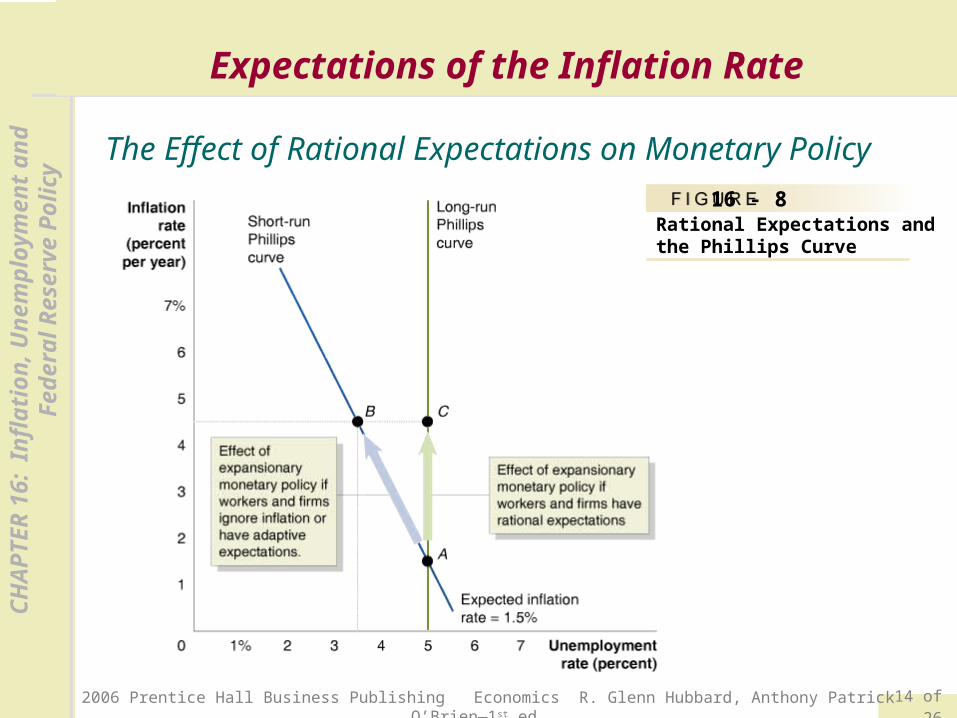
cyExpectations of the Inflation Rate
LEARNING OBJECTIVE3
The experience in the United States over the past 50 years indicates that how workers and firms adjust their expectations of inflation depends on how high the inflation rate is. There are three possibilities:
Low inflation.
Moderate, but stable inflation.
High and unstable inflation.
Rational expectations Expectations formed by using all available information about an economic variable.
14 of 26© 2006 Prentice Hall Business Publishing Economics R. Glenn Hubbard, Anthony Patrick O’Brien—1 st ed.
CH
AP
TE
R 1
6:
Infl
atio
n,
Un
emp
loym
ent
and
F
eder
al R
eser
ve P
oli
cyExpectations of the Inflation Rate
The Effect of Rational Expectations on Monetary Policy
16 - 8Rational Expectations and the Phillips Curve
15 of 26© 2006 Prentice Hall Business Publishing Economics R. Glenn Hubbard, Anthony Patrick O’Brien—1 st ed.
CH
AP
TE
R 1
6:
Infl
atio
n,
Un
emp
loym
ent
and
F
eder
al R
eser
ve P
oli
cyExpectations of the Inflation Rate
Is the Short-Run Phillips Curve Really Vertical?
Real Business Cycle Models
Real business cycle models Models that focus on real rather than monetary explanations of fluctuations in real GDP.
16 of 26© 2006 Prentice Hall Business Publishing Economics R. Glenn Hubbard, Anthony Patrick O’Brien—1 st ed.
CH
AP
TE
R 1
6:
Infl
atio
n,
Un
emp
loym
ent
and
F
eder
al R
eser
ve P
oli
cyHow the Fed Fights Inflation
Paul Volcker and Disinflation
Disinflation A significant reduction in the inflation rate.
Don’t Confuse “Disinflation” with “Deflation”
17 of 26© 2006 Prentice Hall Business Publishing Economics R. Glenn Hubbard, Anthony Patrick O’Brien—1 st ed.
CH
AP
TE
R 1
6:
Infl
atio
n,
Un
emp
loym
ent
and
F
eder
al R
eser
ve P
oli
cyHow the Fed Fights Inflation
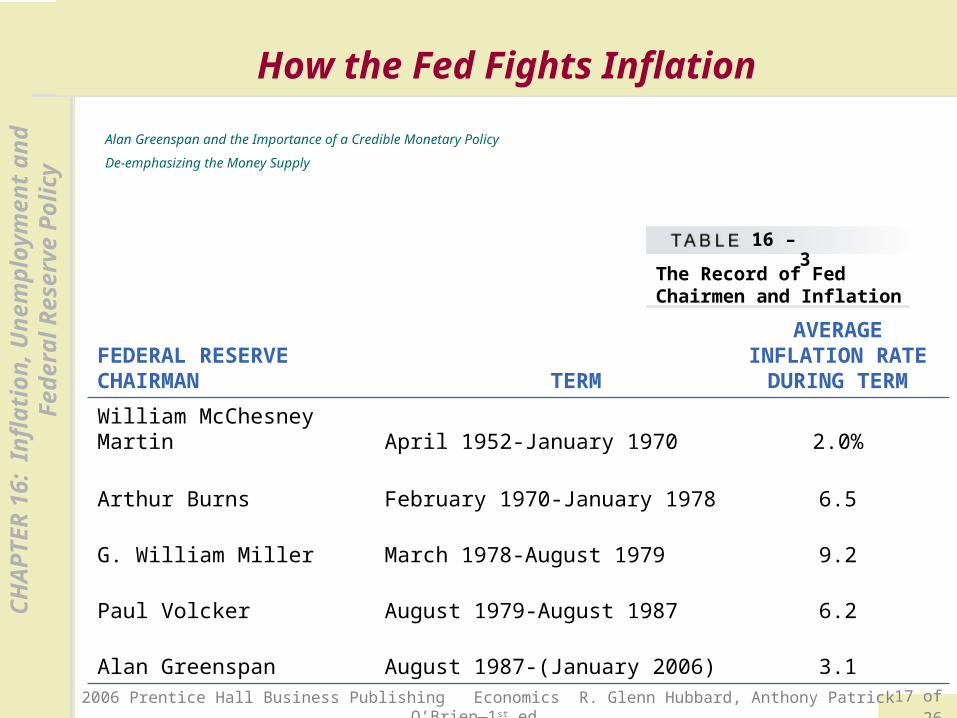
Alan Greenspan and the Importance of a Credible Monetary Policy
De-emphasizing the Money Supply
The Record of Fed Chairmen and Inflation
16 – 3
FEDERAL RESERVE CHAIRMAN TERM
AVERAGE INFLATION RATE
DURING TERM
William McChesney Martin April 1952-January 1970 2.0%
Arthur Burns February 1970-January 1978 6.5
G. William Miller March 1978-August 1979 9.2
Paul Volcker August 1979-August 1987 6.2
Alan Greenspan August 1987-(January 2006) 3.1
18 of 26© 2006 Prentice Hall Business Publishing Economics R. Glenn Hubbard, Anthony Patrick O’Brien—1 st ed.
CH
AP
TE
R 1
6:
Infl
atio
n,
Un
emp
loym
ent
and
F
eder
al R
eser
ve P
oli
cyHow the Fed Fights Inflation
The Importance of Fed Credibility
Monetary Policy Credibility after Greenspan
A Failure of Credibility at the Bank of Japan
Federal Reserve Policy and Whirlpool’s “Pricing Power”
19 of 26© 2006 Prentice Hall Business Publishing Economics R. Glenn Hubbard, Anthony Patrick O’Brien—1 st ed.
CH
AP
TE
R 1
6:
Infl
atio
n,
Un
emp
loym
ent
and
F
eder
al R
eser
ve P
oli
cy
Disinflation
Natural rate of unemployment
Phillips curve
Rational expectations
Real business cycle models
Structural relationship