C-Corp Conversion & Capital Allocation Strategy
12
August 5, 2020 C-Corp Conversion & Capital Allocation Strategy
Transcript of C-Corp Conversion & Capital Allocation Strategy

August 5, 2020
C-Corp Conversion & Capital Allocation Strategy
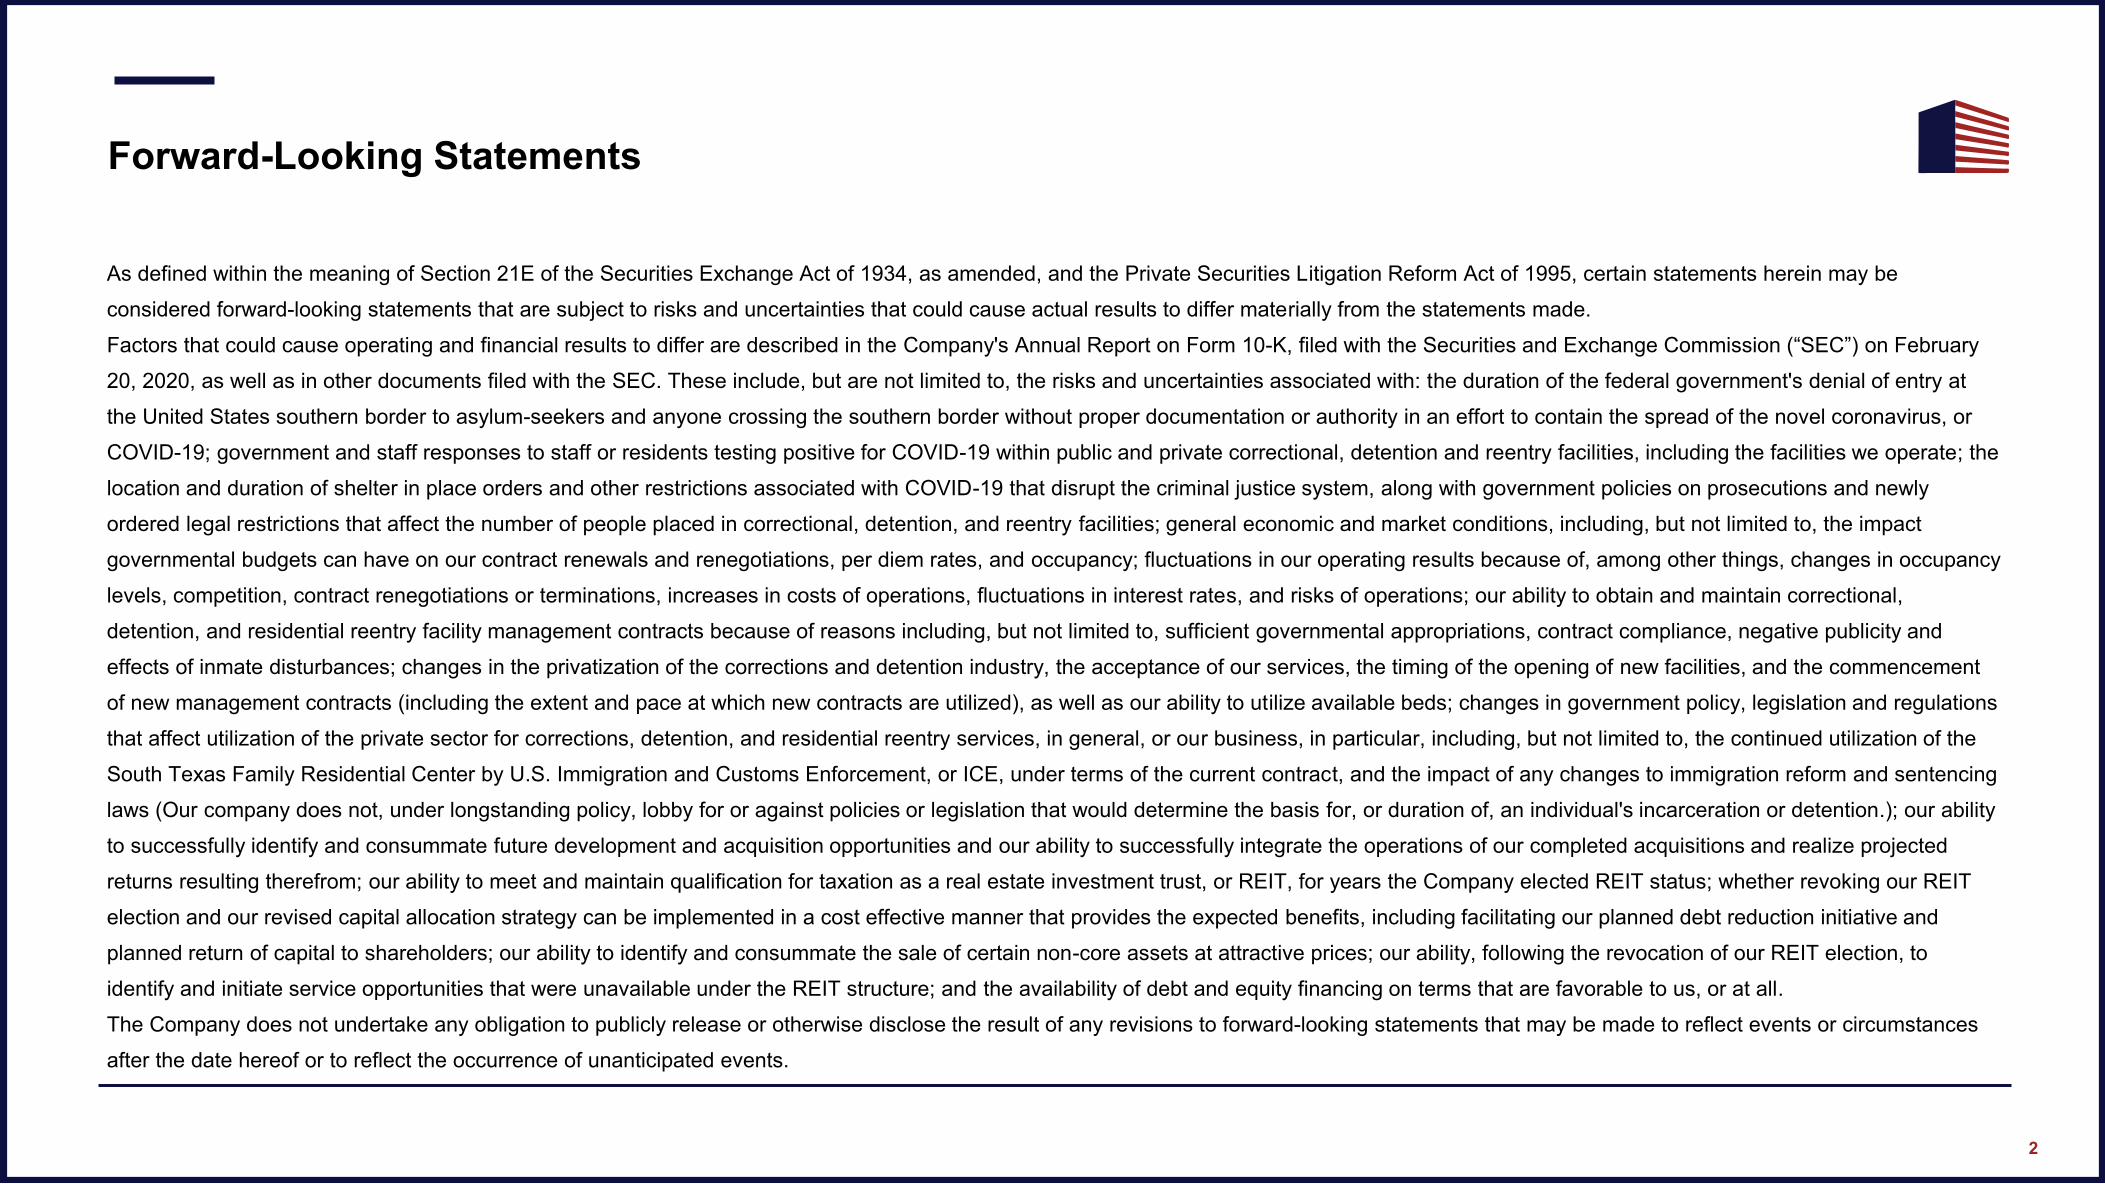
As defined within the meaning of Section 21E of the Securities Exchange Act of 1934, as amended, and the Private Securities Litigation Reform Act of 1995, certain statements herein may be
considered forward-looking statements that are subject to risks and uncertainties that could cause actual results to differ materially from the statements made.
Factors that could cause operating and financial results to differ are described in the Company's Annual Report on Form 10-K, filed with the Securities and Exchange Commission (“SEC”) on February
20, 2020, as well as in other documents filed with the SEC. These include, but are not limited to, the risks and uncertainties associated with: the duration of the federal government's denial of entry at
the United States southern border to asylum-seekers and anyone crossing the southern border without proper documentation or authority in an effort to contain the spread of the novel coronavirus, or
COVID-19; government and staff responses to staff or residents testing positive for COVID-19 within public and private correctional, detention and reentry facilities, including the facilities we operate; the
location and duration of shelter in place orders and other restrictions associated with COVID-19 that disrupt the criminal justice system, along with government policies on prosecutions and newly
ordered legal restrictions that affect the number of people placed in correctional, detention, and reentry facilities; general economic and market conditions, including, but not limited to, the impact
governmental budgets can have on our contract renewals and renegotiations, per diem rates, and occupancy; fluctuations in our operating results because of, among other things, changes in occupancy
levels, competition, contract renegotiations or terminations, increases in costs of operations, fluctuations in interest rates, and risks of operations; our ability to obtain and maintain correctional,
detention, and residential reentry facility management contracts because of reasons including, but not limited to, sufficient governmental appropriations, contract compliance, negative publicity and
effects of inmate disturbances; changes in the privatization of the corrections and detention industry, the acceptance of our services, the timing of the opening of new facilities, and the commencement
of new management contracts (including the extent and pace at which new contracts are utilized), as well as our ability to utilize available beds; changes in government policy, legislation and regulations
that affect utilization of the private sector for corrections, detention, and residential reentry services, in general, or our business, in particular, including, but not limited to, the continued utilization of the
South Texas Family Residential Center by U.S. Immigration and Customs Enforcement, or ICE, under terms of the current contract, and the impact of any changes to immigration reform and sentencing
laws (Our company does not, under longstanding policy, lobby for or against policies or legislation that would determine the basis for, or duration of, an individual's incarceration or detention.); our ability
to successfully identify and consummate future development and acquisition opportunities and our ability to successfully integrate the operations of our completed acquisitions and realize projected
returns resulting therefrom; our ability to meet and maintain qualification for taxation as a real estate investment trust, or REIT, for years the Company elected REIT status; whether revoking our REIT
election and our revised capital allocation strategy can be implemented in a cost effective manner that provides the expected benefits, including facilitating our planned debt reduction initiative and
planned return of capital to shareholders; our ability to identify and consummate the sale of certain non-core assets at attractive prices; our ability, following the revocation of our REIT election, to
identify and initiate service opportunities that were unavailable under the REIT structure; and the availability of debt and equity financing on terms that are favorable to us, or at all.
The Company does not undertake any obligation to publicly release or otherwise disclose the result of any revisions to forward-looking statements that may be made to reflect events or circumstances
after the date hereof or to reflect the occurrence of unanticipated events.
Forward-Looking Statements
2
2.25x - 2.75x
3.9x
Current Leverage Ratio Target Leverage Ratio
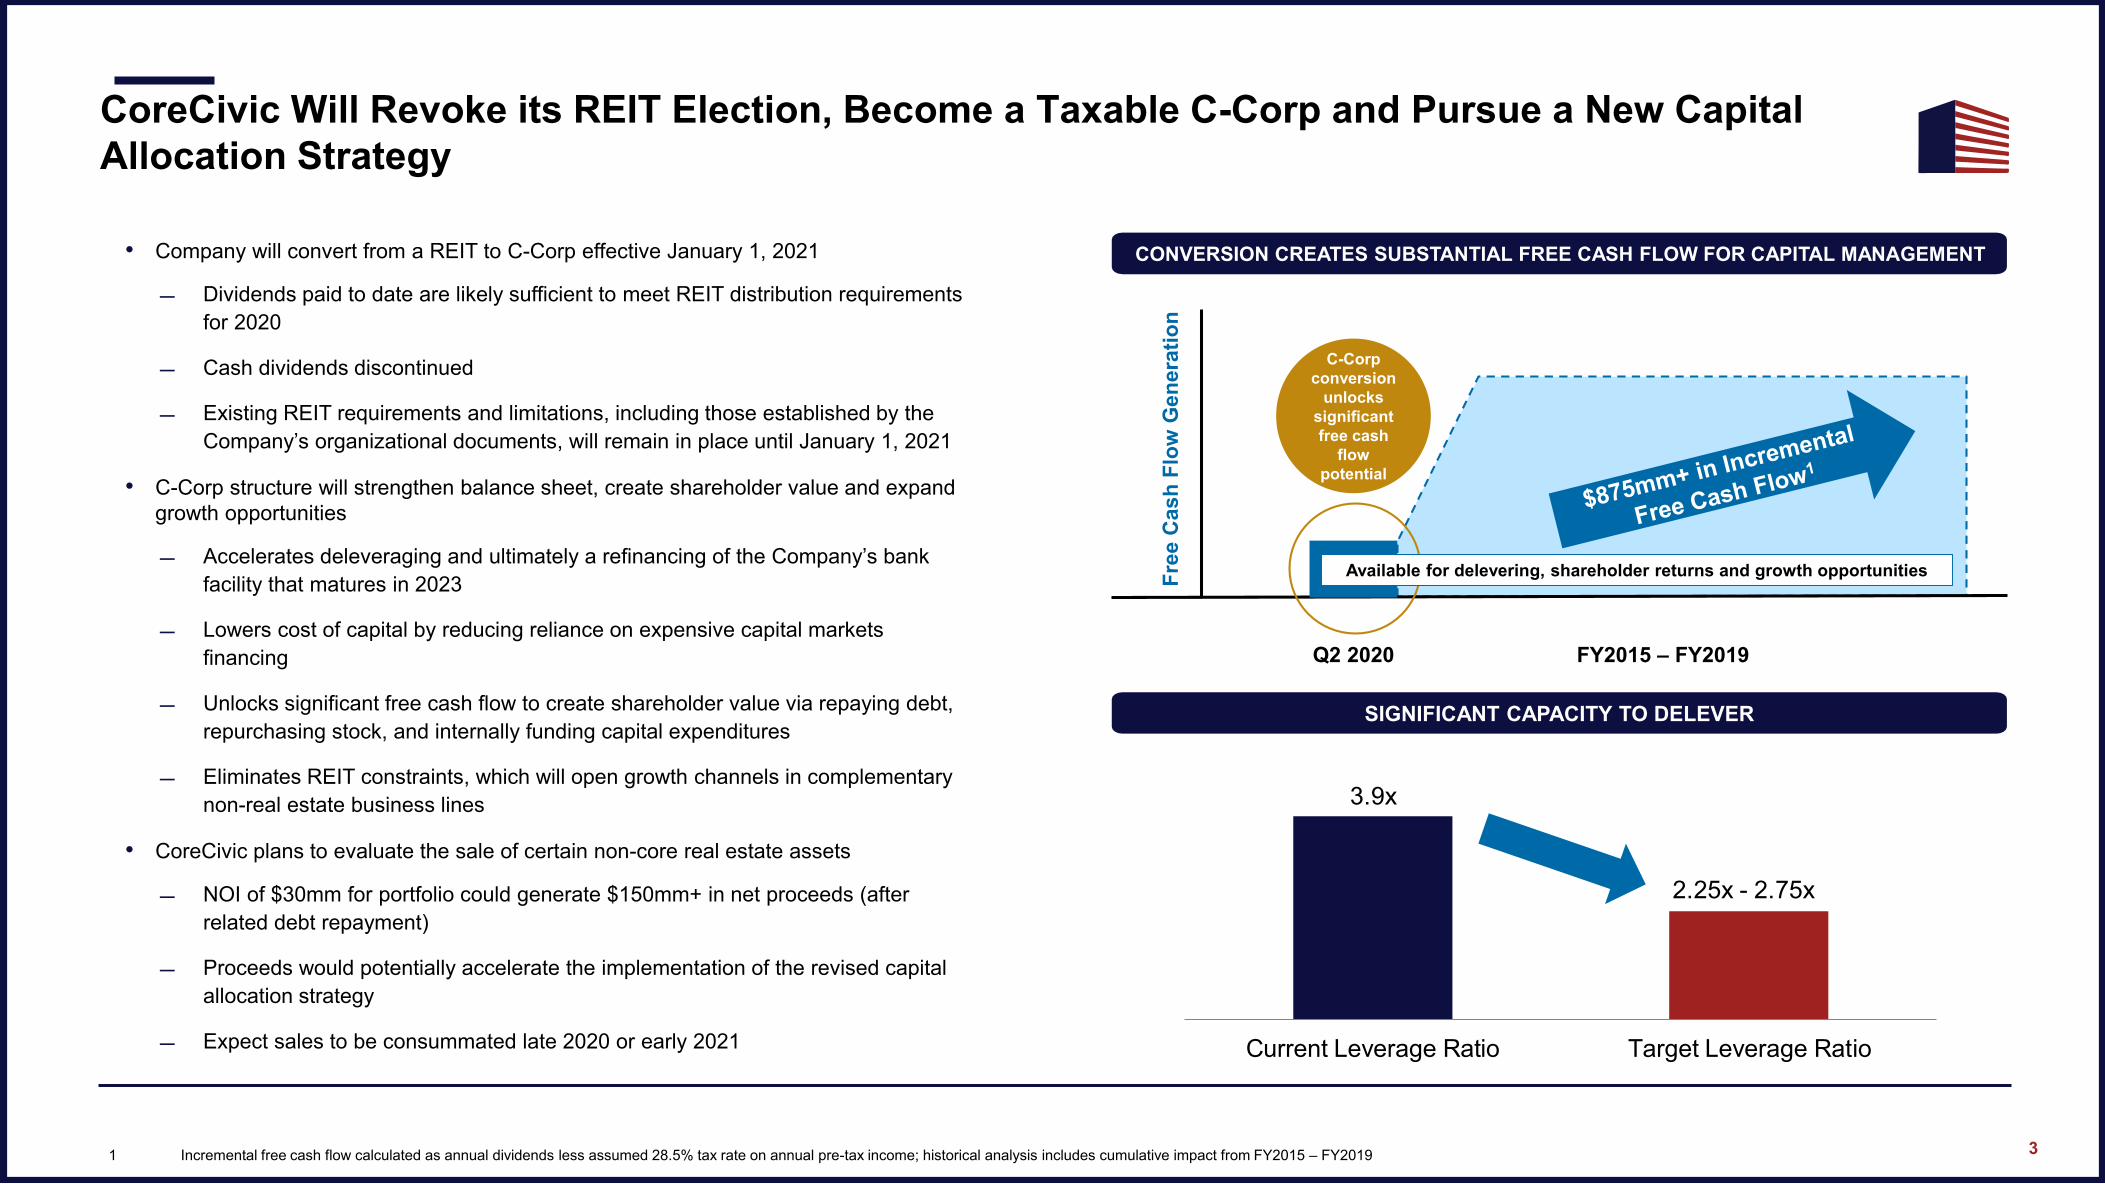
CoreCivic Will Revoke its REIT Election, Become a Taxable C-Corp and Pursue a New Capital
Allocation Strategy
• Company will convert from a REIT to C-Corp effective January 1, 2021
Dividends paid to date are likely sufficient to meet REIT distribution requirements
for 2020
Cash dividends discontinued
Existing REIT requirements and limitations, including those established by the
Company’s organizational documents, will remain in place until January 1, 2021
• C-Corp structure will strengthen balance sheet, create shareholder value and expand
growth opportunities
Accelerates deleveraging and ultimately a refinancing of the Company’s bank
facility that matures in 2023
Lowers cost of capital by reducing reliance on expensive capital markets
financing
Unlocks significant free cash flow to create shareholder value via repaying debt,
repurchasing stock, and internally funding capital expenditures
Eliminates REIT constraints, which will open growth channels in complementary
non-real estate business lines
• CoreCivic plans to evaluate the sale of certain non-core real estate assets
NOI of $30mm for portfolio could generate $150mm+ in net proceeds (after
related debt repayment)
Proceeds would potentially accelerate the implementation of the revised capital
allocation strategy
Expect sales to be consummated late 2020 or early 2021
3
CONVERSION CREATES SUBSTANTIAL FREE CASH FLOW FOR CAPITAL MANAGEMENT
SIGNIFICANT CAPACITY TO DELEVER
Q2 2020 FY2015 – FY2019
Available for delevering, shareholder returns and growth opportunities
C-Corp
conversion
unlocks
significant
free cash
flow
potential
Fre
e C
ash
Flo
w G
en
era
tio
n1 Incremental free cash flow calculated as annual dividends less assumed 28.5% tax rate on annual pre-tax income; historical analysis includes cumulative impact from FY2015 – FY2019
Prior C-Corp Era Buybacks Prior C-Corp Era Dividends REIT Era Dividends
$415 $427 $441
$423 $381 $386 $398
$418 $388 $396
$444 $420
25% 25% 25% 24%23% 23%
23% 22% 22% 22% 22% 21%
2009 2010 2011 2012 2013 2014 2015 2016 2017 2018 2019 6/30/20LTM
EBITDA Margin
$155 $157 $163 $157
$301
$195
$222 $220
$178 $159
$189
$146
2009 2010 2011 2012 2013 2014 2015 2016 2017 2018 2019 6/30/20LTM
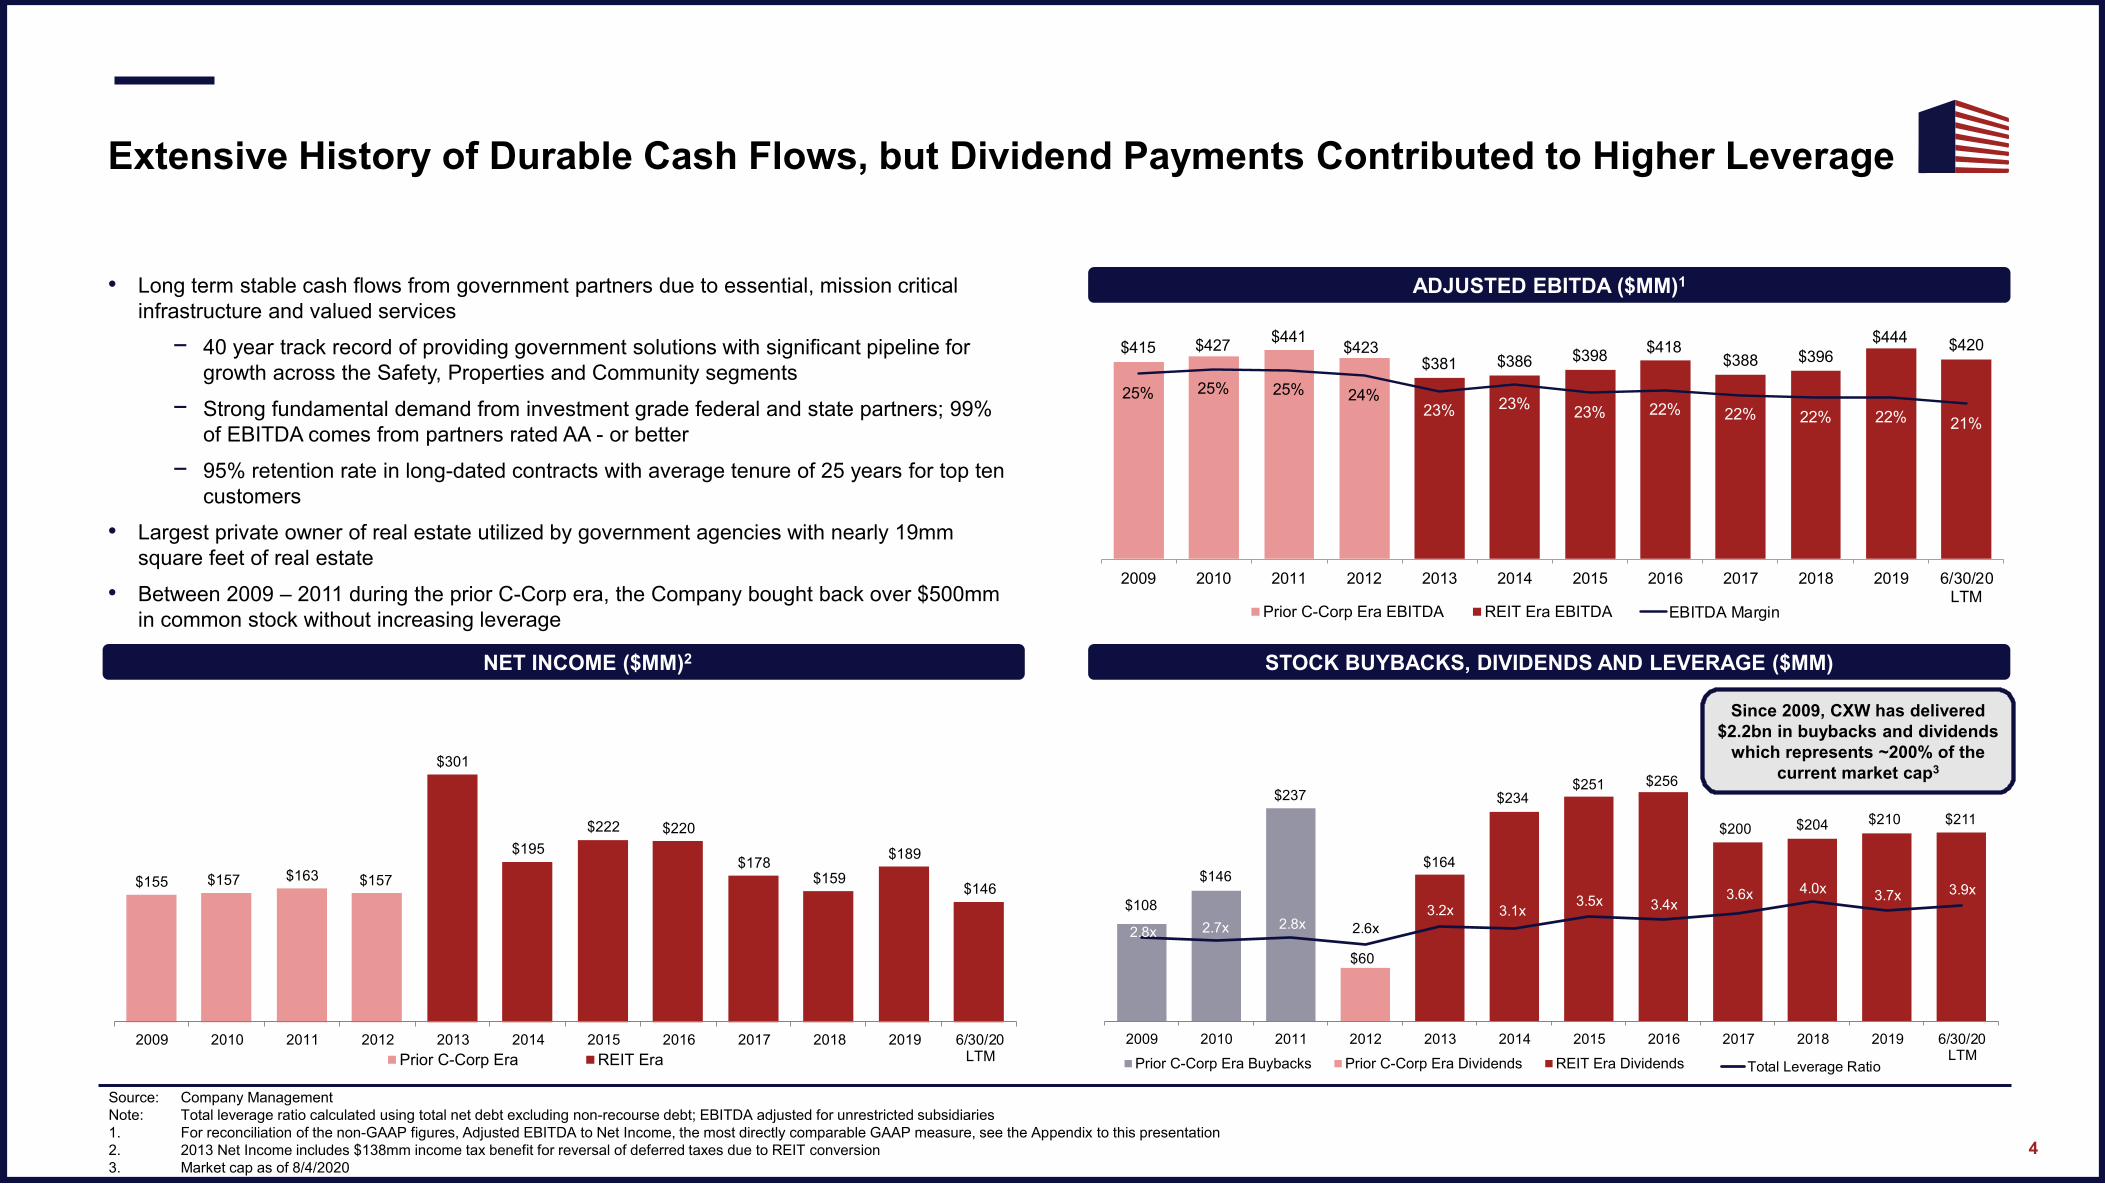
Extensive History of Durable Cash Flows, but Dividend Payments Contributed to Higher Leverage
Source: Company Management
Note: Total leverage ratio calculated using total net debt excluding non-recourse debt; EBITDA adjusted for unrestricted subsidiaries
1. For reconciliation of the non-GAAP figures, Adjusted EBITDA to Net Income, the most directly comparable GAAP measure, see the Appendix to this presentation
2. 2013 Net Income includes $138mm income tax benefit for reversal of deferred taxes due to REIT conversion
3. Market cap as of 8/4/2020
4
STOCK BUYBACKS, DIVIDENDS AND LEVERAGE ($MM)
ADJUSTED EBITDA ($MM)1• Long term stable cash flows from government partners due to essential, mission critical
infrastructure and valued services
− 40 year track record of providing government solutions with significant pipeline for
growth across the Safety, Properties and Community segments
− Strong fundamental demand from investment grade federal and state partners; 99%
of EBITDA comes from partners rated AA - or better
− 95% retention rate in long-dated contracts with average tenure of 25 years for top ten
customers
• Largest private owner of real estate utilized by government agencies with nearly 19mm
square feet of real estate
• Between 2009 – 2011 during the prior C-Corp era, the Company bought back over $500mm
in common stock without increasing leverage
NET INCOME ($MM)2
Prior C-Corp Era EBITDA REIT Era EBITDA
Prior C-Corp Era REIT Era
$60
$164
$234 $251 $256
$200 $204 $210 $211
$108
$146
$237
2.8x 2.7x 2.8x 2.6x
3.2x 3.1x3.5x 3.4x
3.6x 4.0x3.7x 3.9x
2009 2010 2011 2012 2013 2014 2015 2016 2017 2018 2019 6/30/20LTM
Total Leverage Ratio
Since 2009, CXW has delivered
$2.2bn in buybacks and dividends
which represents ~200% of the
current market cap3
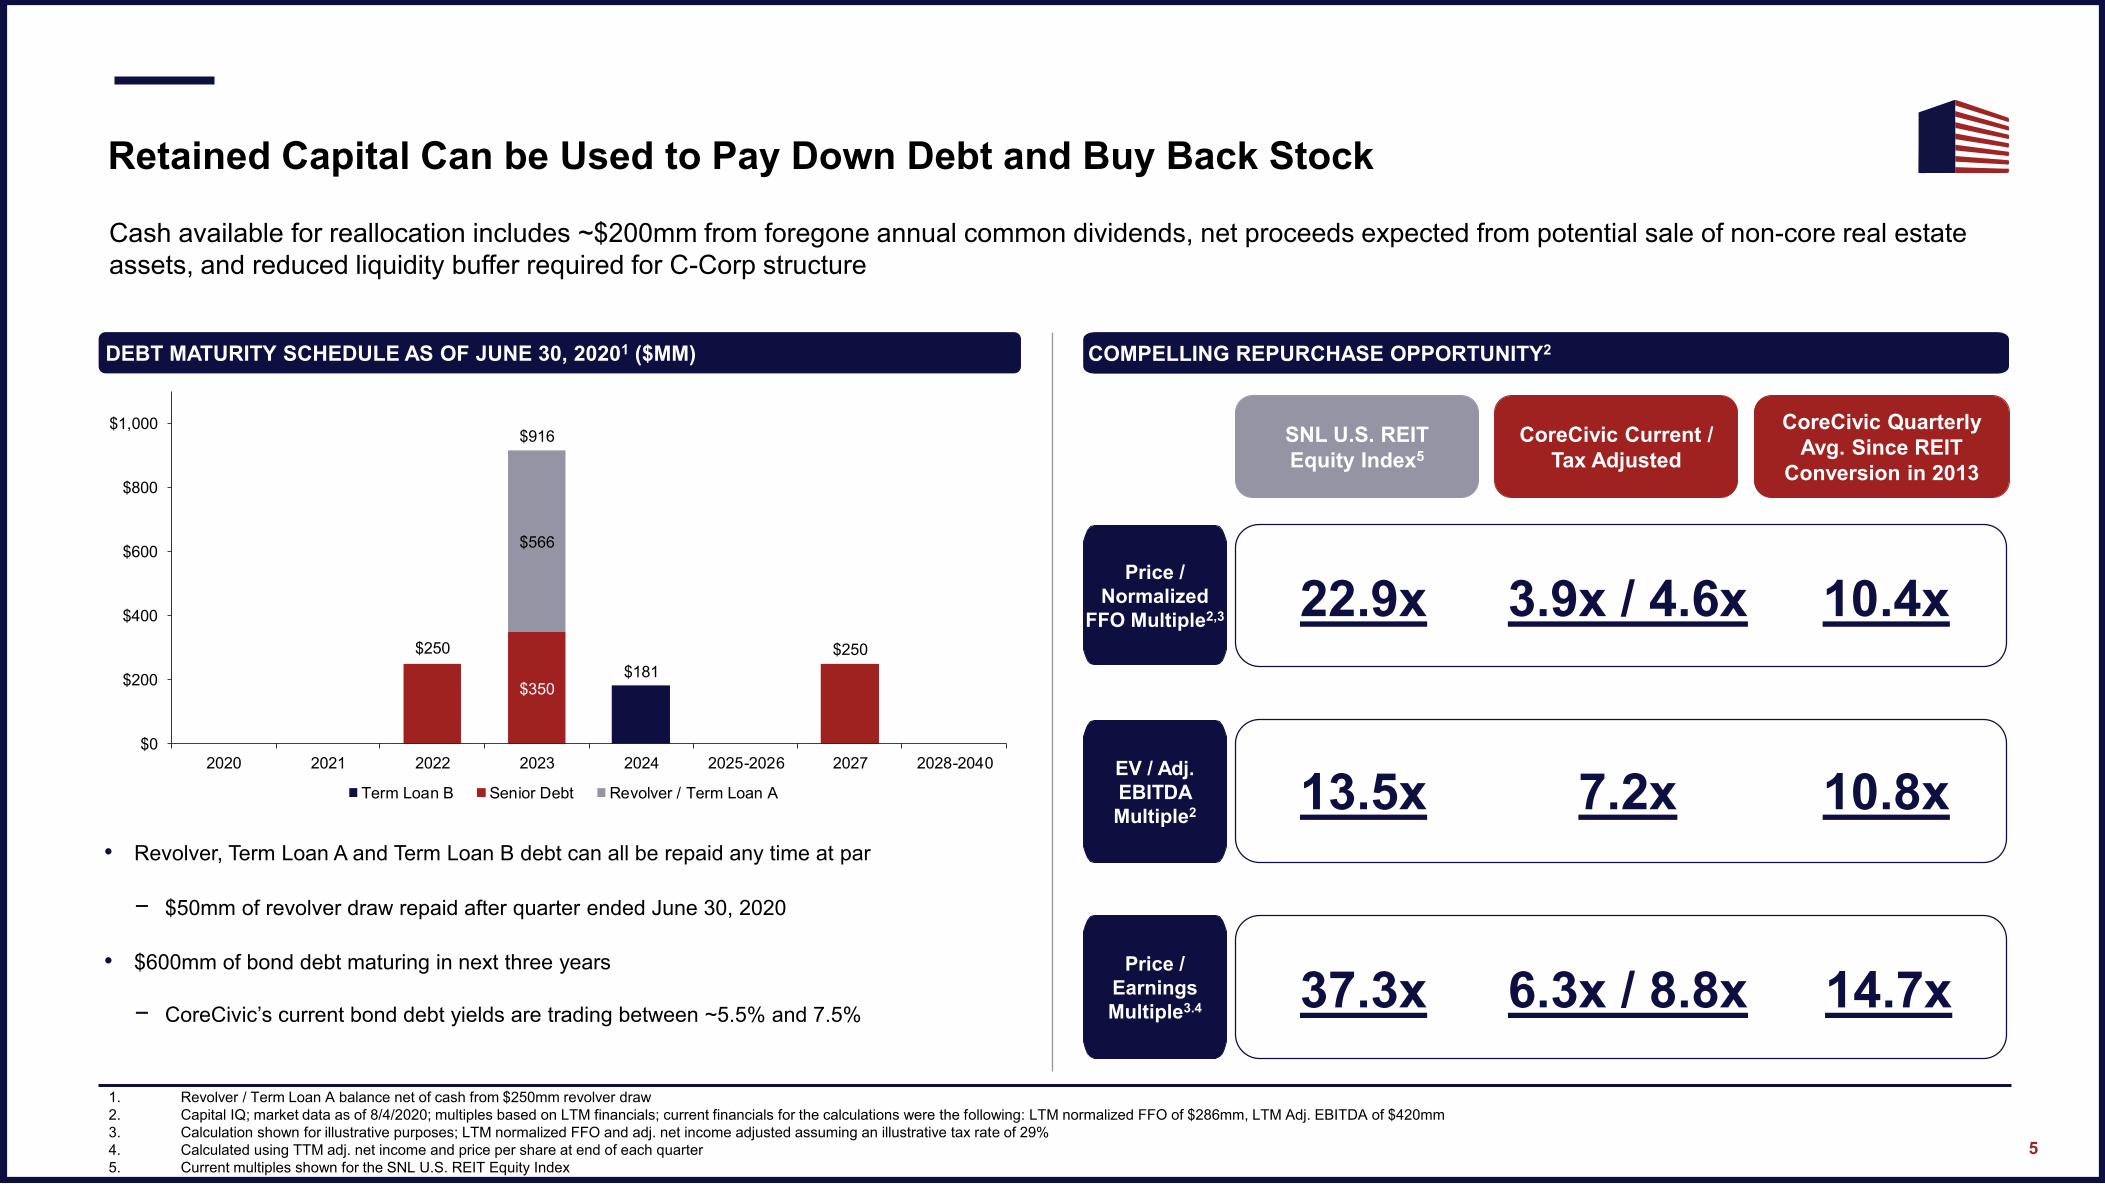
Retained Capital Can be Used to Pay Down Debt and Buy Back Stock
COMPELLING REPURCHASE OPPORTUNITY2
3.9x / 4.6x
1. Revolver / Term Loan A balance net of cash from $250mm revolver draw
2. Capital IQ; market data as of 8/4/2020; multiples based on LTM financials; current financials for the calculations were the following: LTM normalized FFO of $286mm, LTM Adj. EBITDA of $420mm
3. Calculation shown for illustrative purposes; LTM normalized FFO and adj. net income adjusted assuming an illustrative tax rate of 29%
4. Calculated using TTM adj. net income and price per share at end of each quarter
5. Current multiples shown for the SNL U.S. REIT Equity Index
5
CoreCivic Current /
Tax Adjusted
22.9xPrice /
Normalized
FFO Multiple2,3
CoreCivic Quarterly
Avg. Since REIT
Conversion in 2013
DEBT MATURITY SCHEDULE AS OF JUNE 30, 20201 ($MM)
• Revolver, Term Loan A and Term Loan B debt can all be repaid any time at par
− $50mm of revolver draw repaid after quarter ended June 30, 2020
• $600mm of bond debt maturing in next three years
− CoreCivic’s current bond debt yields are trading between ~5.5% and 7.5%
Cash available for reallocation includes ~$200mm from foregone annual common dividends, net proceeds expected from potential sale of non-core real estate
assets, and reduced liquidity buffer required for C-Corp structure
SNL U.S. REIT
Equity Index5
10.4x
6.3x / 8.8xPrice /
Earnings
Multiple3.4 37.3x 14.7x
7.2xEV / Adj.
EBITDA
Multiple213.5x 10.8x
$181$350
$250
$566
$250
$916
$0
$200
$400
$600
$800
$1,000
2020 2021 2022 2023 2024 2025-2026 2027 2028-2040
Term Loan B Senior Debt Revolver / Term Loan A
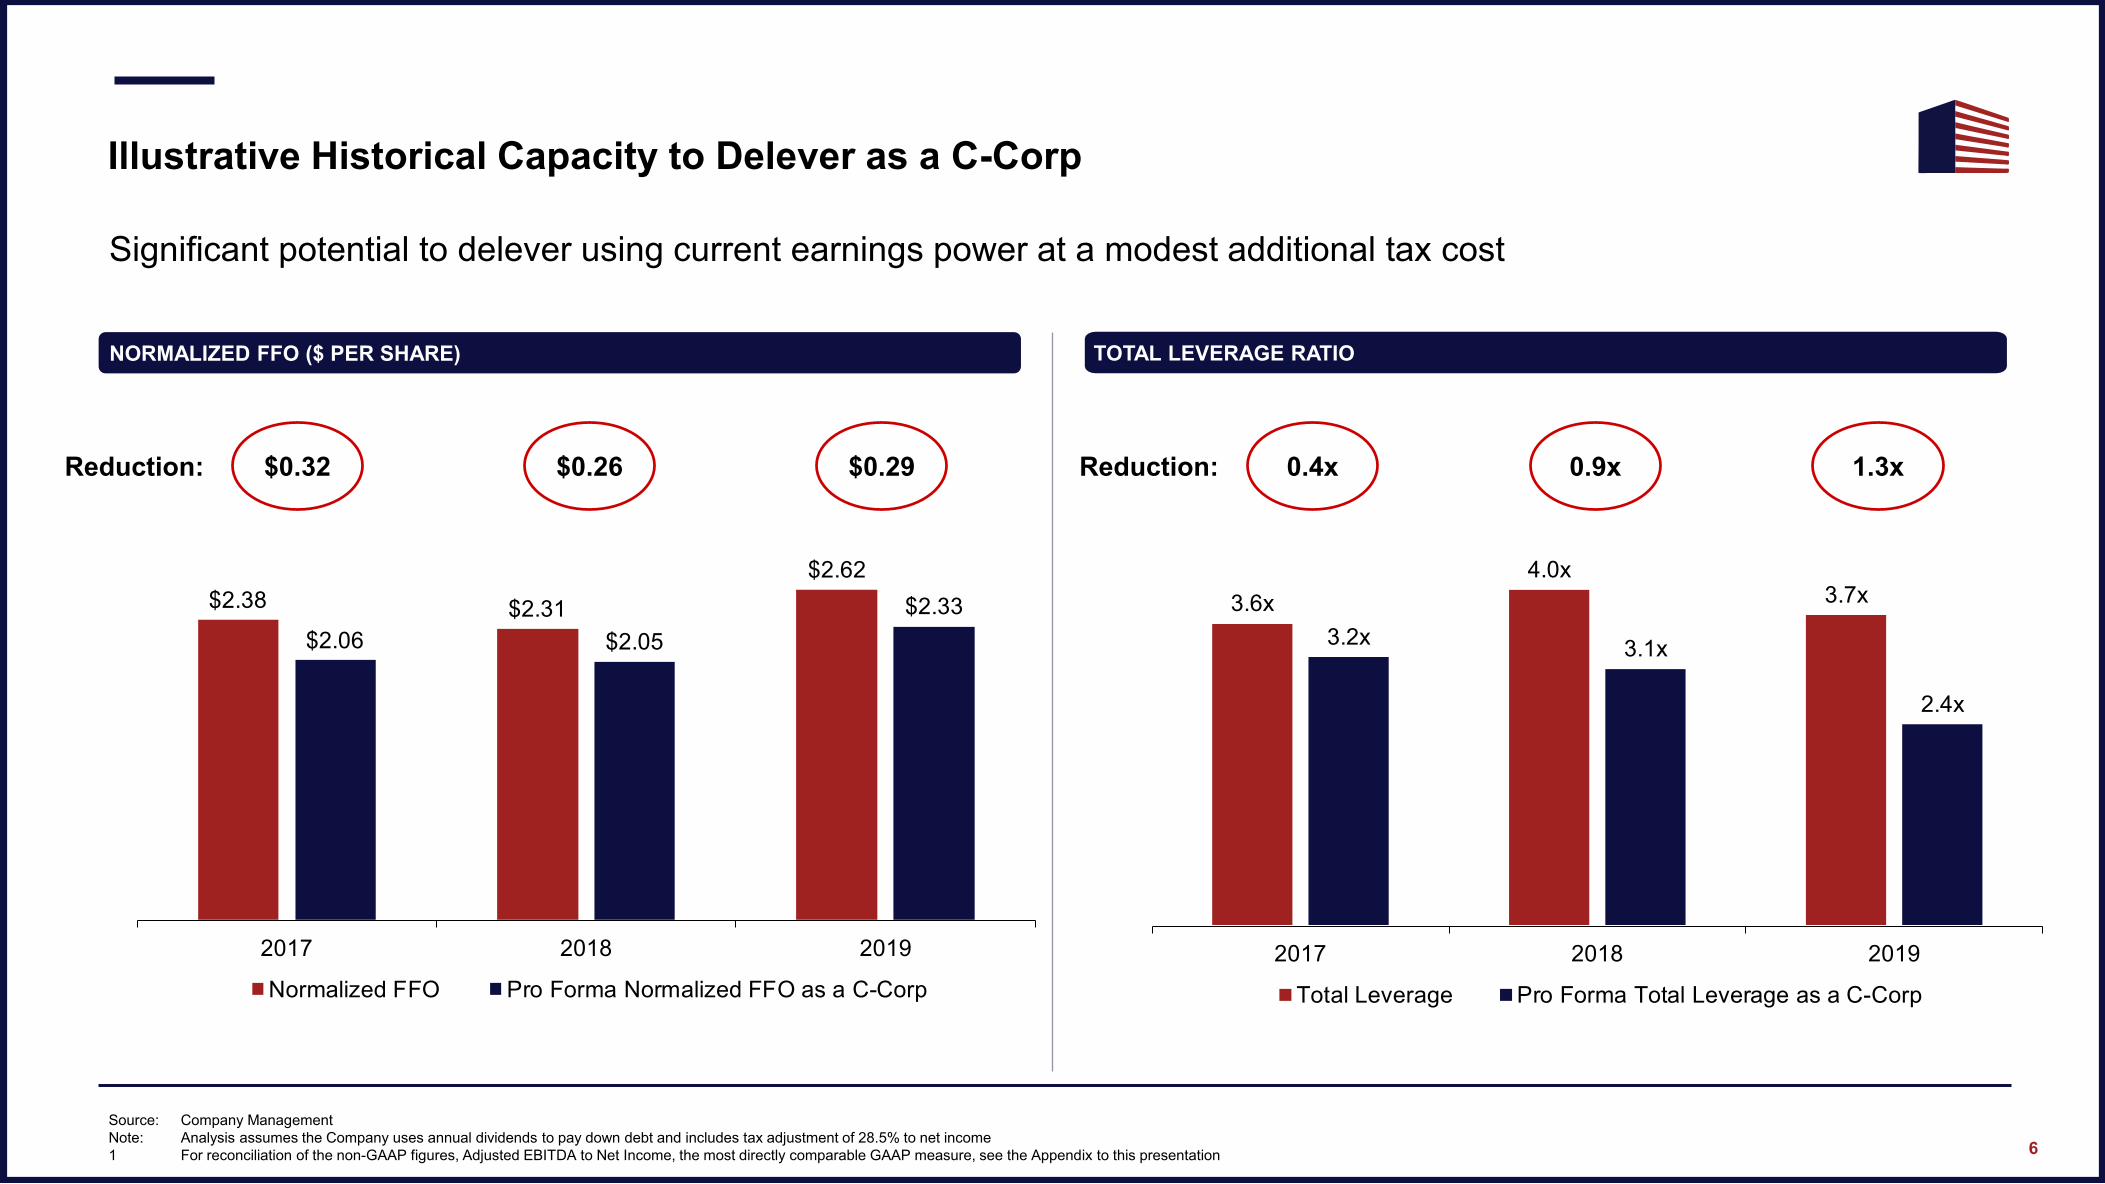
Illustrative Historical Capacity to Delever as a C-Corp
6
TOTAL LEVERAGE RATIONORMALIZED FFO ($ PER SHARE)
Significant potential to delever using current earnings power at a modest additional tax cost
$0.32Reduction: $0.26 $0.29 0.4xReduction: 0.9x 1.3x
Source: Company Management
Note: Analysis assumes the Company uses annual dividends to pay down debt and includes tax adjustment of 28.5% to net income
1 For reconciliation of the non-GAAP figures, Adjusted EBITDA to Net Income, the most directly comparable GAAP measure, see the Appendix to this presentation
$2.38 $2.31
$2.62
$2.06 $2.05
$2.33
2017 2018 2019
Normalized FFO Pro Forma Normalized FFO as a C-Corp
3.6x
4.0x3.7x
3.2x3.1x
2.4x
2017 2018 2019
Total Leverage Pro Forma Total Leverage as a C-Corp
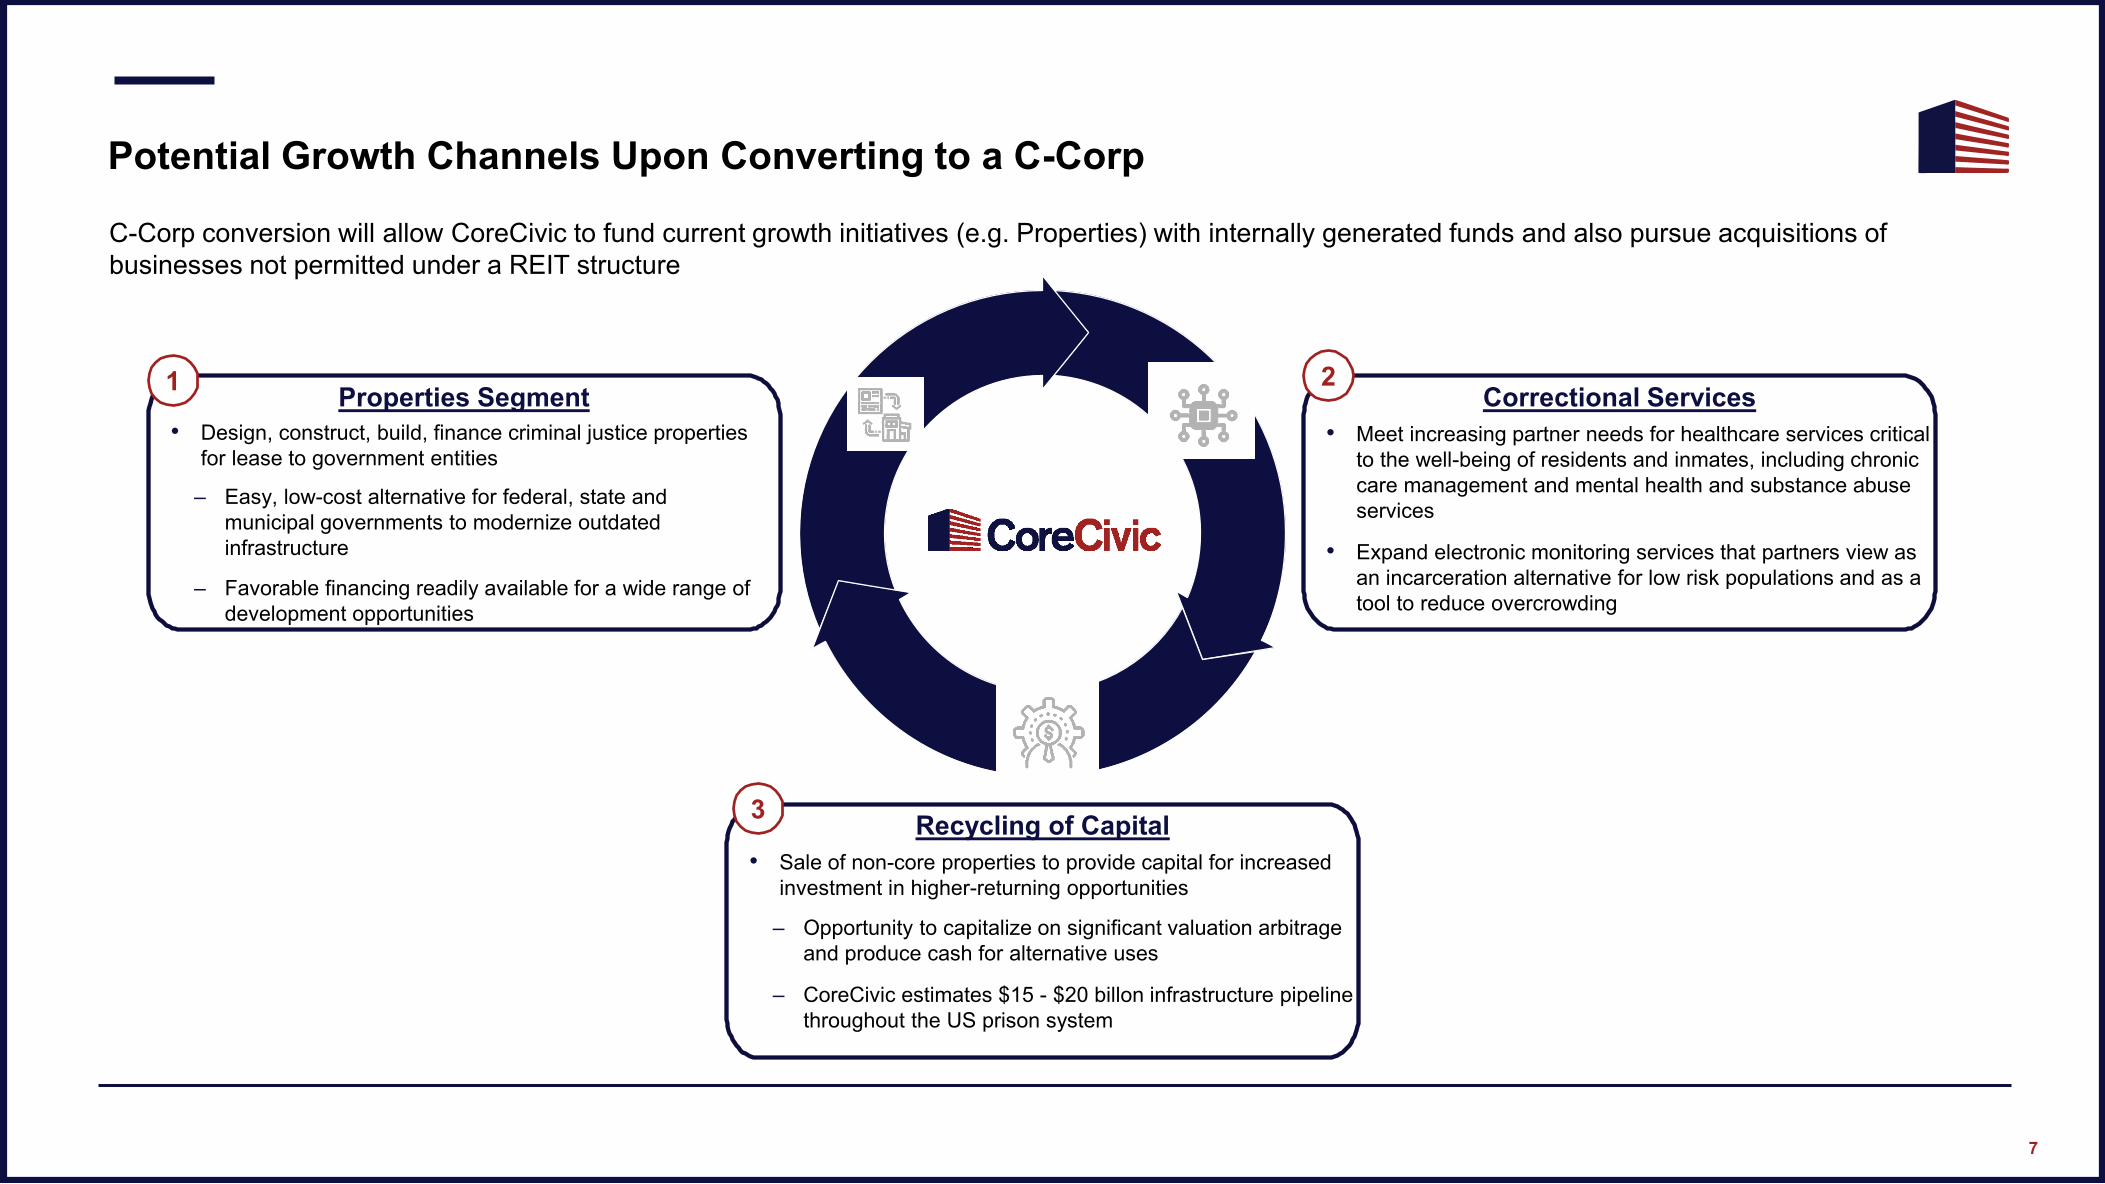
Correctional Services
• Meet increasing partner needs for healthcare services critical
to the well-being of residents and inmates, including chronic
care management and mental health and substance abuse
services
• Expand electronic monitoring services that partners view as
an incarceration alternative for low risk populations and as a
tool to reduce overcrowding
Properties Segment
• Design, construct, build, finance criminal justice properties
for lease to government entities
– Easy, low-cost alternative for federal, state and
municipal governments to modernize outdated
infrastructure
– Favorable financing readily available for a wide range of
development opportunities
Recycling of Capital
• Sale of non-core properties to provide capital for increased
investment in higher-returning opportunities
– Opportunity to capitalize on significant valuation arbitrage
and produce cash for alternative uses
– CoreCivic estimates $15 - $20 billon infrastructure pipeline
throughout the US prison system
Potential Growth Channels Upon Converting to a C-Corp
7
1
3
2
C-Corp conversion will allow CoreCivic to fund current growth initiatives (e.g. Properties) with internally generated funds and also pursue acquisitions of
businesses not permitted under a REIT structure
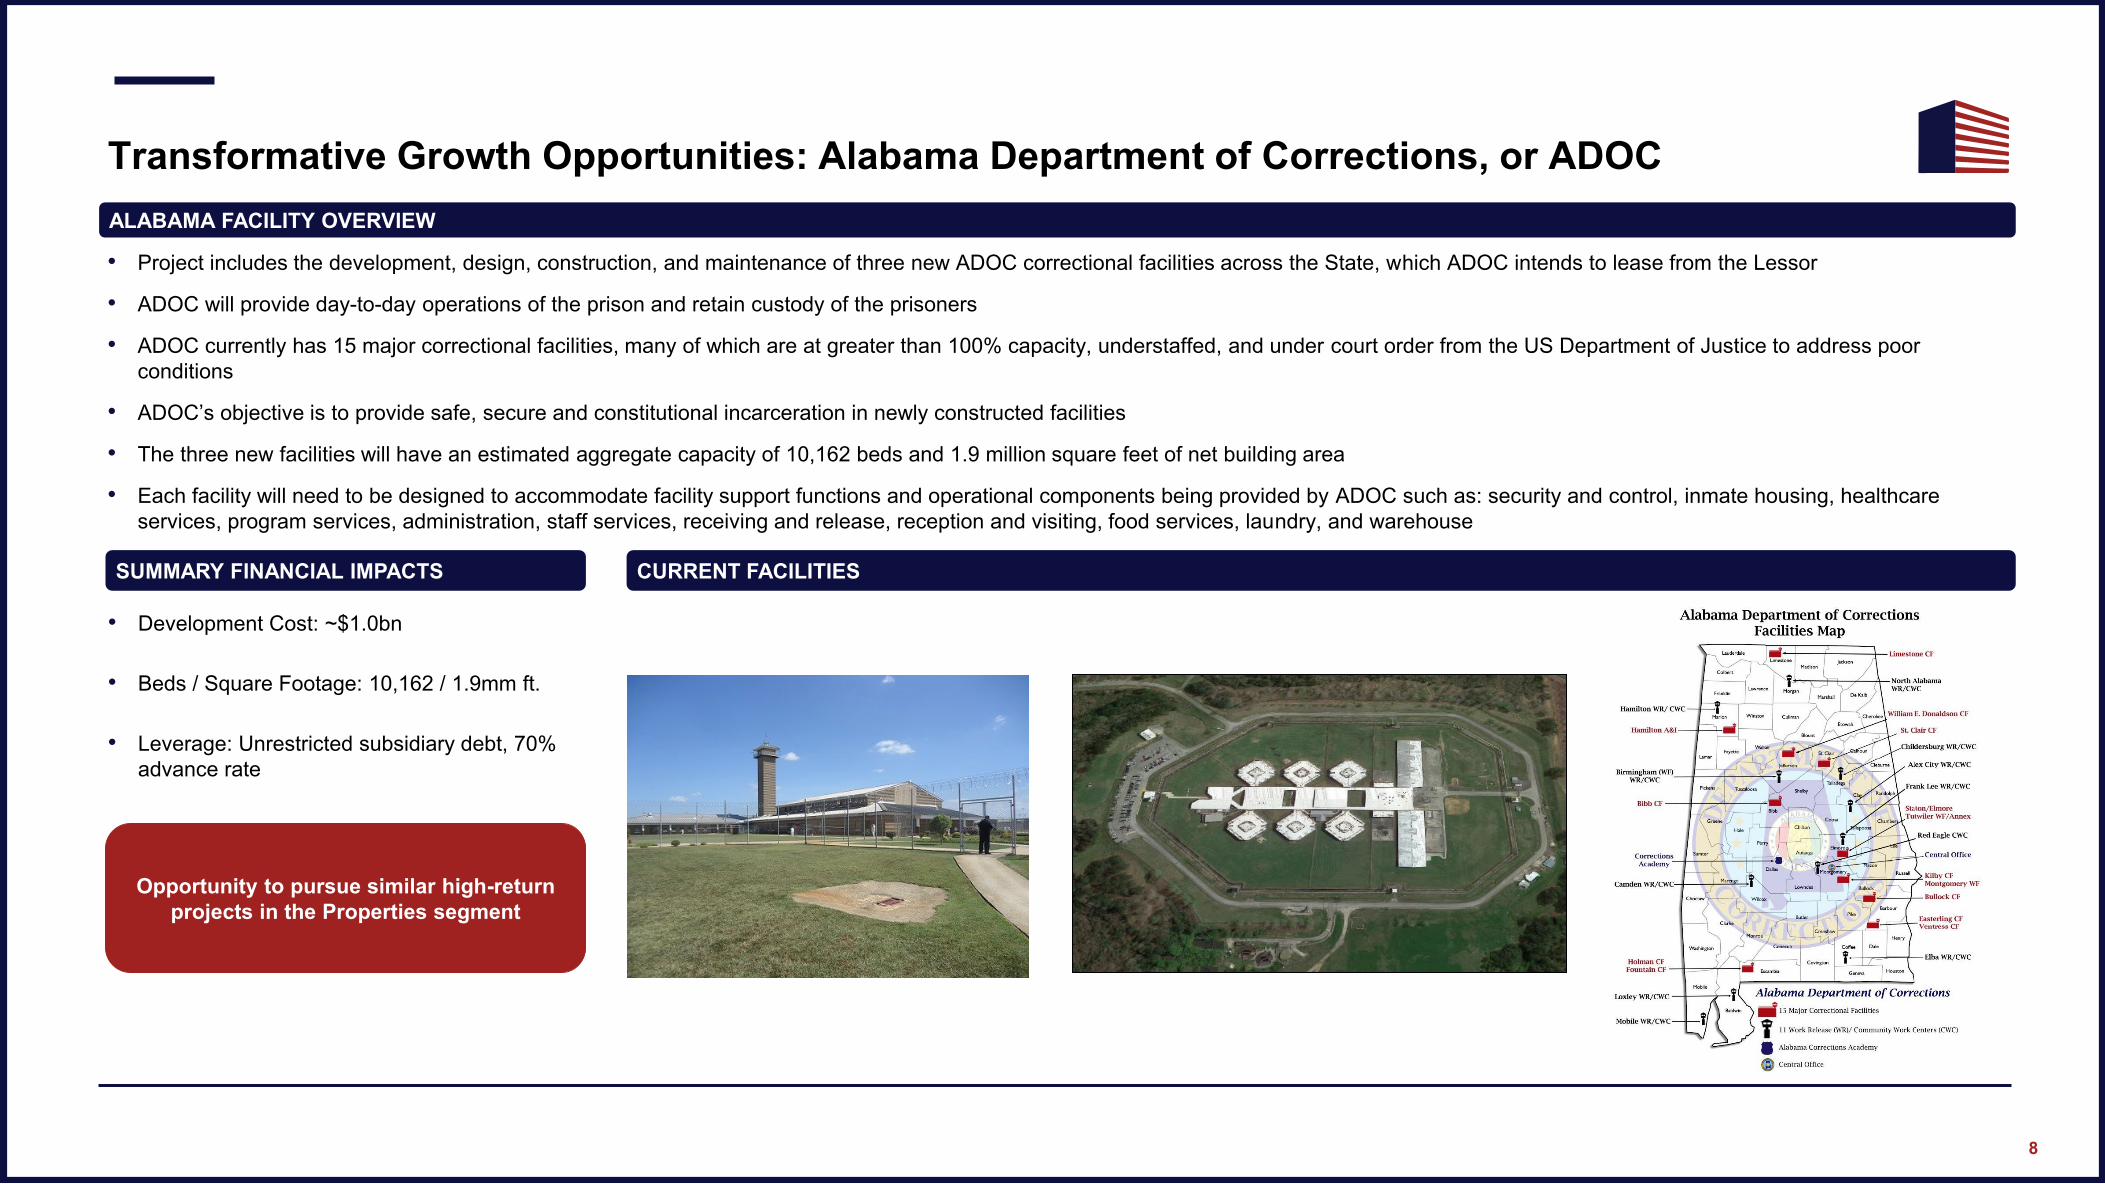
Transformative Growth Opportunities: Alabama Department of Corrections, or ADOC
8
SSA – Covington, GA – 32,000 SF – Acquired January 2020
ALABAMA FACILITY OVERVIEW
• Project includes the development, design, construction, and maintenance of three new ADOC correctional facilities across the State, which ADOC intends to lease from the Lessor
• ADOC will provide day-to-day operations of the prison and retain custody of the prisoners
• ADOC currently has 15 major correctional facilities, many of which are at greater than 100% capacity, understaffed, and under court order from the US Department of Justice to address poor
conditions
• ADOC’s objective is to provide safe, secure and constitutional incarceration in newly constructed facilities
• The three new facilities will have an estimated aggregate capacity of 10,162 beds and 1.9 million square feet of net building area
• Each facility will need to be designed to accommodate facility support functions and operational components being provided by ADOC such as: security and control, inmate housing, healthcare
services, program services, administration, staff services, receiving and release, reception and visiting, food services, laundry, and warehouse
CURRENT FACILITIES
• Development Cost: ~$1.0bn
• Beds / Square Footage: 10,162 / 1.9mm ft.
• Leverage: Unrestricted subsidiary debt, 70%
advance rate
SUMMARY FINANCIAL IMPACTS
Opportunity to pursue similar high-return
projects in the Properties segment

Appendix
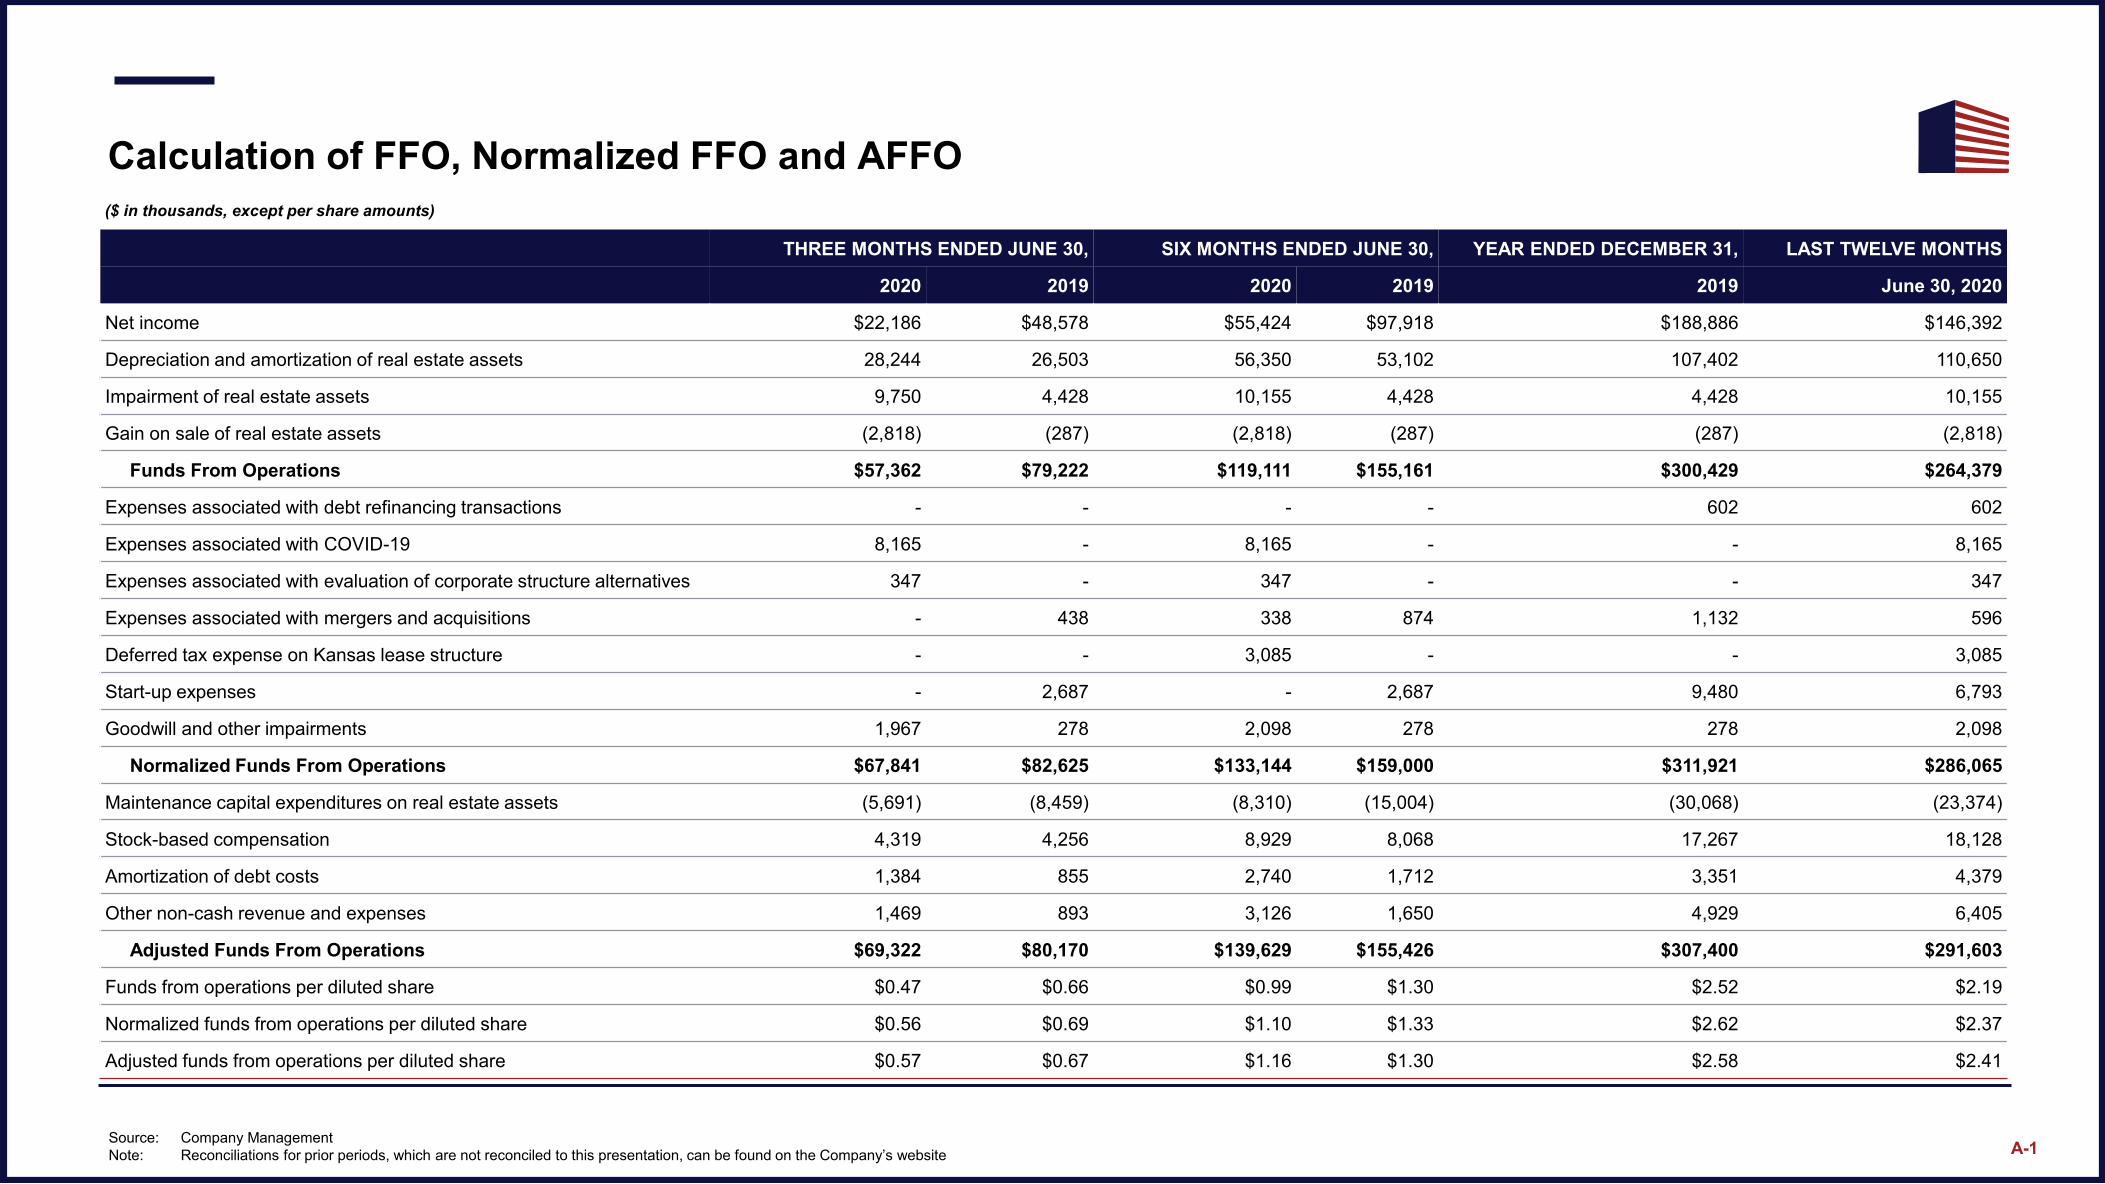
Calculation of FFO, Normalized FFO and AFFO
($ in thousands, except per share amounts)
THREE MONTHS ENDED JUNE 30, SIX MONTHS ENDED JUNE 30, YEAR ENDED DECEMBER 31, LAST TWELVE MONTHS
2020 2019 2020 2019 2019 June 30, 2020
Net income $22,186 $48,578 $55,424 $97,918 $188,886 $146,392
Depreciation and amortization of real estate assets 28,244 26,503 56,350 53,102 107,402 110,650
Impairment of real estate assets 9,750 4,428 10,155 4,428 4,428 10,155
Gain on sale of real estate assets (2,818) (287) (2,818) (287) (287) (2,818)
Funds From Operations $57,362 $79,222 $119,111 $155,161 $300,429 $264,379
Expenses associated with debt refinancing transactions - - - - 602 602
Expenses associated with COVID-19 8,165 - 8,165 - - 8,165
Expenses associated with evaluation of corporate structure alternatives 347 - 347 - - 347
Expenses associated with mergers and acquisitions - 438 338 874 1,132 596
Deferred tax expense on Kansas lease structure - - 3,085 - - 3,085
Start-up expenses - 2,687 - 2,687 9,480 6,793
Goodwill and other impairments 1,967 278 2,098 278 278 2,098
Normalized Funds From Operations $67,841 $82,625 $133,144 $159,000 $311,921 $286,065
Maintenance capital expenditures on real estate assets (5,691) (8,459) (8,310) (15,004) (30,068) (23,374)
Stock-based compensation 4,319 4,256 8,929 8,068 17,267 18,128
Amortization of debt costs 1,384 855 2,740 1,712 3,351 4,379
Other non-cash revenue and expenses 1,469 893 3,126 1,650 4,929 6,405
Adjusted Funds From Operations $69,322 $80,170 $139,629 $155,426 $307,400 $291,603
Funds from operations per diluted share $0.47 $0.66 $0.99 $1.30 $2.52 $2.19
Normalized funds from operations per diluted share $0.56 $0.69 $1.10 $1.33 $2.62 $2.37
Adjusted funds from operations per diluted share $0.57 $0.67 $1.16 $1.30 $2.58 $2.41
A-1Source: Company Management
Note: Reconciliations for prior periods, which are not reconciled to this presentation, can be found on the Company’s website
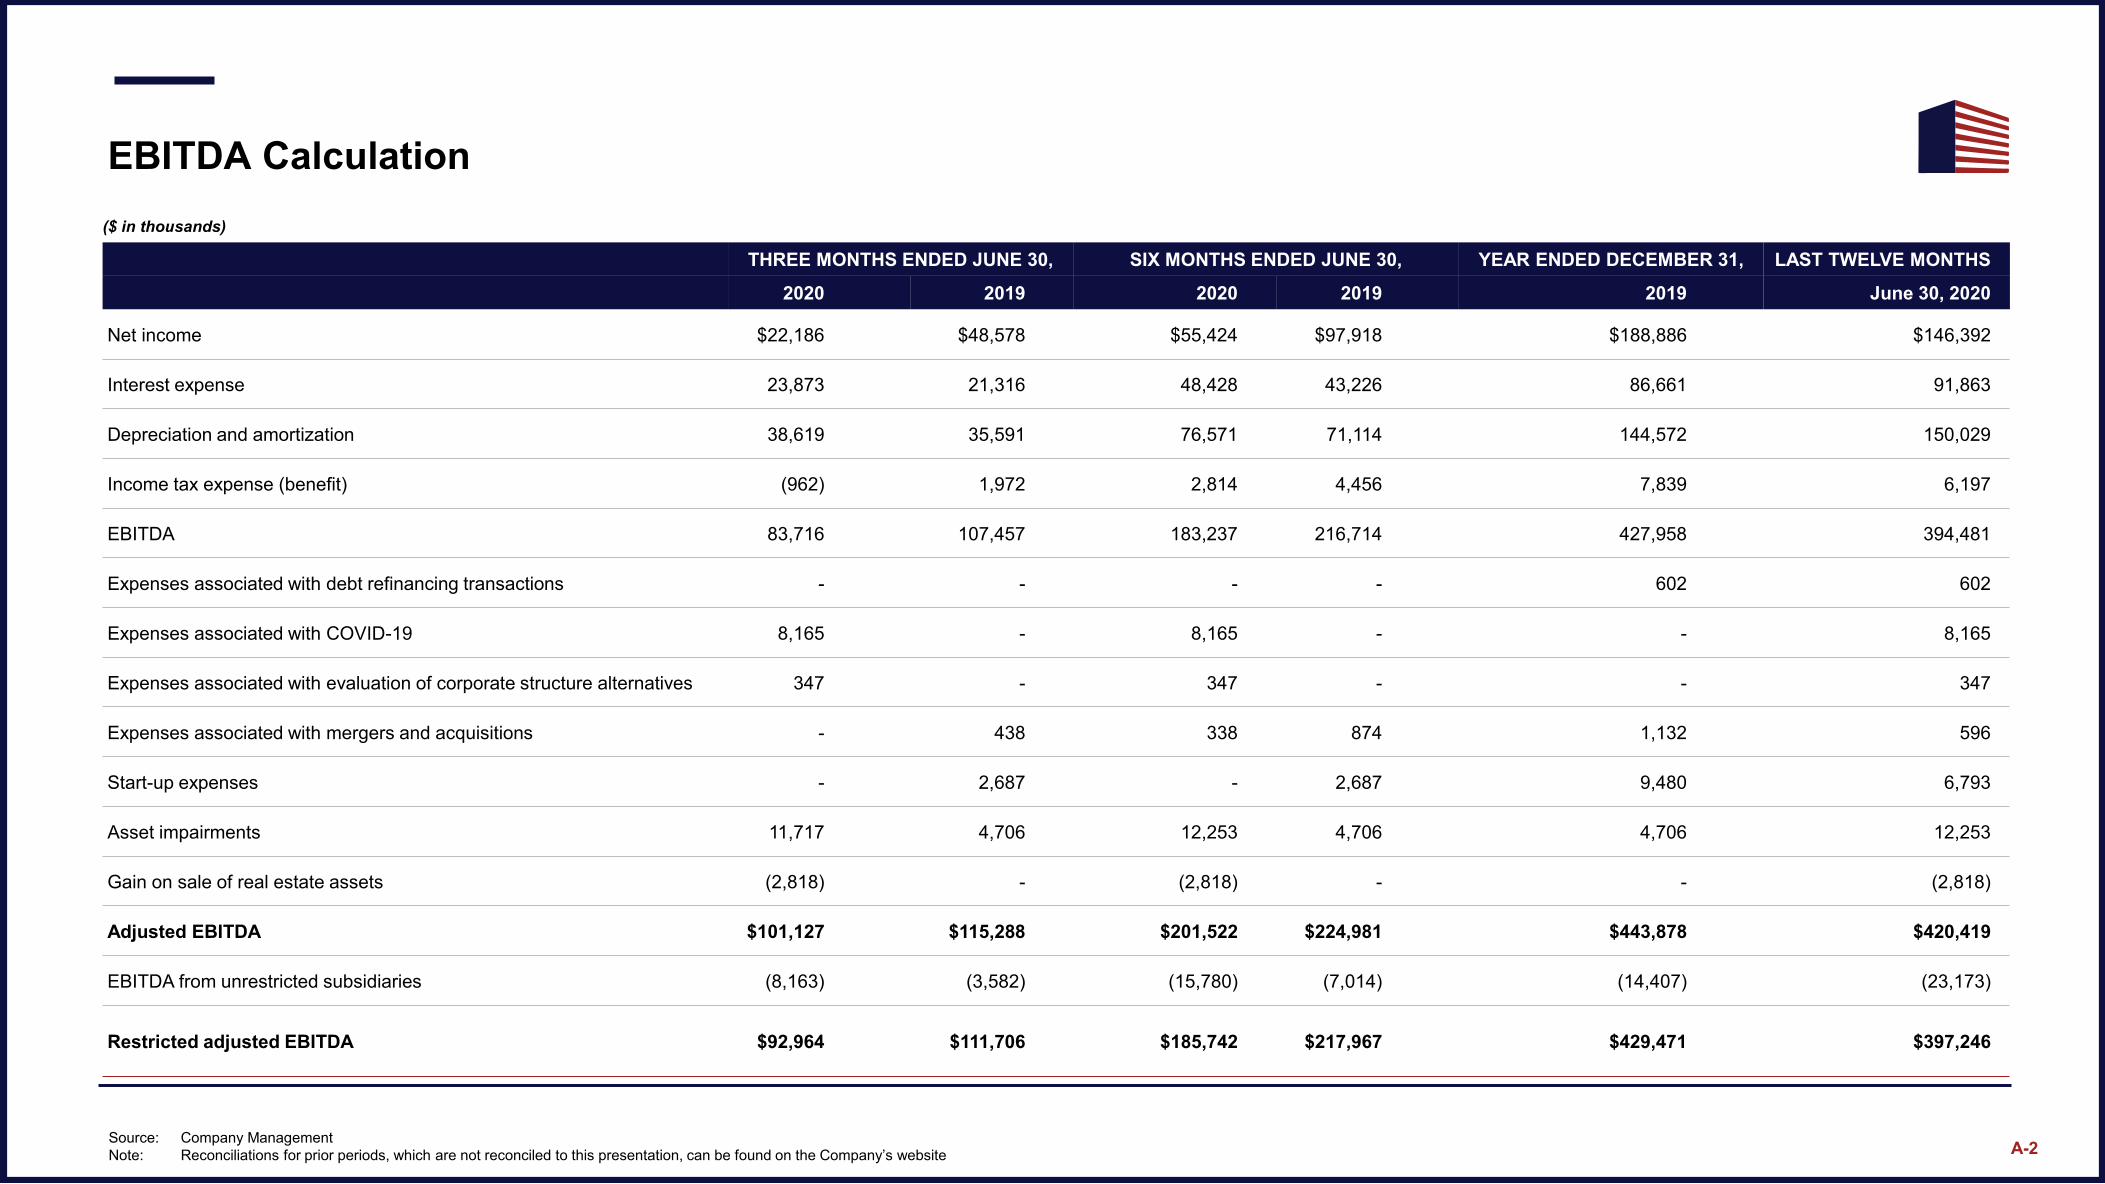
EBITDA Calculation
THREE MONTHS ENDED JUNE 30, SIX MONTHS ENDED JUNE 30, YEAR ENDED DECEMBER 31, LAST TWELVE MONTHS
2020 2019 2020 2019 2019 June 30, 2020
Net income $22,186 $48,578 $55,424 $97,918 $188,886 $146,392
Interest expense 23,873 21,316 48,428 43,226 86,661 91,863
Depreciation and amortization 38,619 35,591 76,571 71,114 144,572 150,029
Income tax expense (benefit) (962) 1,972 2,814 4,456 7,839 6,197
EBITDA 83,716 107,457 183,237 216,714 427,958 394,481
Expenses associated with debt refinancing transactions - - - - 602 602
Expenses associated with COVID-19 8,165 - 8,165 - - 8,165
Expenses associated with evaluation of corporate structure alternatives 347 - 347 - - 347
Expenses associated with mergers and acquisitions - 438 338 874 1,132 596
Start-up expenses - 2,687 - 2,687 9,480 6,793
Asset impairments 11,717 4,706 12,253 4,706 4,706 12,253
Gain on sale of real estate assets (2,818) - (2,818) - - (2,818)
Adjusted EBITDA $101,127 $115,288 $201,522 $224,981 $443,878 $420,419
EBITDA from unrestricted subsidiaries (8,163) (3,582) (15,780) (7,014) (14,407) (23,173)
Restricted adjusted EBITDA $92,964 $111,706 $185,742 $217,967 $429,471 $397,246
($ in thousands)
A-2Source: Company Management
Note: Reconciliations for prior periods, which are not reconciled to this presentation, can be found on the Company’s website
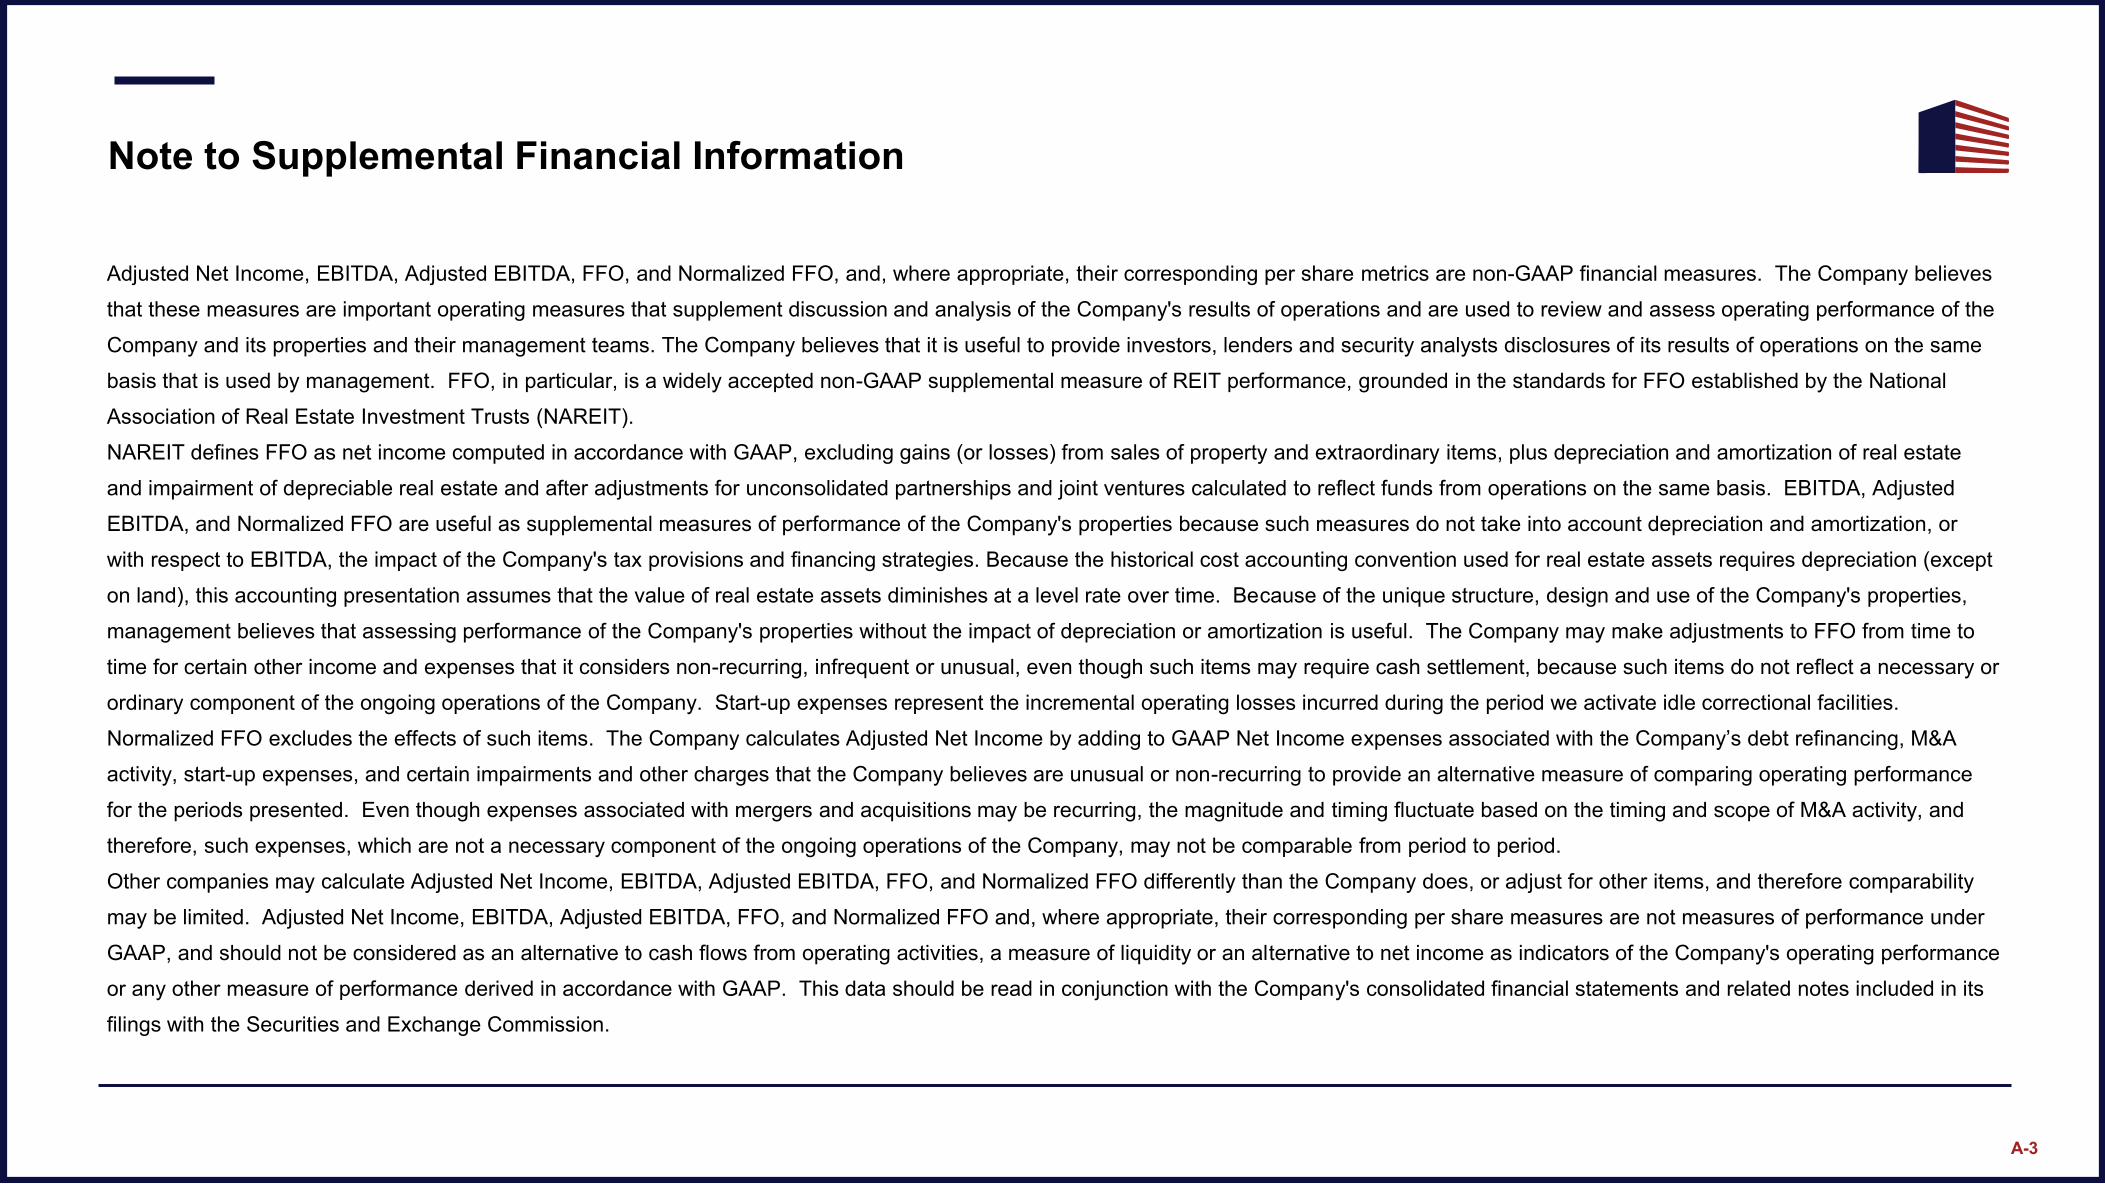
Adjusted Net Income, EBITDA, Adjusted EBITDA, FFO, and Normalized FFO, and, where appropriate, their corresponding per share metrics are non-GAAP financial measures. The Company believes
that these measures are important operating measures that supplement discussion and analysis of the Company's results of operations and are used to review and assess operating performance of the
Company and its properties and their management teams. The Company believes that it is useful to provide investors, lenders and security analysts disclosures of its results of operations on the same
basis that is used by management. FFO, in particular, is a widely accepted non-GAAP supplemental measure of REIT performance, grounded in the standards for FFO established by the National
Association of Real Estate Investment Trusts (NAREIT).
NAREIT defines FFO as net income computed in accordance with GAAP, excluding gains (or losses) from sales of property and extraordinary items, plus depreciation and amortization of real estate
and impairment of depreciable real estate and after adjustments for unconsolidated partnerships and joint ventures calculated to reflect funds from operations on the same basis. EBITDA, Adjusted
EBITDA, and Normalized FFO are useful as supplemental measures of performance of the Company's properties because such measures do not take into account depreciation and amortization, or
with respect to EBITDA, the impact of the Company's tax provisions and financing strategies. Because the historical cost accounting convention used for real estate assets requires depreciation (except
on land), this accounting presentation assumes that the value of real estate assets diminishes at a level rate over time. Because of the unique structure, design and use of the Company's properties,
management believes that assessing performance of the Company's properties without the impact of depreciation or amortization is useful. The Company may make adjustments to FFO from time to
time for certain other income and expenses that it considers non-recurring, infrequent or unusual, even though such items may require cash settlement, because such items do not reflect a necessary or
ordinary component of the ongoing operations of the Company. Start-up expenses represent the incremental operating losses incurred during the period we activate idle correctional facilities.
Normalized FFO excludes the effects of such items. The Company calculates Adjusted Net Income by adding to GAAP Net Income expenses associated with the Company’s debt refinancing, M&A
activity, start-up expenses, and certain impairments and other charges that the Company believes are unusual or non-recurring to provide an alternative measure of comparing operating performance
for the periods presented. Even though expenses associated with mergers and acquisitions may be recurring, the magnitude and timing fluctuate based on the timing and scope of M&A activity, and
therefore, such expenses, which are not a necessary component of the ongoing operations of the Company, may not be comparable from period to period.
Other companies may calculate Adjusted Net Income, EBITDA, Adjusted EBITDA, FFO, and Normalized FFO differently than the Company does, or adjust for other items, and therefore comparability
may be limited. Adjusted Net Income, EBITDA, Adjusted EBITDA, FFO, and Normalized FFO and, where appropriate, their corresponding per share measures are not measures of performance under
GAAP, and should not be considered as an alternative to cash flows from operating activities, a measure of liquidity or an alternative to net income as indicators of the Company's operating performance
or any other measure of performance derived in accordance with GAAP. This data should be read in conjunction with the Company's consolidated financial statements and related notes included in its
filings with the Securities and Exchange Commission.
Note to Supplemental Financial Information
A-3