
c Copyright 2012 Adis Data Information BV. All rights ...eprints.qut.edu.au/50191/1/50191.pdf · 3...
33
This is the author’s version of a work that was submitted/accepted for pub- lication in the following source: Bleakley, Chris, Costello, Joseph, & Glasgow, Phil (2012) Should athletes return to sport after applying Ice? A systematic review of the effect of local 3 cooling on functional performance. Sports Medicine, 42 (1), pp. 69-87. This file was downloaded from: https://eprints.qut.edu.au/50191/ c Copyright 2012 Adis Data Information BV. All rights reserved Notice: Changes introduced as a result of publishing processes such as copy-editing and formatting may not be reflected in this document. For a definitive version of this work, please refer to the published source: https://doi.org/10.2165/11595970-000000000-00000
Transcript of c Copyright 2012 Adis Data Information BV. All rights ...eprints.qut.edu.au/50191/1/50191.pdf · 3...

This is the author’s version of a work that was submitted/accepted for pub-lication in the following source:
Bleakley, Chris, Costello, Joseph, & Glasgow, Phil(2012)Should athletes return to sport after applying Ice? A systematic review ofthe effect of local 3 cooling on functional performance.Sports Medicine, 42(1), pp. 69-87.
This file was downloaded from: https://eprints.qut.edu.au/50191/
c© Copyright 2012 Adis Data Information BV. All rights reserved
Notice: Changes introduced as a result of publishing processes such ascopy-editing and formatting may not be reflected in this document. For adefinitive version of this work, please refer to the published source:
https://doi.org/10.2165/11595970-000000000-00000

1
TITLE 1
Should athletes return to sport after applying Ice? A systematic review of the effect of local 2
cooling on functional performance 3
4 1Chris M Bleakley,
2Joseph T Costello,
3 Philip D Glasgow 5
6
1Health and Rehabilitation Sciences Research Institute, Faculty of Life and Health Sciences, 7
University of Ulster, Newtownabbey 8
2Department of Physical Education and Sports Sciences, University of Limerick 9
3Sports Institute Northern Ireland, University of Ulster, Newtownabbey 10
11
RUNNING TITLE 12
Effect of tissue cooling on functional performance 13
14
WORD COUNT 15
REVIEW ARTICLE: 4628 16
17
ACKNOWLEDGEMENTS 18
Part of this project was funded by the Association of Chartered Physiotherapists in Sports and 19
Exercise Medicine (ACPSM). Authors declare no conflicts of interest 20
21
22
23
24
25
26
27
28
29
30
31
32
33
34
35

2
TABLE OF CONTENTS 1
1. Abstract 2
2. Background 3
3. Methods 4
3.1 Search strategy 5
3.2 Inclusion criteria 6
3.3 Selection of studies 7
3.4 Data extraction and management 8
3.5 Measures of treatment effect 9
3.6 Risk of bias 10
3.7 Subgroup analysis 11
4. Results 12
4.1 Included studies 13
4.2 Details of outcomes 14
4.3 Follow up 15
4.4 Risk of bias 16
4.5 Muscle strength 17
4.6 Muscle endurance 18
4.7 Vertical jump, sprint and agility performance 19
4.8 Performance accuracy 20
4.9 Upper limb dexterity 21
4.10 Summary of the effects of cooling 22
4.11 Duration of effects post cooling 23
4.12 Cooling dose 24
4.13 Adverse effects 25
5. Discussion 26
5.1 Quality of evidence 27
5.2 Muscle strength 28
5.3 Muscle endurance 29
5.4 Vertical jump, sprint and agility performance 30
5.5 Cooling dose, return to sport and warm up 31
5.6 Comparison to other reviews 32
5.7 Limitations 33
6. Conclusion 34
7. References 35
8. Table 1: Study characteristics 36

3
9. Figures I-V 1
2
FIGURE CAPTIONS 3
Figure I: Medline Search Strategy 4
Figure II: Summary of search strategy and selection process based on included and excluded studies 5
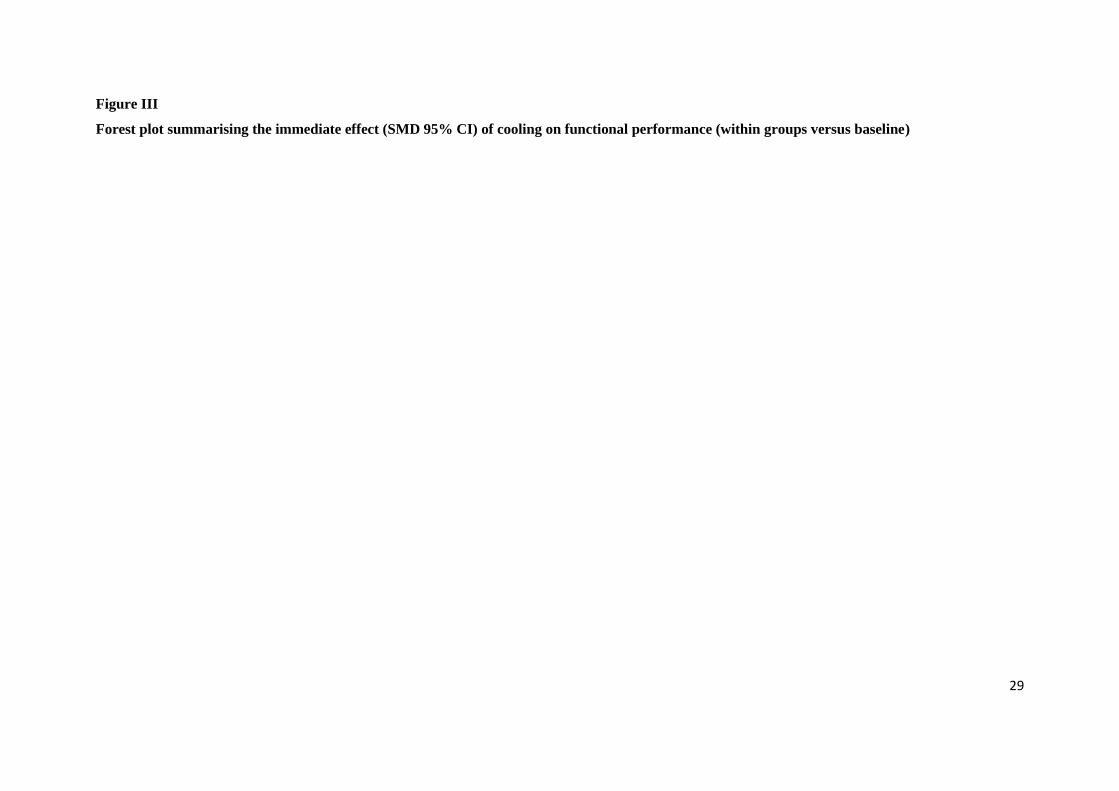
Figure III: Risk of bias summary 6
Figure IV: Forest plot summarising the immediate effect (standardised mean difference [95% 7
confidence intervals]) of cooling on functional performance (within groups versus baseline) 8
Figure V: Forest plot summarising the immediate effect (standardised mean difference [95% 9
confidence intervals]) of cooling on functional performance (Ice versus control) 10
11
12
13
14
15
16
17
18
19
20
21
22
23
24
25
26
27
28
29
30
31
32
33
34
35
36

4
1. Abstract 1
Background: Applying ice or other forms of topical cooling is a popular method of treating sports 2
injuries. It is commonplace for athletes to return to competitive activity, shortly or immediately after 3
the application of cold. 4
Aim: To examine the effect of tissue cooling on outcomes relating to functional performance and to 5
discuss their relevance to the sporting environment. 6
Methods: A computerized literature search, citation tracking, and hand searching were carried out up 7
to April 2011. Eligible studies were trials involving healthy human participants describing the effects 8
of cooling on outcomes relating to functional performance. Two reviewers independently assessed the 9
validity of included trials, and calculated effect sizes. 10
Results: 35 trials met the inclusion criteria; all had high risk of bias. The mean sample size was 19. 11
Meta-analyses were not undertaken due to clinical heterogeneity. The majority of studies used cooling 12
durations greater than 20 minutes. Strength (peak torque/force) was reported by 25 studies with 13
approximately 75% recording a decrease in strength immediately following cooling. There was 14
evidence from six studies that cooling adversely affected speed, power and agility based running 15
tasks; two studies found this was negated with a short re-warming period. There was conflicting 16
evidence on the effect of cooling on isolated muscular endurance. A small number of studies found 17
that cooling decreased upper limb dexterity and accuracy. 18
Conclusion: The current evidence base suggests that athletes will probably be at a performance 19
disadvantage if they return to activity immediately after cooling. This is based on cooling for longer 20
than 20 minutes which may exceed the durations employed in some sporting environments. In 21
addition, some of the reported changes were clinically small and may only be relevant in elite sport. 22
Until better evidence is available, practitioners should use short cooling applications and/or undertake 23
a progressive warm up prior to returning to play. 24
25
26
27
28
29
30
31
32
33
34
35
36

5
2. Background 1
Applying ice or other forms of topical cooling is a popular method of treating acute sports injuries. In 2
competitive sport, this may occur during a game, pitch-side or at half time. The premise is usually to 3
provide reduce pain,[1]
and in the absence of significant injury, athletes will often return to competitive 4
activity shortly or immediately after the application of cold. In addition to providing pain relief, local 5
cooling has potential to produce concomitant effects on many other physiological systems. A recent 6
systematic review by Costello and Donnelly[2]
found limited equivocal evidence on the effect that 7
joint cooling has on proprioception (joint positional sense); as such, the authors advised caution when 8
individuals are returning to competition immediately after cooling. 9
Although the analgesic effects of cooling are well established[1]
these must be balanced with any 10
potential adverse effects, to make clear recommendations for its use. Currently, there is little 11
evidenced based consensus on how cooling may affect other physiological systems relevant to sports 12
and exercise; a large magnitude of effect could implicate sporting performance and injury risk. Our 13
aim was to undertake a systematic review to examine the effect of tissue cooling on outcomes relating 14
to functional performance and to discuss their relevance to the sporting community. 15
16
3. Methods 17
3.1 Search Strategy 18
We searched MEDLINE, the Cochrane Central Register of Controlled Trials (CCTR), and EMBASE. 19
18 Medline subject headings (MeSH) or key words were combined. Results were limited human 20
subjects, and subject headings were modified for use in CCTR and EMBASE. Each database was 21
searched from their earliest available record up to April 2011. We also searched Current Controlled 22
Trials and the World Health Organisation (WHO) International Clinical Trials Registry for ongoing 23
and recently completed trials, undertook a related articles search using on Pubmed 24
(http://www.ncbi.nlm.nih.gov/pubmed) and read reference lists of all incoming articles. English 25
language restrictions were applied. 26
27
3.2 Inclusion criteria 28
No restrictions were made on study design or comparison group. Studies must have involved human 29
participants treated with a local cooling intervention. Interventions using whole body cooling eg. cold 30
water immersion above the waist or whole body cryotherapy (WBC) using an environmental 31
chamber, or other forms of cold air cooling were excluded. Studies must have reported at least one 32
outcome relating to functional performance (eg. muscle strength, power, speed, agility, accuracy 33
movement), measured both before after cooling intervention. Studies measuring strength or force 34
production during evoked muscle contractions were not considered. 35
3.3 Selection of studies 36

6
Two authors independently selected trials for inclusion (CB, PG). The titles and abstracts of 1
publications obtained by the search strategy were screened. All trials classified as relevant by either of 2
the authors were retrieved. Based on the information within the full reports, we used a standardised 3
form to select the trials eligible for inclusion in the review. Disagreement between the authors was 4
resolved by consensus, or third party adjudication (JC). 5
6
3.4 Data extraction and management 7
Data were extracted independently by two review authors using a customised form (CB, JC). This was 8
used to extract relevant data on methodological design, eligibility criteria, interventions (including 9
detailed characteristics of the cooling protocols), comparisons and outcome measures. Any 10
disagreement was resolved by consensus, or third party adjudication (PG). To perform intention-to-11
treat analysis, where possible, data were extracted according to the original allocation groups, and 12
losses to follow-up were noted. There was no blinding to study author, institution or journal at this 13
stage. 14
15
3.5 Measures of treatment effect 16
For each study, mean differences (MD) or standardised mean differences (SMD) and 95% confidence 17
intervals (CIs) were calculated for continuous outcomes using RevMan software. Treatment effects 18
(MD, SMD) could be based on between group comparisons (ice vs control) using follow up data, 19
and/or within group comparisons (pre ice vs post ice). When standard deviations were missing from 20
continuous data, studies were scanned for any other statistics (confidence intervals, standard errors, T 21
values, P values, F values) that allow for its calculation. There were no cases were large numbers of 22
standard deviations were missing. 23
24
3.6 Risk of bias 25
For all included studies, methodological quality was assessed by two authors independently (CB, JC), 26
using the Cochrane risk of bias tool.[3]
Each study was graded for the following domains; sequence 27
generation, allocation concealment, blinding (assessor), and incomplete outcome data. For each 28
study, the domains were described as reported in the published study report (or if appropriate based on 29
information from related protocols, or published comments) and judged by the review authors as to 30
their risk of bias. They were assigned ‘Low’ if criteria for low risk of bias are met or 'High' if criteria 31
for high risk of bias are met. If insufficient detail of what happened in the study was reported, or if 32
what happened in the study was known, but the risk of bias was unknown, then the risk of bias was 33
deemed 'Unclear' for that domain. Disagreements between authors regarding the risk of bias for 34
domains were resolved by consensus. 35
36

7
3.7 Subgroup analysis 1
Differences in study quality and details of the treatment intervention (e.g. duration of cooling, time 2
period between cooling cessation and follow up assessment), were regarded as a potential source of 3
bias and considered for subgroup analysis. 4
5
4. Results 6
Figure I summarises the search strategy and selection process based on included and excluded studies. 7
Insert Figure I 8
9
4.1 Included studies 10
Characteristics of included studies are summarised in Table I. There were 35 eligible studies,[4-38]
11
comprising a total of 665 healthy participants. The average sample size was 19 with the largest study 12
based on 89 participants. Participants tended to be young and mean ages ranged from 19 [19]
to 32 13
years; [26]
one study[36]
included a subgroup of elderly participants (>70 years). 14
15
Insert Table I 16
17
Twenty-seven studies (n=3 randomised controlled trials, and n=24 cross over trials) incorporated a 18
cooling group and a resting control condition. In cross over studies the time between conditions 19
ranged from one day, up to 14 days. The remaining eight studies were observational and measured 20
outcomes before (baseline) and after cold application. The duration of cooling ranged between 3 and 21
45 minutes. All but seven studies[13,22,25,26,28,29,34]
applied cooling for at least 20 minutes. Two[25,34]
22
included a comparison of different cooling durations and three,[7,21,36]
cooled until pre-determined 23
intra-muscular (I/M) temperature reductions were reached (~30° I/M temperature). A total of 15 24
studies recorded the tissue temperature reductions associated with cooling. Eight recorded skin 25
temperature[11,13,17,24,25,27,35,38]
with the lowest values reported in individual studies ranging from 26
~11.9°C[38]
to 22.5°C.[13]
Seven recorded I/M temperatures[4,7-9,12,21,36]
with lowest values ranging 27
between 23°C9 and 30.4°C.
[7] 28
29
4.2 Details of outcomes 30
Twenty five studies recorded muscle strength.[4-9,11-15,18,20-24,26-30, 35,36,38]
The majority used an isokinetic 31
dynamometer to measure peak force (N) or torque (Nm) at isolated body regions: knee extension, 32
elbow flexion and ankle (all movements). The remainder used a cable tensiometer[8,22]
or a strain 33
gauge device or load cell[4,11,35,38]
with one[21]
failing to specify the recording device. Eight 34
studies[5,6,9,10,13,26,29,35]
measured grip strength using a hand grip dynamometer; three further studies 35

8
measured isolated finger strength[11]
or hand dexterity.[25,35]
Nine studies assessed endurance based on 1
the total work [14,15,20]
or time to fatigue[4,9,10,22,27,29]
undertaken during multiple exercise repetitions. 2
Six studies examined the effect of cooling immediately prior to undertaking various types of whole 3
body exercise tests. These included vertical jump height[19,31]
or power,[33,37]
timed hop test,[19]
sprint 4
time[31,33]
and the time taken to complete various running based agility tests eg. caricoca runs,[16]
5
shuttle sprints,[16,19,31,34]
T-Shuttle[33]
or co-contraction test.[16,34]
Two studies recorded performance 6
accuracy during throwing (% of ball throws to hit a target in 30 seconds)[32]
and shooting (total 7
shooting score)[17]
and two[25,35]
measured hand dexterity. 8
9
4.3 Follow up 10
All studies recorded outcomes before and immediately after cooling. Eleven studies undertook 11
additional outcome assessment at 5,29,38
7,33
10,22,29
12,33
15,26, 37, 38
17,33
20,31,34
22,33
27,33
30,8,38
32,33
12
45,38
60,8,38
90,8 120
8 and 180
8 minutes post treatment. Additionally both Johnson
5 and Coppin
[6] 13
repeated the assessment of grip strength every 20 minutes for 4 hours post treatment. 14
15
4.4 Risk of bias 16
There was a high risk of bias across all studies as summarised in Figure II. 15 studies stated that 17
participants were randomised into groups, however only two[8,24]
provided adequate details on how the 18
random sequence was generated. There was further risk of selection bias as just one randomised 19
study24
adequately reported allocation concealment. Blinding of outcome assessor was not reported in 20
any study. Due to the nature of the intervention we did not assess blinding of participants or care 21
givers. There was a high risk of attrition bias across all studies; only four studies[6,22,33,37]
provided any 22
information relating to drop outs, exclusions, missing data or approach to analysis. 23
24
Insert Figure II 25
26
4.5 Muscle Strength: Lower limb (thigh) 27
Eight studies focused on quadriceps strength. Howard et al.[15]
found that a 45 minute cold water 28
immersion resulted in significant strength reductions during knee extension with the largest changes 29
observed during high speed isokinetic test speeds (180°/sec-400°/sec); peak torque, average power 30
and total work were all reduced by up to 27% compared with baseline values. Three studies[7,21,36]
31
recorded a number of knee extension strength outcomes after inducing a range of intra-muscular 32
temperature reductions. Zhou et al.[21]
found peak knee extension force decreased when quadriceps 33
muscle temperatures were cooled below 34°C, with further decreases when muscle temperatures of 34
30°C were reached (MD 126.80 N [95% CI: -1.38 to 254.98] vs baseline). Dewhurst et al.[36]
found 35

9
that colder intramuscular temperatures (~30°C) were associated lower isokinetic torques, however this 1
was only observed in a sub-group of younger participants. Bergh and Ekblom[7]
reported that for every 2
1°C decrease in intramuscular temperature, both extension torque and power declined by around 5%. 3
A small study12
found that compared to untreated control, a 45 minute cold water immersion (12°C or 4
18°C) involving the lower limbs decreased isokinetic cycling performance in terms of peak force (MD 5
143 Newtons [95% CI -19.36 to 305.36]) and peak power output (MD 278 Watts [95% CI -9 to 565]). 6
Others reported more moderate changes. Thornley et al.[27]
found little to no differences in knee 7
extension torque immediately after treatment when groups were treated with hot and cold packs at a 8
range of temperatures; of note the cold group had the largest reduction from baseline (MD 19 Nm 9
95% CI -25.96 to 63.96). In contrast, Sanya and Bello[22]
found that 30 minutes of thigh cooling 10
increased isometric quadriceps strength (MD 5.89 kgf [1.88 to 9.9]). Catlaw et al.[18]
also found 11
higher eccentric strength during knee extension after cooling; this was measured over a range of test 12
speeds with the largest between group differences occurring at 175°.s-1
(MD 40Nm [95% CI: 280.8 to 13
51.62] vs control). 14
15
Muscle strength: Lower limb (calf/ankle) 16
A 20 minute cold water immersion of the lower limb significantly decreased plantar flexion peak 17
torque (MD 10 ft lbs [95% CI -2.1 to 22.1] vs control).[14]
Kubo et al.[30]
used a more intense 18
intervention on the entire lower leg (30 minute cold water immersion at 5°C), and reported similar 19
decreases in ankle plantar flexion peak torque immediately after cooling (MD 9.30Nm [95% CI: -5.02 20
to 23.62] vs baseline). Using a different measuring device, Pereira et al.[38]
reported decreased plantar 21
flexion torque (MD 37 N 95% CI: -43.14 to 117.14 vs baseline) after a 30 minute crushed ice pack on 22
the antero-lateral musculature. 23
Hatzel et al.[23]
recorded a wide spectrum of strength outcomes at the ankle (concentric and eccentric 24
peak torque, in plantar flexion, dorsiflexion, eversion and inversion) before and after a 20 minute cold 25
water immersion, however the only significant finding was a decrease in concentric dorsiflexion 26
immediately after cooling (MD 7.4 N/m [95% CI: 14.93, -0.13 to 14.93] vs baseline). Hopkins et 27
al.[24]
found that a 30 minutes ice pack application to the lateral ankle joint induced small increases in 28
plantar flexion peak torque, compared to a resting control. Using a similar design, Kimura et al.[20]
29
also found that a 30 minute cold water immersion resulted in small increases in eccentric ankle plantar 30
flexion peak torque (MD 3.93 Nm [95% CI: -12.23 to 20.09]) 31
32
Muscle strength: Upper limb 33
Borgmeyer et al.[28]
found that 10 minutes of biceps cooling had little effect on concentric or 34
isokinetic strength at the elbow (MD 0.4 Nm [95% CI -1.45 to 2.25] vs control). Five studies found 35
that long durations (>30 minutes) of upper limb cold water immersion, significantly decreased 36

10
isolated finger strength[11]
and hand grip strength.[5,6,9,35]
There was sufficient data for effect size 1
calculation in just one of these studies (MD 4.10 kg [95% CI: -9.66 to 17.86] vs control),[9]
with one 2
other[35]
stating that grip strength was reduced by 12%. Three further studies[13,26,29]
were based on 3
shorter periods of cooling (<10 minutes) of the hand and/or forearm; both Douris et al[26]
(MD: 129N 4
[95% CI: 121.16 to 136.84]) and Vincent and Tipton[13]
(decreased by 13-16%) found significant 5
reductions in peak grip strength compared to pre-cooling values, whereas, Hamzat and Fatudimu[29]
6
found little to no change in grip strength immediately following an ice towel application (MD 0.36 7
Newtons 95% CI -2.21 to 2.93) vs baseline]. 8
9
4.6 Muscle endurance 10
Kimura et al.[20]
reported that a 30 minute cold water immersion significantly increased plantar flexion 11
endurance (total work during 100 repetitions) (MD 377.82Nm [95% CI: -158.03 to 913.67]) 12
compared to a resting control condition. Three studies also found that cooling significantly increased 13
isometric endurance based on time to fatigue at the quadriceps[22,27]
or hand grip muscles;[29]
the 14
magnitude of the changes were much larger in Thorley et al.[27]
(MD 26.4 secs [-1.61 to 54.41] vs 15
heating) compared to both Sanya and Bello[22]
(MD 4.08 secs [-0.88 to 9.04] vs baseline) and Hamzat 16
and Fatudimu[29]
(MD 5.04 secs [95% CI 1.08 to 9] vs baseline). 17
In contrast, both Petrofsky and Lind[9]
and Barter and Freer[10]
found cold water immersion reduced 18
time to grip strength fatigue compared to neutral water immersion; the magnitude of effects differed 19
across each study (MD 293 secs [95% CI: 132.96 to 453.04])[9]
(MD 0.8 secs [95% CI: -6.22 to 20
7.82]).[10]
Mattacola and Perrin[14]
also reported reduced endurance after cooling ankle plantar flexors 21
(MD 45 ft lbs [95% CI -4.92 to 94.92] vs control); a small study by Edwards et al.[4]
concluded 22
quadriceps endurance was optimised at immersion in water at 26°C but tended to decrease after 23
immersions at extreme temperature (either 10°C or 44°C). In a further study[15]
long durations (45 24
minutes) of cooling did not affect isokinetic quadriceps muscle work, over a range of test speeds. 25
26
4.7 Vertical jump; sprint and agility performance 27
All studies[19,33,34,37]
found that vertical jump performance was reduced immediately after cooling; this 28
was observed after 10 minutes of crushed ice applied to the hamstrings (MD 1.10cm [95% CI -1.96 to 29
4.16] vs baseline),[34]
20 minutes of lower limb cold water immersion in 13°C (MD 2.14cm [95% CI: -30
3.54 to 7.82] vs baseline)[19]
or 20 minutes of lower limb cold water immersion in 10°C (MD 648 31
Watts [95% CI 10.91 to 1285.09]).[33]
The largest detriments in vertical jump performance were found 32
following a 45 minute cold water immersion involving both lower limbs (MD 1165 Watts [95% CI: 33
194 to 2135.76] vs baseline).[37]
34
There was also a clear trend [19,31,33,34]
that shuttle run time was worse immediately following cooling; 35
the largest change from baseline was based on a MD of 0.63 seconds (95% CI: 0.27 to 0.99).[33]
There 36

11
was further evidence that after 10-20 minutes of lower limb icing, participants took longer to 1
complete various running based agility tests;[16, 31,33, 34]
the largest reported MD from baseline was 1.38 2
seconds [95% CI 0.72 to 2.04].[33]
3
4
4.8 Performance Accuracy 5
There was evidence from a single observational study[32]
that 20 minutes of shoulder joint cooling, 6
significantly reduced throwing accuracy (MD 7.11% [95% CI: 2.29 to 11.93] vs baseline). In contrast, 7
a small study by Lackie et al.[17]
found that compared to control, isolated forearm immersion (30 8
minutes at 10°C) decreased tremor by 40% during shooting performance and improved scoring 9
accuracy (SMD 0.89 95% CI -0.32 to 2.10). 10
11
4.9 Upper limb dexterity 12
Cheung et al.[25]
showed that short duration (300 secs) immersions of the hand and forearm 13
significantly reduced hand dexterity in terms of time to complete a functional dexterity test (MD 9 14
secs [2.89 to 15.11] vs control) and Perdue Peg Test (8.8 points [3.93 to 13.67] vs control). Chen et 15
al.[35]
also concluded that hand immersion reduced gross and fine finger dexterity by up to 55% (vs 16
baseline). 17
18
4.10 Summary of immediate effects of Cooling 19
We were unable to combine studies for meta-analyses due to heterogeneity relating to cooling 20
time/dosage, body part and outcome measure. The overall trend was a reduction in performance 21
immediately after cooling. This is evident in the forest plot graphs (SMD [95% CI]) presented in 22
Figure IV and V which summarise the within (baseline vs post ice) and between group differences 23
(ice versus control). 24
25
Insert Figures III and IV 26
27
4.11 Duration of effects post cooling 28
Two studies,[5,8]
found that over a 2-4 hour period post cooling, strength values steadily increased 29
beyond baseline levels. The remainder of studies noted that cold induced detriments in performance 30
lasted beyond the immediate stages after cooling, but for varying durations. Pereira et al.[38]
found 31
that a 5 minute rest period was enough for ankle D/F strength to return to baseline; whereas two 32
studies[22,29]
found performance remained significantly changed for up to 10 minutes post cooling. In 33
another study,[26]
the effects of cold on grip strength diminished with time, however a 5.9% strength 34
reduction (from baseline) remained 15 minutes post cold water immersion. Coppin et al.[6]
reported 35
that grip strength remained below baseline values for up to 40 minutes post immersion. Fischer et 36

12
al.[34]
found vertical jump performance was still below baseline values after a 20 minute recovery. 1
Patterson et al.[2008]
also found that vertical jump, agility and sprint performance remained lower than 2
baseline for up to 30 minutes following treatment. Similarily Richendollar et al.[31]
also found that 3
vertical jump, agility and sprint performance were all reduced for 20 minutes after cooling. However, 4
both Richendollar et al.,[31]
vertical jump, agility and sprint performance, and Dixon et al.,[37]
counter 5
movement jump, found these detriments were negated after undertaking a progressive warm up for 6
6.5 and 15 minutes respectively. 7
8
4.12 Cooling dose 9
Two studies[25,34]
incorporated different cooling durations. Fischer et al.[34]
found that although 10 10
minute treatments reduced vertical jump and agility/speed performance, no effects were reported 11
when treatment times were reduced to 3 minutes. In a comparison of three different cooling times (30, 12
120 or 300 secs), Cheung et al.[25]
also found that longer durations induced larger detriments to hand 13
dexterity. 14
15
4.13 Adverse effects 16
No study reported cold induced complications or side effects relating to skin damage, nerve palsy, or 17
allergy. One participant suffered a hamstring strain during a baseline (pre-cooling) 40 m sprint test.[33]
18
19
5. Discussion 20
5.1 Quality of evidence 21
There were large limitations within the current evidence base. Sample size was generally small, 22
raising questions as to the power of individual trials. There was also a consistently high risk of bias 23
across the studies, and we were unable to meaningfully sub-group studies into high and low quality. 24
Few studies reported adequate sequence generation or allocation concealment. As some of the 25
included studies were randomised cross over trials there may also be risk of carry over effects. 26
Primarily this could relate to a practice or learning effect during the outcome assessments. Additional 27
carry over effects may also have resulted from fatigue induced during the first treatment period; the 28
length of time between cross over conditions varied from the same day[25]
up to 2 weeks[20]
across 29
studies. In a number of the cross over trials,[9,11-15,36]
the length of time between treatment conditions 30
was not stated. 31
It is acknowledged that based on the nature of cold treatment, stringent blinding of participants and 32
caregivers is difficult. Blinding of outcome assessors should be feasible but was not reported in any of 33
the included studies. Equally no studies adequately described missing outcomes or how these were 34
managed. Overall, the consistently small sample sizes and poor quality of evidence mean that findings 35
should be interpreted with caution. 36

13
1
5.2 Muscle strength 2
Basic scientific evidence portends that cooling is detrimental to muscle performance based on cold 3
induced decreases to: nerve conduction velocity,[39]
receptor firing rate,[40]
muscle spindle activity,[41]
4
myotatic stretch reflex, and ion (Na+, K
+, Ca
2+) diffusion at the motor end plate.
[42] It is also well 5
accepted that enzymatic activity is reduced at lower temperatures, and there are further suggestions 6
that cooling impairs Ca2+
release from the muscles’ sarcoplasmic reticulum, resulting in a decline in 7
ATP availability and impaired cross bridge function.[11,43]
8
The trend from the current evidence base was that cooling reduces muscle strength. The magnitude of 9
these changes was variable however. In some cases large effects were reported based on strength 10
reductions from baseline of 13%[13]
to 27%,[15]
or peak torque losses of around 130N.[12, 21, 26]
In others, 11
cold induced strength losses were less than 9 Nm;[23, 28, 29, 30]
such changes may be less clinically 12
relevant and may only be applicable to elite sport environments. Although a small number of studies 13
found cold induced increases in force output;[8,18,20,22,24]
the magnitude of these changes were 14
consistently small. Interestingly, one of these studies[24]
applied ice directly onto the ankle joint; 15
isolated joint cooling has previously been shown to enhance muscle recruitment based on H-reflex 16
and central activation ratios at the ankle and knee.[44,45]
17
18
5.3 Muscle endurance 19
The effects of cooling on other components of muscle function were conflicting; there were some 20
suggestions towards cold induced increases in muscle endurance [14,15,20,22,27,29]
with others showing an 21
opposite effect.[4,9,10,]
Some postulate that cooling muscle prior to intense exercise, decreases pain, 22
minimises metabolic by products[46]
or prevents excessive increase in muscle temperature.[20]
23
Furthermore a recent review[47]
found that pre-cooling using ice vests, ice collars or body immersions, 24
improves aerobic performance during running and cycling. The theory is that pre-cooling prevents 25
excessive increases in core body temperature during exercise. The effect of core temperature on our 26
current findings is difficult to ascertain as no included studies measured core temperature. Of note, 27
interventions in the current review used local muscle cooling or peripheral limb immersion; previous 28
studies (Palmieri, to insert ref) found that such localised cooling does not affect core temperature. 29
30
5.4 Vertical jump; sprint and agility performance 31
The lower limb performance outcomes recorded in some of the included studies may be better 32
correlates of sports performance. Five [19,31,33,34,37]
found cooling had a negative effect on at least one 33
of the following outcomes: vertical jump, sprint or agility, with only Evans and colleagues [16]
34
reporting no changes. Vertical jump height was reduced by up to 2 cm in the immediate stages after 35
cooling.[19,34]
The majority also found that sprint or agility time was reduced by around 0.2 seconds, 36

14
with one study[33]
noting larger decreases of 1.4 seconds. The clinical relevance of these detriments 1
may again depend on the type of sport or performance level and how soon following treatment 2
individuals return to participation. 3
A small number of studies recorded skill based outcomes. There was a general trend that cooling 4
decreased hand dexterity, and throwing accuracy by approximately 7%. In contrast, a small study[17]
5
found that cooling enhanced shooting performance in novices; this was attributed to a cold induced 6
attenuation of physiological tremor (up to 40%) which was measured using an accelerometer. 7
8
5.5 Cooling dose, return to sport and warm up 9
In the current review there was variation across studies in the cooling modes, durations and body 10
areas treated. Overall, the cooling dosages were large with most studies using a minimum duration of 11
20 minutes. Indeed, many studies [4,7-9,12,21,36]
induced intramuscular temperatures to less than 30°C. It 12
is difficult to recommend an optimal tissue temperature reduction. Recent clinical guidelines[1]
13
suggest that cooling dose should be modified according to the patho-physiological objective. Longer 14
bouts of cooling, such as those employed within the current review, may be most appropriate for 15
targeting deep tissue and/or reducing local cellular metabolism. In contrast, local analgesia, which is 16
often the objective prior to returning sport, may be readily attained with shorter durations (<10 17
minutes).[1]
The patterns in the current review may therefore represent the largest potential changes 18
associated with cooling. We must also consider that during sport, very brief bouts of cooling (<1 min) 19
are sometimes used during a break in play, where the rationale is to provide a counter irritant for pain, 20
rather than to induce large/deep temperature reductions. Interestingly one study[34]
found that a 3 21
minute treatment did not affect vertical jump, agility or sprint performance. 22
We noted that the majority of studies in this review involved CWI or muscle cooling. Localised joint 23
cooling may have different effects on function; indeed, evidence exists that isolated joint cooling [44,45]
24
has an excitatory effect on the surrounding musculature. This could have positive implications and 25
future studies must consider the effect of isolated joint cooling on functional performance. Clinicians 26
should also consider that outcome is affected by individual factors such as adiposity, with higher 27
levels acting to limit the magnitude and depth of cooling. 28
It be important that intra-muscular temperatures have been shown to decline for up to 10 minutes after 29
ice pack removal.[48]
In the current review, many studies found that performance remained below 30
baseline for at least fifteen minutes following treatment. In sport, athletes are often encouraged to 31
undertake a warm up period between finishing cooling and returning to play. Previous studies have 32
shown that light or moderate physical activity can significantly speed up intra-muscular re-33
warming.[48,49]
We also found evidence from two studies[31,37]
that there were no performance 34
detriments when participants undertook a 6.5-15 minute warm up (dynamic joint movements and 35
jogging) between finishing cooling and returning to activity. Future study should ascertain whether 36

15
this practice should be universally encouraged prior to returning to sport. Although it seems likely that 1
the physiological effects of cooling can be reduced through use of a progressive warm up, again we 2
must consider that these studies applied cooling for 20[31]
to 45 minutes.[37]
The significance of a post 3
icing warm-up may depend on the magnitude and depth of tissue cooling and may be less important 4
after short cooling durations. 5
6
5.6 Comparison to other reviews 7
Few reviews have systematically examined the effect of cooling on other physiological systems 8
relevant to sporting activity. Costello and Donnelly[2]
found equivocal evidence on the effect that joint 9
cooling has on proprioception (joint positional sense), and in conjunction with the current review, the 10
majority of included studies were of limited methodological quality. They did find some significant 11
effects; absolute errors were found to increase (worsen) by 1-2 degrees immediately after cooling the 12
ankle and shoulder joints. Again the effect of these changes on performance and injury risk is 13
difficult to determine. 14
Although the current review focused on a healthy population, other reviews[1,50]
have noted a dearth of 15
high quality randomised studies into the therapeutic effect of cooling after soft tissue injury. Quod et 16
al.[51]
and more recently Ranalli et al.[46]
have also reviewed the effects of pre-cooling before exercise 17
on subsequent endurance performance in the heat and aerobic and anaerobic performance 18
respectively. Both reviews concluded that pre exercise cooling seems to have a positive effect on 19
aerobic performance, although the impact on anaerobic performance varied and did not provide the 20
same positive effect. 21
22
5.7 Limitations and future study 23
We undertook an exhaustive search based on a comprehensive list of electronic databases and 24
extensive supplementary searching. We acknowledge that other relevant studies may have been 25
overlooked in the grey literature. None of the included studies had a registered protocol, and bias from 26
selective reporting of results, was therefore difficult to ascertain. There were a limited number of 27
outcomes where summary values were extracted from graphs. Although this was undertaken by two 28
independent reviewers, with inconsistencies checked through reviewer consensus and a third party, it 29
is still serves as an estimation of treatment effect. We were also unable to perform any paired analysis 30
in the randomised cross over studies; instead data were analysed as if these studies used a parallel 31
group design. This approach may give rise to bias through unit of analysis error; however this is likely 32
to be conservative, as the cross over studies tend to be under rather than over-weighted.[54]
33
Future studies must incorporate larger sample sizes, and employ methods to limit selection, 34
performance and attrition bias. Employing short duration cooling may be more practically relevant, 35
particularly if they are applied in the middle of simulated play; this would better ascertain the 36

16
influence of cooling when the physiological systems (eg. blood flow, neural activity, and metabolism) 1
are functioning under competitive conditions. This review is limited to healthy subjects whereas in 2
real sporting situations, ice is usually applied to athletes in pain. Replicating painful circumstances in 3
the laboratory may be more practically relevant and creates a challenge for future studies. Finally, we 4
have focused on important outcomes relevant to sporting performance; however we acknowledge that 5
other key correlates of performance exist. There is evidence that temperature can influence sensori-6
motor patterns[52] and soft tissues’ visco-elastic properties[53] which should be systematically 7
examined in future reviews. 8
9
6. Conclusion 10
The current evidence base suggests that athletes’ performance will probably be adversely affected 11
should they return to activity immediately after cooling. We must consider that these findings are 12
largely based on cooling durations of at least 20 minutes which may exceed the dosages used on the 13
sidelines or at half time during sport. There is preliminary evidence that cold induced detrimental 14
effects on performance can be reduced or prevented by using a shorter cold application and/or 15
undertaking a progressive warm up prior to returning to play. Future studies in this area must 16
incorporate larger sample sizes, and limit risk of bias. The cooling dosages employed should be made 17
more applicable to the sporting environment with potentially more focus on short duration 18
applications. Until better evidence is available, practitioners should use short cooling applications 19
and/or undertaking a progressive warm prior to returning to play. 20
21 22 23 24
7. References 25
1. Bleakley CM, Glasgow PD, Philips P, et al. for the Association of Chartered Physiotherapists 26
in Sports and Exercise Medicine (ACPSM). Guidelines for the management of acute soft 27
tissue injury using Protection, Rest, Ice, Compression and Elevation. London, UK: ACPSM, 28
2011. Available from URL:http://www.acpsm.org. 29
2. Costello JT, Donnelly AE. Cryotherapy and joint position sense in healthy participants: a 30
systematic review. J Athl Train 2010;45(3):306-16. 31
3. Higgins JPT, Altman DG (editors). Chapter 8: Assessing risk of bias in included studies. 32
Section 8.5. In: Higgins JPT, Green S (editors), Cochrane Handbook for Systematic Reviews 33
of Interventions. Version 5.0.2 [updated September 2009]. Available from 34
URL:http://www.cochrane-handbook.org 35

17
4. Edwards RHT, Harris RC, Hultman E et al. Effect of temperature on muscle energy 1
metabolism and endurance during isometric contractions, sustained to fatigue in the 2
quadriceps muscles in man. J Physiol 1972;220:335-52 3
5. Johnson DJ, Leider FE. Influence of cold bath on maximum handgrip strength. Percept Mot 4
Skills 1977;44(1):323-6. 5
6. Coppin EG, Livingstone SD, Kuehn LA. Effects on handgrip strength due to arm immersion 6
in a 10 degree C water bath. Aviat Space Environ Med. 1978;49(11):1322-6. 7
7. Bergh U, Ekblom B. Influence of muscle temperature on maximal muscle strength and power 8
output in human skeletal muscles. Acta Physiol Scand 1979;107(1):33-7. 9
8. Oliver R, Johnson D, Wheelhouse W, et al. Isometric muscle contraction response during 10
recovery from reduced intramuscular temperature. Arch Phys Med Rehabil, 1979;60(3):126-11
9. 12
9. Petrofsky JS, Lind AR. The influence of temperature on the amplitude and frequency 13
components of the EMG during brief and sustained isometric contractions. Eur J Appl Physiol 14
1980;44(2):189-200. 15
10. Barter TJ, Freer PC. Effect of temperature on handgrip holding time. Br J Sports Med. 16
1984;18(2):91-5. 17
11. Ranatunga KW, Sharpe B, Turnbull B. Contractions of human skeletal muscle at different 18
temperatures. J Physiol (Lon) 1987; 390:383-395 19
12. Sargeant AJ. Effect of muscle temperature on leg extension force and short-term power 20
output in humans. Eur J Appl Physiol 1987;56:693–98. 21
13. Vincent MJ, Tipton MJ. The effects of cold immersion and hand protection on grip strength. 22
Aviat Space Environ Med 1988;59(8):738-41. 23
14. Mattacola CG, Perrin DH. Effects of cold water application on isokinetic strength of the 24
plantar flexors. Isokinetics and Exercise Science 1993;3:152-9. 25
15. Howard Jr RL, Kraemer WJ, Stanley DC, et al. The effects of cold immersion on muscle 26
strength. J Strength Cond Res 1994;8(3):129-33 27
16. Evans TA, Ingersoll C, Knight KL, et al. Agility following the application of cold therapy. J 28
Athl Train. 1995;30(3):231-4. 29
17. Lakie M, Villagra F, Bowman I, et al. Shooting performance is related to forearm temperature 30
and hand tremor size. J Sports Sci 1995;13(4):313-20. 31
18. Catlaw K, Arnold BL, Perrin DH. Effect of cold treatments on concentric and eccentric force 32
velocity relationship of the quadriceps. Isokinetics and Exercise Science 1996;5:157-160. 33
19. Cross KM, Wilson RW, Perrin DH. Functional performance following an ice immersion to 34
the lower extremity. J Athl Train 1996;31(2):113-6. 35

18
20. Kimura IF, Thompson GT, Gullick DT. The effect of cryotherapy on eccentric plantar flexion 1
peak torque and endurance. J Athl Train 1997;32(2):124-6. 2
21. Zhou S, Carey MF, Snow RJ, et al. Effects of muscle fatigue and temperature on 3
electromechanical delay. Electromyogr Clin Neurophysiol 1998;38(2):67-73. 4
22. Sanya A, Bello A. Effects of cold application on isometric strength and endurance of 5
quadriceps femoris muscle. Afr J Med Med Sci 1999;28(3-4):195-98. Afr J Med Med Sci 6
23. Hatzel BM, Kaminski TW. The effects of ice immersion on concentric and eccentric muscle 7
performance in the ankle. Isokinet Exerc Sci 2000;8:103-7. 8
24. Hopkins JT, Stencil R. Ankle cryotherapy facilitates soleus function. J Orthop Sports Phys 9
Ther 2002;32(12):622-7. 10
25. Cheung SS, Montie DL, White MD, et al. Changes in manual dexterity following short-term 11
hand and forearm immersion in 10 degrees C water. Aviat Space Environ Med 12
2003;74(9):990-3. 13
26. Douris P, McKenna R, Madigan K, et al. Recovery of maximal isometric grip strength 14
following cold immersion. J Strength Cond Res 2003;17(3):509-13. 15
27. Thornley LJ, Maxwell NS, Cheung SS. Local tissue temperature effects on peak torque and 16
muscular endurance during isometric knee extension. Eur J Appl Physiol 2003;90(5-6):588-17
94. 18
28. Borgmeyer JA, Scott BA, Mayhew JL. The effects of ice massage on maximum isokinetic-19
torque production. J Sports Rehabilitation 2004;13:1-8. 20
29. Hamzat TK, Fatudimu MB. Acute effects of cold and muscle vibration on maximal grip 21
strength and muscle endurance in normal subjects. Afr J Med Med Sci 2005 Sep;34(3):235-8. 22
30. Kubo K, Kanehisa H, Fukunaga T. Effects of cold and hot water immersion on the 23
mechanical properties of human muscle and tendon in vivo. Clin Biomech 2005;20(3):291-24
300. 25
31. Richendollar ML, Darby LA, Brown TM. Ice bag application, active warm-up, and 3 26
measures of maximal functional performance. J Athl Train 2006;41(4):364-70. 27
32. Wassinger CA, Myers JB, Gatti JM, et al. Proprioception and throwing accuracy in the 28
dominant shoulder after cryotherapy. J Athl Train 2007;42(1):84-9. 29
33. Patterson SM, Udermann BE, Doberstein ST, et al. The effects of cold whirlpool on power, 30
speed, agility, and range of motion. J Sports Sci Med 2008;7:387-94. 31
34. Fischer J, Van Lunen BL, Branch JD, et al. Functional performance following an ice bag 32
application to the hamstrings. J Strength Cond Res 2009;23(1):44-50. 33
35. Chen WL, Shih YC, Chi CF. Hand and finger dexterity as a function of skin temperature, 34
EMG, and ambient condition. Hum Factors 2010;52(3):426-40. 35

19
36. Dewhurst S, Macaluso A, Gizzi L, et al. Effects of altered muscle temperature on 1
neuromuscular properties in young and older women. Eur J Appl Physiol 2010;108(3):451-8. 2
37. Dixon PG, Kraemer WJ, Volek JS, et al. The Impact of Cold-Water Immersion on Power 3
Production in the Vertical Jump and the Benefits of a Dynamic Exercise Warm-Up. J Strength 4
Cond Res 2010;24(12):3313-7. 5
38. Pereira LG, Pereira R, Pinto Neto O, et al. The short and long term effects of tibialis anterior 6
local cooling on dorsiflexion force. Journal of Human Kinetics 2010;26:65-71 7
39. Algafly AA, George KP. The effect of cryotherapy on nerve conduction velocity, pain 8
threshold and pain tolerance. Br J Sports Med 2007;41(6):365-9. 9
40. Knight KL. Cryotherapy in sports injury management. 1st ed. Champaign, IL: Human 10
Kinetics,1995. 11
41. Oksa J, Rintamaki H, Rissanen S, et al. Stretch and H-reflexes of the lower leg during whole 12
body cooling and local warming. Aviat Space Environ Med 2000;71(2):156-61. 13
42. Rutkove SB. Effects of temperature on neuromuscular electrophysiology. Muscle Nerve 14
2001; 24:867-882. 15
43. Ferretti G. Cold and muscle performance. Int J Sports Med 1992;13(Suppl 1):S185-7. 16
44. Krause AB, Hopkins JT, Ingersoll CD, et al. The relationships of ankle temperature during 17
cooling and rewarming to the human soleus H Reflex. J Sports Rehabilitation 2000;9(3):253-18
292. 19
45. Pietrosimone BG, Ingersoll CD. Focal knee joint cooling increase the quadriceps central 20
activation ratio. J Sports Sci 2009;27(8):873-9. 21
46. Clarke DH, Wojciechowicz. The effect of low environmental temperature on local muscular 22
fatigue parameters. Am Corr Ther J 1978; 32:35-40. 23
47. Ranalli GF, Demartini JK, Casa DJ, et al. Effect of body cooling on subsequent aerobic and 24
anaerobic exercise performance: a systematic review. J Strength Cond Res 2010 25
Dec;24(12):3488-96. 26
48. Myrer JW, Measom GJ, Fellingham GW. Exercise after cryotherapy greatly enhances 27
intramuscular re-warming. J Athl Train 2000;35(4):412-416. 28
49. Bender AL, Kramer EE, Brucker JB, et al. Local ice-bag application and triceps surae muscle 29
temperature during treadmill walking. J Athl Train 2005; 40(4): 271-275. 30
50. Bleakley C, McDonough S, MacAuley D. The use of ice in the treatment of acute soft-tissue 31
injury: a systematic review of randomised controlled trials. Am J Sports Med 2004 Jan-32
Feb;32(1):251-61. 33
51. Quod MJ, Martin DT, Laursen PB. Cooling athletes before competition in the heat: 34
comparison of techniques and practical considerations. Sports Med 2006;36(8):671-82. 35

20
52. Friemert B, Franke S, Gollhofer A, et al. Group I afferent pathway contributes to functional 1
knee stability. J Neurophysiol 2010;103(2):616-22. 2
53. Uchio Y, Ochi M, Fujihara A, et al. Cryotherapy influences joint laxity and position sense of 3
the healthy knee joint. Arch Phys Med Rehabil 2003;84(1):131-5 4
54. Higgins JPT, Deeks JJ, Altman DG (editors). Chapter 16: Special topics in statistics. In: 5
Higgins JPT, Green S (editors), Cochrane Handbook for Systematic Reviews of Interventions 6
Version 5.0.1 (updated September 2008). The Cochrane Collaboration, 2008. Available from 7
URL:http://www.cochrane-handbook.org 8
9 10
Palmieri RM, Garrison JC, Leonard JL, Edwards JE, Weltman A, Ingersoll CD. Peripheral ankle 11
cooling and core body temperature. J Athl Train. 2006 Apr-Jun;41(2):185-8. [to insert as reference 12
48] 13
14
15
16
17

21
8. Table I
Study Characteristics
AUTHOR REF
[STUDY TYPE]
PARTICIPANTS INTERVENTION
TISSUE TEMPERATURE
IMMEDIATELY POST ICE
OUTCOMES RECORDED
[FOLLOW UP]
SUMMARY OF SIGNIFICANT
EFFECTS OF COOLING AT
IMMEDIATE FOLLOW UP
DURATION OF EFFECTS
Edwards [4] [Observational]
N=10 healthy Mean age: 25.3 (± 3.5 yrs)
-CWI, at a range of temperatures (10-44°C) 45 minutes (leg up to
ischial tuberosity)
Lowest I/M temperature 22.5°C ISOMETRIC KNEE EXT STRAIN GAUGE
1. Endurance (time to fatigue,
secs)
[immediately post Rx]
No significant findings N/A
Johnson [5]
[Cross over]
N=12 healthy
-CWI , 30 mins (forearm
immersion) -Rest, 30 mins
Not assessed HAND GRIP
DYNAMOMETER 1.Grip strength
[Immediately, every 20 minutes
for 4 hours post Rx]
1 DECREASEDab
1 INCREASEDab
between 80-
240 minutes post Rx
Coppin [6]
[RCO]
N = 13 healthy
Aged: 22-52 yrs
9 male 4 female
-CWI at 10°C, 30 mins (left
forearm immersion)
- CWI at 10°C, 30 mins (right forearm immersion)
-Rest 30 mins
Skin temperature measured but
changes not reported.
HAND GRIP
DYNAMOMETER
1. Grip strength (kg) [Immediately, every 20 minutes
for 4 hours post Rx]
1 DECREASEDa Hand grip strength returned to
baseline after 40 mins
Bergh [7]
[RCO]
N=5 healthy males -CWI until various I/M
temperatures induced (30-39°C)
Lowest I/M temperature 30.4°C ISOKINETIC DYN KNEE EXT
CONC (0,90, 180°/sec)
1. Peak torque (Nm)
2. Power (W)
3. Vertical jump (height, cm) 4. Sprint performance: cycle
(power, W)
[immediately post Rx]
Cooling decreased performance
based on correlations between
muscle temperature and 1-4.
N/A
Oliver [8]
[RCO]
N=20 healthy
8 male mean age: 29.2 yrs
12 female mean age: 25.1 yrs
- CWI at 10-12°C, 30 min
(lower leg immersion)
-Rest 30 min
25.5°C (at I/M depth=radius of
muscle cross-sectional area)
ANKLE Isometric P/F
CABLE TENSIOMETER
1. Peak force: (kg) [immediately post Rx, 30, 60,
90, 120, 180 mins post Rx]
No significant findings
1 INCREASED
ab between 60-
180 minutes post Rx
Petrofsky [9]
[Cross over]
N=10 healthy
5 male, mean age: 24.3 (± 1.9 yrs)
5 female, mean age: 22.1 (± 2.7 yrs)
-CWI, 10°C
-CWI, 20°C -CWI, 30°C
-CWI, 40°C All: 30 minute, hand and
forearm immersion
Lowest I/M temperature ~23°C HAND GRIP
DYNAMOMETER 1. Strength (kg)
2. Endurance (grip hold, secs at 15%, 40% and 70% of MVC)
[immediately post Rx]
1 and 2 DECREASEDb
(vs
20°C)
N/A
Barter [10]
[Cross over]
N=12 healthy males
Aged: 19-25 yrs
- CWI at 18°C, 30 min
-HWI at 45°, 30 min -Neutral immersion at 37°, 30
min
Not assessed HAND GRIP
DYNAMOMETER 1. Time to fatigue (at 70% MVC
secs)
No significant differences (CWI
vs controls)
Note: HWI significantly
N/A

22
ALL (hand and forearm
immersion)
[immediately post Rx] DECREASED 1 vs neutral
Ranatunga [11] [Cross over]
N=4 healthy -CWI at 25-45°C (hand immersion)
Skin temperature <20°C INDEX FINGER ABD TENSION TRANSDUCER
1. Peak tension (% baseline)
[immediately post Rx]
1 DECREASEDa
N/A
Sargeant [12]
[Cross over]
N=4 Active, but untrained
1 female, 24 years
3 male, 27.67 (± 5.51)
-CWI at 12°C, (to the level of
the gluteal fold), 45 mins
-CWI at 18°C, (to the level of the gluteal fold), 45 mins
-CWI at 44°C, (to the level of
the gluteal fold), 45 mins
-No immersion- room
temperature
Muscle temperature reduced by
7.7°C in 12°C water compared
to no immersion condition
ISOKINETIC CYCLE
ERGOMETER (20s maximum
sprint at a constant rate of 95 crank rev/min)
1. Peak force (N)
2. Peak power (W)
3. Maximal mean power (W)
(Immediately after Rx)
1, 2 and 3 DECREASEDb
(vs no immersion)
N/A
Vincent [13]
[Cross over]
N=12 healthy
Aged: 20-42 yrs
-CWI at 5°C, 2 mins x 5 (Hand
immersion) - CWI at 5°C, 2 mins x 5
(forearm immersion only)
Skin temperature reduced by
~22-23°C
HAND GRIP
DYNAMOMETER 1. Grip strength (N)
[immediately post Rx]
1 DECREASED (both groups)a N/A
Mattacola [14]
[RCO]
N=16 healthy
5 male, 11 female
Mean age: 22.1 years
-CWI at 15°C, 20 mins (lower
leg immersion)
-Rest 20 mins
Not assessed ANKLE P/F (ROM 0-50°)
ISOKINETIC
DYNAMOMETER 1. Peak torque (Nm)
2. Average power (Nm)
3. Total work (Nm) [immediately post Rx]
1, 2 and 3 DECREASEDb
N/A
Howard [15]
[RCO]
N=10 physically active males
Mean age: 22.9 (± 2.2 yrs)
-CWI at 12°C, 45 mins (lower
limb immersion to gluteal fold) -Immersion at 35.5°C, 45 mins
(lower limb immersion to gluteal
fold) -Non-immersion, 45 mins (room
temperature 22-23°C)
Not assessed KNEE EXT
ISOKINETIC DYNAMOMETER
1. Peak torque,
2. Time to peak torque, 3. Angle of peak torque
4. Average power,
5. Total work (Velocities of 0, 30, 180, 300
400°.sec-1 randomly chosen)
6. Peak torque Isometric (45° angle)
[immediately post Rx]
1,4, 5 and 6 DECREASED (at
180, 300 400°.sec-1)b
(vs
neutral immersion and non immersion)
N/A
Evans [16]
[RCO]
N=24 healthy
Mean age: 22.4 (± 2.1yrs)
-CWI at 1°C, 20 min (lower
limb immersion up to 8cm above malleolus)
-Rest 20 min
Not assessed LOWER LIMB
TIME TO COMPLETE TEST (secs)
1. Shuttle run
2. Co-Contraction agility 3. Carioca run agility
[immediately post Rx]
No significant findings N/A

23
Lakie [17]
[Cross over]
N=6 healthy
5 male, 1 female Mean age: 24.8 yrs
-CWI at 10°C, 30 mins (forearm
only) -HWI at 44°C, 30 mins
(forearm only)
-Control, no immersion
Skin temperature 22.5°C SHOOOTING
PERFORMANCE ACCELEROMETER
1.Tremor (frequency, size and
power) 2. Final score (/200)
[immediately post Rx]
1 DECREASEDb
(vs control
and HWI)
N/A
Catlaw [18]
[Cross over]
N=16 healthy
8 male, 8 female Mean age: 20.4 (± 1.2 yrs)
-Cryocuff, 20 mins (thigh)
-No ice
Not assessed KNEE EXT
ISOKINETIC DYNAMOMETER
1. ECC Peak Torque
2. CONC Peak Torque
(Velocities of 25-200°.sec-)
[Immediately post Rx]
1 DECREASED (at 175 and
200°.sec-)b
N/A
Cross [19] (RCT)
N= 20 healthy Mean age: 19.3 (± 1.2 yrs)
- CWI at 13°C, 20 mins (lower limb immersion up to fibular
head, with water turbulence)
- Rest, 20 min
Not assessed LOWER LIMB 1. Hop test (time to complete,
sec)
2. Vertical jump height (cm) 3. Shuttle run (time to complete,
sec)
[immediately post Rx]
2 DECREASEDa AND 3
INCREASEDa
N/A
Kimura [20] [RCO]
N=22 healthy 11 male, 11 female
Mean age: 23.8 (± 3.5 yrs)
-CWI at 10°C, 30 min (lower limb immersion to mid thigh)
- Rest 30 min
Not assessed ANKLE P/F ECC ISOKINETIC
DYNAMOMETER
1. Peak Torque (Nm) 2. Total work (Nm)
[immediately post Rx]
2 INCREASEDb
N/A
Zhou [21] [Observational]
N=3 healthy males Mean age: 31yrs
-Ice bag applied until thigh IM temperature reached 30°C
30° (at 30 mm IM depth) KNEE EXT ISOMETRIC 1. Peak force (N)
[immediate post Rx]
1. DECREASEDa
N/A
Sanya [22] [Observational]
N=60 healthy 30 male, 23.43 (± 1.89 yrs)
30 female, 22.63 (± 1.71 yrs)
- Ice towel application at 3-6°C, 5 mins (included liquid
paraffin, applied to the anterior
aspect of the thigh)
Not assessed ADAPTER CABLE TENSIOMETER
1. Isometric quadriceps strength
(kg/f) 2. Endurance index (sec)
[immediately, 10 mins post Rx]
1 INCREASED 2 INCREASED (male only)
1 remained increased at 10 mins post Rx
Hatzel [23]
[Observational]
N=20 healthy
Mean age: 19.6 (± 1.3 yrs)
-CWI at 10°C, 20 min (lower
limb immersion to tibial plateau)
Not assessed ANKLE ECC and CONC
ISOKINETIC DYNAMOMETER
1. Peak Torque: (Nm)
a: PF ; b. INV; c. EV; d. DF [immediately post Rx]
1d Conc DECREASEDa
N/A
Hopkins [24]
[RCT]
N=30 healthy
16 male, 14 female Mean age: 21 (± 3yrs)
- 1.5L of crushed ice, 30 minutes
(lateral ankle joint) - Rest, 30 min
Final skin temperature approx.
16°C
ANKLE P/F CONC
ISOKINETIC DYNAMOMETER
1. Peak torque: (Nm)
[immediately post Rx]
1 INCREASEDb
N/A

24
Cheung [25]
[Cross over]
N=16 healthy
11 male, 15 female Mean age: 24.8 (± 9.4yrs)
-CWI at 10°C, (immersion to
lateral epicondyle), 30 secs -CWI at 10°C, (immersion to
lateral epicondyle), 120 secs
-CWI at 10°C, (immersion to lateral epicondyle), 300 secs
-No immersion
Final skin temperature 15 (+/-
0.4°C)
HAND DEXTERITY TESTING
1. Buckle test (time to complete, secs)
2. Fine dexterity
[immediately post Rx]
1 INCREASEDb
(120 sec and
300 secs vs control)
2 DECREASEDb
(300 sec vs
control)
N/A
Douris [26]
[Cross Over]
N=16 healthy
Mean age: 32 (± 6.3 yrs),
-CWI at 10°C, 5 minutes (elbow,
forearm and hand immersion)
Not assessed HAND DYNAMOMETER
1. Grip strength: Isometric (lbs) (immediately, 15 min post Rx)
1 DECREASEDa 1 remained DECREASED
a at
15 minutes post Rx
Thornley [27]
[RCO]
N=9 healthy males
Mean age: 22 (± 3 yrs)
-Hot pack 55°C
-Warm pack 34°C
-Neutral pack 22°C
-Cold pack -17°C All: 30 mins, anterior thigh
Skin temperature: 12.4 (+/-2.8) KNEE EXT ISOMETRIC
1. Peak torque (Nm)
2. Time to fatigue (secs)
[immediately post Rx]
2 INCREASEDb
(vs hot and
warm pack)
N/A
Borgmeyer [28]
[RCO]
N=11 healthy males
Mean age: 20.9 (± 1.1 yrs)
-Ice massage, 10 min (biceps)
- Rest, 10 min
Not assessed ELBOW FLEX CONC
ISOKINETIC
DYNAMOMETER 1. Peak torque: (Nm)
(immediately post Rx)
No significant findings N/A
Hamzat [29] [Observational]
N=89 Healthy 49 male, 40 female
Aged 19-30yrs
- Ice towel application, 10 mins (included liquid paraffin,
applied to the forearm muscles,
temperature not stated)
Not assessed HAND DYNAMOMETER 1. Grip strength: Isometric (kgf)
2. Endurance index (secs)
[immediately, 5 and 10 min post Rx]
2 INCREASEDa 2. still increased from baseline at
5 and 10 mins
Kubo [30]
[RCO]
N=8 healthy males
Mean age: 26 (± 2yrs)
- CWI at 5°C, 30 min (lower
limb immersion up to head of fibula)
-HWI at 42°C, 30 min (lower
limb immersion up to head of fibula)
Not assessed ANKLE P/F ISOMETRIC
DYNAMOMETER 1. Peak force: (Nm)
[immediately post Rx]
1 DECREASEDa
N/A
Richendollar
[31]
[RCO]
N=24 healthy males
Mean age: 21.3 (± 3.3 yrs)
-Rest only, 20 minute
-Warm up only, 20 minute
-Ice 20 min followed by rest 20 min
-Ice 20 min followed by warm
up 20 mins (Ice= 1.4 kg of crushed ice in
plastic bag, secured with
compression wrap over anterior thigh)
Not assessed LOWER LIMB
1. Single leg vertical jump (cm)
2. Shuttle run agility (time to complete, sec)
3. 40 yard sprint (time to
complete, secs) [20 minutes post Rx]
N/A 1, 2 and 3 WORSEb
(20 minute
ice followed by 20 minutes rest
vs 20 minute rest only)
There were no significant
findings when 20 minutes ice
was followed by a 20 minute
warm up
Wassinger [32]
[Observational]
N=22 healthy
14 male, 8 female Mean age: 21.6 (± 2.4 yrs)
-Ice cubes, 20 mins (secured
with standardised elastic bandage to centre of bag over
the tip of Acromion)
Not assessed UPPER LIMB
1. Throwing accuracy (number of throws to hit a target and
number of throws in 30 secs)
[immediately post Rx]
1 DECREASEDa
N/A

25
Patterson [33]
[Observational]
N=21 healthy
7 male, 13 female Mean age 19.8 (± 1.2 yrs)
-CWI at 10°C, 20 mins (lower
leg immersion with water turbulence )
Not assessed LOWER LIMB
1. Counter movement jump [Peak power and Average power
(Watts)]
2. T-test agility (time to complete, secs)
3. 40 yard sprint (time to
complete, secs) [immediately and at 5 minute
intervals up to 30 minutes]
1 DECREASEDa,2 and 3
INCREASEDa
1 WORSE at 30 mins post Rxa
2 WORSE for up to 5 mins post
Rxa
3 WORSE for up to 20 mins
post Rxa
Fischer [34]
[Cross over]
N=42 healthy
25 female, Mean age 22 (±
0.5yrs)
17 male, Mean age 23 (± 0.5yrs)
- Cubed ice, 3 min (hamstring
muscle belly, secured with
plastic wrap)
-Cubed ice, 10 min (hamstring
muscle belly, secured with plastic wrap)
-Rest
Not assessed LOWER LIMB
1. Co-contraction (agility test,
sec)
2. Shuttle run (time to complete,
sec) 3. Single leg vertical jump (cm)
[immediately, 20 mins post Rx]
2 INCREASEDa and 3
DECREASEDa after 10 minutes
of ice
No significant findings reported after 3 minute ice
2 WORSE at 20 mins post Rxa
Chen [35]
[Observational]
N=24 healthy
12 male, 12 female
Mean age: ~25 yrs
-CWI in 11°C, 40 minutes
(immersion of hand and
forearm)
Skin temperature 12.5°C UPPER LIMB
1.Gross dexterity
2. Fine dexterity 3. Grip strength, gauge with load
cell (kg/w)
[1 and 2: after 2, 10, 18, 26, 34 and 40 minutes of CWI.
Outcome 3 recorded after 40
minutes of CWI only] [immediately post Rx]
1,2 and 3 all DECREASEDa N/A
Dewhurst [36]
[RCO]
N=27 healthy females
Young subgroup (n=15): mean age 21.5 (± 2.2 yrs)
Old subgroup (n=12): mean age:
73.6 (± 3.2 yrs)
-Cold, 30°C I/M temperature
-Control, 34°C I/M temperature -Warm, 38°C I/M temperature
All: quad, 1 cm below
subcutaneous fat; ice and hot packs used to regulate
temperature
I/M temperature: 30°C KNEE EXT
ISOKINETIC DYNAMOMETER
1. ISOMETRIC peak torque
2. CONC peak torque ((Velocities of 30, 60, 90 and
120°.sec-)
[immediately post Rx]
2 DECREASEDb
(vs control)
note: in young sub-group only
N/A
Dixon [37] [RCO]
N = 9 male athletes Mean age 22.1 (± 1.5yrs)
- CWI at 12°C, 45 mins followed by no warm up
- CWI 12°C, 45 mins followed
by warm up
- Standing control, 45 mins
followed no warm up
- Standing control, 45 mins followed by warm up
(bilateral immersion of lower
limbs up to the gluteal fold)
Not assessed LOWER LIMB 1.Counter movement jump
(Power output: Watts)
[immediate, 15 minutes post Rx]
1 DECREASEDb
(after both
CWI protocols compared to both ambient temperature protocols).
In group using CWI without active warm, 1 remained
WORSE at 15 mins post Rxab
(versus all groups)

26
Pereir [38]
[RCT]
N=18 healthy
11 male, 7 female Mena age: 22 (SE 1yr)
-Crushed ice pack, 30 mins
(antero-lateral surface of lower limb, secured with elastic wrap)
-Rest, 30 mins
Skin temperature 11.9 (SE
0.7°C)
ANKLE D/F ISOMETRIC
STRAIN GAUGE 1.Peak force (N)
[immediate, 5, 15, 30 and 60
minutes post Rx]
1 DECREASEDab
Immediate only
a: p<0.05 vs pre-treatment
b: p<0.05 vs control group
RCO = randomised cross over trial; RCT = randomised controlled trial; CWI = cold water immersion; HWI = hot water immersion; I/M = intra-muscular; ROM = range of
movement; ECC = eccentric; CONC = concentric; PF = plantar flexion; D/F = dorsiflextion; EXT = extension; INV = inversion; ABD = abduction; MVC = maximum
voluntary contraction; Rx = treatment; N/A = follow ups not measured beyond the immediate stages post Rx.

27
Figure I
Summary of search strategy and selection process based on included and excluded studies
(QUORUM).

28
Figure II
Risk of bias summary
Random sequence generation (selection bias)
Allocation concealment (selection bias)
Blinding (performance bias and detection bias)
Incomplete outcome data (attrition bias)
0% 25% 50% 75% 100%
Low risk of bias Unclear risk of bias High risk of bias
29
Figure III
Forest plot summarising the immediate effect (SMD 95% CI) of cooling on functional performance (within groups versus baseline)

30
Study or Subgroup
Cross 1996
Cross 1996
Cross 1996
Dixon 2010
Douris 2003
Evans 1995
Evans 1995
Evans 1995
Fischer 2009
Fischer 2009
Fischer 2009
Hamzat 2005
Hamzat 2005
Hatzel 2000
Kubo 2005
Patterson 2008
Patterson 2008
Patterson 2008
Pereira 2010
Sanya 1999
Sanya 1999
Thornley 2003
Wassinger 2007
Zhou 1998
Total (95% CI)
Heterogeneity: Tau² = 0.33; Chi² = 118.00, df = 23 (P < 0.00001); I² = 81%
Test for overall effect: Z = 2.78 (P = 0.005)
IV, Random, 95% CI
-0.32 [-1.20, 0.57]
-0.49 [-1.38, 0.41]
-0.64 [-1.54, 0.27]
-1.06 [-2.06, -0.05]
-11.11 [-14.10, -8.12]
-0.17 [-0.73, 0.40]
0.17 [-0.40, 0.73]
0.07 [-0.50, 0.64]
-0.15 [-0.58, 0.28]
-0.11 [-0.53, 0.32]
-0.35 [-0.79, 0.08]
0.37 [0.08, 0.67]
-0.04 [-0.33, 0.25]
-0.60 [-1.23, 0.04]
-0.60 [-1.61, 0.41]
-1.03 [-1.68, -0.38]
-0.60 [-1.22, 0.02]
-1.24 [-1.90, -0.57]
-0.41 [-1.34, 0.53]
0.52 [0.16, 0.89]
0.41 [-0.10, 0.92]
-0.37 [-1.31, 0.56]
-0.86 [-1.48, -0.24]
-1.27 [-3.28, 0.75]
-0.39 [-0.66, -0.11]
Std. Mean Difference Std. Mean Difference
IV, Random, 95% CI
-10 -5 0 5 10Ice DECREASED performance Ice INCREASED performance

31
Figure IV
Forest plot summarising the immediate effect (SMD 95% CI) of cooling on functional performance (Ice versus control)

32
Study or Subgroup
Barter 1984
Borgmeyer 2004
Catlaw 1996
Catlaw 1996
Cheung 2003
Cheung 2003
Cross 1996
Cross 1996
Cross 1996
Evans 1995
Evans 1995
Evans 1995
Fischer 2009
Fischer 2009
Fischer 2009
Hopkins 2002a
Kimura 1997
Kimura 1997
Lackie 1995
Matacola 1993
Matacola 1993
Pereira 2010
Petrofsky 1980
Petrofsky 1980
Richendollar 2006
Richendollar 2006
Richendollar 2006
Sargeant 1987
Sargeant 1987
Thornley 2003
Total (95% CI)
Heterogeneity: Tau² = 0.18; Chi² = 73.21, df = 29 (P < 0.0001); I² = 60%
Test for overall effect: Z = 1.91 (P = 0.06)
IV, Random, 95% CI
0.09 [-0.71, 0.89]
-0.17 [-1.01, 0.66]
-2.33 [-3.25, -1.40]
-0.17 [-1.01, 0.66]
1.00 [0.25, 1.74]
1.22 [0.46, 1.98]
0.34 [-0.54, 1.23]
-0.09 [-0.97, 0.78]
1.02 [0.07, 1.96]
0.07 [-0.50, 0.63]
0.16 [-0.41, 0.72]
0.14 [-0.43, 0.70]
0.35 [-0.08, 0.78]
0.27 [-0.16, 0.70]
0.19 [-0.24, 0.62]
-0.03 [-0.75, 0.68]
-0.41 [-1.01, 0.19]
-0.14 [-0.73, 0.45]
-0.89 [-2.10, 0.32]
0.53 [-0.08, 1.15]
0.49 [-0.12, 1.11]
0.10 [-0.88, 1.08]
1.54 [0.51, 2.56]
0.25 [-0.63, 1.13]
0.35 [-0.22, 0.92]
0.35 [-0.22, 0.92]
0.67 [0.09, 1.25]
1.06 [-0.51, 2.63]
1.17 [-0.43, 2.77]
-0.83 [-1.80, 0.14]
0.20 [-0.00, 0.41]
Std. Mean Difference Std. Mean Difference
IV, Random, 95% CI
-4 -2 0 2 4Favours Ice Favours Control