(c) 2003 DMPC LLC. All rights reserved yaddayaddayadda Assuring an ROI in your Disease Management...
56
(c) 2003 DMPC LLC. All ri ghts reserved yaddayadday adda www.DisMgmt.com Assuring an ROI in your Disease Management Program Al Lewis Disease Management Purchasing Consortium April 2003
-
Upload
myles-mills -
Category
Documents
-
view
212 -
download
0
Transcript of (c) 2003 DMPC LLC. All rights reserved yaddayaddayadda Assuring an ROI in your Disease Management...

(c) 2003 DMPC LLC. All rights reserved yaddayaddayadda www.DisMgmt.com
Assuring an ROI in your Disease Management Program
Al LewisDisease Management Purchasing
ConsortiumApril 2003

(c) 2003 DMPC LLC. All rights reserved yaddayaddayadda www.DisMgmt.com
Agenda
• Disease Management Purchasing Consortium
• The ROI Imperative• Measuring It
– 3 Biggest Mistakes Inflating ROI– What ROIs are by disease
• Why “Built” programs usually have most fallacies
• 5 Take-Aways

(c) 2003 DMPC LLC. All rights reserved yaddayaddayadda www.DisMgmt.com
Hey, Butch, Who ARE these guys?
• 74 payor members (including all large outsourcers and many small ones)
• 50-million lives of purchasing power
• Named “most influential organization in DM” by every trade publication, plus British Medical Journal
• Published 4 articles on ROI in DM
(c) 2003 DMPC LLC. All rights reserved yaddayaddayadda www.DisMgmt.com
Agenda
• Disease Management Purchasing Consortium
• The ROI Definition and Imperative• Measuring It
– 3 Biggest Mistakes Inflating ROI– What ROIs are by disease
• Why “Built” programs usually have most fallacies
• 5 Take-Aways

(c) 2003 DMPC LLC. All rights reserved yaddayaddayadda www.DisMgmt.com
ROI Definition
• Gross Savings (before fees)/Fees = ROI
• Questionable measure in and of itself– No real “investment” if savings accrue in same
year as investment and…– Savings are usually guaranteed anyway so
nothing was risked
• Complement or substitute: Net Savings Maximization
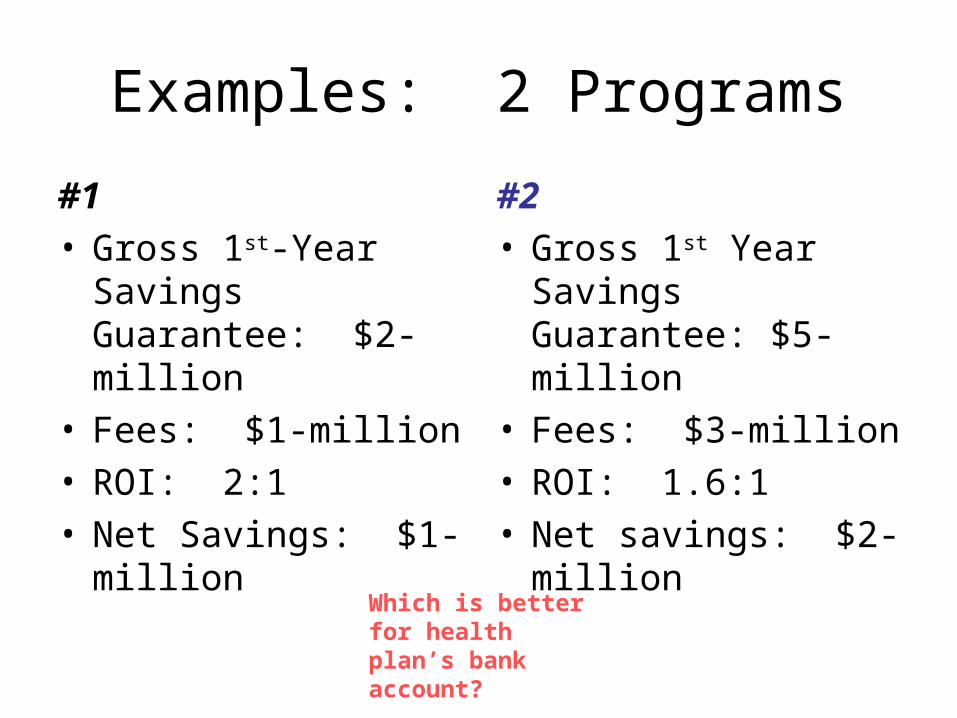
Examples: 2 Programs
#1• Gross 1st-Year
Savings Guarantee: $2-million
• Fees: $1-million• ROI: 2:1• Net Savings: $1-
million
#2• Gross 1st Year
Savings Guarantee: $5-million
• Fees: $3-million• ROI: 1.6:1• Net savings: $2-
million
Which is better for health plan’s bank account?

(c) 2003 DMPC LLC. All rights reserved yaddayaddayadda www.DisMgmt.com
But for the purposes of this presentation…
• The measurement issues apply to ROI and net savings maximization

(c) 2003 DMPC LLC. All rights reserved yaddayaddayadda www.DisMgmt.com
Pop Quiz
• Program has a 6% guarantee of net savings and fees amount to 4%. What is the ROI?

The ROI Imperative
• Widely Accepted that DM Programs improve health outcomes, satisfy members
• Still quite contentious whether they save money because ROIs are often invalid– Vendor claims not believed in general because some
aren’t valid– Almost every “built” program is measured wrong
(present company excepted, which is why I invited the present company)
Industry needs to build credibility via validity in ROI

(c) 2003 DMPC LLC. All rights reserved yaddayaddayadda www.DisMgmt.com
Today’s Goal
• How to Identify and Avoid the top 3 issues (there are more but they are more subtle) ways in which ROIs are inflated– This will allow you to create or contract for
credible numbers

(c) 2003 DMPC LLC. All rights reserved yaddayaddayadda www.DisMgmt.com
Agenda
• Disease Management Purchasing Consortium
• The ROI Definition and Imperative• Measuring It
– 3 Biggest Mistakes Inflating ROI– What ROIs are by disease
• Why “Built” programs usually have most fallacies
• 5 Take-Aways

(c) 2003 DMPC LLC. All rights reserved yaddayaddayadda www.DisMgmt.com
3 Biggest Mistakes Inflating ROI
• Measuring on Moderates and Severes only (creates regression to mean)
• Measuring only on people who enroll (sample selection bias)
• Measuring new members after sentinel event

(c) 2003 DMPC LLC. All rights reserved yaddayaddayadda www.DisMgmt.com
What is this regression to the mean?
• The Yankees are 20-4 as of this writing. They are not going to finish the season 135-27.
• The Tigers are 3-19. They are not going to finish the season 22-140.
• Same is true of people with chronic disease. If you take all people with chronic disease who had a really bad month like the Tigers—with maybe 2 hospitalizations--they will show ‘improvement’ simply because they aren’t going to have 2 hospitalizations every month.

(c) 2003 DMPC LLC. All rights reserved yaddayaddayadda www.DisMgmt.com
More regression to the mean:“Red Zone” Winning Percentages April 12 of
“severely ill” baseball teamsBaltimore .333
Cleveland .333
Detroit .000
Atlanta .364
Milwaukee .300
Arizona .200

Watch these “red zone” teams regress to the mean by April 26
Baltimore .333 .500 +.167
Cleveland .333 .292 -.041*
Detroit .000 .136 +.136
Atlanta .364 .600 +.236
Milwaukee .300 .360 +.060
Arizona .200 .375 +.175
4/10 4/26
*Not all red-zone patients regress to the mean…we’re talking about populations as a whole

(c) 2003 DMPC LLC. All rights reserved yaddayaddayadda www.DisMgmt.com
Likewise, “Green Zone” patients regress the wrong way to the meanTeam Winning %
April 10Winning % April 26
Change
Yankees .889 .833 -.056
Kansas city 1.000 .773 -.227
Oakland .700 .583 -.117
Houston .778 .458 -.320
San Francisco
.909 .750 -.159
(c) 2003 DMPC LLC. All rights reserved yaddayaddayadda www.DisMgmt.com
Lessons
• If you only measure people who are severe or moderate and severe, based on the objective claims data you have, your sample will show improvement no matter what you do
• If you leave the “green” pts out of your measurement, you will miss a lot of “events” in your “after” calculation

(c) 2003 DMPC LLC. All rights reserved yaddayaddayadda www.DisMgmt.com
What you do you to avoid it?
• MEASURE THE WHOLE POPULATION– The “Whole population” of baseball teams have
a .500 record every day– Whole populations cannot regress to the mean; they
are the mean• A watch-out: One health plan, which understood
the fallacy, measured the whole population of asthma patients at its accounts with the most asthma utilization and showed great improvements
• Watch-out #2: Same plan said those accounts had been high for 3 years

source; gregg meyer
Asthma studies suffering from regression to the mean (plus ACAAI study just published)
Program Study Type
1. Massachusetts Respiratory Hospital/Air Watch A 26 Historical Control
2. Valley Home Care P 30 Historical Control
3. Jacksonville University Medical Center A 25 Historical Control
4. University of Tennessee, Memphis A 39 Non-randomized Control
5. Access Health — BC/B, Massachusetts A 67 Historical Control
6. Lutheran Medical Center Brooklyn, New York P 50 —
7. United Health Care of Ohio A/P — Historical Control
8. Lovelace HMO, Albuquerque, N.M. P 86 Historical
Control
9. Kaiser Permanente, Santa Clare — — —
10. Harvard Community Health Plan (1995) P 53 Historical Control
11. Managed Care Services P 11 Historical Control
12. University of Pennsylvania, Philadelphia A — —
13. National Jewish Medical Center A/P 317 Historical Control
14. University of Laval, Quebec A 126 Non-randomized Control
15. Henry Ford Hospital A 241 Randomized Control
16. Harvard Community, Health Plan (1999) P 57 Randomized Control
17. Hartford Hospital, Connecticut A 23 Historical Control
18. Olsten Kimberly Quality Care A/P 257 —
19. Blue Cross/Blue Shield of South Carolina — 3,000 —
20. Harvard Pilgrim Health Care, Boston — — —
Emergency Room Visits Hospitalization
AnnualizedSavingsper Patient
R e d u c t i o n s i n : E c o n o m i c s :
$5,981 —
4,026 407
1,676 278
— —
— —
3,400 —
— —
— 45
— —
3,296 418
— —
1,500 —
2,260 606
— —
628 85
2,217 190
4,137 —
11,172 —
— —
$1.07 million —total savings
Patient #in Study
Adult/Ped
AnnualizedCostper Patient

(c) 2003 DMPC LLC. All rights reserved yaddayaddayadda www.DisMgmt.com
3 Biggest Mistakes Inflating ROI
• Measuring on Moderates and Severes only (creates regression to mean)
• Measuring only on people who enroll (sample selection bias)
• Measuring new members after sentinel event

(c) 2003 DMPC LLC. All rights reserved yaddayaddayadda www.DisMgmt.com
Example: Participation Bias
0
20
40
60
80
100
120
Bas
elin
e
Bas
elin
e
Per
iod
1
Per
iod
2Cla
ims
His
tory
(B
asel
ine=
100)
"In"
The vendor says:• “The study group’s claims
went down 20% over two periods vs. a control group

(c) 2003 DMPC LLC. All rights reserved yaddayaddayadda www.DisMgmt.com
Participation Bias
0
20
40
60
80
100
120
Bas
elin
e
Bas
elin
e
Per
iod
1
Per
iod
2Cla
ims
His
tory
(B
asel
ine=
100)
"In"
The vendor says:• “The study group’s claims
went down 20% over two periods vs. a control group
(c) 2003 DMPC LLC. All rights reserved yaddayaddayadda www.DisMgmt.com
Participation Bias
0
20
40
60
80
100
120
Bas
elin
e
Bas
elin
e
Per
iod
1
Per
iod
2Cla
ims
His
tory
(B
asel
ine=
100)
"In"
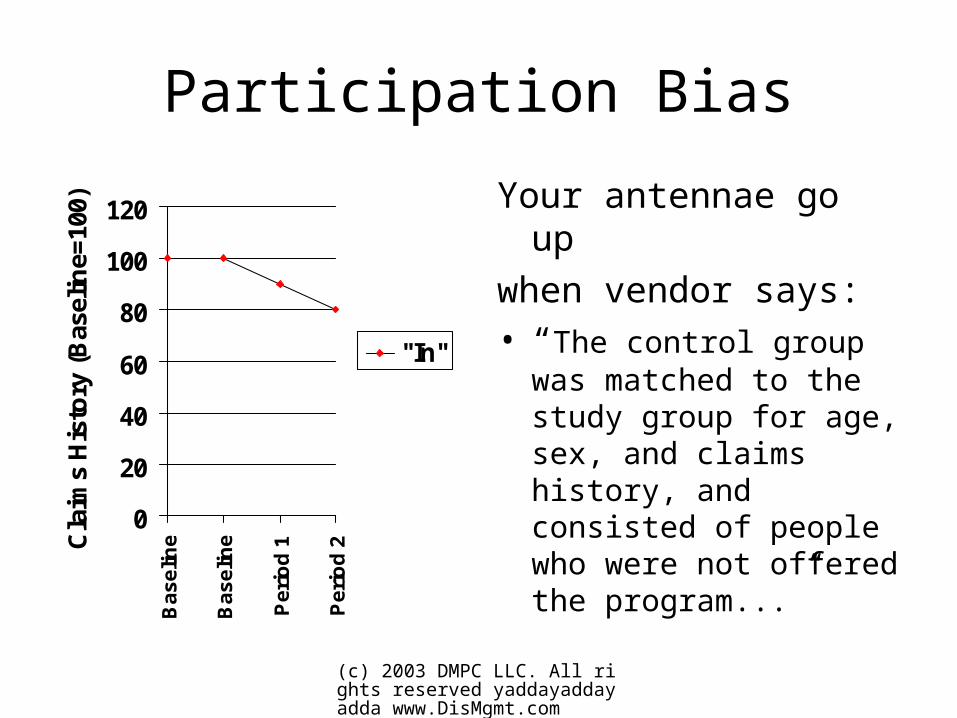
Your antennae go up
when vendor says:• “The control group was
matched to the study group for age, sex, and claims history, and consisted of people who were not offered the program...”

(c) 2003 DMPC LLC. All rights reserved yaddayaddayadda www.DisMgmt.com
Participation Bias
0
20
40
60
80
100
120
140
Bas
elin
e
Bas
elin
e
Per
iod
1
Per
iod
2Cla
ims
His
tory
(B
asel
ine=
100)
"In"
"Out"
Your antennae go up
when vendor says:• “…and the control
group’s claims rose 20% over the same period.”
The study group consists ofMotivated people only! The popu-ation has everybody

(c) 2003 DMPC LLC. All rights reserved yaddayaddayadda www.DisMgmt.com
How to avoid participation bias in measuring ROI
• (You guessed it) measure on the whole population of people with the disease
But you will soon see that’s not as easy as it sounds…

(c) 2003 DMPC LLC. All rights reserved yaddayaddayadda www.DisMgmt.com
…Because of sentinel event measurement
• Measuring on Moderates and Severes only (creates regression to mean)
• Measuring only on people who enroll (sample selection bias)
• Measuring new members after sentinel event
(c) 2003 DMPC LLC. All rights reserved yaddayaddayadda www.DisMgmt.com
Sentinel Events: The key to whole-population measurement
• The “sentinel event” is the event which tells the health plan that someone has a disease
• It is often the most expensive claim from that member during the first 12 months with the disease

(c) 2003 DMPC LLC. All rights reserved yaddayaddayadda www.DisMgmt.com
Let’s do Sentinel Events with more baseball
• Analogy that the first loss a team has is like the first claim for a disease. You are searching your database for people with a disease, called “lossitis”
(c) 2003 DMPC LLC. All rights reserved yaddayaddayadda www.DisMgmt.com
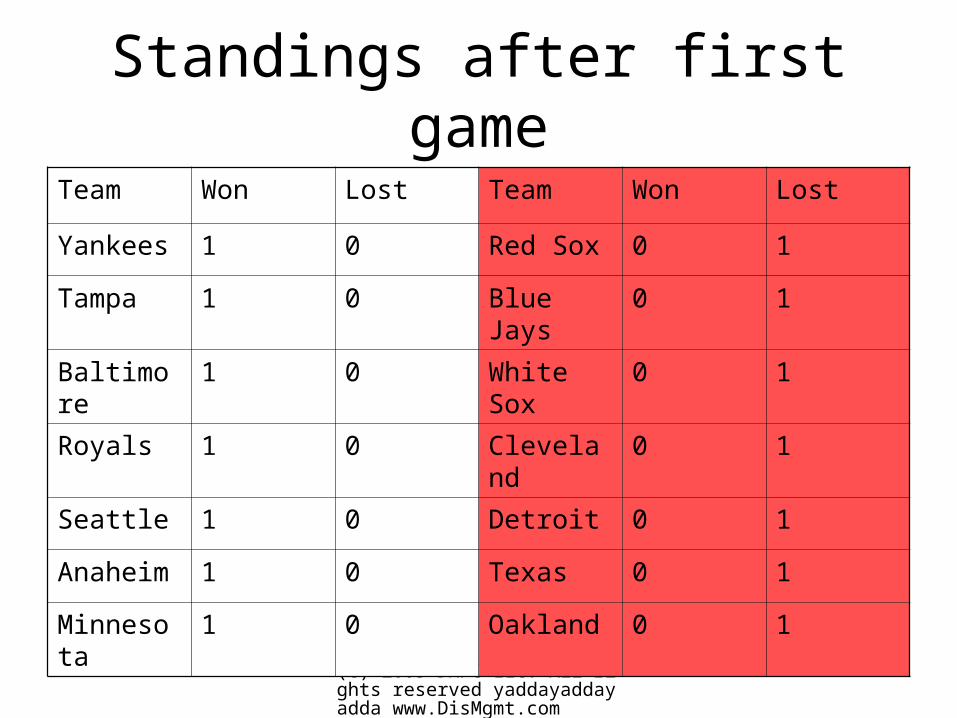
Standings after first game
Team Won Lost Team Won Lost
Yankees 1 0 Red Sox 0 1
Tampa 1 0 Blue Jays 0 1
Baltimore 1 0 White Sox 0 1
Royals 1 0 Cleveland 0 1
Seattle 1 0 Detroit 0 1
Anaheim 1 0 Texas 0 1
Minnesota 1 0 Oakland 0 1

(c) 2003 DMPC LLC. All rights reserved yaddayaddayadda www.DisMgmt.com
Let’s do Sentinel Events with more baseball
• Analogy that the first loss a team has is like the first claim for a disease. You are searching your database for people with a disease called “lossitis” where each loss costs $1000
• After the first game you have identified 7 teams with “claims” (i.e., losses) and they cost you $7000– So you track those teams for the next claims cycle to
reduce lossitis and save money

(c) 2003 DMPC LLC. All rights reserved yaddayaddayadda www.DisMgmt.com
Standings after second game
Team Won Lost Team Won Lost
Yankees 2 0 Red Sox 1 1
Tampa 1 1 Blue Jays 1 1
Baltimore 1 1 White Sox 0 2
Royals 2 0 Cleveland 0 2
Seattle 1 1 Detroit 0 2
Anaheim 1 1 Texas 1 1
Minnesota 2 0 Oakland 1 1

(c) 2003 DMPC LLC. All rights reserved yaddayaddayadda www.DisMgmt.com
Let’s do Sentinel Events with more baseball
• Analogy that the first loss a team has is like the first claim for a disease. You are searching your database for people with a disease called lossitis.
• After the first game you have identified 7 teams with “claims” (i.e., losses)– So you track those teams for the next claims cycle
• Now you find that those teams only had 3 “claims” in this cycle so among identified people with lossitis, claims fell by $4000

(c) 2003 DMPC LLC. All rights reserved yaddayaddayadda www.DisMgmt.com
Just counting previously identified members with lossitis
0
1
2
3
4
5
6
7
Baseline NextCycle
Identified Members
If you don’ count sentinel eventsThis is the “savings” from reducing lossitis

(c) 2003 DMPC LLC. All rights reserved yaddayaddayadda www.DisMgmt.com
Standings after second game—including new “sentinel events”—
patients with lossitisTeam Won Lost Team Won Lost
Yankees 2 0 Red Sox 1 1
Tampa 1 1 Blue Jays 1 1
Baltimore 1 1 White Sox 0 2
Royals 2 0 Cleveland 0 2
Seattle 1 1 Detroit 0 2
Anaheim 1 1 Texas 1 1
Minnesota 2 0 Oakland 1 1

(c) 2003 DMPC LLC. All rights reserved yaddayaddayadda www.DisMgmt.com
But when you add in other “sentinel event” claims you learn that didn’t save any money—your overall
lossitis rate is still the same
0
1
2
3
4
5
6
7
8
Baseline NextCycle
New lossitis sentinelevents
pre-identified lossitispatients

(c) 2003 DMPC LLC. All rights reserved yaddayaddayadda www.DisMgmt.com
Let’s look at this in disease management
• Asthma
• Cardiology

(c) 2003 DMPC LLC. All rights reserved yaddayaddayadda www.DisMgmt.com
Example of Sentinel Events: Asthmatics
People withAsthma claimsLast year

(c) 2003 DMPC LLC. All rights reserved yaddayaddayadda www.DisMgmt.com
If you exclude asthmatics with sentinel events this year and just look at ALL last year’s asthmatics with claims…
People withAsthma claimsLast year
Those people’sClaims WILL declineThis year
2000 2001

(c) 2003 DMPC LLC. All rights reserved yaddayaddayadda www.DisMgmt.com
Now see what happens if you add this year’s sentinel-event asthmatics
People withAsthma claimsLast year
Those people’sClaims WILL declineThis year
Newly Dx’ed—No 2000 Claims history
New to Plan—No 2000 claims history
Not taking Meds since 1999 orNo claims since 1999—No 2000 claims
2000 2001

(c) 2003 DMPC LLC. All rights reserved yaddayaddayadda www.DisMgmt.com
Example: Asthmatics
People withAsthma claimsLast year
Those people’sClaims WILL declineThis year
Newly Dx’ed
New to Plan
Not taking Meds
If you don’tCount SentinelEvents youShow excellentROI
2000 2001
(c) 2003 DMPC LLC. All rights reserved yaddayaddayadda www.DisMgmt.com
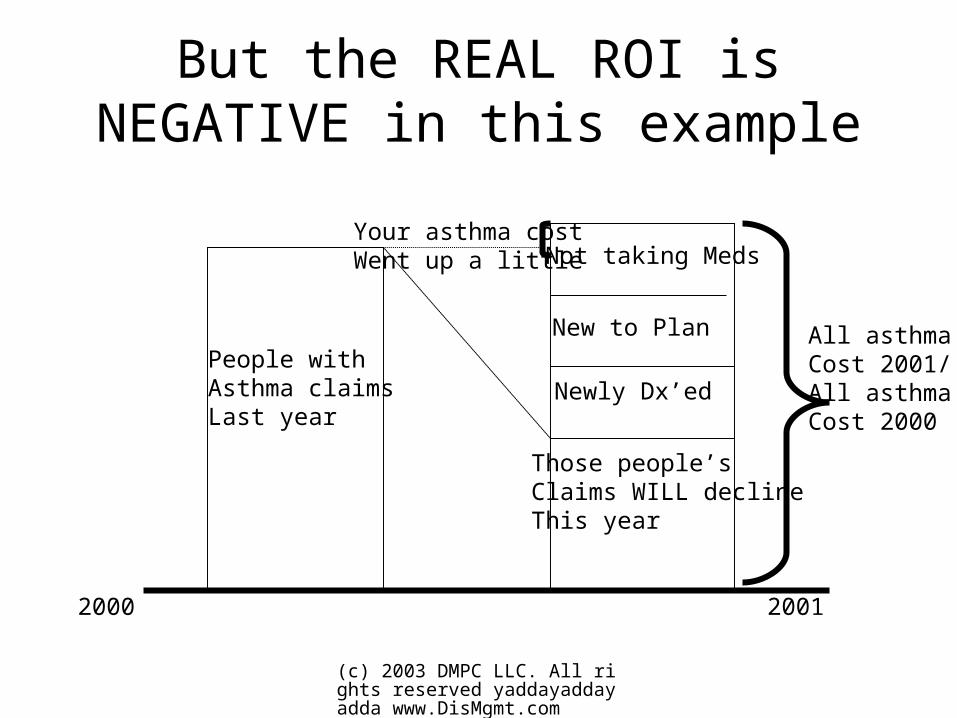
But the REAL ROI is NEGATIVE in this example
People withAsthma claimsLast year
Those people’sClaims WILL declineThis year
Newly Dx’ed
New to Plan
Not taking Meds
All asthmaCost 2001/All asthmaCost 2000
Your asthma costWent up a little
2000 2001

(c) 2003 DMPC LLC. All rights reserved yaddayaddayadda www.DisMgmt.com
Why you don’t want to WAIT until AFTER the Dx or sentinel event to start counting
Example #2: Cardiology
$0
$500
$1,000
$1,500
$2,000
$2,500
$3,000
$3,500
$4,000
$4,500Claim
s/patien
t in p
eriod
in
qu
estion
Month of Dx Next 12month
Next 12months

(c) 2003 DMPC LLC. All rights reserved yaddayaddayadda www.DisMgmt.com
Actual Cardiology Example($ PMPM)
$0$10$20$30$40$50$60$70$80$P
MP
M M
edicare
Original(no
sentinelevents for
newmembers)
Revisedto include
thosesentinelevents
Baseline
Contract Period

(c) 2003 DMPC LLC. All rights reserved yaddayaddayadda www.DisMgmt.com
Actual Cardiology Example: ROI goes from 4:1 to 2:1
(note: always question ROI >2:1)
$0
$10
$20
$30
$40
$50
$60
$70
$80
$Med
icare PM
PM
OriginalMethodology
RevisedMethodology
Baseline
Contract Period
Fees
This was the effect of includingSentinel events in the contractPeriod, after fees

(c) 2003 DMPC LLC. All rights reserved yaddayaddayadda www.DisMgmt.com
Also, it’s not just measurement…it’s management!
• You WANT vendors to PREDICT and AVOID first events because 50% of all cardiac events are FIRST events– You should measure on ALL events to create
that incentive

(c) 2003 DMPC LLC. All rights reserved yaddayaddayadda www.DisMgmt.com
Why payors don’t include sentinel events for members added later, even though it inflates ROI
• Don’t get that they aren’t in (e.g.,”all diagnosed patients”)
• Get that they aren’t in but don’t get ROI significance of leaving them out
• Vendors say it’s unfair to them– No: (1) they guarantee lower but “real” ROI
and (2) see RFP—you need to get them timely data to count these patients

(c) 2003 DMPC LLC. All rights reserved yaddayaddayadda www.DisMgmt.com
Just to clarify…
• Your BASELINE will include people who had their so-called “sentinel diagnosis” DURING the baseline, thus INFLATING it
• Going forward, if you wait until patients are diagnosed to count them in the program and measure their costs GOING FORWARD, they will cost MUCH LESS than the baseline because you EXCLUDED the sentinel event

(c) 2003 DMPC LLC. All rights reserved yaddayaddayadda www.DisMgmt.com
Difference between sentinel event (SE) bias and regression to mean
• They are biases along the same spectrum
• Differences:– SE includes PEOPLE NOT PREVIOUSLY
DIAGNOSED, regression to mean is always among people diagnosed
– SE is solved by INCLUDING ALL CLAIMS on some people not otherwise included if you would just be looking at the diagnosed population

(c) 2003 DMPC LLC. All rights reserved yaddayaddayadda www.DisMgmt.com
Agenda
• Disease Management Purchasing Consortium
• The ROI Imperative• Measuring It
– 3 Biggest Mistakes inflating ROI– What ROIs are by disease
• Why “Built” programs usually have most fallacies
• 5 Take-Aways

(c) 2003 DMPC LLC. All rights reserved yaddayaddayadda www.DisMgmt.com
Typical Return on Investment by Disease(first year 100% guarantee as multiple of
cost—measured right)
0
0.5
1
1.5
2
2.5
3
3.5
Asthma
Cardiac Prevention
Cancer
CHFCOPD
Diabetes
ESRDNeonatology
Rare Diseases
SNF/subacute
Guaranteed
Likely
Breakeven line

(c) 2003 DMPC LLC. All rights reserved yaddayaddayadda www.DisMgmt.com
Agenda
• Disease Management Purchasing Consortium
• The ROI Imperative• Measuring It
– 3 Biggest Mistakes inflating ROI– What ROIs are by disease
• Why “Built” programs usually have most fallacies
• 5 Take-Aways
(c) 2003 DMPC LLC. All rights reserved yaddayaddayadda www.DisMgmt.com
Why “built” programs ESPECIALLY overstate their ROIs
• Trivia:– If you look at relative budgets, what are the
NUMBER ONE and NUMBER TWO areas in which “built” programs underspend vs. vendors’ own programs and how does that affect reported ROI?

(c) 2003 DMPC LLC. All rights reserved yaddayaddayadda www.DisMgmt.com
Dollars spent per $20 in claims— typical built vs. bought
$0.00 $0.10 $0.20 $0.30 $0.40
Enrollment
Basel/Strat
EducOB
Unsched IB
Materials/Fulfillment
MD Interf
Superv/training
Facilities
Analysis/Reporting
Vendors
Health Plans

(c) 2003 DMPC LLC. All rights reserved yaddayaddayadda www.DisMgmt.com
Dollars spent per $20 in claims— typical built vs. bought
$0.00 $0.10 $0.20 $0.30 $0.40
Enrollment
Basel/Strat
EducOB
Unsched IB
Materials/Fulfillment
MD Interf
Superv/training
Facilities
Analysis/Reporting
Vendors
Health Plans
So you measureOnly on the 15-25%Who are easiest toEnroll!
And you don’t spend nearly what you needTo spend to measure right because there Is no guarantee “on the line”

(c) 2003 DMPC LLC. All rights reserved yaddayaddayadda www.DisMgmt.com
5 Things to take Away
• Three biggest inflators of ROI: Regression to mean, self-selection, failure to include sentinel event
• If you are building you are almost certainly measuring wrong
• If you are outsourcing and you’ve never seen this presentation before or your are not a DMPC member, you are probably measuring wrong
• Even when you measure correctly, there is still a strong ROI