c 1990 Joseph James Cardot, III - TDL
105
A COMPARISON OF COMMUNICATOR SOCIAL STYLE AND WORLD VIEW BETWEEN ADMINISTRATORS AND FACULTY MEMBERS OF HIGHER EDUCATION by JOSEPH JAMES CARDOT III, B.A., M.A. A DISSERTATION IN EDUCATION Submitted to the Graduate Faculty of Texas Tech University in Partial Fulfillment of the Requirements for the Degree of DOCTOR OF EDUCATION Approved December, 1990
Transcript of c 1990 Joseph James Cardot, III - TDL

A COMPARISON OF COMMUNICATOR SOCIAL STYLE AND WORLD VIEW
BETWEEN ADMINISTRATORS AND FACULTY MEMBERS
OF HIGHER EDUCATION
by
JOSEPH JAMES CARDOT III, B.A., M.A.
A DISSERTATION
IN
EDUCATION
Submitted to the Graduate Faculty of Texas Tech University in
Partial Fulfillment of the Requirements for
the Degree of
DOCTOR OF EDUCATION
Approved
December, 1990

c 1990 Joseph James Cardot, III

ACKNOWLEDGEMENTS
The author wishes to express his appreciation for the
invaluable help, guidance, and assistance to Dr. Clyde
Kelsey and Dr. Michael Mezack in the co-chairing of work
presented here. Thanks is also extended to Dr. Joe Cornett,
Dr. Robert Ewalt, and Dr. Robert Stewart for their help and
patience in the research and writing that led to this
completed project.
The deepest love and gratitude is expressed to the
author's wife, Vickie Rae, and his children. Amber Rae and
Ashleigh Nicole, for their support and encouragement through
the years needed to complete this effort. The time spent
away from them can never be replaced. It is hoped that the
time that remains can be filled with the same love and
support that resulted in the completion of this degree.
11

TABLE OF CONTENTS
ACKNOWLEDGEMENTS ii
LIST OF TABLES V
LIST OF FIGURES iv
CHAPTER
I. STATEMENT OF PROBLEMS 1
Introduction 1
Statement of Problem 3
Research Questions 4
Definition of Terms 5
Justification of Study 6
Limitations of Study 10
II. REVIEW OF LITERATURE 12
Communicator Social Style 12
World View 27
Administrative/Faculty Relationships 32
Conclusions 36
III. METHODOLOGY, PROCEDURES AND DATA ANALYSIS . . . 38
Methodology 38
Subjects 40
Procedures 40
Variables and Measuring Instruments 42
iii

CHAPTER I
STATEMENT OF PROBLEM
Introduction
Webster defines communication as a process whereby
information is exchanged between persons through a set of
commonly shared signs, symbols, and/or behaviors. Schramm
(1955) describes this process as the encoding and decoding
of a message within an overlapping area of the fields of
experience between those engaged in interaction. Such an
overlap he labels symbolic isomorphism. It is through such
common experiences that meaningful interactions are
possible. Even learning must take place within this
overlap. New concepts, terms, ideas, etc., are explained by
vocabulary all ready understood.
During the past four decades, the majority of
communication research has centered on the verbal
development of messages. Within the last two decades,
research has indicated that most verbal messages are
interpreted in light of the accompanying non-verbal
dimensions (Mehrabian, 1971). The last decade has seen a
shift into the cognitive dimensions of interaction.
While the primary focus of research has and will
continue to shift, scholars usually emphasize the

2
significance of the context in which a message is encoded
and decoded. Such emphasis is accepted. However, the
predispositions each individual carries into an interaction
also affect the message and its interpretation.
Many predispositions and personality variables exist
(communication apprehension, dogmatism, machiavellianism,
etc.), however, two which would bridge the separation
between the cognitive and the behavioral have been examined
only independently of each other.
The purpose of the present study is to link the two
previously separated constructs of communicator social style
and world view. Through these constructs the inherently
tenuous relationship (Mowday, 1978) between university
administration and faculty members will be examined.
Several conceptual models exist for studying or
describing communication behavior in relational contexts
(Merrill and Reid, 1981). However, the four-dimensional
model of social styles which emerged from Merrill's work
with insurance companies appears to provide insight into
both attitudinal and behavioral perceptions of interactants.
It is agreed that context includes many factors and
affects the overall effectiveness of one's communication.
One factor which is receiving increasing attention is the
degree or level of fatalism which the individual feels and
reacts to. Among other names it is referred to by some as
world view. This concept is linked to the individual's

3
perceived understanding of his or her relationship to the
environment and the universe (Dodd, 1987).
The ability to correlate the above constructs with an
individual's job duty in higher education (administrative or
faculty) could help bridge the gap in the university
decision-making process. To provide the best possible
service to students, the community, and the society, each
should strive to work together toward the common mission of
the institution, whether the more general teaching-research-
service or a specialized one set forth by the college.
Statement Of Problem
As stated above attitudinal differences exists between
the administrative and teaching segments of educational
institutions. Such differences can be traced, in part, to
the communication predispositions each individual carries
into interactions with others. Thus, the specific
communicator social style should impact on such
interactions. Research indicates that peoples' perception
of the personal degree of control over their lives also
influences both policy and procedure decisions. This
dissertation focuses on the following problem statement:
Administrators and faculty members in institutions of higher
education have communicator social styles as compared with
world views that vary from each other such that personality
differences between the two groups are predictable.

4
The related questions that exist are numerous: Are
administrators more or less likely to use confrontation
interaction styles then faculty members? Are faculty-
members more or less deterministic than administrators? Are
women in administrative positions more or less assertive
than women in the faculty? Do faculty members exhibit more
or less responsiveness than administrators? Are the world
views of administrators and faculty members different enough
to result in tension?
Research Questions
To date, communicator social style has been used in
business organization analysis almost exclusively- Darling
(1985) begins the application to university administration.
There has been no attempt to apply it to university faculty
or to relate it to world view. Because of the conceptual
relationship the constructs seem to have and the lack of
actual research that exists, the following Research
Questions manifest themselves:
Ql: Is there a significant difference between the
communicator social styles of administrators and
faculty members?
Q2: Is there a significant relationship between the
social style and world view of administrators and
faculty working in the university setting?

5
Q3: Is there a significant relationship between gender
and social style?
Q4: Is there a relationship between education level
and social style?
Q5: Is there a significant relationship between gender
and world view?
Q6: Is there a significant relationship between
faculty position and world view?
Q7: Is there a relationship in the communicator social
styles by administrative level?
Q8: Is there a relationship between administrative
position and world view?
Q9: Is there a significant relationship between level
of versatility and university position?
Definition of Terms
The nature of scientific incjuiry requires that one
begin with a consistent understanding of the constructs
under investigation. Such common ground is found within the
acceptance of definitions for key terms. Unless otherwise
stated, the following definitions will be used for persons
or concepts in this study:
Communicator Social Style: This term identifies a
pervasive and enduring set of interpersonal behaviors based
on how an individual acts. It is composed of the
interpersonal behavioral dimensions of assertiveness and

6
responsiveness. Bolton and Bolton (1984) define
assertiveness as the degree to which an individual's
behaviors are seen by others as forceful or directive. They
further define responsiveness as the degree to which
behaviors are seen as emotionally expressive or emotionally
controlled.
World View: As defined by Dodd and Garmon (1987)
world view is a belief system, personal in nature, that
encompasses the control an individual enjoys and expects as
resulting from his or her perceived limits of control. Such
control, they claim, varies as the communication environment
becomes the perceptual framework for the interpretation of
one's place in the universe.
Faculty: This term refers to those individuals with an
academic position who teach a full load as identified by the
institution and who have no administrative duties in
addition to the teaching load.
Administrator: This term refers to those individuals
who have full-time responsibilities in an administrative
position and teach no more than two courses during the
academic year. This could involve the level of department
head or higher as identified by teaching load.
Justification of Study
As mentioned above, there exists attitudinal
differences within the decision-making process between

7
administrators and faculty members in institutions of higher
education (Mowday, 1978). Any feelings of frustration
should be better understood by those seeking to provide the
best possible environment for educating students.
Each individual should understand that the public trust
given to educate students can be served when the student,
the community, and the society are viewed as their reason
for existing. At the most fundamental level, without
students, no faculty would be needed; without faculty, no
administrators would be needed. With this in mind, both
groups should work toward the common mission of the
institution, whether the more general teaching-research-
service or a specialized one set forth by the institution.
The concept of managing has been applied to higher
education before (Darling, 1985), However, such application
has been made only to the up and down strategies within the
administrative function. It seems logical that if
disagreement exists between the administrative and academic
functions, that greater understanding of any differences
between the two could reduce such disagreement.
The (question of leadership is not addressed here. The
organizational distinction of line and staff functions are
assumed. A president, vice president of academic affairs,
dean, or department head holds leadership distinction over
faculty members. However, vice president of finance, or of
development, does not. But since the allocation of
8
resources can be controlled by the development officer or
the finance officer, their interaction with faculty can have
far reaching implications.
Communicator social style provides a good indication of
one's primary and secondary styles of exercising influence.
Since influence can determine the relative advantage or
disadvantage with regard to power, strategic decisions, and
responses associated with the allocation of resources, such
knowledge can take on increased significance.
To the extent that interpersonal conflict interrupts an
organizational member's ability to perform at peak
effeciency (Bell, 1974), understanding interaction styles
should be helpful to those researchers examining higher
education as organizations. The Communicator Social Style
Profile used by the Wilson Learning Corporation was designed
under the assumption that individuals "have the basic
technical or task skills necessary for their jobs, but can
benefit from assistance in developing their people or
interpersonal skills" (Lashbrook, Lashbrook, Larsen, and
Buchholz, 1978, p. 2).
Likewise, world view is understood as the degree of
control persons feel they have over their own life. The
extent one can control his or her own destiny relates
directly to the perception one has of the amount of
influence that can be exerted over others.

9
Knowledge gained from this study should provide the
student of higher education research with a clearer
perception of how institutional members view their place in
the organization. With this understanding, those seeking to
increase the service of our educational system to the
society will better know what to expect and how best to
accommodate both faculty and administrators.
Further, this study should also provide both
administrators and faculty members with an increased
understanding of each other as well as themselves. An
awareness of the perceived philosophical directions each
group operates under as well as the communication/behavioral
predispositions will give each a clearer concept of the
institutional changes or lack of changes that will affect
them.
Finally, this effort continues the cjuest of
establishing the desirability and usefulness of empirical
inquiry to help understand human interaction. While the
specific application of this study may be limited, it is
seen by this researcher to be a significant start towards
improving the higher education environment. After all, the
United States educational system seeks to improve society by
improving the individual. If the university setting can be
changed through a greater, more positive, relationship
between faculty and administration, then the chances of
being able to serve students and therefore society increase.

10
Limitations Of Study
This study, like all others, contains limitations which
are readily admitted and hopefully understood. Foremost is
the limitation of sample. While efforts were made to
randomly select both institutions and individuals, it was
necessary to limit the scope of institutions selected. The
current study includes only colleges and universities from
southeastern States—those included in the region reviewed
by the Southern Association of Colleges and Schools, All
conclusions will therefore be indicative of faculty and
administrators in the southeastern portion of the country
and may not be generalizable for the entire United States.
A second shortcoming could be from the communicator
social style scale. While the Wilson Learning Center
reports the reliability and validity for the Social Style
Profile as adecjuate (.89), it tends to have interrater
reliabilities of approximately ,80. While still (juite high,
the scale is used primarily in business training seminars
for managers and executives. It has not been used in
academia. Its predictive validity in such a setting is
unknown.
The final limitation cited at this point is with the
Personal Report of World View scale. While used with
several thousand college students, it has been used with
faculty and administrators only once (Garmon, 1984). The
authors have expressed concern over its predictive abilities

11
related to communication behaviors. They are currently
working on a revision but are even more unsure of its
outcome. To the extent that locus of control is established
with the scale, this researcher feels confident enough in it
to move ahead with the effort.
CHAPTER II
REVIEW OF LITERATURE
Communicator Social Style
Communication is seen by many (Goldhaber, 1990; Baird,
1977, Ruesch and Bateson, 1951) as the single most important
dimension of human and organizational interaction.
"Communicator Style" is broadly defined as: the way one
verbally and paraverbally interacts to signal how literal
meaning should be taken, interpreted, filtered, or
understood (Norton, 1978),
Social style is defined as a "pervasive and enduring
set of interpersonal behaviors" (Darling, 1985, p, 80).
Communicator Social Style is the method of assigning meaning
to the behaviors of individuals based upon their consistency
of interaction (Bolton and Bolton, 1984).
Most theories of social style arise from behavioral
psychology, the result of social science research (Merrill
and Reid, 1981). The concept of communicator social style
emerged from Merrill's work with insurance companies and
appears to provide the greatest insight into both
attitudinal and behavioral perceptions of interactants. It
is distinguished from most models by its emphasis on
behavior rather than on personality.
12

13
One of the most popular communicator style scales used
is the Norton nine-dimension construct operationally called
the Domain of Communicator Style (Norton, 1978). The scale
involves a "simplex" where communication variables are
evaluated ranging from communicative activity to inactivity.
Norton ties the construct to the individual's context,
situation, and time. "The tacit hypothesis is that these
three components to some extent substantially influence
styles of communicating" (Norton, 1978, p 110). This
researcher contends that such situationally driven variables
do not establish the underlying motivations of behavior.
Such motivations are better understood through an analysis
of what a person actually does and not what his or her
personality suggests will be done.
Bolton and Bolton (1984) compare people to icebergs,
citing that only a fraction of who the individual really is
and how they feel can be observed directly. The result
being that attitudes, values, motives, thoughts, etc., must
be inferred. Such inference occurs through behavioral
observation and is many times incorrect.
The social style model allows the observer to use the
"surface" data (behavior) rather than the motivations behind
the behavior. While this is a dramatic deviation from other
systems or styles used in monitoring either interpersonal
relationships or managing people, it provided a far more
objective method. Since the system is used mostly in
14
management training, most of its application is in the
business community. Many managers and supervisors use
behaviors to determine the attitudes and motives of workers.
However, as Peter Druker (1973) contends, it is an abuse of
power to delve into an individual's personality. An
employer, by contract, can expect performance, nothing else.
Communicator social style makes predictions based upon
the clustering of behavior. It examines an individual's
behavior, but not individual actions. In fact, it ignores
the actions one takes while alone and is concerned only with
how the individual behaves in the presence of others. As
stated above, social style deals with the consistency of
interaction or avoidance with others.
The model utilizes two dimensions perceived by
leadership and management researchers (Stogdill and Coons,
1957; Reddin, 1970; Blake and Mouton, 1978) to be critical
in understanding behavioral style. The terms cited by
others include; dominant-submissive, task or relationship
orientation, or initiating structure and consideration.
In the social style model arising out of Merrill's
work, the dimensions are labeled assertiveness and
responsiveness. A person's social style is therefore
defined as the measured perceptions of assertiveness and
responsiveness. These constructs are similar to the
internalization process expressed by Blake and Mouton (1964)
in the Managerial Grid. The Grid is consistent with and was

15
even derived from the leadership research completed at Ohio
State and Michigan. Stodgill (1950) concluded that
effective leaders have a high concern for both tasks and
personnel. Vroom (1976) found that effective leaders tend
to develop relationships that enhance worker self-esteem,
set high performance goals, and use group supervision and
decision-making. The relationship between managerial
concern for tasks and employees can be seen in the Blake and
Mouton Grid.
Assertiveness
Many definitions of assertiveness can be found. The
most useful in a general sense is the degree to which an
individual seeks to guarantee that the rights of others as
well as their own rights are not infringed upon. However,
in this communicator social style model, assertiveness is
the degree to which an individual's behaviors are perceived
by others as being forceful or directive. While workable in
this context, the reader must understand that this
definition is close to what many would refer to as
aggressive behavior.
Bolton and Bolton (1984) point out that the degree of
assertiveness is the observational reaction towards one's
behavior and may not indicate either the inner drive or
motives behind the behavior. Such observations seem to
cluster an individual's behavior into segments or quadrants

16
(see figure 1). Researchers (Bolton and Bolton, 1984)
maintain that the United States population is ecjually
divided between the segments.
Low
Assertive
A
25%
B
25%
C
25%
D
25%
Figure 1
Assertiveness Scale
High
Assertive
It is important to note that an individual's behavior
will not be limited to one segment. However, each person is
consistent enough in his or her personalities to have, over
time, most behaviors cluster in only one. As will be seen
below, most analysis is sufficient to identify in which half
a person's behavior falls. The question then becomes: Is
he or she more or less assertive? The answer will place the
individual to the left or the right of the midpoint on the
scale.
The Wilson Learning Center conducts management seminars
based upon one's social style as defined here. Their main
concern (among others) is to point out that no "correct"
segment or position exists. Success or failure is relative
and can be measured only in terms of goal realization. To
help determine which side of center one is operating on.

17
Bolton and Bolton (1984) have identified general tendencies
of behaviors that help to pinpoint clusters of interaction.
Persons who are less assertive and would fall to the left of
the midpoint tend to:
1. Move more slowly and deliberately,
2. Speak more slowly and more softly,
3. Lean backward, even when making a recjuest or
stating an opinion,
4. Be more tentative and less forceful in expressing
opinions, making requests, and giving directions.
5. Be less confrontive.
6. Let others take the interpersonal initiative,
7. Be "ask oriented,"
8. Decide less cjuickly.
9. Be less risk oriented.
10. Exert less pressure for decisions.
11. Have less intense, less consistent, and less
frecjuent eye contact.
Such information becomes useful when compared with the
behaviors most commonly associated with those who are more
assertive. These individuals would fall to the right of the
midpoint on the scale. Such persons tend to:
1. Move more rapidly-
2. Speak more cjuickly, more intensely, and even more
loudly.

18
3. Sit upright and lean forward, even when not making
a recjuest or stating an opinion.
4. Be more emphatic while expressing opinions, making
recjuests, or giving directions.
5. Be more confrontive.
6. Take the interpersonal initiative in interactions.
7. Be more "tell oriented."
8. Make decisions more quickly.
9. Be more risk oriented,
10. Exert more pressure on others for decisions,
11, Have more intense, more consistent, and more
frequent eye contact.
Responsiveness
The second dimension utilized by the model is that of
responsiveness. By definition, responsiveness is the degree
to which behaviors are perceived as either emotionally
expressive or emotionally controlled. The more responsive
people tend to react overtly to the emotions of others or to
their own emotions. The less responsive people tend to be
more reserved, controlled, or guarded in the expression of
emotion or feelings.
The population is likewise divided into four ecjual
segments of responsiveness. The cjuestion, as with
assertiveness, is: On which side of the midpoint does the

19
individual's emotional responsiveness lie? As figure 2
indicates, the model uses, graphically, a "Y" axis for such
identification.
High Responsive
D
C
B
A
25%
25%
25%
25%
Low Responsive
Figure 2
Responsiveness Scale
In terms of emotional expression, one's behavior will
tend to cluster predictably just as assertiveness will.
Again, there is no best place to be on the scale. Each has
its' own strengths and weaknesses (Merrill and Reid, 1981).
The issue becomes one of identifying whether the person is
more emotionally controlled or is more responsive to and
expressive of their own emotions as well as the emotions of
others. The following provides the tendencies or indicators
of responsiveness and has been adapted from Bolton and
Bolton (1984, p. 21). In terms of general behavior, those
persons who are less responsive and fall below the midpoint
on the scale tend to:

20
1. Limit their use of gestures in interpersonal
settings.
2. Move with less fluid gestures and actions.
3. Be less expressive facially.
4. Be more serious.
5. Appear more reserved with others.
6. Dress more formally.
7. Exhibit more control in their expression of
feelings.
8. Be more focused on facts.
9. Appear less people oriented and more task oriented.
10. Be less interested in small talk, anecdotes, and
j okes.
11. Make decisions based more on facts than on
emotions.
12. Be more disciplined in their use of time.
13. Supervise the actions of others in a more
disciplined manner.
The above tendencies are not necessarily either
positive or negative. Such an evaluation can be made only
in relation to the outcome in a specific situation. Bolton
and Bolton (1984) continue with the behaviors most likely to
be observed by those persons who are more responsive. Such
individuals would fall above the midpoint on the
responsiveness scale. In their behaviors, they would tend
to:

21
1. More frequently gesture to others.
2. Move more freely, with less rigidly.
3. Be more facially expressive.
4. Be seen as more playful.
5. Appear as more friendly by others.
6. Dress more informally.
7. Be freer and less guarded in their expression of
feelings.
8. Focus more on feelings rather than on facts.
9. Be seen by others as more people oriented and less
task oriented.
10. Be more open to small talk, anecdotes, and jokes.
11. Be more influenced in their decision making by
feelings and not just facts and figures.
12. Demonstrate less use of structure in their use of
time.
13. Supervise others with a more person oriented style.
Related Factors
The Social Style Profile measures two additional
factors that relate highly to both assertiveness and
responsiveness (Lashbrook, Lashbrook, Larsen, and Buchholz,
1978). The constructs of versatility and trust are not
independent of the two dimensions but, rather, mediate the
consecjuences of the individual's social style.

22
Versatility. The first factor is perhaps the most
significant as it relates to style. Versatility is defined
as the individual's ability to adapt behavior to meet the
needs or goals of others (Merrill and Reid, 1981). It is
similar to the concept of flexibility identified by Bolton
and Bolton (1984), Both look at the appropriateness of
behavior situationally- The Wilson Learning Corporation
(1977) concludes that a person with high versatility could
be predicted to be changeable, flexible, adaptable, etc.
Basically, the individual's behavior is unpredictable.
Since the specific social style affects one's success
or failure only to the extent it is compatible with the
style of others, versatility takes on more importance.
Managing Interpersonal Relationships (MIR) seminars are
conducted by the Wilson Learning Corporation to teach
individuals greater versatility. Such training sessions
have proven successful (Burgess, Lashbrook, Wenburg, Larsen,
and Lashbrook, 1981). Comparisons between a pre-seminar
versatility rating and a rating fourteen weeks after the
seminar found those completing the course were still
perceived higher in their flexing strategies than those who
did not attend. To the extent that a person adapts to each
situation, the tendency to have more successful
relationships is increased.
Trust. Another mediating factor, although not as
changing as versatility, is that of trust. As a construct

23
related to social style, it is defined as "...the perceived
effort a person makes to be reliable when relating with
others" (Lashbrook, Lashbrook, Larsen, and Buchholz, 1978,
p. 5) . As expected, one perceived as high in trust is also
seen as honest, dependable, unselfish, and responsible.
Such a perception will influence the effectiveness of a
person's social style in any given situation.
Trust relates to other dimensions of interpersonal
relationships. It is positively correlated with self
disclosure, liking, and self concept. It is interesting to
note that this construct is not dealt with by most
researchers in communicator social style. It seems that
most individuals will take morality or choice issues for
granted and seek to understand areas commonly believed
uncontrolled.
Social Styles
As stated above, the two behavioral dimensions of
assertiveness and responsiveness form the axes of the
communicator social style model. Scoring of the profile
measure allows a four quadrant representation. One cjuadrant
for each style exists; analytical, driver, amiable, and
expressive. Figure 3 shows the relationship of each style
with the degrees of responsiveness and assertiveness. It
should be noted that the quadrants have been rearranged by
this researcher to conform to the traditional use of the "X"

24
and "Y" axes. Conceptually, this action is justified as the
reader can now more easily see the style change when the
degree of assertiveness (X-axes) or the degree of
responsiveness (Y-axes) is increased or decreased.
High
Responsiveness
Low
Amiable
Analytical
Expressive
Driver
Low High
Assertiveness
FIGURE 3
Social Style Grid
The population is said to be evenly distributed
throughout the quadrants (Bolton and Bolton, 1984). It is
also significant to note that one style is not more
effective or important than another. Each has both
strengths and weaknesses. Impressive successes have been
achieved by individuals from each cjuadrant throughout
history. Each style is identified and explained below.
Analytical. The analytical style is a combination of
low levels of both assertiveness and responsiveness. Such a
person exhibits a high degree of emotional self control.
They tend to assimilate and evaluate large amounts of data
before acting. Analyticals are usually very well organized.

25
thorough, systematic, and precise. They are extremely
attentive to detail (Bolton and Bolton, 1984),
Driver. The driving social style combines low levels
of responsiveness with high levels of assertiveness. Like
the Analyticals, their emotions are kept under control.
However, they are highly task oriented and deal with people
and issues (juickly. Typically, they are highly competitive,
pragmatic, objective, results oriented and express
themselves succinctly (Darling, 1985). Many organizations
value their independence and willingness to take risks on
what appears to be little information.
Amiable. Combining high responsiveness with low
assertiveness, the Amiable tends to be highly sensitive and
sympathetic to the needs of others. The easygoing, trusting
style tends to bring out the best from subordinates. In an
educational setting, Amiables can encourage colleagues and
students to high levels of performance. Because of the low
assertiveness, responsiveness is perceived as empathy and
understanding which enhances interpersonal problem solving
(Bolton and Bolton, 1984).
Expressive. Using high degrees of both assertiveness
and responsiveness, Expressives tend to look at the forest
and not individual trees. Their greatest strengths lie in a
combination of the willingness to take risks and the use of
unusual or novel problem solving techniques. They are great
morale boosters through emotional expression and humor.

26
Expressives are the visionaries of the organization but are
also able to decide and act cjuickly on matters (Bolton and
Bolton, 1984).
Management seminars seek to make executives and
supervisors more aware of management style options. The
Wilson Learning Corporation (1977) contends that one's
management style should be an outgrowth of individual social
styles. Capacities are not fully utilized when the social
style conflicts with the management style.
Since no one individual possesses the strengths of all
four styles, administrative teams should strive to include
at least one of each social style. Using different terms,
management consultant Peter Druker (1973) concludes that
"top management tasks recjuire at least four different kinds
of human beings: the 'thought man' (analytical), the
'action man' (driver), the 'people man' (amiable), and the
'front man' (expressive)" (sic)(p, 616),
The above principle would argue for multiple
individuals in the problem solving process. It is not
suggested that social style be used as a screening measure
for employment or promotion. Rather, it advocates a
willingness to recognize and develop existing personnel with
each style to enable a leadership team to capitalize on the
assets of all four styles (Norton, 1983).
Studies in conflict have indicated that social style
may relate to conflict management in so far as individuals

27
are perceived to be less flexible or versatile in their
willingness to cope (Lashbrook, Lashbrook, Larsen, and
Buchholz, 1978). Stress is seen to influence the flex style
of the individual. Thus, as conflict occurs, the model may
predict not only modes of conflict management but also
discriminate between types of conflict. The lack of
versatility is not necessarily limited to those low in
responsiveness. As stress or tension increases, each style
tends to become more rigid (Lashbrook, Lashbrook, Parsley,
and Wenburg, 1977).
Such rigidity stems from a personality strength being
overemphasized and resulting in a perceptual weakness. For
example, the Analytical who is precise and systematic may
become exacting and inflexible. The Driver who is
determined and objective may become dominating and
insensitive. Overextended, the Amiable's supportive,
easygoing style may become conforming and permissive.
Finally, the enthusiastic and imaginative Expressives may
become both undisciplined and unrealistic. The result is
that administrative ineffectiveness can be the outcome of
the overextension of one's strengths.
World View
The past several years have seen researchers attempting
to isolate communication predispositions that can be used to
predict behavior. To some extent, this has been

28
accomplished with communication apprehension (McCroskey,
1982), dogmatism (Berger, 1985), and self esteem (Giles and
Street, 1985) . As seen above, social style also predicts
behavior across situations (Bolton and Bolton, 1984).
A common thread running through behavior prediction
research is the extent or degree of control the individual
perceives to exercise. Rotter (1966) developed a scale
which determines the extent to which an individual perceives
internal or external control. Such a locus of control
results from perceived reinforcement following some action.
If the reinforcement comes from the individual's personal
characteristics or ability to influence the outcome, an
internal locus of control is exhibited. However, if the
reinforcement is perceived to be the result of fate, chance,
powerful others or luck, then the locus of control is
external.
It is significant to note that Rotter's theoretical
base stems from a drive-oriented, motivated perspective.
Put simply, internal forces drive some people and external
forces direct others. The major criticisms revolve around
its one dimensional nature. While other yardsticks exist
which measure locus of control. Rotter's appears to be the
most consistent (Scarbaugh and Roe, 1984; Kluckhohn and
Strodtbeck, 1961).
It also appears, however, that while external or
internal forces can and do affect or influence actions.

29
these forces are not necessarily predispositions. It seems
that cultural presuppositions more clearly identify
predicted behaviors. Such a shift in focus takes the reader
into the construct of world view (Dodd and Garmon, 1987).
Arising from communication perspectives, the Personal Report
of World View (PRWV) is based upon assumed factors that
relate to intrapersonal and interpersonal perceptions. Such
assumptions led Dodd and Garmon (1987) to define world view
as "...a cognitive belief system concerning the limits and
expenses of personal control within one's communication
environment" (p. 8).
Dodd and Garmon's (1987) work suggests that the scale
remains internally consistent, with the reliability
coefficient of .81. Their test-retest work also indicated
reliability over time (r=.80).
Validity seems to be upheld in that the scale is
supported as a construct measure with intuitive face
validity. However, it also has criterion validity in that
it correlates with Rotter's I-E scale (r=.55).
Rotter's scale has proven an effective measure in many
studies. However, since it uses a forced choice system, the
PRWV allows a greater range of response freedom. It also
correlates highly with communication behaviors such as
communication apprehension, television exposure, and
innovativeness, making it more useful to communication

30
researchers. Finally, the PRWV is not dependent on the
concept of reinforcement of behavior. It is also, unlike
the I-E scale, not based on contingency relationships
between behavior and outcomes.
Rotter's I-E scale is perceived as a reinforcement,
drive-orientated construct (Rotter, 1966), While it seeks
to identify whether an individual is controlled internally
or externally, it does so from a motivational foundation.
The PRWV, however, operates from cultural presuppositions.
It maintains that it is the construct through which an
individual develops values based upon the perceived degree
of control maintained within his or her communication
environments (Dodd and Garmon, 1987),
The scale is used to classify individuals into three
types. These types fall along a continuum relative to the
degree of fatalism held by the individual. Type I persons
are those low in communication determinism, scoring one
standard deviation below the average. Such individuals are
high in self-esteem, innovative, confident, assertive, and
easily adaptable to new situations. Type III persons, on
the other extreme, are high in communication determinism,
scoring one standard deviation above the average. They are
best described as low in confidence, low in assertiveness,
low in innovativeness, and less able to adapt to new
situations. Type II persons will exhibit a mixture of the
31
two. They have behavior that is not as deterministically
predictable as the other two.
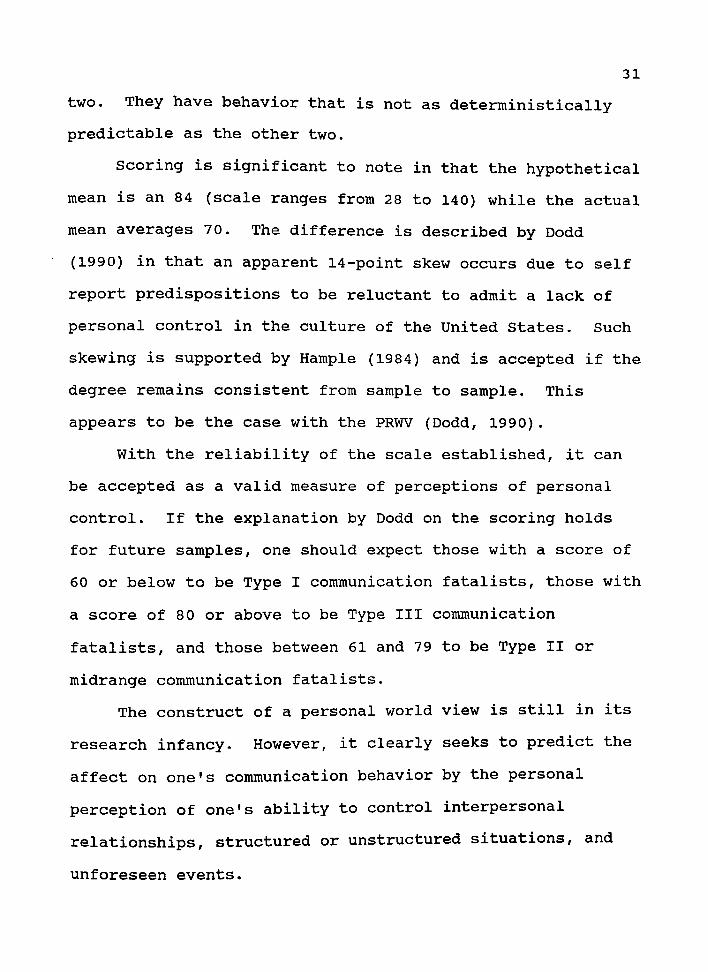
Scoring is significant to note in that the hypothetical
mean is an 84 (scale ranges from 28 to 140) while the actual
mean averages 70. The difference is described by Dodd
(1990) in that an apparent 14-point skew occurs due to self
report predispositions to be reluctant to admit a lack of
personal control in the culture of the United States. Such
skewing is supported by Hample (1984) and is accepted if the
degree remains consistent from sample to sample. This
appears to be the case with the PRWV (Dodd, 1990) .
With the reliability of the scale established, it can
be accepted as a valid measure of perceptions of personal
control. If the explanation by Dodd on the scoring holds
for future samples, one should expect those with a score of
60 or below to be Type I communication fatalists, those with
a score of 80 or above to be Type III communication
fatalists, and those between 61 and 79 to be Type II or
midrange communication fatalists.
The construct of a personal world view is still in its
research infancy. However, it clearly seeks to predict the
affect on one's communication behavior by the personal
perception of one's ability to control interpersonal
relationships, structured or unstructured situations, and
unforeseen events.
32
Administrative/Facultv Relationships
The literature extant examining the relationships
between faculty members and administrators of higher
education reveals very little. The topic has not been
devoid of analysis; however, this researcher would be hard
pressed to describe what exists as extensive. The content
and significance of areas of research and teaching compared
with the institutional service to the external community
appear, at times, to be contradicted or ignored by the day-
to-day operations of the university (Warburton, 1989).
Virtually all academic areas are involved with research
and are actively seeking to explain the world around them.
However, when seeking to understand the relationships or
even the philosophical outlooks between administration and
faculty, studies are cjuite limited. Most simply describe
characteristics of community and junior college members.
Few studies exist that examine four year and graduate
institutions. Sykes (1988) concluded that due to their
training, the best administrators are liberal arts scholars.
It is suggested that they understand better than others the
purpose of education and how best to produce a successful
educational organization. The fallacy of the study revolves
around the assumption that since liberal arts scholars have
traditionally become presidents and vice presidents for
academics, they are somehow better qualified. It may simply
be that non-liberal-arts scholars do not aspire to the

33
positions or that outgoing administrators influence the
choice of successor. This trend, however, is fading. The
attempts to control dwindling resources while competing for
fewer students have resulted in individuals with
administrative training being selected more often than
before (Three Thousand Futures. 1980).
Intuitively, the administrator should be adept at
balancing the needs of the individual faculty member, or
student, with the needs of the institution as a whole.
Sykes (1988) identifies the administrative art as an ability
and desire to consider contradictory propositions
comfortably within a mental framework that desires
complexity. Since the university environment is composed of
individuals who perceive their profession as vital, the
balancing requirements are usually strained toward their
limits.
Only one study exists that seeks to understand the
philosophical basis for administrative/faculty differences.
Garmon (1984) found that administrators are more
deterministic than faculty members. She concluded that the
world view of faculty is one of greater freedom of choice
over issues that affect their futures. It seems that vice
presidents are the most deterministic of administrators,
feeling that they have less ability to control their futures
than either their superiors (presidents) or subordinates
(deans and department heads).
34
Garmon (1984) also found that English faculty were the
least deterministic while there was no significant
difference between administrators and faculty members in
either education or mathematics, she concluded that the
English discipline more closely represents the liberal arts
and should therefore have the least deterministic world
view. Such would be true only to the extent that the factor
controlling world view is liberal arts training or
orientation. Or, perhaps, that one's world view determines
which discipline an individual will enter. At this point,
neither conclusion can be drawn.
Beyond Garmon's study, empirical analysis is lacking.
Warburton (1989) suggests that the major differences lie in
the perceptions of organizational climate. He concluded
that administrators must use a more macroscopic view of the
institution and are concerned with the formal structure
while faculty are not confronted with the general concerns
as frequently as administrators. Moran and Volkwein (1988)
found that faculty perceive the organizational climate more
negatively than administrators. Part of the perceptual
variance may be due to different needs and expectations of
the two groups. In an earlier study (1987) they concluded
that the role each individual fills in an institution exerts
a stable systematic influence on both climate and attitudes.
Their work was supported by the 1988 study in that
administrators' perceptions of climate were significantly

35
more positive than those of faculty. The reason may be that
administrators feel a greater responsibility for the
character of the organization. It becomes a type of self-
justification. Such could be the result of isolation from
routine problems and frustrations, a lack of daily contact
with faculty and students.
Cohen and March (1974) point out that higher education
institutions are frecjuently described as "organized
anarchies." Such organizations have a high degree of goal
ambiguity. Effective results can occur if members perceive
that they and others are devoting themselves to reasonably
clear goals to which they and the organization are
committed. Effective colleges and universities are able to
achieve goal focus despite the problems of ambiguity and
conflict by identifying an "adequacy of performance focus"
(Cameron, 1981). Such a focus must come from individual
goals that are at least congruent with stated organizational
goals if not specifically the same. If they are not, then
ineffective communication, lowered productivity, and a non
supportive or negative climate will result (Warburton,
1989) .
The size of an organization always affects the
interaction and, therefore, relationships between members
(Goldhaeber, 1990). The greater the perceptual distance
between individuals, the more likely the interaction will be
written and formal. The tendency also exists to more

36
rigorously follow the chain of command. The communication
becomes more structured and a macro versus micro perspective
of administration and faculty increases the perceptual
distance between them. The result is an ever widening gap
between the two groups (Warburton, 1989).
Conclusions
As stated above, no body of literature exists that
seeks to relate the communicator social styles and world
views of administrators and faculty. While this in and of
itself does not justify such a study, the attempt to better
understand the relationship between the two does. Since the
goal of education is to collect, interpret, organize, and
disseminate both knowledge and skill, scholars should seek
to better understand the organization in which this is
accomplished.
It has been clearly established that one's social style
directly affects our interactions with others (Bolton and
Bolton, 1984) . It has also been shown that predispositions
to communicate are affected by personal world view (Dodd and
Garmon, 1987) . And finally, it has been hinted that the
behaviors of faculty and administrators in higher education
are the result of different views of the institution. It
seems logical and justified to this researcher that an
analysis of the relationship between all three is warranted.

37
It is upon this basis that the nine research (questions
presented in chapter one have been established. The
following chapter presents the methodology of the current
effort and the procedures.

CHAPTER III
METHODOLOGY, PROCEDURES, AND DATA ANALYSIS
Methodology
Throughout eleven southern States, the Southern
Association of Colleges and Schools (SACS) is charged with
educational institution accreditation. To discharge its
higher education self-policing duties, SACS has identified
accredited institutions through five categories ranging from
those granting only associate degrees to those granting only
graduate degrees. For the purpose of the current project,
only the middle three categories were considered. The
groups include institutions that grant degrees at the
bachelor's, master's, and/or doctoral level. The rationale
used for this narrowing of the population lies in the
attempt to replicate the only study that exists, to date,
which examines faculty and administrators relative to their
levels of perceived determinism (Garmon, 1984). Since the
social styles have not been examined, and no comparison has
yet been made with world view, this researcher felt
justified in reducing the number of institutions from which
subjects would be drawn. Further justification lies in the
use of a stratified sample being chosen from each
38

39
institution. Procedures sought fourteen subjects from
individual colleges or universities.
For the calendar year 1989 - 1990, SACS maintained
accreditation over 351 institutions granting bachelor's
degrees, bachelor's and master's degrees, and bachelor's,
master's and doctoral degrees. Through the use of a
computer-generated random number and a list of institutions,
a stratified random sample of ten percent of the
institutions was selected. Such a procedure generated a
total of 35 institutions.
Having identified the universities and colleges to be
used, names of the following individuals were obtained from
each institution: president; vice president for academic
affairs; dean of business; dean of liberal arts; dean of
science; dean of education; and two faculty members from
each of the four disciplines. In some cases department
heads of accounting, English, mathematics, and education
were used when the position of "dean" was either not used or
not occupied at a given institution.
As stated above, the rationale for subject choice lies
in the attempt to replicate the conceptual framework of the
Garmon study in 1984. She attempted to survey individuals
from the highest levels of administration to those teaching
levels the most removed from administrative roles.

40
Subjects
Utilizing the role categories above, subjects included
in the current effort were as follows: 21 presidents; 28
vice presidents for academic affairs; 20 deans of business;
28 deans of liberal arts; 13 deans of science; 25 deans of
education; 40 faculty of business; 46 faculty of English; 27
faculty of mathematics; and 52 faculty of education.
Demographic information also found response by gender to be
208 male and 93 female (see post hoc analysis for specific
breakdown).
Procedures
This researcher mailed a letter of introduction and
recjuest for participation with the survey packet containing
demographics, the Personal Report of World View, and the
Social Impression Scale which identifies individual
communicator social style (see Appendix) to individuals
identified above. Sampling procedures yielded contact with
the following numbers per category: 35 presidents; 35 vice
presidents for academic affairs; 35 business deans or
department heads; 35 liberal arts deans or department heads;
35 science deans or department heads; 35 education deans or
department heads; 70 business faculty; 70 English faculty;
70 mathematics faculty; and 70 education faculty. The
number of surveys mailed totaled 490.

41
Each individual selected was asked to complete and
return the survey in the enclosed addressed and stamped
envelope. The introductory letter indicated that all data
would be used in group analysis and not individual analysis.
Coding did not include any identification that would allow a
specific individual to be singled out. However, those who
wished to be excluded from the study were asked to return
the unanswered survey in the envelope provided.
Response rate analysis indicated that subjects fell
into three categories. Subjects either returned the
completed cjuestionnaire (see breakdown above) , returned the
questionnaire unanswered, or simply did not return the
cjuestionnaire. Of the 490 surveys mailed, 261 were returned
completed, and 42 were returned blank. Usable
questionnaires represented 53.3 percent, blank returns
represented 8.6 percent. The total response to the initial
mailing, 303, provided a 61.8 percent return rate.
Extending the analysis yielded 38.2 percent who did not
respond.
In an attempt to increase the response rate, this
researcher mailed an additional 187 questionnaires to those
who failed to respond to the initial recjuest. Results were
more complete than expected. Secondary mailing yielded an
additional 40 usable surveys (21.4 percent). Fifty-two
persons (27.8 percent) returned blank cjuestionnaires making
the second return rate 49.2 percent.

42
When the two mailings were combined, 301 (61.4 percent)
usable surveys resulted. An additional 94 (19.2 percent)
were returned blank. Total response cited by this effort
came to a surprisingly high 395 which represented an 80.6
percent return. Ninty-five of the initial subjects failed
to respond to either the first or second request and
resulted in a 19.4 percent nonresponse rate.
Variables and Measuring Instruments
Independent variable
The current research effort utilized only one
independent variable. The attempt to gather data useful for
the better understanding of higher education yielded
analysis of administrators and faculty members. Therefore,
subjects fell into two primary groups; those with direct
daily student contact in the classroom, and those whose
contact with students is less frequent.
As presented in Chapter I, faculty refers to those
individuals with an academic position who teach a full load
as identified by the institution and who have no
administrative duties in addition to the teaching load. The
individual may have held another position earlier, but the
current assignment must be teaching and not administrative.
Chapter I also indicated the parameters of an
administrator. While the individual could have been defined
as a faculty member in the past, he or she must now hold

43
full-time responsibilities in an administrative position and
teach no more than two courses during the academic year.
The position held by an individual was the independent
variable. Subcategories exist as seen below.
Administrators fell into three major groups; president, vice
president, and dean (department head was substituted where
necessary, but only if the low teaching load recjuirement was
met) , Faculty fell into the four groups identified by the
survey procedures; business, English, mathematics, and
education.
Dependent variables
The current effort sought to examine fundamental
differences between administrators and faculty- The attempt
was to better understand differences, if any, that could
affect either interaction and/or the personal/positional
perception of the institution of higher education. In this
attempt, two variables were examined which, as justified
above, this researcher felt would differ based upon the
individual's position.
Communicator social style. An individual's
communicator social style is defined relative to perceived
responsiveness and assertiveness. A person's perceived
responsiveness is defined as the perceived effort one makes
to control their emotions when relating to others.
Perceived assertiveness is defined as the effort one makes

44
to control or influence the actions or thoughts of others
(Wilson Learning Corporation, 1977).
The instrument designed to measure the two dimensions
of social style is the Social Style Profile (Wilson Learning
Corporation, 1975). Subscales place an individual as either
high or low on both responsiveness and assertiveness. When
viewed together, the scores place a person's predisposition
towards interaction into one of four categories; analytical,
driver, amiable, or expressive. The scale used in the
current project utilized 17 items. The assertiveness
dimension uses eight items, the responsiveness dimension
five items. The remaining four items were used to measure
the personally perceived degree of versatility- Versatility
is defined as the perceived ability one has to adapt
behavior so that it meets the needs of others, A person who
possesses high versatility would be expected to be
adaptable, changeable, flexible, and unpredictable. As a
construct, versatility mediates the consequences of social
style.
Examination of the development of the Social Style
Profile revealed a relatively high level of reliability and
validity (Lashbrook, Lashbrook, and Buchholz, 1977). Using
Kaiser's Measure of Sampling Adequacy, they found at least
.89 for each factor analysis conducted. Internal
consistency measures and interrater reliabilities exceeded

45
.80 for each dimension. They also found all three
dimensions to be normally distributed.
As mentioned in the procedures section above, subjects
were asked to respond to the 17-item profile on a 7-point
low to high scale. The data provided a self report of
perceptions on responsiveness, assertiveness, and
versatility.
Individual analysis results when the scale is broken
down into its parts. The Assertiveness dimension has eight
items allowing respondents to range from a score of eight to
fifty-six. A score of 32 or less can place the person's
social style in either Amiable or Analytical. A score above
32 results in a style of either Expressive or Driver. Exact
style is determined by comparing the Assertiveness score
with the Responsiveness score. Composed of five items, the
Responsiveness score will range between five and thirty-
five. A score of 20 or less places a person in the
Analytical or Driver category while a score above 20 places
them in the Amiable or Expressive category.
As stated above, versatility mediates the consecjuences
of the style used. The scale ranges from four to twenty-
eight. The hypothetical mean of 16, places the individual
as either high or low in their perceived ability to adapt to
the needs of others.
World view. Dodd and Garmon (1987) defined world view
as a personal belief system that included the control a

46
person enjoys and expects based upon his or her perceived
limits of control. It involves an interpretation of one's
place in the universe.
The instrument designed to measure this personal belief
system is the 28 item Personal Report of World View (PRWV).
The scale has undergone several revisions and has ranged
from a high of 50 items to a low of 17 items. The scale
used, represents better wording and construct validity over
its 17-item predecessor.
Garmon (1984) found reliability of .84 for the refined
scale. Dodd and Garmon (1987) obtained a slightly lower
internal reliability of ,81, The earlier 50-item scale
yielded a Cronbach's Alpha of ,86, However, since the two
scales correlated with each other at ,96, the developers
felt the smaller scale held greater utility while still
being highly predictive.
The PRWV utilizes a Likert format which asks subjects,
to respond to each item indicating whether they strongly
agree, agree, are neutral, disagree, or strongly disagree.
An individual's world view is indicated by a total score
from a low of 28 and a high of 140. The hypothetical mean
and median is 84. Due to the wording of items 3, 12, and
18, scoring is reversed.
As noted above in Chapter II, the actual mean is
seventy representing a 14 point skewedness toward under
reporting one's level of experienced control (Dodd, 1990).

47
Past use of the scale shows that a higher score indicated a
world view that is less deterministic giving the individual
greater freedom of choice. A lower score would indicate a
more traditional perspective which suggests that many things
in one's life are not under personal control.
Literature extant shows that very little attempt has
been made to study the relationship between administration
and faculty. The need to better understand the two and how
they react and interrelate appears obvious. The current
effort seeks to provide what this researcher feels is
valuable data resulting from a carefully chosen sample of
professionals in higher education.
Data Analysis
Data collection allowed for the analysis of the
dependent and independent variables to be conducted at
various levels. A series of Chi Squares and ANOVAs provided
the majority of the statistical work. Specifically,
research cjuestion one used a four by two matrix to examine
the relationship between the four categories of communicator
social style with the two categories of classification;
administrative and faculty. Research question two required
a two-way analysis of variance comparing world view with
four categories of social style and two categories of
classification, administrative or faculty. To examine
research question three, a four by two matrix was used to

48
compare social style with gender. Both an ANOVA and a four
by four factoral design was used to compare social style and
faculty position specified by research cjuestion four. An
analysis of variance was used for both questions five and
six. Five examined world view by gender while six
investigated world view based upon one's position in the
faculty. Question seven utilized a four by three matrix to
determine the relationship between communicator social style
and administrative position. Research question eight was
analyzed by an ANOVA to compare world view with one's
administrative classification. Finally, question nine
involved an analysis of variance to determine what effect
university position has on one's versatility. Where
appropriate, t-tests were used as post hoc analysis to tease
out specific differences.
Additional data collected allowed further analysis.
Various demographic variables were compared with a subject's
social style and world view. Such analysis included; length
of service, level of position, age, gender, and versatility.
Both main effects and interactions were examined. Results
appear below in Chapter IV. A discussion of these results
and attempts to explain them appear in Chapter V.

CHAPTER IV
RESULTS
This chapter reports the findings of the data analysis
relative to the research questions presented in Chapter I.
These results are divided as they pertain to both the
questions and the variables studied. As stated above, most
analysis was conducted through the use of both multiple
sample chi-scjuare and analysis of variance; one-way and two-
way. The use of multiple sample contingency analysis is
justified in the data representing variables that are
categorical in nature. That is, the subjects placed
themselves into various groupings that were then analyzed.
Examination of data revealed several factoral designs
that held cells under five members. Such statistical
analysis was justified in that the evidence suggests that
the chi-scjuare test requires an expected frequency of at
least five in each cell (Emmert and Barker,1989). Stempel
and Westley (1981) state that in general,
"for a two-by-two contingency table (two rows and two columns), the total number of cases should be greater than forty, and all expected cell frecjuencies should be five or more. In a larger table (more than two rows and/or two columns), chi square may be used if fewer than 20 percent of the cells have an expected frecjuency of less than five and if no cell has an expected frecjuency of less than one. "(p. 66-67)
49

50
Tables seen below indicate that no situation existed
which included an expected cell frequency of less than one.
Stempel (1981) is supported by Hays (1973) in that sample
size may override the generally accepted recjuirement of five
per cell. Data used reveals the smallest sample size of 135
for the current research effort. Many used the complete 301
cases in the data set.
Comparison of Findings to Research Questions
The primary effort of the current research revolved
around the attempt to answer nine research cjuestions.
Analysis below indicates that statistical significance was
found relative to all nine questions. Specifically, there
seems to be a significant relationship between all dependent
and independent variables.
Ql: Will there be a significant difference between the
communicator social styles of administrators and
faculty members?
Analysis of data with a four by two factoral design reveals
a significant difference between the communicator social
styles of administrators and faculty members in general
included in this study (chi square = 31.3511, df = 3, p <
.00001, Table 1). Administrators tend to be either
Analyticals or Drivers while faculty tend to be either
Amiables or Expressives. This finding is further heightened
by the percentage of Expressive administrators being the

Table 1
Contingency Table Comparing Communicator Social Style and University Position
51
Social Style Classification
Administration Faculty
Total
Analytical
Driver
Expressive
Amiable
42
50
12
31
33
33
54
46
75
83
66
77
Total 135 166 301
Chi square = 31.3511 DF = 3 p < .00001

52
lowest while the percentage of Expressive faculty
being the highest. Analysis in the current study might
suggest that further research should consider use of an
hypothesis in an attempt to replicate the findings. Figure
4 provides a visual comparison of the types of communicator
social style by administrators and faculty.
Q2: Is there a significant relationship between the
social style and world view of administrators and
faculty working in the university setting?
A two-way analysis of variance reveals a significant
interaction effect between university classification
(administrator or faculty) with both communicator social
style and world view (F = 4.18475, df = 3, p < .0064, Table
2) . However, individually, communicator social style was
not found to be significantly related to world view when
university position was not taken into account (F = .6634,
df = 3, p < .5751). Table 2 also indicates the high
relationship (F = 53.05, df = 1, p < .00001) between
classification and world view such that faculty members
display world views significantly less deterministic than
those of administrators (faculty mean =72.4398,
administrators mean = 65.6222). This finding was in support
of the 1984 Garmon study which found administrator mean
scores to equal 64.2 and faculty scores to equal 67.0 (Table
3).

53
40 n
35-;
30-:
25-
%20
10-
5
0-
WM.--. w?3
I' ^^r
Analytical Driver Expressive Amiable
[vl] Administration
M Faculty
Table 4
Contingency Table Comparing Communicator Social Style and Gender

54
CM
Q)
XI Pi
EH
4J
-d (U
t i - i '
> TJ •O
•W
CU
H (0
•H M (0
CO
(0
CO
tw (0
U
V
a.
U-
w
Q
CO
CO
CD O
13 O
CO
LO T- -tt r o CD U5 O O
• o o o
CD lO CX3 CD q T-CD •^* -"^
lO
•* OJ
K CO
h-00
I < h -C3 CJ
CVJ 05
"^ CO CVJ
-^ T —
CD LO
CO CO CO o Oi o CVJ CO
CO CO
CD N
CO lO h>
CO CO
CD r ^ CD r ^
w CO
CD CD
CD O O
r r O) CM
Nf o N
CO •<d-• ^
CD 1 —
i n 00 r o CVJ
to *—• c CD
• o c o CL in (D
DC o 0)
E 13
X5 tr ca CO c CO CD
cn o CD' CD
CD
CD
CVJ T —
CD C35 CD
CVJ CD LO* CD 72
.
c _a) g 3 fa CO . 9 l o '55 • o < -o
c
O =3 CO TJ _
to iS _ — ^ a> o
CO O £ DC H CO 2,
O CD
ubj
CO
.. CD
55 "cO
oci
CO
CO g *-. CO c <
L .
'%^ a
CD
> 'to
pres
X 111
CD J3
mia
<
, , c
CO
'(O
las
o
c o CO ).. «
* c IjLU
•o <
>^
cul
CO U-
k_ X - >_
.. c ( D O . .
• ^ CO o CO o . ^ _ h= o CO t o CO
oci
las
Iter
C O O i
T - CD O O o o
CD O O T- O O V V V CLCLC3.
CO -I- O
q ^t CM II II II

55
Table 3
Comparison of Personal Report of World View Means of Administrators and Faculty Between
Cardot and Garmon Studies
Study Means
Administration Faculty
Cardot 65.622 72.440
Garmon 65.200 67.000

56
Q3: Will there be a significant relationship between
gender and communicator social style?
Four by two factorial analysis reveals that the communicator
social style in the university setting is highly correlated
with gender (chi scjuare = 40.3840, df = 3, p < .00001 Table
4). Data indicates that the social style of Driver is the
lowest frecjuency for females while it was the highest
frecjuency for males. The social style of Expressive is the
highest frecjuency for females and the lowest for males. In
fact, the frecjuency rank order of social styles for males is
reversed for that of females. Figure 5 concludes that males
tend to fall into the social styles of either Driver or
Analytical while females tend to be either Expressive or
Amiable.
Q4: Will there be no relationship between education
level and communicator social style?
A four by four factorial analysis was reduced to a two by
four analysis as indicated in Table 5. Data reveals that
within the sample, no individual held either a Bachelor's or
specialist's degree. All 301 respondents held either a
Master's degree or Doctorate. The current research effort
did find a significant difference between the degree held
and social style in one category; Expressive (chi square =
8.4621, df = 3, p < .0374). Holding a Master's degree is
more likely for an Expressive while the fewest Expressives

58
%
45 n
40-^
35^
30^
25-:
20
15
10^
5
0
E
f^%>.
•.•*x¥?,-S;
i:¥i-?>'.
Analytical Driver Expressive Amiable
W[ Female
H Male
Figure 5
Bar Graph Comparing Percentages of Communicator Soc ia l S t y l e by Gender

59
Table 5
Contingency Table Comparing Communicator Social Style and Highest Degree Earned
Social Style Degree
Master's
13
16
24
18
Doctorate
62
67
42
59
Tota
75
83
66
77
Analytical
Driver
Expressive
Amiable
Total 71 230 301
Chi square = 8.46216 DF = 3 p < .0374

60
hold Doctorates. One factor that could affect this finding
is the number of university personnel with only a Master's
level education. However, the current research effort is
unable to establish such a conclusion.
Q5: Is there a significant relationship between gender
and world view?
Analysis of variance reveals a significant difference
between the levels of world view for males and females in
this study (F = 5.58248, df = 1, p < ,0188, Table 6).
Females display world views that are less deterministic than
those of males (female mean = 71,0645, male mean = 68,6298).
As seen below in the discussion chapter, two factors could
account for such a difference. First is the relatively low
N size for females (93 versus 208). The second is the
relatively low number of female administrators. As
established above, administrators in general are more
deterministic than faculty members.
Q6: Will there be a significant relationship between
faculty position and world view?
Analysis of variance identifies significant differences in
world views among faculty members in the current study
according to the academic area in which they teach (F =
6.58219, df = 3, p < .0003, Table 7). Scheffe's test for
significance indicates that statistical differences exist
between business and education faculty and between
mathematics and education faculty. The most deterministic

61
VO
Q) r-{
Xi (0 EH
o S Q)
•M > T) M r-( (U M T i 0 C S tl)
U tH 0 > i
XI cu o w C -P (0 c:
•H 0) k Tl (0 c > 0
a (W V) 0 o
« Ul
•H m > i H (0 C <
V CL
u.
CO
LL Q
CO CO
CD O
O CO
00 CO
to CM CO
CO q c> CO CO
CVJ 00 CD
•r- cn O cn o CM CO
CD - ^ 1 -
°^. ^ iO O O CO 00 - ^ r^ CO o o
CM CM
Ui CL 3 o
C CD CD 5
CQ
CO CL 3 O
Oi
c Ic *-• ^
CO
o
CO
c CD
• r - f tz o CL to CD
DC
c CO CD
2
CO
a5
E 3
T3 C CO tn c CO CD
CD N
in t
z
CD TJ c CD (D
CD CO
E CD Q-
CO CJJ
00 o CM
UO CD O
O CO CD 00 CD
CO

62
rH Xi (0 B
o
• > U
(H T!
" O 0) •<
!rt -p
<W'2
a
(0
c
V C 2 .
Li.
CO
CO CO
CD
o 3 o
CO
CO o o o
CM 00 in cd
CM
co T-co
(D N
CO
Z
CJJ in
CD
CO r CO T
•"t 1 —
o q CD CM LO T —
o CO
CJ • *
CD CM
CO CL 3 O
CJ)
c tD CD
5 CQ
to Q. 3 O 1 . .
c 'sz '.-' ^
CO .*—• o
00
"c tD
TJ c o C L CO CD
DC
to CD
E 3
z TJ C CO
to c CO CD
c CO OJ
o C D N T CM
CM UO
03 O l O
C D CVJ
CD o CM - 1 -
CD OJ CD
CO CD
< o E tD
TJ CO O <
o CO to CD c
'co 3
DO
SZ .55 "5) c
LU
CO
E CD SZ •*-* CO 2
o •Jo o 3
TJ m
. 3 Zl CO 3 "^ O C CO o
CO
o 3
CO TJ O LU 3
TJ LU TJ
c CO (J) CO tD c
'to 3
c CD CD
5
TJ O c o CO o ,« o
V CL CO
E tD sz -^
| S ccp tD ' tD II
5 -CD t D
jQ jQ
'x 'x CD CD
to to . CD CD I ^ O O LO
c e o 1 1 V =5 =a f^ c c
S S^:
CO CO II to .Q I -

63
faculty in the current sample are education teachers with
mean scores of 69.0962. The world views of English
professors hold a mean of 71.2609. Significantly less
deterministic world views are held by business and
mathematics teachers with means of 75,5000 and 76.2593
respectively for respondents.
Q7: Is there a relationship in the communicator social
styles of those holding varying administrative
positions?
Analysis utilizing a three by four design reveals that a
significant difference exists between the communicator
social style and the administrative position held (chi
square = 71.7133, df = 6, p < .00001, Table 8). In
examining Table 8, the reader is reminded of the statistical
justification for the use of contingency table analysis for
samples with cells holding few or no subjects. In light of
the N size of 136, the findings become even more
significant. Of the 21 respondents holding the office of
President, all fell into the Driver category- Respondents
holding positions as Vice President for Academic Affairs
fell only into the Analytical or Driver categories. The
current study found Expressives and Amiables only in
positions of Dean or Department Head.
Q8: Is there a relationship between administrative
position and world view?

Table 8
Contingency Table Comparing Communicator Social Style and Administrative Position
64
Social Style Administrative Position Total
sident
0
21
0
0
Vice President
19
9
0
0
Dean
23
20
13
31
42
50
13
31
Analytical Driver Expressive Amiable
Total 21 28 87 136
Chi square = 71.7133 DF=6 p < .00001

65
Analysis caf variance reveals a significant relationship
between the level of determinism and the administrative
position held (F = 6.70649, df = 2, p < .0017, Table 9).
Mean scores show that for the respondents in the current
study, vice presidents express feelings of less control than
presidents or deans. Greatest differences are shown between
vice presidents (mean ecjuals 62.6071) and deans (mean ecjuals
66.8966). Mean scores for presidents fell between the other
positions and ecjual 64.8095. Analysis indicates the
relative position of the current sample supports the earlier
findings of Garmon (1984). Current data, however, was found
to be significantly different, whereas, the Garmon study
failed to establish significance.
Q9: Is there a significant relationship between level
of Versatility and university position?
Data subjected to an analysis of variance established a
highly significant difference in the level of perceived
versatility between administrators and faculty (F = 56.4664,
df = 1, p < .00001, Table 10). As stated in Chapter III,
the hypothetical mean of 16.0 determines the level of
versatility as being either high or low. Table 10 concludes
that administrators, with a mean of 17.5704, perceive
themselves as more versatile than their faculty
counterparts, with a mean of 14.1807. The literature review
in Chapter II would indicate that for those responding to
the current study, administrators should be more adaptable.

6 6
cn
0) r-H XI 10 EH
W •P C Q) T! C O 04 m Q) « tw
T> Q)
• * (0
T3
to
IH
o w 0) > 1 H (0
c
V CL
LL
CO
a
o o
LO CD O
CD
CVJ O LO LO -^ 6 O CO Cvl
CO
CO
CM CO LO CO CO
• ^ CD CO
o q q t3> i n Lf) O LO CD •<* o • *
CD N
CO T- 00 r -CM CM 00
to c CD
TJ c o CL Ui CD
DC o to CD
JZl
E 3
z TJ C CO to c CO tD
n l ro O h- h-T- O Oi q q q - ^ CvJ CD CD CD CD
CD
o 3 O
CO
to CL 3 o l-m
a> c CD CD
5 ..-• CD CQ
CO Q . 3 o CJ)
c 'sz .*-» 5
to o
I -
c o
V-* 'tn o 0. CD _>
inis
e •o <
*-• c
ide
res
Q.
4 - *
c tD TJ 'V) CD
1
ice
>
TJ CO CD X +-» c CD E n CO CL CD Q
o c CO tD Q
TJ CO CD X
CD E •c to Q . tD Q O
c CO CD Q TJ c: CO
• . - • c CD •g "to 03
»~ c b o 'S° > q O V
W CL
O ;•!=: cjj to CD
^ c CD CD $
"S X I •*-« to "x CD to CD
1 — 1
11 *-•
OCO c tD
s * •—
TJ ..-. C CO o
» • - •
T —
q V CL
CM I f ^
"E CM cn CO CO
c> II
L -

67
V
o. o o o o
Xi (0
E H
m +J d tu Ti c o m
M-l O
c > i o 4 J - H •H +J rH -rH •rH Ul +J o (0 ft w M >i > T H
> C
o tu o .. C 13 (0
•H >i )H X I (0
> 14-4 O
in •H w > 1 H (0
c
Ll_
CO
CO CO
tD o 3 o
CO
CD CD r t iD in
CO
in in CO
tD N
CO
i n CO
CD CD
in
in
LL Q
. p - CJ CD CM
O O CO
CO
Lf) in 00
CD
q CJJ CM LO •<;}•
CD
q in oo CO in
CO CL 3 o k .
O)
c= tD <D ^ "S CQ
CO CL 3 O 1 . . CJ)
c IE
1 CO
o
i2 "c CD TJ cr o CL to CD
DC o CO t . CD
JZl
E 3 Z TJ cr CO to cr to CD
C CO CD
o LO
o 00
c o it!
in o a. >> • - »
'in k .
CD > "c =D
tor
CO
*-* to "c
• 'E TJ <
•= >» 3 O CO
L I .
O o o q V C3L
o

68
changeable, flexible, and more unpredictable than faculty
members. Greater rigidity, and therefore, more predictable
behavior, in general would be expected from the faculty.
Summary
This chapter is designed to present the results of the
current study. Data analysis revealed several interesting
findings:
(1) The position held in the college or university
setting appears to be a predictor of an individual•s
communicator social style. It was found that administrators
tend to be primarily Analyticals or Drivers while faculty
tend to be primarily Expressives or Amiables.
(2) A significant interaction exists between
communicator social style and classification with world
view. Administrators appear to be significantly more
fatalistic than faculty members. While social style
fatalism is not statistically different, an interaction
effect was found with position held.
(3) Gender appears to be a predictor of coxomunicator
social style within the sample analyzed. Forty-one percent
of the females as compared to thirteen percent of the males
were found to be Expressives. Thirty-six percent of the
males were identified as Drivers, while only ten percent of
the females.

69
(4) A small but significant relationship between
communicator social style and education level was found in
the subjects of the current study. An individual who is
either a Driver or an Analytical is more likely to hold a
doctorate while an Expressive or an Amiable is more likely
to hold a master's degree. The most notable category is
that of Expressive who, by far, hold the most master's
degrees and the fewest doctorates.
(5) Gender was found to be significantly related to
level of determinism. Females indicated a statistically
lower level of fatalism as compared to males. A correlation
(negative due to coding) was obtained such that r = -0.135
and p < 0.019.
(6) Faculty position was found to be associated with
world view. Mathematics and business faculty are less
deterministic than english and education faculty. Education
personnel were found to be the most fatalistic of the
faculty who responded (r = -0.214, p < 0.0057).
(7) Administrative position appears to be highly
related to communicator social style. Data indicates that
for those who responded, only Drivers held positions of
president and only Analyticals and Drivers held positions of
vice-president. Deans appeared across the social style
categories, the most being Amiables and the least being
Expressives.

70
(8) World view appears to be a significant factor in
the position of an individual in administration. The most
fatalistic position is that of vice-president followed by
president with deans being the least fatalistic.
Correlation obtained was .212 with p < .013.
(9) Level of versatility was found to be correlated to
classification. Administrators were the most versatile with
faculty the least versatile. The correlation obtained was
-.40 with p < .00001.
The following chapter is devoted to a discussion of the
results.

CHAPTER V
DISCUSSION AND CONCLUSIONS
Discussion
The previous chapter dealt with a description of the
results. This chapter focuses on the implications and
conclusions of the results based upon a discussion of the
research cjuestions presented in previous chapters.
Research Question 1
The first research question sought to determine the
relationship, if any, between the communicator social styles
of administrators and faculty members at colleges and
universities in the South. As the results indicate,
administrators tend to be either Analyticals or Drivers
whiles faculty members tend to be either Expressives or
Amiables. Findings should not be surprising when the
responsibilities of administrators are taken into
consideration. Analyticals are usually organized, thorough,
systematic, and precise while Drivers are typically
competitive, pragmatic, objective, and results oriented.
All characteristics are seen as necessary to coordinate the
varied activities of an organization as large as a
university.
71

72
Faculty, on the other hand, tend to be either
Expressives or Amiables. Expressives combine a high degree
of both assertiveness and responsiveness. The combination
of a willingness to take risks and a willingness to use
unusual or novel problem-solving techniques, results in an
effective personality to conduct research and to teach
students.
Amiables are seen as the easygoing and trusting members
of the organization. They are seen as highly empathetic and
can encourage colleagues and students to high levels of
performance. Again, characteristics of effective
professors.
The reader should remember that, traditionally,
administrators are chosen from within the faculty and move
upward as long as they remain with the organization. The
logical conclusion is that those individuals who are either
Analytical or Driver tend to be the most likely candidates
for positions in administration. At least the current study
suggests that such has been the trend. This is particularly
apparent within the positions of president (all were
Drivers) and vice-president (all were Drivers or
Analyticals).
This researcher would caution the reader in that the
current study marks the first attempt to determine
characteristics of administrators beyond the Garmon study of

73
1984. Conclusions reached should be viewed as preliminary
and not conclusive.
Research Question 2
The second research cjuestion sought an interaction
effect between communicator social styles and world view
with university position. The attempt was made to replicate
part of the Garmon world view study and to add the
communication predisposition of social style. It is not
surprising to find no difference in the total sample with
regard to social style and world view. Without the
separation of position, all respondents should follow Bolton
and Bolton's (1984) assertion that the population is evenly
divided among the four social styles and that their world
views would be more evenly distributed throughout both
administration and faculty by gender and age (Garmon, 1984).
It is significant to note, however, that the current
work does support and further world view research with
regard to academic setting. Administrators are, indeed,
significantly more deterministic than are faculty members.
It would seem that faculty tends to view their environment
through the perception of greater freedom of choice. They
would appear to accept that they have the ability to affect
their own future through the use of their own capabilities.
The opposite appears true with regard to academic
administrators. While attempting to coordinate the

74
activities of many diverse groups and individuals while
fulfilling the expectations and mandates of superiors,
subordinates, faculty members, students, governing agencies,
etc., administrators are more likely to view their options
as having fewer choices than would others. Such limits lead
to higher levels of fatalism and higher levels of
determinism.
It is significant to note at this point that the
current study also adds to the body of supportive literature
validating the Personal Report of World View scale. Dodd
and Garmon (1987) reported a mean score of 70.0 with a
standard deviation of 10.0. The current effort reports an
overall mean of 69.38 with a standard deviation of 8.324.
Statistically, the only difference in the current data pool
and the several thousand subjects used by Dodd and Garmon
falls at the limit of the Type II and Type III communication
fatalists. The current effort would identify the Type III
fatalist (low determinism) as beginning with a score of 78.
Dodd and Garmon would require a score of 79. All other
levels between the research remain the same.
Research Question 3
An examination of the data relative to cjuestion three
sought to identify a relationship between gender and social
styles. Such a question attempted to either validate the
Bolton and Bolton (1984) claim that gender is unimportant

75
with regard to social style (the population is evenly
distributed, period), or to establish that occupation could
be an overriding factor. Analysis would support the idea
that something, in this case working in higher education,
does indeed influence the communicator social styles of
males and females. The N size of 301 is divided into 93
females and 208 males. Analysis (chi scjuare) accounted for
the differing n-sizes and found that by category, gender
seems to make a difference. Specifically, there were 74
males and only 9 females falling into the Driver style.
Analysis by percentage reveals 3 6 percent and 10 percent,
respectively. Interestingly, the number of male and female
faculty responding to the study was even at 104 each.
Administration, as expected, was two to one favoring males
(62 versus 31).
This researcher would hesitate to suggest a model
predicting characteristics of males and females in the
university setting. Data would imply, however, that if a
female is either an Expressive or an Amiable, her chances of
employment are higher than if an Analytical of Driver. The
first two categories accounted for 71 percent of the
females. Males, on the other hand, are more likely to be
Analyticals or Drivers. These two styles accounted for 73
percent of the male subjects.
Speculation is risky as to the cause of this difference
between the total population being evenly distributed and

76
such a skewing of the sample tested. One possibility is
that females who are Drivers or Analyticals tend to feel
more satisfaction in the business community than in higher
education. This, coupled with the traditional president and
vice president positions being held by males, could account
for the skewedness. Current data analysis might support
such a conclusion based upon the inclusion of only one
female president and one vice president. In terms of
changing traditions, it is encouraging to see that 29
females were deans or department heads as compared with 58
males. Analysis of gender differences in administrative
position found that chi square equal 15.25, degrees of
freedom etjual 2, and probability ecjual 0.0005.
Research Question 4
The survey used included choices of bachelor's,
master's, specialist's, and doctorate for indications of
education level for respondents. As identified above,
subjects fell only into the categories of master's or
doctorate. The fourth cjuestion sought to relate education
to communicator social style, at least in the education
setting. The findings surprised this researcher. Analysis
which takes into account the low n-size for master's (71) as
compared to the high number of doctorates (230) concludes
that a difference does truly exist for the current sample.
Expressives appear to have more master's degrees and fewer

77
doctorates than any other category. While not statistically
significant, Amiables are the next fewest doctorate holders
as a group.
In reviewing the characteristics of each group, there
are no clear cut reasons this researcher can identify for
such a finding. The one factor that is consistent between
the two styles is that both are low in responsiveness.
General tendencies of such a group would include being more
reserved, controlled, or guarded in the expression of
emotions or feelings. It should be recalled that these
tendencies are neither positive or negative except when
viewed relative to the outcome in a specific situation. If
one were to view the outcome as completing the doctorate and
working in higher education, then the conclusion might be
that such a level of low responsiveness is negative or
undesirable. Far more research should be done before that
conclusion could be comfortably accepted.
Research Question 5
The attempt to determine the relationship, if any,
between gender and world view was carried out through
research cjuestion five. Females tested responded with a
mean score of 71.0645. Males responded with a score of
68.6298. Analysis of variance results were confirmed by
correlation such that r = -0.135. The negative resulted
from coding procedures. While the correlation level is low.

78
the probability level (.0188) is high enough to conclude
that a difference does exist within the education setting
for this sample. The reader should remember that the
analysis included all subjects and is, therefore, being
affected to some extent by the number of male administrators
that have been shown above to be more fatalistic than
faculty. The findings should not be discounted out of hand,
however, due to the number of female faculty members being
over three times as large as the number of female
administrators.
Taking the total number of subjects within both major
classifications of position into account, this researcher
feels justified in concluding that females experience
significantly less fatalism than do their male counterparts
in higher education.
Research Question 6
The desire to further the literature extant on the
world view of faculty in higher education lead to the use of
question six in the current study- Garmon's (1984) results
came close to the justification for use of an hypothesis
rather than a research cjuestion. Her work was exploratory,
however, and was not conclusive. In fact, while the current
effort supports her partially, there are major differences.
Garmon found that English faculty were the least
deterministic while education faculty were the most

79
deterministic. This researcher found that education faculty
were indeed the most fatalistic. Mathematics faculty were
found to be the least fatalistic, however, followed by
business, who were then followed by English.
Garmon's (1984) conclusion revolved around a personal
perception that English represents the most basic ideals of
a liberal arts education and therefore should employ those
experiencing the perception of being able to exert the most
control over their environments. While this might have been
true several years ago, this researcher does not accept the
same view, especially in light of the current results. The
past few years have seen a tremendous national search for
tjualified business and mathematics professors. Many have
left academia for higher paying positions in private
industry. The result may have been that those who remain in
higher education have developed the perception that they
exercise greater control over their future than do those in
other disciplines. If such is the case, the shift of world
view within the academic setting can be expected and even
predicated in the future as other disciplines begin to
experience shortages in the next few decades.
The reader is cautioned to remember that the course
work of some areas is highly controlled by forces outside
the institution. The study used accounting faculty to
represent the business area. The accrediting bodies for
accounting tend to be far more restrictive than those in

80
marketing, for example. This tendency holds for all but
approximately one third of the business schools. The same
is even more true for the curricula in education. The
current effort would suggest that the forces controlling the
student's course work do not seem to affect the faculty's
perception of personal control.
Research Question 7
The attempt to isolate specific characteristics of any
group is difficult. The thrust of the current effort was to
do just that. If differences in the communicator social
style of those occupying administrative positions does
exist, then the desire to predict potential leaders might
tend to over emphasize what could be a simplistic answer to
a complex problem. The reader is cautioned to keep this in
mind as the results are discussed.
Analysis revealed that of the thirty-five presidents
randomly selected to receive surveys, all twenty-one
respondents fell into the Driver category. The twenty-eight
vice-presidents that responded fell into either the Driver
(nine) or the Analytical (nineteen) categories. By
implication, the common factor in both styles is the low
level of responsiveness. Both groups are able to keep their
emotions well under control and appear to be best able to
function in an organizational structure that is task and
product oriented. The Driver combines low responsiveness

81
with high assertiveness. It appears that such a combination
is best suited for the presidency and well suited for the
chief academic officer position
The position of dean or department head recjuires an
individual who is capable of bridging the faculty with the
administration. Their job requires significant contact with
both. Data would indicate that while Analyticals (23) and
Drivers (20) are successful in attaining the position, the
Amiable social style profile appears to be the most
successful (31). The least successful social style in
administration would seem to be the Expressive. Expressives
are found only at the level of dean or department head, and
in low numbers (13).
Recall that Amiables are perceived to be highly
empathetic and understanding. Their greatest skill is in
relationship building. Such characteristics could account
for the high number holding the position. Expressives, on r
the other hand, may be viewed as being too willing to take
risks or too willing to employ novel or unusual problem
solving technicjues. Tendencies such as these may be
interpreted as not fitting into the expected methods of
people management by administrators who make the decisions
of who will fill the positions of dean and department head.

82
Research Question 8
The attempt to replicate previous work relating world
view to administrative position motivated the eighth
cjuestion. Garmon (1984) found no significant relationship
between the two. She did, however, find differences such
that vice-presidents were the most deterministic followed by
presidents and then deans and department heads. The lack of
significance lead her to decline to speculate on the order
that resulted.
The current effort, however, resulted in significance
statistically. The order was in support of the Garmon
study. Vice-presidents are the most fatalistic followed by
presidents and deans or department heads. The most logical
explanation seems to be that deans and department heads are
the closest to the faculty and function under the halo of
their self determination. These administrators may also be
holding their first or second position removed from the
classroom.
Presidents are the visionaries of the organization.
They must project images of success for the institution in
the public relations work they engage in. The success is,
however, tempered by the realities of the need to meet
budgets and expectations of governing boards. The
environment they function within may give them a greater
perception of freedom than others in administration, but the
need for restraint must always be on their minds and.

83
Perhaps the most difficult job in the university falls
upon the vice-president of academics. The position must
balance the demands of deans (forwarded on by faculty and
department heads) and presidents (forwarded on by governing
boards, donors, and public opinion). The task is seen,
perhaps, as having very few options for the day-to-day
challenges that confront them. The result being a tendency
to be more fatalistic.
Research Question 9
The final cjuestion utilized by the current effort
revolves around the attempt to establish a relationship
between university position and the willingness to flex into
the communicator social style of the person being interacted
with. The subscale of Versatility indicates such a
willingness.
Faculty seem to be more comfortable with their
rigidity. There appears to be more room for such a position
within the academic arm of the educational organization. In
the attempt to maintain "academic freedom" faculty members
seem to possess both feelings of personal control and
feelings of correctness. To the extent that low versatility
can be conceptually analogous to a somewhat dogmatic
attitude, faculty would appear to be less willing to
consider alternative methods of interacting with others.

84
Administrators, on the other hand, appear to be more
eager to adjust to the situation communicatively. As Table
10 indicates, the correlation is quite strong (r = -.40).
The finding should be seriously considered due to the
differences in work environments, student contact,
perceptions of organizational roles, and the general lack of
day-to-day interactions with faculty.
The high correlation resulted not from the discrepancy
between the means, but rather from the narrow range
expressed within each group. In fact, both groups cluster
quite close to the hypothetical mean of 16.0. The result
was that neither group should be considered more or less
dogmatic than the other at a functional level. The range
was shown to be narrow enough that statistical differences
exist.
Bolton and Bolton (1984) conclude that high versatility
would enable administrators to be more effective in
interacting with others. To the extent that such an
interaction study has not been conducted, no general
conclusion is possible at this time. In fact, the call for
further work cries out to be made. The ability to adjust to
the communication setting tends to facilitate one's
understanding of the intended message. If such
understanding occurs, then further communication is
possible. Without such understanding, interaction tends to
be discontinued.
1

85
Conclusions
The purpose of the present study was to link the two
previously separated constructs of communicator social style
and world view through an analysis of how they relate to
university administrators and faculty members. The attempt
was to better understand the environment of higher education
through a better understanding of the personnel responsible
for the education of the nation's adults.
The past two decades have seen a dramatic shift in the
availability of resources and students to fuel the existing
institutions. To provide the best possible service to the
society, the community, and the students, personnel should
attempt to work together better toward the common mission of
the institution.
This effort represents one of the few which seeks to
identify differences in personalities of those working in
various positions in higher education. These differences
include not only communication predispositions, but also,
basic philosophical differences. Such an attempt makes the
effort worthy of consideration.
Results of this study indicate that differences in the
assertiveness and responsiveness of administrators and
faculty members are real. They exist, in fact, to the
extent that interaction between the two can be quite
predictable. The higher one moves into administrative
positions, the more likely he or she is to be highly

86
organized, thorough, systematic, and results or task
oriented. Faculty are more likely to be the risk takers,
problem solvers, and empathetic catalysts for both
colleagues and students. It would appear, although beyond
the scope of the current work, that the differences in the
day-to-day interactions of individuals relative to their
duties, tends to retjuire such a diverse set of
characteristics, that it predisposes persons to specific
institutional positions.
An additional finding of the study that is significant
relates to the support of the Garmon (1984) work
establishing differences in the outlook on the world between
administrators and faculty. The trend in variations was
supported and even the exact position relative to
administrative position was found to be the same. Only the
rank order in academic area was found to be somewhat
different. All major findings were substantiated. Simply
knowing that faculty perceive greater control over their own
lives, work, employment, etc., than do administrators should
improve the coordination between the two groups. Individual
reactions could be better explained with such knowledge.
The final finding that warrants conclusionary remarks
involves the versatility of respondents. The specific
communicator social style is not as significant as the
willingness to flex into the style of others. Results
indicate that administrators are more willing to adapt to

87
those they are interacting with than are faculty. The
result should be greater understanding on the part of
administrators. Such a finding could mean that even though
faculty perceive a greater exercise of control, they are
less willing to tolerate disagreements and are less willing
to recognize differences in the interaction styles of
others. Such resistance would lead to frustrations due to a
lack of understanding why they are unable to successfully
interact with others.
This research effort presents no claim for identifying
the differences between administrators and faculty such that
position can be easily predicted. It is hoped that the work
can provide a significant beginning point to enable the
student of higher education with enough information to go
beyond the questioning stage and begin to hypothesize
relationships. It is only through continued searching that
a clearer understanding of the basic constructs that guide
the interactions of people will be determined.
In terms of suggestions for further study, the major
thrust should focus on both the social styles of individuals
in higher education and their levels of determinism. The
world view scale is undergoing a revision. The authors are
seeking to refine the construct as it relates to dimensions
of communication. Once the scale is perfected, its
application relative to communicator social style should be
more readily accepted.

88
The Communicator Social Style Scale needs to be applied
to the educational setting in further research efforts. Its
developers maintain that the general population is evenly
split among the four styles. This study suggests that
university position tends to mediate the styles. If true,
much could be learned from further research.
This researcher has enjoyed the efforts expressed in
this study. It is his hope that the student of education
and communication has gained from the work presented. It is
also his desire to continue this effort to ferret out true
differences between university positions. He looks forward
to individual effort as well as benefiting from the work of
others who are also interested in serving the society and
world in which he lives.

BIBLIOGRAPHY
Baird, J. E. (1977). The dynamics of organizational communication. New York: Harper & Row Publishers.
Bell, M. A. (1974). The effects of substantive and affective conflict in problem-solving groups. Speech Monographs, 41, 12-23.
Berger, C. R. (1985) . Social power and interpersonal communication. In M. Knapp & G. Miller (Eds.), Handbook of interpersonal communication (pp. 439-499). New York: Sage.
Blake, R. & Mouton, J. (1962). The intergroup dynamics of win-lose conflict and problem-solving collaboration in union-management relations. In M. Sherif (Ed.), Intergroup Relations and Leadership (pp. 123-148). New York: John Wiley.
Blake, R. & Mouton, J. (1964). The managerial grid. Houston, Texas: Gulf.
Blake, R. & Mouton, J. (1978). Managerial effectiveness. New York: McGraw-Hill.
Bolton, R. & Bolton, D. G. (1984). Social style management style. New York: American Management Association.
Burgess, W., Lashbrook, W. B., Wenburg, J. R., Larsen, D. & Lashbrook, V- J. (1981). An experimental study of the effects of training in managing interpersonal relationships. Training and Development in Australia (pp. 14-16). Eden Prairie, Minnesota: Wilson Learning Corporation.
Cameron, K. S. (1981). Domains of organizational effectiveness in colleges and universities. Academy of Management Journal, 24, 25-47.
Cohen, M. D. & March, J. G. (1974). Leadership and ambiguity. New York: McGraw Hill.
Emmert, P- & Barker, L. L. (1989). Measurement of communication behavior. New York: Longman, Inc.
89

90
Darling, J. R. (1985). Managing up in academe: The role of social style. Texas Tech Journal of Education. 12.(2), 79-92.
Dodd, C. H. (1987). Dynamics of intercultural communication. (2nd ed.). Dubucjue, Iowa: William C. Brown.
Dodd, C. H. (1991). Dynamics of intercultural communication. (3rd ed.). Dubucjue, Iowa: William C. Brown.
Dodd, C. H. St Garmon, C. W. (1987a, November) . The measurement of personal report of world view as a cognitive communication variable. Paper presented to the Speech Communication Association, Boston, Massachusetts.
Druker, P. (1973). Management: tasks, responsibilities, practices. New York: Harper and Row.
Garmon, C. W. (1984). A comparison of world views among faculty and administration in institutions of higher education. Unpublished doctoral dissertation. Graduate College, Vanderbilt University.
Giles, H. & Street, R. (1985). Communicator characteristics and behavior. In M. Knapp & G. Miller (Eds.), Handbook of interpersonal communication (pp. 205-262). New York: Sage.
Goldhaber, G. M. (1990). Organizational communication. (5th ed.). Dubucjue, Iowa: William C. Brown.
Hample, D. (1984). On the use of self-reports. Journal of the American Forensic Association, 20. 140-153.
Hays, W. L. (1973). Statistics for the social sciences (2nd ed.). New York: Holt, Rinehart, and Winston, Inc.
Kluckhohn, F. & Strodtbeck, F. (1961). Variations in value orientation. In J. P. Robinson & P. R. Shaver (Eds.), Measures of social psychological attitudes (pp. 287-289). Ann Arbor, Michigan: Institute for Social Research.
Lashbrook, V. J., Lashbrook, W. B. & Buchholz, S.W. (1977). The statistical adeguacy of the social style profile. Eden Prairie, MN: Wilson Learning Corporation.

91
Lashbrook, V. J., Lashbrook, W. B., Larsen, D. C. & Buchholz, S. W. (1978, May). An empirical investigation of the relationship between perceived social style and interpersonal conflict in an organizational setting. Paper presented to the International Communication Association, Chicago.
Lashbrook, W. B., Lashbrook, V. J., Parsley, M. L. & Wenburg, J. R. (1977). An empirical examination of versatility as a consequence of perceived social style. Paper presented to the Western Speech Communication Association, San Francisco, California.
McCroskey, J. C. (1982). Oral communication apprehension: A reconceptualization. In M. Burgoon (Ed.), Communication Yearbook 6 (pp. 247-273). Beverly Hills, California: Sage.
Mehrabian, A. (1971). Silent messages. Belmont, California: Wadsworth.
Merrill, D. W. & Reid, H. R. (1981). Personal styles and effective performance. Radnor, Penn.: Chilton.
Moran, E. T. & Volkwein, J. F. (1987). Organizational climate of institutions of higher education: Construct determination and relationship to organizational criteria. Paper presented to the Association for the Study of Higher Education, San Diego.
Moran, E. T. & Volkwein, J. F. (1988). Examining organizational climate in institutions of higher education. Research in Higher Education. 28. 367-382.
Mowday, R. T. (1978). The exercise of upward influence in organizations. Administrative Science Quarterly, 23, 137-156.
Nie, N. C , Hull, C. H. Jenkins, J. G., Steinbrenner, K. & Brent, D. H. (1975). Statistical package for the social sciences. New York: McGraw-Hill Book Company.
Norton, R. W. (1978). Foundation of a communicator style construct. Human Communication Research, 4.(2), 99-112.
Norton, R. W. (1983). Communicator style: Theory. application, practice. Sage series in Interpersonal Communication. 1. Beverly Hills, California.
Reddin, W. (1970). Managerial effectiveness. New York: McGraw-Hill.

92
Robinson, J. P. and Shaver, P- R. (1961). Measures of social psychological attitudes. Ann Arbor, Michigan: Institute for Social Research.
Rotter, J. B. (1966). Generalized expectancies for internal verses external locus of control of reinforcement. Psychological Monograms, 80, 1-28.
Ruesch, J. & Bateson, G. (1951). Communication: The social matrix of psychiatry. New York: Norton.
Scarbaugh, L. E. & Roe, R. C. (1984, November). An investigation of a taxonomic approach to intercultural communication. Paper presented to the Speech Communication Association, Chicago.
Schramm, W. (1955). The process of effects of mass communication. Champaign, Illinois: University of Illinois Press.
Smith, M. J. (1988). Contemporary communication research methods. Belmont, California: Wadsworth Publishing Company.
Stempel, G. H. & Westley, B. H. (1981). Research methods in mass communication. Englewood Cliffs, New Jersey: Prentice-Hall, Inc.
Stodgill, R. M. (1950). Leadership, membership and organization. Psychological Bulletin. 47. 1-14.
Stogdill, R. M. & Coons, A. (1957). Leader behavior: Its descriptions and measurement. Eds. Research Monograph, 88. Ohio State University.
Sykes, C. J. (1988). Profscam: Professors and the demise of higher education. Washington, D.C.: Regnery Gateway.
Three thousand futures: The next twenty years for higher education. (1980). Final report of the Carnegie Council on Policy Studies in Higher Education. San Francisco, California: Jossey-Bass.
Vroom, V. (1976). Leadership. In M. D. Dunnette (Ed.), The handbook of industrial and organizational psychology= (pp. 1527-1552). Chicago: Rand McNally.
Warburton, T. L. (1989, November). Can we talk?: Suggestions for clearing the way for communication between faculty and administration. Paper presented to the national convention of the Speech Communication Association, San Francisco, California.

93
Wilson Learning Corporation (1975). Social style profile. Eden Prairie, Minnesota: Wilson Leaning Corporation.
Wilson Learning Corporation (1977). Social styles sales strategy: Action guide. Eden Prairie, Minnesota: Wilson Learning Corporation.

APPENDIX
SURVEY PACKET
94

95
ACU Box 8065 Abilene Christian Univ. Abilene, Texas 79699 August 15, 1989
Dear Colleague:
As a part of my doctoral dissertation at Texas Tech University, l am requesting that certain faculty members and administrators at randomly selected institutions of higher education complete and return to me the enclosed cjuestionnaire. A stamped, self-addressed envelope is enclosed for your convenience.
The cjuestionnaire contains three sections. One part asks for demographic information which will be helpful to me in analyzing responses. The second part is the Personal Report of World View (PRWV). The third part is a Social Impression scale developed by the Wilson Learning Corporation. Response to parts two and three will form the basis for comparison among randomly selected constituents at the institutions. Your responses will remain confidential. Only generalized data usage will be employed in this study, no individual responses will be reported. You will notice, however, that your cjuestionnaire and envelope are coded so that I may know which responses have been returned and need not make a second contact with someone who has already responded. Personal identification will be removed from the data set as soon as follow-up activities have been completed. If you are philosophically opposed to participation in this study, I ask you to please return the stamped, self-addressed envelope so that I will not contact you further. Your participation is voluntary, and if you choose to not participate you may do so without negative consecjuences.
I hope you will take the few minutes necessary to complete and return the questionnaire. Please do not spend a long time analyzing the cjuestions and your responses. I need your immediate reaction rather than one resulting from great reflection.
I am sure that you realize how important these responses are to my work, and I appreciate your cooperation and return of this questionnaire by September 15, 1989. Again, let me assure you that my interest lies in generalized data analysis and not in the employment of individual responses separately.
Thank you for your time and assistance in this project.
96
Sincerely,
Joseph J. Cardot

97
QUESTIONNAIRE
Demographic Information
Please check the descriptions most applicable to you.
1. Classification:
^Administrator (a person who holds full-time responsibilities in an administrative position at the level of department head or higher and who teaches no more than two courses during the academic year).
Faculty member (a person with an academic appointment who teaches a full load and who has no administrative duties in addition to the teaching load).
2. Number of years in above classification:
0 - 3 8 - 15
4 - 7 16 or more
If you are classified as an administrator, which of the following best describes your present position?
President or chief executive officer
^Vice-president or dean of academic affairs
College dean or department head
If you are classified as dean or department head, which of the following most closely describes your area of responsibility?
Business (accounting, etc.)
English
^Mathematics
Teacher education

98
If you are classified as a faculty member, which of the following most closely describes your academic area?
Business (accounting, etc.)
English
^Mathematics
Teacher education
Age;
Below 30
_30 - 35
36 - 45
46 - 55
56 and over
Gender:
Female
Highest earned degree:
Bachelor's
Master's
_Male
Specialist's
Doctorate
Personal Report of World View
Please circle the letter which most closely describes your feeling about each item. Please do not dwell on any item. Your immediate reaction is most important.
Scale: SA = Strongly Agree A = Agree N = Neutral D = Disagree
SD = Strongly Disagree
1. Luck plays an important role in my life.
SA A N D SD
2. In nature, spirits exist which sometimes affect my activities.
SA N D SD
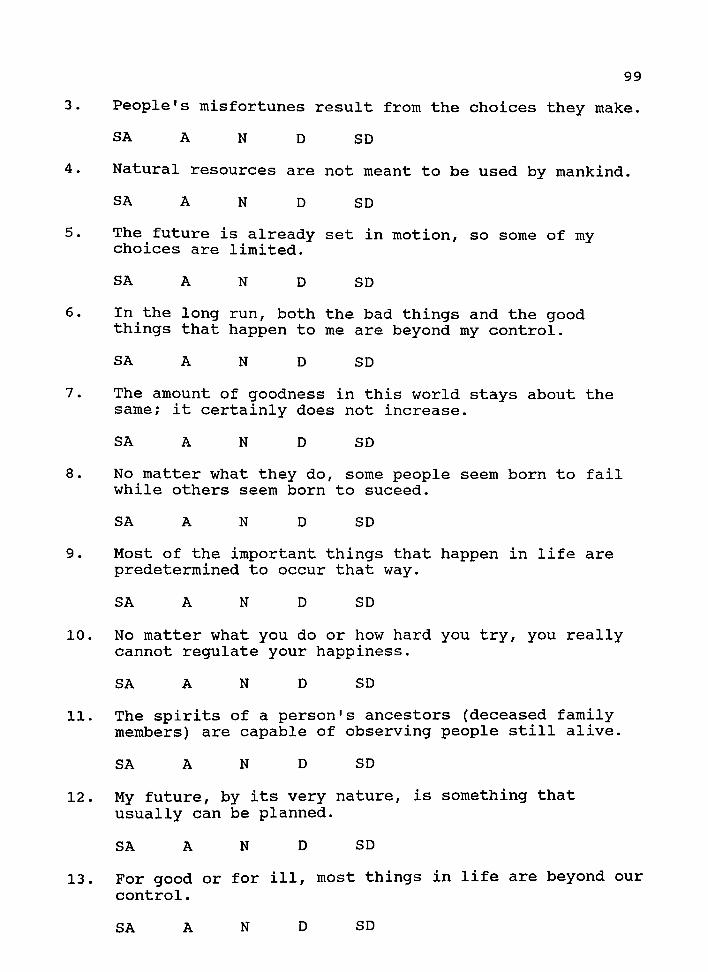
99
3. People's misfortunes result from the choices they make.
SA A N D SD
4. Natural resources are not meant to be used by mankind.
SA A N D SD
5. The future is already set in motion, so some of my choices are limited.
SA A N D SD
6. In the long run, both the bad things and the good things that happen to me are beyond my control.
SA A N D SD
7. The amount of goodness in this world stays about the same; it certainly does not increase.
SA A N D SD
8. No matter what they do, some people seem born to fail while others seem born to suceed.
SA A N D SD
9. Most of the important things that happen in life are predetermined to occur that way.
SA A N D SD
10. No matter what you do or how hard you try, you really cannot regulate your happiness.
SA A N D SD
11. The spirits of a person's ancestors (deceased family members) are capable of observing people still alive.
SA A N D SD
12. My future, by its very nature, is something that usually can be planned.
SA A N D SD
13. For good or for ill, most things in life are beyond our control.
SA A N D SD

100
14. Everyone exists for some predetermined purpose.
SA A N D SD
15. A person's destiny depends on the plan of a super being.
SA A N D SD
16. Getting a job is nearly always a matter of fate—being at the right place at the right time.
SA A N D SD
17. The feelings and actions of living persons cannot please or offend the dead.
SA A N D SD
18. Achieving one's goals is largely a matter of one's own actions.
SA A N D SD
19. The future lies befor most people like a long ribbon which cannot be altered or shaped, just followed.
SA A N D SD
20. Natural forces usually work against mankind, thus preventing progress.
SA A N D SD
21. Many times I could be described as a victim of circumstances beyond my control.
SA A N D SD
22. No matter how hard you try, some people just don't like you.
SA A N D SD
23. It is not always wise to plan too far ahead because many things turn out to be a matter of good or bad fortune anyhow.
SA A N D SD

101
24. Who gets to be boss often depends on who was lucky enough to be in the right place first.
SA A N D SD
25. Most people don't realize the extent to which their lives are controlled by random events.
SA A N D SD
26. Many times I feel that I have little influence over the things that happen to me.
SA A N D SD
27. There's not much use in trying too hard to please people; if they like you, they like you.
SA A N D SD 28. Sometimes I feel that I don't have enough control over
the direction my life is taking.
SA A N D SD
Social Impression
Below is a set of scales that refer to certain terms frecjuently used to describe people. Please use this scale to rate yourself. Circle the response that most closely fits how you view yourself. Remember, you are always making relative judgements when responding to the scales. There are no absoluted, no right or wrong answers. Please make sure that you have responded to every scale.
LOW HIGH
1. Assertive 1 2 3 4 5 6 7
2. Desire to control 1 2 3 4 5 6 7
3. Takes charge 1 2 3 4 5 6 7
4. Tough minded 1 2 3 4 5 6 7
5. Dynamic 1 2 3 4 5 6 7
6. Aggressive 1 2 3 4 5 6 7
7. Need to compete 1 2 3 4 5 6 7
8. Risk taker 1 2 3 4 5 6 7

9.
10.
11.
12.
13.
14.
15.
16.
17.
(C)
Flexible
Versatile
Adaptable
Cope with situations
Approachable
Sociable
People oriented
Warm
Willing to relate
Wilson Learning Corporation,
1
1
1
1
1
1
1
1
1
1976.
2
2
2
2
2
2
2
2
2
3
3
3
3
3
3
3
3
3
4
4
4
4
4
4
4
4
4
5
5
5
5
5
5
5
5
5
6
6
6
6
6
6
6
6
6
102
7
7
7
7
7
7
7
7
7