yosemite.epa.gov By...Jewell J. Hargleroad Law Office Of Jewell J. Hargleroad 1090 B Street, No. 104...
155
Exhibit 9
Transcript of yosemite.epa.gov By...Jewell J. Hargleroad Law Office Of Jewell J. Hargleroad 1090 B Street, No. 104...

Exhibit 9

Jewell J. Hargleroad Law Office Of Jewell J. Hargleroad
1090 B Street, No. 104 Hayward, California 94541 Telephone: 510-331-2975
September 25, 2009
Via Email and U.S. Mail Weyman Lee, Senior Engineer Bay Area Air Quality Management District 939 Ellis Street, San Francisco, California 94109 Re: Addendum to Comments Submitted Concerning Russell City Energy Center (RCEC) Application No. 15487 re Additional SOB Dear Weyman: On behalf of Chabot-Las Positas Community College District, this is to add as an addendum to our earlier comments submitted on September 16, 2009 the following additional observations that were inadvertently omitted. Under section (B), pp. 43-46, of the Additional SOB, the Air District states the following:
The Air District has considered this issue further in light of these comments and has concluded that requiring a urea SCR system over an ammonia system would not be the most appropriate BACT alternative. Although urea substitution could reduce the potential for accidental ammonia releases, the Air District has found that it would involve offsetting negative environmental impacts in the form of increased emissions of formaldehyde, a hazardous air pollutant and toxic air contaminant. The Air District reviewed data from a similar facility in Sumas, Washington, which demonstrated that urea injection (as opposed to the use of ammonia) resulted in a nearly five-fold increase in formaldehyde emissions.[fn]
To draw this conclusion, the Air District relies on the communications from the applicant Calpine set forth in footnote 85, page 45, citing to “Valid Results, Inc., test report for June 13, 2002, EPA Method 316 Source Test (0.226 tpy formaldehyde emissions with urea); email message from Brian Fretwell to Barbara McBride, Calpine, March 4, 2009 (prior test without urea was 0.049 tpy formaldehyde emissions).”

September 25, 2009 Page 2
To reject urea, however, due to formaldehyde emissions, based on one set of tests, is erroneous. The formaldehyde emissions can be avoided by using liquid urea. Formaldehyde is present only in the coating on the solid urea pellets. From what we understand, urea can be purchased as a 50% to70% solution and the solution does not contain formaldehyde. In fact, SNCR systems normally use 50% urea solution. This completely eliminates the formaldehyde. The first step in converting solid urea to ammonia is to transfer it from dry storage to a dissolver tank where it is mixed with heated de-ionized water to make up a urea solution of 40% to 50%. (Spencer et al. 2001.) By importing urea solution, this initial step can be eliminated, offsetting a portion of the increase in transportation cost. Although the new PM10 BACT limit, page 51, is a step in the right direction, it should be lower. The Blyth facility, using the same turbine, has a lower PM10 BACT limit. We also want to bring to your attention that Condition No. 24, limiting sulfuric acid mist to 7 ton/yr in any twelve-month period, we understand as a practical matter is not enforceable. The permit does not identify the test methods that will be used for annual stack testing. This is particularly critical for PM10 and PM2.5, as the magnitude of the emissions is determined by the method used to measure them. Similarly, the standard sulfuric acid mist test methods are known to be inaccurate. Also not verified is whether the SAM levels can be detected as low as 7 ton/yr. Additionally, given the District’s nonattainment status for PM2.5, LAER for the cooling towers should be dry cooling. Your attention in this matter is greatly appreciated. Sincerely, Jewell J. Hargleroad Cc: (Via Email Only) Golden Gate Law School Clinic, Helen Kang Earthjustice, Paul Cort Communities for A Better Environment

Exhibit 10

A/73106494.1
PM2.5 PSD SOURCE IMPACT ANALYSIS (Revised July 30, 2009)
For the:
Russell City Energy Center Draft Prevention of Significant Deterioration (PSD) Permit
Prepared for:
Russell City Energy Company, LLC.
Prepared by:
Atmospheric Dynamics, Inc. 2925 Puesta del Sol
Santa Barbara, CA. 93105
Reviewed by:
Bingham McCutchen LLP Three Embarcadero Center
San Francisco, CA 94111

A/73106494.1 2
PM2.5 Source Impact Analysis Localized cumulative source impacts from the Russell City Energy Center (RCEC) were assessed for particulate matter with an aerodynamic diameter of 2.5 microns or less (PM2.5). The cumulative multisource modeling analysis focused on the proposed RCEC project combined with mobile PM2.5 emissions from Highway 92, located just south of the project site, along with PM2.5 emissions from permitted sources within six (6) miles of RCEC. The analysis demonstrates that the emissions from RCEC will not cause or contribute to a violation of the National Ambient Air Quality Standards (NAAQS) for PM2.5. If required, it would also demonstrate that the emissions from RCEC would not result in any exceedance of the lowest of EPA’s proposed Class II increments for PM2.5. Further, it reviews the results of RCEC’s earlier Class I impacts analysis to conclude that no impacts greater than the lowest of EPA’s proposed Class I significant impact levels (SILs) are expected in either of Point Reyes National Seashore or Pinnacles National Monument.
1. Regulatory Context. This analysis was undertaken in response to the April 24, 2009 decision of the Administrator of the U.S. Environmental Protection Agency (EPA), Lisa P. Jackson, to grant a petition for reconsideration brought by EarthJustice on behalf of the Sierra Club and Natural Resources Defense Council concerning specific provisions in EPA’s May 16, 2008 rule, Implementation of New Source Review (NSR) Program for Particulate Matter Less than 2.5 Micrometers (PM2.5), 73 Fed. Reg. 28321. In that decision, Administrator Jackson said that she intends to repeal the “grandfathering provision concerning the continued use of the PM10 Surrogacy Policy” for those federal PSD permit applicants completed prior to July 15, 2008 (as codified at 40 CFR 52.21(i)(l)(xi)) because it had been promulgated without public comment. She also stayed the effectiveness of this provision for three months pending consideration.
In its December 2008 Statement of Basis for Draft Amended Federal Prevention of Significant Deterioration Permit for RCEC (Statement of Basis), the Bay Area Air Quality Management District (Air District) relied upon the PM10 Surrogacy Policy for purposes of demonstrating compliance with the requirement to conduct an air quality impacts analysis (AQIA).1 As a consequence of Administrator Jackson’s April 24, 2009 decision, that analysis would no longer satisfy federal PSD requirements with respect to PM2.5.
2. PSD Source Impact Analysis. Under EPA’s PSD regulations, an applicant must conduct a “source impact analysis”, which demonstrates that “allowable emission increases from the source in conjunction with all other applicable emissions increases or reductions (including secondary emissions), would not cause or contribute to air pollution in violation of: (1) Any NAAQS in any region; or (2) Any applicable maximum allowable increase over the baseline concentration in any area.” 40 CFR § 52.21(k).
Subparagraph (1) is required to assure that the source’s emissions will not cause a violation of the NAAQS, which, in this case, consist of the 24-hour and annual PM2.5 standards of 35 µg/m3 and 15 µg/m3, respectively. Subparagraph (2) is the “increment consumption analysis”, which assures that, in those locations currently meeting the federal NAAQS (i.e., those deemed “attainment” or “unclassifiable”), the concentration 1 See Statement of Basis, at 17-18, 86-88.

A/73106494.1 3
of a given pollutant cannot increase by an amount greater than the “maximum allowable increase” specified by the Clean Air Act and/or the PSD regulations for the particular pollutant.
3. Role of Significant Impact Levels. For purposes of the PSD program, EPA has traditionally applied “significant impact levels” (“SILs”) as a de minimis value, which represents the offsite concentration predicted to result from a source’s emissions that does not warrant additional analysis or mitigation.2 If a source’s modeled impact at any offsite location exceeds the relevant SIL, the source owner must then conduct a “multi-source” (or “cumulative”) air quality analysis to determine whether or not the source’s emissions will cause or contribute to a violation of the relevant NAAQS or applicable PSD increment.
While EPA has not promulgated any final SILs or PSD increments for PM2.5 at this time, in 2007, EPA proposed three options for establishing PM2.5 SILs and increments. September 21, 2007 Proposed Rule, 72 Fed. Reg. 54112. As a conservative measure, RCEC applied the lowest (i.e., most stringent) of each of the three proposals for both the Class II and Class I SILs and increments, as shown in Table 1 below.
Table 1 Lowest of Proposed PSD Ambient Significance Levels and Increments
Pollutant/ Avg. Period
Class II SIL (µg/m3)
Class II Increment (µg/m3)
Class I SIL
(µg/m3)
Class Increment (µg/m3)
PM2.5
- 24-hour - Annual
1.2 0.3
9 4
0.07 0.04
2 1
4. NAAQS Compliance Demonstration. To demonstrate that the emissions from the proposed RCEC will not cause or contribute to a violation of the PM2.5 NAAQS, a multi-source cumulative modeling analysis was conducted in accordance with EPA
2 See, e.g., Prevention of Significant Deterioration (PSD) for Particulate Matter Less than 2.5 Micrometers (PM2.5) – Increments, Significant Impact Levels (SILs) and Significant Monitoring Concentration (SMC); Proposed Role, 72 Fed. Reg. 54112, at 54138 (September 21, 2007) (hereinafter, “September 21, 2007 Proposed Rule”) (“Based on EPA interpretations and guidance, SILs have also been widely used in the PSD program as a screening tool for determining when a new major source or major modification that wishes to locate in an attainment or unclassifiable area must conduct a more extensive air quality analysis to demonstrate that it will not cause or contribute to a violation of the NAAQS or PSD increment in the attainment or unclassifiable area.”); 72 Fed. Reg. at 54139 (“The EPA considers a source whose individual impact falls below a SIL to have a de minimis impact on air quality concentrations. Thus, a source that demonstrates its impact does not exceed a SIL at the relevant location is not required to conduct more extensive air quality analysis or modeling to demonstrate that its emissions, in combination with the emissions of other sources in the vicinity, will not cause or contribute to a violation of the NAAQS at that location.”)

A/73106494.1 4
requirements3 This analysis considered both the existing background concentrations, as established by ambient monitoring data,4 and the contribution from additional sources, which might not be reflected by the monitoring data, but could interact with the facility’s potential impacts.
5. Preconstruction Monitoring Data. EPA’s PSD regulations require an applicant to provide preconstruction monitoring data for purposes of use in the Source Impacts Analysis.5 However, a source is exempt from this requirement if its modeled impact in any area is less than pollutant-specific “significant monitoring concentrations” (“SMC”), which EPA has generally established as five times the lowest detectable concentration of a pollutant that could be measured by available instrumentation.6 In its September 21, 2007 Proposed Rule, EPA proposed three options for establishing PM2.5 SMCs, as shown in the following Table 1A.
TABLE 1A7 EPA’s Proposed Significant Monitoring Concentrations for PM2.5
Option Number Basis Proposed Level
1 5-times lowest detectable 24-hour average concentration for PM2.5 (2.0 µg/m3) (40 CFR Part 50, App. L, § 3)
10 µg/m3
2 Existing PM10 SMC (10 µg/m3), times ratio of PM2.5 to PM10 emissions (0.8)
8.0 µg/m3
3 Existing PM10 SMC (10 µg/m3) times ratio of PM2.5 24-hr NAAQS to PM10 24-hr NAAQS (0.233)
2.3 µg/m3
3 Guideline on Air Quality Models, 40 CFR Pt. 51, App. W, § 7.2.1.1.a.The PSD regulations require that all “estimates of ambient concentrations” must be based “on applicable air quality models, data bases, and other requirements specified in appendix W of part 51 of this chapter (Guideline on Air Quality Models).” 40 CFR § 52.21(l).
4 See Guideline on Air Quality Models, 40 CFR Pt. 51, Appendix W (App. W), § 7.2.1.1.a. According to Appendix W, “[t]ypically, air quality data should be used to establish background concentrations in the vicinity of the source(s) under consideration”. Id. § 8.2.1.b For comparison with the 24-hour PM2.5 NAAQS, the background concentration is based on the average of the 98th percentile 24-hour values measured over the last three years of available data. Id., § 10.1.c. For the annual PM2.5 NAAQS, the background is established by the three year average of the annual averages.
5 See 42 U.S.C. § 7475(e)(2); 40 CFR § 52.21(m)(1).
6 See September 21, 2007 Proposed Rule, 72 Fed. Reg. at 54141. (“The EPA promulgated values that represented five times the lowest detectable concentration in ambient air that could be measured by the instruments available for monitoring pollutants… The EPA chose the factor of five after reviewing test data for various methods and considering instrument sensitivity, potential for sampling error, instrument variability, and the capability to read recorded data.”)
7 Id.

A/73106494.1 5
Even if a source’s potential impacts exceeds the corresponding SMC, and the applicant must therefore provide preconstruction monitoring data as part of its Source Impact Analysis, that does not necessarily mean the applicant must install and operate a new monitor at the project site. Rather, according to EPA guidance, an applicant may satisfy the preconstruction monitoring obligation in one of two ways8: (i) Where existing ambient monitoring data is available from representative monitoring sites, the permitting agency may deem it acceptable for use in the Source Impacts Analysis;9 or (ii) where existing, representative data are not available, then the applicant must obtain site-specific data.10
As a general matter, the permitting agency has substantial discretion “to allow representative data submissions (as opposed to conducting new monitoring) on a case-by-case basis.”11 In determining whether existing data are representative, EPA guidance has emphasized consideration of three factors: monitor location, data quality and currentness of the data.12 The permitting agency also may approve use of data from a representative “regional” monitoring site for purposes of the NAAQS compliance demonstration.13
While the maximum offsite impact modeled to occur from RCEC (4.86 ug/m3) is below two of EPA’s proposed Significant Monitoring Concentrations (“SMCs”), it would exceed the lowest of the three proposed SMCs. Accordingly, RCEC has proposed existing monitoring data from nearby Fremont, CA to satisfy the preconstruction
8 See Ambient Monitoring Guidelines for Prevention of Significant Deterioration, U.S. EPA Office of Air Quality Planning and Standards, EPA-450/4-87-007, May 1987 (“PSD Monitoring Guidelines”), at § 2.1. (“It should be noted that the subsequent use of ‘monitoring data’ refers to either the use of existing representative air quality data or monitoring the existing air quality.”)
9 New Source Review Workshop Manual: Prevention of Significant Deterioration and Nonattainment Area Permitting, Draft 1990 (“Draft NSR Workshop Manual”), at C.18. (“Once a determination is made by the permitting agency that ambient monitoring data must be submitted as part of the PSD application, the requirement can be satisfied in one of two ways. First, under certain conditions, the applicant may use existing ambient data. To be acceptable, such data must be judged by the permitting agency to be representative of the air quality for the area in which the proposed project would construct and operate.”)
10 Id., at C.19.
11 In re Kawaihae Cogeneration Project, 7 Environmental Administrative Decisions (“E.A.B.”) 107, 128 (U.S. EPA Environmental Appeals Board, April 28, 1997) (denying review of claim that permitting agency should have required site-specific monitoring for pollutants exceeding the significant monitoring concentrations based on EPA guidance and an earlier decision in In re Hibbing Taconite Co., 2 E.A.D. 838, 851 (EPA Administrator 1989), cited for the proposition that “monitoring guidelines ‘are very broad and leave much to the discretion of the permitting authority’”).
12 Id.; see also PSD Monitoring Guidelines, at § 2.4.
13 Draft NSR Workshop Manual, at C.18 (“It is generally preferable to use data collected within the area of concern; however, the possibility of using measured concentrations from representative ‘regional’ sites may be discussed with the permitting agency.”)

A/73106494.1 6
monitoring requirement. The BAAQMD maintains air quality and meteorological monitoring stations throughout the entire air basin with sufficient resolution to adequately determine representative background concentrations for attainment/nonattainment determinations. Unlike air toxics or certain criteria pollutants (e.g., carbon monoxide), PM2.5 generally occurs as a regional pollutant in the Bay Area. In a case such as this, where the Air District maintains an extensive network of monitoring stations validated to meet the relevant federal reference methods, the applicant and permitting agency may rely upon the robust data set generated by the monitoring network for purposes of the NAAQS compliance demonstration.
In discussions with Air District personnel, RCEC has proposed the Fremont monitoring data as adequately representative of the conditions at the project site. This monitoring location has been classified as a “population oriented” monitor and designated for collection of PM2.5 data “because light winds combined with surface based-based [sic] inversions during the winter months can cause elevated particulate levels.” 2008 Air Monitoring Network Plan, To be Submitted: July 1, 2009, at 31. Similar conditions affecting PM2.5 concentrations are expected to occur within the vicinity of the project site.
In addition, the Fremont monitoring station is the closest within the Bay Area’s monitoring network for which at least three years of PM2.5 monitoring data are available, as required for purposes of the NAAQS compliance demonstration: the 24-hr design value is based on the three-year average of the 98th percentile of daily average concentrations, while the annual design value is the three year average of annual averages.14 As suggested, the Fremont monitor has collected a complete set of validated, PM2.5 data. According to the Air District’s 2008 Air Monitoring Network Plan, “[t]he national 24-hour PM2.5 standard of 35 µg/m3 was exceeded on four days in the last 3 years.” 2008 Air Monitoring Network Plan, To be Submitted: July 1, 2009, at 31.
In contrast, the closest monitoring station in the other direction (to the north of the project site) that has collected PM2.5 monitoring data is classified as a “Special Purpose Monitor” (SPM) and has only been collecting data since November 2007. Id., 97-98. As a consequence, the data set would be inadequate for the Source Impact Analysis’ determination of whether or not RCEC’s emissions of PM2.5 would cause or contribute to an exceedance of the PM2.5 NAAQS.
For the summer months, when RCEC’s contributions are the highest, the 98th percentile of average daily concentrations recorded by the Fremont monitoring station is approximately 21 µg/m3, as a daily (24-hour) average; for winter months, when exceedances are likely to occur throughout the Bay Area, it is approximately 29 µg/m3. As a conservative measure, RCEC has applied the higher background concentration for all modeled periods. For the annual average, the background concentration is approximately 9.5 µg/m3.
RCEC representatives have discussed and agreed upon the representativeness of the data set from the Fremont monitor for purposes of the Source Impacts Analysis. 14 See 40 CFR Pt. 51, App. W, § 10.1.c. (“Standards for fine particulate matter (PM-2.5) are expressed in terms of both long-term (annual) and short-term (daily) averages. The long-term standard is calculated using the three year average of the annual averages while the short-term standard is calculated using the three year average of the 98th percentile of the daily average concentration.”)

A/73106494.1 7
Further, to the extent these data may not reflect the influence of nearby sources which might interact with RCEC’s impacts to cause an exceedance of the NAAQS (e.g., motor vehicle traffic on State Highway 92 and 29 additional stationary sources permitted by the Air District since 2007 located within a 6-mile perimeter around the project site), RCEC has modeled additional contributions from those sources and included those contributions in its cumulative impacts analysis, as described below.
If, after adding in the background concentration, the modeled contribution from the source and any other modeled sources, the result is less than the relevant NAAQS at all locations, then no violation would occur and the cumulative impacts analysis is complete. If a violation is predicted by the model, the source may still demonstrate that it does not “cause or contribute to” a violation of the NAAQS by demonstrating that its own contribution is lower than the SIL at the particular location and time of the modeled violation.15 This is referred to as a culpability analysis.
6. PSD Increment Consumption Analysis. As described above, EPA has not yet promulgated final PSD increments for PM2.5. Upon promulgating the final NSR implementation rule for PM2.5, EPA said that, “[a] demonstration that a source does not cause or contribute to a violation of the PM2.5 NAAQS can be conducted notwithstanding the absence of an increment for PM2.5.”16 As indicated previously, a source owner must demonstrate that its emissions would not cause or contribute “[a]ny applicable maximum allowable increase over the baseline concentration in any area” 40 CFR § 52.21(k); see also 42 U.S.C. § 7475(a)(3)(A). In the absence of any maximum allowable increase, no increment consumption analysis is required.
Even if such an analysis were required at this time, the modeling analysis described herein would also demonstrate that RCEC’s emissions will not cause or contribute to any exceedance of EPA’s proposed PM2.5 Class II increments of 9 µg/m3 for the 24-hour standard and 4 µg/m3 for the annual standard. The highest annual and 24-hour concentrations indicated at any offsite location were 0.529 and 4.86 µg/m3, respectively.
When it proposed these increments in 2007, EPA proposed a number of options for establishing the “trigger date” for PM2.5, but said that its preference was to follow the example it set upon promulgating NO2 increments in 1988 and “reset” the trigger date (hence, the baseline for purposes of the increment consumption analysis) at the time of the rule’s issuance.17 EPA said this approach would be more protective and also was
15 Draft NSR Workshop Manual, Draft October 1990, at C.52 (“The source will not be considered to cause or contribute to the violation if its own impact is not significant at any violating receptor at the time of each predicted violation.”)
16 Implementation of the New Source Review (NSR) Program for Particulate Matter Less than 2.5 Micrometers in Diameter (PM2.5), Response to Comments (hereinafter, “Implementation Rule Response to Comments”), U.S. EPA, Office of Air Quality Policy and Standards, Air Quality Policy Division, New Source Review Group, March 2008, at 82.
17 See September 21, 2007 Proposed Rule, at 54136. (“Specifically, we are proposing that the major source baseline date and trigger date, both fixed dates, will be defined as the effective date of this rule after promulgation… EPA’s judgment is that starting with new baseline dates on or after the effective date of this rule would make the new PSD increments more protective. Under our

A/73106494.1 8
justified under the Clean Air Act because PM2.5 constitutes a “new pollutant”, and not a revision of an existing criteria pollutant; as a consequence, EPA said the baseline date for purposes of PM2.5 need not be tied to the historic baseline dates for either total suspended particulate or PM10. This approach has been endorsed by many parties which commented on the proposed rule, including consortia of state and local permitting agencies.18
If EPA should promulgate a new “trigger date” for PM2.5, RCEC’s application could be deemed the first completed PSD application received after the trigger date and would, consequently, trigger both the minor source baseline date and major source baseline date.19 In light of this, RCEC would not need to consider any other stationary sources for purposes of its increment consumption analysis , unless such sources had increased their emissions since the date when RCEC’s application was complete. Because the highest modeled concentrations from RCEC are significantly below the lowest of the proposed Class II increments, RCEC could not possibly be found to cause or contribute to an exceedance of a PSD increment.20 However, as suggested previously, no increment consumption analysis is currently required under the PSD regulations because, at this time, no increment has been established for PM2.5.
Modeling for PM2.5 To satisfy the requirement to evaluate the potential source impacts, dispersion modeling was conducting using the AERMOD model. The detailed modeling procedures, model
proposed approach, any emissions reductions occurring prior to the effective date of this rule would be counted toward the baseline concentration rater than expanding the PM2.5 increment.”)
18 See letter, Northeastern States for Coordinated Air Use Management, to Docket ID No. EPA-HQ-OAR-2006-0605, Re: NESCAUM Comments on EPA’s Proposed Rule: Prevention of Significant Deterioration (PSD) for Particulate Matter Less Than 2.5 Micrometers (PM2.5)–Increments, Significant Impact Levels (SILs) and Significant Monitoring Concentration (SMC). 72 Federal Register 54111, September 21, 2007, December 13, 2007; letter from National Association of Clean Air Agencies to U.S. EPA Air and Radiation Docket, Re: Docket ID: EPA-HQ-OAR-2006-0605, January 17, 2008; available at: http://www.4cleanair.org/documents/PM25Increments.pdf.
19 According to EPA’s September 21, 2007 Proposed Rule, the minor source baseline date cannot occur prior to the “trigger date”:
The trigger date, as the name implies, triggers the overall increment consumption process nationwide. Specifically, this is a fixed date, which must occur before the minor source baseline data can be established for the pollutant-specific increment in a particular attainment area. See, e.g., 40 CFR 52.21(b)(14)ii).
72 Fed. Reg. at 54117. See also supra at note 8.
As a consequence, no increases or decreases occurring since the time when RCEC initially submitted its application, but before the EPA’s selected trigger date for PM2.5, would consume increment.
20 Note that, for the 24-hour NAAQS, Appendix W instructs that the highest, second-highest increase in estimated concentration must be less than or equal to the relevant increment. 40 CFR Pt. 51, App. W, § 10.2.3.3.a.

A/73106494.1 9
options, and meteorological data used in the cumulative impacts dispersion analysis were the same as those used for the proposed facility as described in the AERMOD Modeling Assessment (September 2008).
Supporting information used in the analysis included the following:
• RCEC source’s respective coordinate locations and worst-case stack parameters and emissions;
• Stack parameters for sources included in the cumulative air quality impacts dispersion modeling analysis; and
• Output files for the dispersion modeling analysis.
The same stack locations and building dimensions used for the facility modeling analyses were also used to assess downwash considerations for the emissions sources at the proposed
RCEC. Worst-case source conditions defined by the screening analyses in the facility modeling analyses for RCEC were used to define stack conditions analyzed. These conditions are shown below in Table 2.
Table 2 Stack Parameters and Emission Rates for RCEC Facility* Emission Rates (g/s) for each
turbine/HRSG and cooling tower cell Stack Height (meter)
Stack Diam.
(meter)
Stack Temp
(deg K)
Exhaust Velocity
(m/s) PM2.5
Averaging Period: 24 hours Turbines/HRSGs 44.196 5.4864 350.68 14.075 0.945 Fire Pump Diesel Engine 4.572 0.1524 665.37 53.340 4.167E-4 Cooling Tower 18.288 9.7536 298.17 10.308 0.03066 Averaging Period: Annual Turbines/HRSGs 44.196 5.4864 356.83 21.655 0.8952 Fire Pump Diesel Engine 4.572 0.1524 665.37 53.340 5.936E-5 Cooling Tower 18.288 9.7536 300.27 10.308 0.02998 *PM2.5 emissions from the cooling tower were assumed to equal the PM10 emissions which are based on total TDS. No conversions were assumed. deg K = degree Kelvin, g/s = grams per second, m/s = meters per second
RCEC 24-hour PM2.5 Significant Impact Level Modeling Results
Emissions from the proposed project were modeled to determine the areal extent of the PM2.5 significance area for both the 24-hour and annual NAAQS. For purposes of these analyses, all total dissolved solids in the cooling tower were assumed to form PM2.5, which is a highly conservative assumption. Additionally, the emissions of PM2.5 from the turbine were based upon to the proposed emissions limit of 7.5 lb/hr PM10/ PM2.5 per gas turbine/HRSG train. The operation of the turbines and cooling tower were modeled with the assumption of 24-hours per day of emissions. The results of the SIL modeling analysis for locations that are greater than or equal to the 1.2 µg/m3 SIL are presented in Figure 1 and 1a.

A/73106494.1 10
Figure 1 24-Hour PM2.5 Significant Impact Level Modeling Areas

A/73106494.1 11
Figure 1a Annual PM2.5 Significant Impact Level Modeling Area
1. Identification of Significant Impact Area and Nearby Sources for Consideration in Cumulative Impacts Analysis. EPA guidance prescribes use of the significant impact levels (SILs) to establish the “impact area”, which is used to identify the appropriate geographic area in which a cumulative impacts analysis should be conducted according to EPA guidance, the “impact area” is identified by drawing a circle around the site with a radius equal to the distance to the farthest location where an exceedance of the SIL is modeled to occur.21 This impact area is also used in a multi-source cumulative impacts 21 According to EPA’s Draft NSR Workshop Manual, the “impact area” is defined by taking farthest location of a modeled exceedance of the SIL and drawing a circle to that point, with the source located at the center:
The proposed project’s impact area is the geographical area for which the required air quality analyses for the NAAQS and PSD increments are carried out. This area includes all locations where the significant increase in the potential emissions of a pollutant from a new source, or significant net emissions increase from a modification, will cause a significant ambient impact (i.e., equal or exceed the applicable significant ambient impact level as shown in Table C-4). The highest modeled pollutant concentration for each averaging time is used to determine whether the source will have a significant ambient impact for that pollutant.
A/73106494.1 12
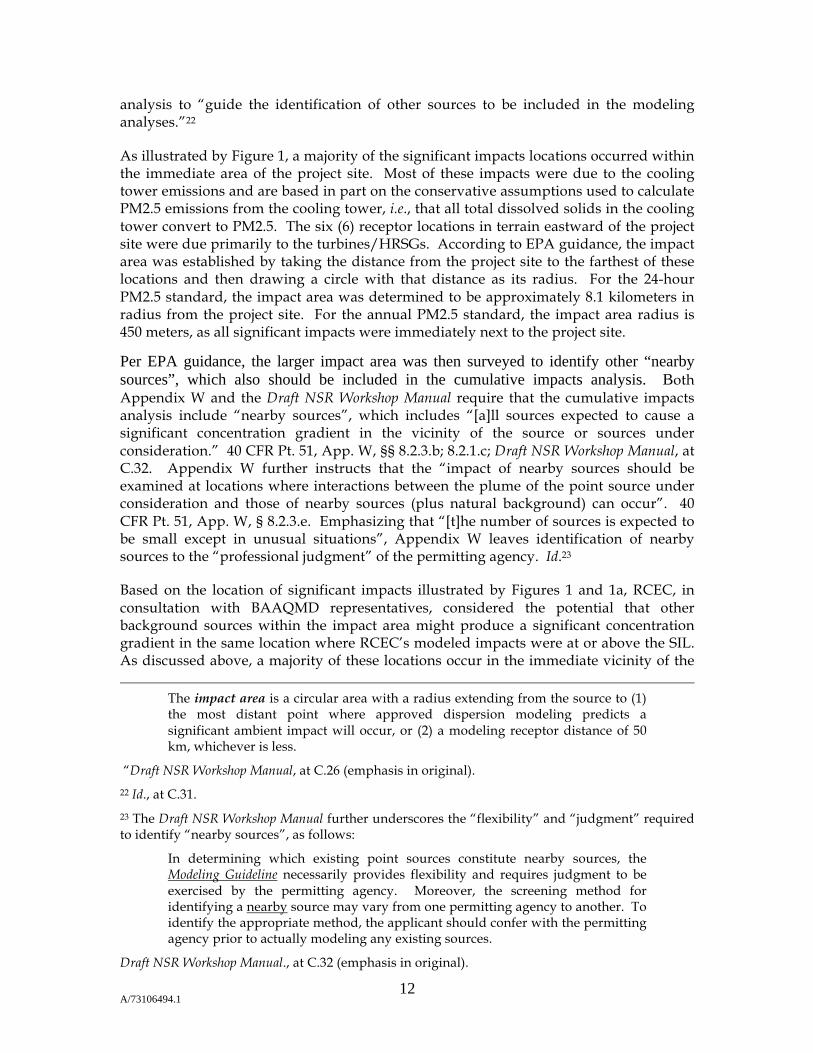
analysis to “guide the identification of other sources to be included in the modeling analyses.”22
As illustrated by Figure 1, a majority of the significant impacts locations occurred within the immediate area of the project site. Most of these impacts were due to the cooling tower emissions and are based in part on the conservative assumptions used to calculate PM2.5 emissions from the cooling tower, i.e., that all total dissolved solids in the cooling tower convert to PM2.5. The six (6) receptor locations in terrain eastward of the project site were due primarily to the turbines/HRSGs. According to EPA guidance, the impact area was established by taking the distance from the project site to the farthest of these locations and then drawing a circle with that distance as its radius. For the 24-hour PM2.5 standard, the impact area was determined to be approximately 8.1 kilometers in radius from the project site. For the annual PM2.5 standard, the impact area radius is 450 meters, as all significant impacts were immediately next to the project site.
Per EPA guidance, the larger impact area was then surveyed to identify other “nearby sources”, which also should be included in the cumulative impacts analysis. Both Appendix W and the Draft NSR Workshop Manual require that the cumulative impacts analysis include “nearby sources”, which includes “[a]ll sources expected to cause a significant concentration gradient in the vicinity of the source or sources under consideration.” 40 CFR Pt. 51, App. W, §§ 8.2.3.b; 8.2.1.c; Draft NSR Workshop Manual, at C.32. Appendix W further instructs that the “impact of nearby sources should be examined at locations where interactions between the plume of the point source under consideration and those of nearby sources (plus natural background) can occur”. 40 CFR Pt. 51, App. W, § 8.2.3.e. Emphasizing that “[t]he number of sources is expected to be small except in unusual situations”, Appendix W leaves identification of nearby sources to the “professional judgment” of the permitting agency. Id.23
Based on the location of significant impacts illustrated by Figures 1 and 1a, RCEC, in consultation with BAAQMD representatives, considered the potential that other background sources within the impact area might produce a significant concentration gradient in the same location where RCEC’s modeled impacts were at or above the SIL. As discussed above, a majority of these locations occur in the immediate vicinity of the
The impact area is a circular area with a radius extending from the source to (1) the most distant point where approved dispersion modeling predicts a significant ambient impact will occur, or (2) a modeling receptor distance of 50 km, whichever is less.
“Draft NSR Workshop Manual, at C.26 (emphasis in original).
22 Id., at C.31.
23 The Draft NSR Workshop Manual further underscores the “flexibility” and “judgment” required to identify “nearby sources”, as follows:
In determining which existing point sources constitute nearby sources, the Modeling Guideline necessarily provides flexibility and requires judgment to be exercised by the permitting agency. Moreover, the screening method for identifying a nearby source may vary from one permitting agency to another. To identify the appropriate method, the applicant should confer with the permitting agency prior to actually modeling any existing sources.
Draft NSR Workshop Manual., at C.32 (emphasis in original).

A/73106494.1 13
project site. Given the proximity of Highway 92 to these modeled exceedances of the SIL, the BAAQMD identified traffic on certain lengths of Highway 92 as nearby sources, i.e., sources whose emissions might cause a significant concentration gradient in the vicinity of the project’s impacts.
To determine the potential of Highway 92 to produce a concentration gradient, receptors were placed at equidistant locations along the highway, near Clawiter and extended outwards from the highway up to 10,000 meters. AERMOD was then used to determine the concentration gradient, which is shown in Figure 2.
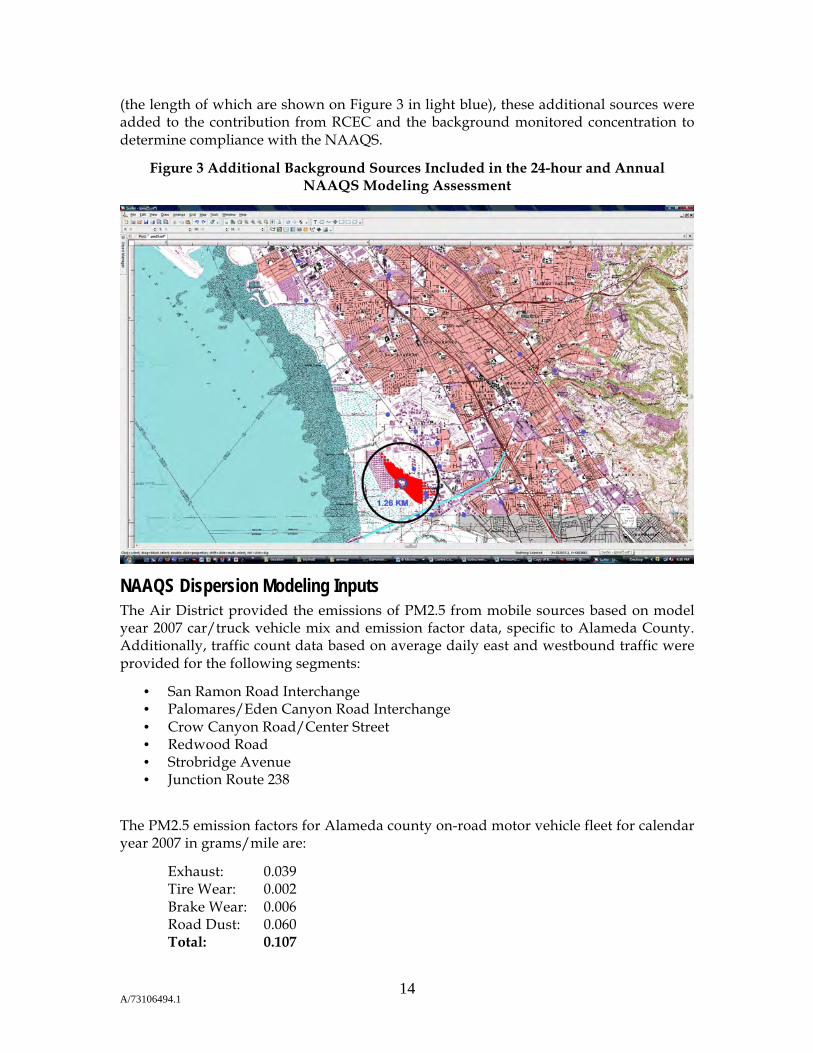
Based on the graphical results in Figure 2, a significant concentration gradient exists from the center of the highway outwards to distances up to 1000 meters from the source. Using the results of the significance modeling and the demonstration of the Highway 92 concentration gradient, the Air District provided emissions and highway length segment recommendations for use in the PM2.5 NAAQS modeling assessment. Figures 1a and 3 display the portions of Highway 92 that were included in the cumulative modeling assessment, which are outlined in light blue.
For the six (6) locations in elevated terrain to the east of the project site where RCEC’s impacts were modeled above the 24 hour SIL, no additional sources were identified that would cause a significant concentration gradient in the vicinity of these impacts. The BAAQMD also provided a list of additional permitted sources from the beginning of 2007 to present. Although none of these additional sources was expected to cause a significant concentration gradient in the same location as RCEC’s significant impacts, they were also included in the cumulative modeling analysis because, while already permitted, they may not yet be operational and thus, not reflected by the background monitoring data for PM2.5. The location of these additional sources is shown on Figure 3 by the violet dots. Together, with the area sources included from Highway 92 traffic
A/73106494.1 14
(the length of which are shown on Figure 3 in light blue), these additional sources were added to the contribution from RCEC and the background monitored concentration to determine compliance with the NAAQS.
Figure 3 Additional Background Sources Included in the 24-hour and Annual NAAQS Modeling Assessment
NAAQS Dispersion Modeling Inputs The Air District provided the emissions of PM2.5 from mobile sources based on model year 2007 car/truck vehicle mix and emission factor data, specific to Alameda County. Additionally, traffic count data based on average daily east and westbound traffic were provided for the following segments:
• San Ramon Road Interchange • Palomares/Eden Canyon Road Interchange • Crow Canyon Road/Center Street • Redwood Road • Strobridge Avenue • Junction Route 238
The PM2.5 emission factors for Alameda county on-road motor vehicle fleet for calendar year 2007 in grams/mile are:
Exhaust: 0.039 Tire Wear: 0.002 Brake Wear: 0.006 Road Dust: 0.060 Total: 0.107

A/73106494.1 15
The typical traffic speed for the modeled sources was assumed to be 60 miles per hour and is only used in estimating the exhaust emission factor. These emissions were based on EMFAC2007 version 2.3. It should be noted that the road dust emission factor provided by the BAAQMD was for all roadway types, and not just freeways. Using the road dust factor for freeways reduces this emission rate to 0.040 grams/mile for a new total of 0.087 grams/mile. However, the modeling assessment used the higher emission factor. Highway 92 was modeled as six (6) area sources corresponding to the traffic count data provided by the Air District. Table 3 presents the area source parameters used in the cumulative NAAQS modeling.
Table 3 Stack Parameters and Emission Rates for Highway 92 Emission Rates (g/s/meter2) for area
sources Location
X (meters)
Location Y (meters)
Base Elevation (meters)
Release Height
(meters) PM2.5
Source ID ROAD11 575174.9 4163661.0 1.8 0.50 0.40890E-05 ROAD21 577656.1 4164753.0 6.0 0.50 0.44410E-05 ROAD22 578328.9 4165042.0 6.0 0.50 0.44410E-05 ROAD31 578602.1 4165209.5 9.0 0.50 0.43090E-05 ROAD41 579490.1 4165658.8 12.0 0.50 0.47930E-05 ROAD42 579684.1 4165837.2 15.8 0.50 0.47930E-05 Initial vertical dispersion, Sigma Z, was set to 0.0
In addition, the BAAQMD provided a list of 29 additional sources that were within six (6) miles of the RCEC project. These sources were permitted for construction and operation between January 2007 to present and therefore may not be adequately represented by the background PM2.5 monitoring data. Based upon this possibility, the 29 background sources were included in the NAAQS modeling analysis and are presented in Table 4.
Table 4 Stack Parameters and Emission Rates for BAAQMD Source Inventory Emission Rates (g/s) for each source
BAAQMD Source #s Stack Height (meter)
Stack Diam.
(meter)
Stack Temp
(deg K)
Exhaust Velocity
(m/s) PM2.5
Averaging Period: 24 hours and Annual
00167 9.144 0.761 377.59 4.15 4.488E-2 00698 2.134 0.152 750.37 46.94 5.753E-5 01009 3.658 0.215 752.59 211.02 2.877E-3 02099 2.591 0.089 768.71 95.23 5.753E-5 03576 7.010 0.555 588.71 3.13 1.395E-2 03933 3.170 0.203 772.59 35.82 1.151E-4 04784 9.144 0.761 377.59 4.15 2.129E-2 07215 4.267 0.101 761.48 187.67 2.877E-4 07688 9.144 0.761 377.59 4.15 5.638E-3 13930 2.134 0.127 799.26 49.68 5.753E-5 15959 4.267 0.203 755.93 52.77 5.753E-5 16441 3.511 0.168 761.48 68.31 2.301E-4

A/73106494.1 16
Table 4 Stack Parameters and Emission Rates for BAAQMD Source Inventory Emission Rates (g/s) for each source
BAAQMD Source #s Stack Height (meter)
Stack Diam.
(meter)
Stack Temp
(deg K)
Exhaust Velocity
(m/s) PM2.5
16451 2.591 0.076 740.37 56.29 2.301E-5 16947 3.353 0.203 779.82 42.14 9.493E-5 17548 6.096 0.510 422.04 4.96 1.070E-2 17553 7.925 0.356 1033.15 6.42 2.273E-3 17621 11.582 0.406 733.15 47.03 4.027E-4 17952 4.267 0.089 866.48 77.26 2.589E-5 18189 2.134 0.152 710.37 27.19 2.877E-5 18210 7.010 0.555 672.04 5.57 1.726E-3 18421 3.261 0.152 817.04 60.78 4.315E-5 18548 10.000 0.100 0.00 0.10 1.346E-2 18676 3.048 0.101 761.48 187.67 4.315E-5 18683 2.515 0.076 703.15 72.78 2.301E-5 19014 1.829 0.076 724.26 76.30 2.877E-5 19164 4.267 0.101 795.37 85.89 4.027E-5 19173 2.134 0.152 710.37 27.19 4.315E-5 19244 7.010 1.067 0.00* 11.09 1.640E-3 19583 3.511 0.168 761.48 4.15 5.753E-5
*Temperature set to ambient. deg K = degree Kelvin, g/s = grams per second, m/s = meters per second
In addition to modeling the proposed project’s impacts, along with the impacts from traffic on the identified sections of Highway 92 and the BAAQMD supplied source inventory, the 98th percentile background concentration of PM2.5 recorded by the Fremont, California monitoring station was also included for the 24-hour analysis. As suggested previously, Air District personnel agreed upon the representativeness of the Fremont monitoring data for purposes of this analysis. For the years 2006 through 2008, the 24-hour background is 29.0 µg/m3. The annual background concentration was 9.5 µg/m3. These concentrations were then added to the modeling results, as described in the following section.
NAAQS Dispersion Modeling Results 1. 24-Hour Standard. To asses whether RCEC causes or contributes to a violation of the 24-hour (daily) PM2.5 NAAQS, AERMOD was run for only those receptors where the RCEC “first high” impacts (i.e., the maximum predicted concentration) exceeded 1.2 µg/m3 on a 24-hour basis. This is because, according to EPA guidance, a “source will not be considered to cause or contribute to the violation if its own impact is not significant at any violating receptor at the time of each predicted violation.” Draft NSR Workshop Manual, Draft October 1990, at C.52. Accordingly, even if violations of the NAAQS were modeled at other receptor locations, RCEC could not be found to cause or contribute to any such violation because its maximum modeled concentration at that receptor location would be below the SIL. Thus, the modeling receptor grid of 31,000 receptors was reduced to 6,019 receptors.

A/73106494.1 17
To evaluate whether cumulative multisource impacts would exceed the 24-hour NAAQS at those receptor locations, the emissions from the proposed project were then modeled along with the emissions from the BAAQMD-supplied inventory and Highway 92 sources. For comparison with the NAAQS, the 98th percentile 24-hour concentrations were then considered.24 The highest 98th percentile concentration from this modeling run was 11.27 µg/m3, which, upon the addition of background, would result in an exceedance of the NAAQS. This modeled exceedance was due almost entirely to Highway 92. Moreover, on the particular date of the modeled NAAQS violation, RCEC’s contribution was only 0.0013 µg/m3; thus the project’s emissions would not “cause or contribute to” this violation and RCEC can nevertheless make the required PSD demonstration.
To reduce the volume of output from the model when the EVENT post processing option was used, AERMOD was instructed to generate a plot file identifying instances where the 98th percentile total impact from all modeled sources equaled or exceeded 6 µg/m3. This concentration was chosen because the existing background applied for all modeled periods is 29.0 µg/m3; thus, any modeled concentration equal to or greater than 6 µg/m3 could produce a violation of the PM2.5 NAAQS standard of 35 µg/m3. Figure 4 displays the locations of all receptors where the 98th percentile modeled concentrations equaled or exceeded 6 µg/m3.
Figure 4 Receptor Locations Equal or Greater Than 6.0 µg/m3
This group of receptors coincides in location with some of the locations where RCEC’s impacts were modeled at concentrations exceeding the lowest of EPA’s proposed PM2.5 SIL. However, further review of the model output indicates that RCEC’s projected exceedances of the SIL never coincide in both time and location with total modeled
24 40 CFR Pt. 51, App. W, § 10.1.c.

A/73106494.1 18
concentrations above 6 µg/m3. In other words, when the wind direction is from the northwest, RCEC’s impacts sometimes exceeded the SIL at these receptor locations, but the amount contributed from all background sources was too small to result in a total impact that would exceed 6 µg/m3 (i.e., an exceedance of the NAAQS).
Similarly, when the wind direction is from the south-southeast, Highway 92 sometimes impacts these receptor locations at concentrations that, when combined with RCEC’s contribution, would exceed 6 µg/m3; but, in all such instances, RCEC‘s contribution was always less than the SIL for those occurrences. Further, the additional 29 stationary sources located within 6 miles of the project site permitted by the Air District since 2007 did not significantly affect the total modeled concentrations; the maximum 98th percentile 24-hour impact within the model domain from these additional sources was 0.186 µg/m3. Thus, although these sources are already likely accounted for by existing background monitoring data, their contribution was modeled anyway and included in the NAAQS compliance determination as a conservative measure.
This analysis was conducted using the AERMOD EVENT postprocessor. The EVENT postprocessor provides source-by-source contributions at selected receptors during specific events. In this case, the postprocessor identified any event wherein the 98th percentile concentration from RCEC, Highway 92 and the additional sources exceeded 6 µg/m3 and the “first high” concentration from RCEC equaled or exceeded 1.2 µg/m3. Three EVENT input files were generated by AERMOD for post processing. Review of the EVENT processor output confirms that the RCEC project does not contribute above the SIL for any receptor where the model calculates an exceedance of the PM2.5 NAAQS. Table 5 presents the EVENT output for the maximum 24-hour PM2.5 impact. Although other periods were modeled wherein the maximum concentration, after adding the emissions from RCEC, Highway 92 and the 29 additional sources to the identified background concentration of 29 µg/m3, would exceed the 24-hr standard of 35 µg/m3, the results of the post processor confirmed that the contribution of RCEC to all such exceedances is less than the relevant significance threshold (1.2 µg/m3).
Table 5 24-hour Cumulative Impacts Modeling Results (µg/m3)
PM2.5
Maximum Multisource
Concentration (µg/m3)
RCEC Contribution
(µg/m3)
Modeled Background Contribution
(µg/m3)
Monitored Background
(µg/m3)
Total Impact (µg/m3)
Federal Standard (µg/m3)
24-hour 11.302 0.00137 11.3007 29.0 40.302 35 Modeled and Background PM25 24-hour averages, for comparison to the federal standard, are the maximum 3-year average of the annual 98th percentile 24-hour concentrations (i.e., for modeled impacts equal to the 8th highest concentration at each receptor). RCEC modeled impacts at each receptor is the first high concentration for comparison to the SIL.
Included under separate attachment are the AERMOD input/output files on DVD in addition to the EVENT post processing files. The maximum modeled impact from Highway 92 is due primarily to the conservative assumptions used to generate the emissions data as well as the conservative nature of area sources within AERMOD. Additional modeling of Highway 92 using the aforementioned revised road dust emission rate as well as taking into account rain events would certainly reduce the overall impacts from Highway 92.
2. Annual Standard. A multi-source analysis was also conducted to determine whether the emissions from RCEC would cause or contribute to a violation of the annual PM2.5 NAAQS. According to the modeling analysis, the emissions from RCEC would exceed

A/73106494.1 19
the lowest of EPA’s proposed SILs of 0.3 µg/m3 at a number of offsite receptor locations, as shown by Figure 1a. To determine whether these impacts from RCEC, when added to the background concentrations of approximately 9.5 µg/m3, plus the contribution from any nearby sources with a significant concentration gradient would exceed the relevant NAAQS (15 µg/m3, annual average), the same sources from the 24-hour analysis were modeled using traffic data from Highway 92 and emissions factors, as provided above in addition to the BAAQMD provided source inventory. The results of the analysis demonstrate that the maximum modeled concentration at all receptors above significance are below the annual NAAQS, as summarized in Table 6.
Table 6 Annual Cumulative Impacts Modeling Results (µg/m3)
PM2.5
Maximum Multisource
Concentration (µg/m3)
RCEC Contribution
(µg/m3)
Modeled Background Contribution
(µg/m3)
Monitored Background
(µg/m3)
Total Impact (µg/m3)
Federal Standard (µg/m3)
Annual 1.06 0.513 0.544 9.5 10.56 15
Conclusion The maximum ambient concentrations predicted as a result of this cumulative source modeling exercise would, when added to the background concentration assumed for the area, exceed the applicable 24-hour PM2.5 NAAQS. This is primarily due to the conservative assumptions and methods used to model contributions from Highway 92. It is also because the background concentrations are already very close to the relevant NAAQS. Indeed, on December 22, 2008, EPA designated the Bay Area as “nonattainment” for the 24-hour PM2.5 NAAQS. As a consequence, the Bay Area will imminently be designated “nonattainment”, at which time PM2.5 will no longer be subject to review under the federal PSD rules. 25 Regardless, the foregoing modeling analysis demonstrates that, for all time periods and locations where the model predicted a violation of the standard, RCEC’s contribution would be less than the lowest of EPA’s proposed Class II SILs and, accordingly, is considered insignificant. Additionally, the annual PM2.5 NAAQS modeling analysis demonstrates compliance with the NAAQS at all receptors which equal or exceed the annual significance level.
Class I Area Impacts Analysis According to EPA’s Draft NSR Workshop Manual, an impact analysis must be performed for any PSD source which “may affect” a Class I area Draft NSR Workshop Manual, E.16. This includes any PSD source located within 100 km of a Class I area. Id. According to the Air District’s analysis presented in the December 2008 Statement of Basis, the potential impacts of RCEC’s emissions of PM10 at Point Reyes National Seashore were only 0.06 µg/m3 (24-hr average), which the Air District found to be below a significance
25 According to EPA’s PSD rules, “[t]he requirements of paragraphs (j) through (r) of this section shall not apply to a major stationary source or major modification with respect to a particular pollutant if the owner or operator demonstrates that, as to that pollutant, the source or modification is located in an area designated as non-attainment under section 107 of the Act.” 40 CFR § 52.21(i)(2). The referenced paragraphs (j) through (r) contain the sum and substance of the PSD program.

A/73106494.1 20
level of 1 µg/m3. (Statement of Basis, at 90.) According to the Draft NSR Workshop Manual, EPA’s policy requires, at a minimum, an analysis of the source’s impacts on “air quality related values” whenever a source’s predicted impact in the Class I area would exceed 1 µg/m3. Draft NSR Workshop Manual, E.16.
RCEC previously submitted a Class I Area Impacts Analysis that relied upon the PM10 Surrogacy Policy to support its conclusion that the emissions from RCEC would not cause any impacts above the corresponding SILs in any Class I area. This analysis considered potential impacts at the nearest Class I areas, Point Reyes National Seashore (70 kilometers from the project site) and Pinnacles National Monument (145 kilometers from the project site), using the CALPUFF long-range transport model. Additional details regarding the Class I Impacts Analysis can be found in the earlier submittal, dated February 2007.
As described by the Statement of Basis, the Air District’s modeling indicated maximum 24-hour potential impacts at Point Reyes National Seashore of 0.06 µg/m3, which was found to be below the corresponding Class I SIL for PM10 of 0.3 µg/m3. RCEC’s earlier Class I area impacts analysis also demonstrated maximum annual impacts at Point Reyes National Seashore of 0.008 µg/m3, which is significantly below the corresponding Class I SIL for PM10 of 0.2 µg/m3. RCEC’s analysis also reported modeled PM10 impacts at Pinnacles National Monument of 0.05 µg/m3 (24-hr avg) and 0.004 µg/m3 (annual avg), which are also below the corresponding Class I SILs for PM10 (0.3 and 0.2 µg/m3, respectively).
For purposes of the Class I impacts analysis for PM2.5, RCEC has compared its earlier analysis’ modeled impacts for PM10 with the lowest of EPA’s proposed Class 1 SILs for PM2.5. This comparison is shown in the following Table 7.
TABLE 7 PM10 and PM2.5 Class I SILs and Increments
Pollutant Averaging
Interval
Modeled Impact
Pinnacle (µg/m3)
Modeled Impact Point Reyes
(µg/m3)
Class I Significant
Impact Level
(µg/m3)
Class I PSD
Increment (µg/m3)
PM10 24-Hour Annual
0.05 0.004
0.06 0.008
0.3 0.2
10 5
PM2.5 24-Hour Annual
0.05 0.004
0.06 0.008
0.07 0.04
2 1
Assuming that RCEC’s PM2.5 impacts are the same as the earlier analysis of PM10 impacts results in a conservative over-prediction of potential PM2.5 impacts upon Point Reyes National Seashore and Pinnacles National Monument. This is because the PM10 impacts modeled by the earlier analysis were based upon higher emissions limits than now proposed by RCEC. It also is because, as described previously herein, in is based upon the assumptions that all PM10 is PM2.5 and, for the cooling tower, that all total dissolved solids, is emitted as PM2.5.
As shown by Table 5, if we assume that RCEC’s PM2.5 impacts are the same as its previously modeled PM10 impacts, then the potential impacts of PM2.5 on both Point

A/73106494.1 21
Reyes National Seashore and Pinnacles National Monument are less than the lowest of EPA’s proposed Class I SILs for PM2.5, which are 0.07 and 0.04 µg/m3 (as a 24-hour and annual average concentration, respectively).
EPA said that its decision to set the Class I SILs at 4 percent of the proposed Class I increments was based on its belief that, “where a proposed source contributes less than 4 percent to the Class I increment, concentrations are sufficiently low so as not to warrant a detailed analysis of the combined effects of the proposed source and all other increment-consuming emissions.” See 72 Fed. Reg. at 54140. Id. In conclusion, the foregoing analysis demonstrates that no significant impacts on Class I areas are expected as a result of RCEC.

Exhibit 11


Wenck File #1294-01
Submitted by:
MANKATO ENERGY CENTER, LLCA Wholly Owned Subsidiary of
Calpine Corporation 4100 Underwood Road
Pasadena, Texas 77507
Site Permit Application
Mankato Energy CenterMankato, Minnesota
Docket No. 04-76-PPS CALPINE
Prepared by:
WENCK ASSOCIATES, INC.1800 Pioneer Creek Center
P.O. Box 249Maple Plain, Minnesota 55359-0249
(763) 479-4200
March 2004

Table of Contents
TABLE OF CONTENTS .............................................................................................................. I
1.0 INTRODUCTION.......................................................................................................... 1-1
1.1 Background............................................................................................................. 1-1 1.2 Project Overview .................................................................................................... 1-3 1.3 Regulatory Process ................................................................................................. 1-4
1.3.1 Alternative Review ..................................................................................... 1-4 1.3.2 Site Permit Application Requirements ....................................................... 1-5 1.3.3 Environmental Assessment......................................................................... 1-6 1.3.4 Certificate of Need...................................................................................... 1-6
2.0 PROJECT DESCRIPTION .......................................................................................... 2-1
2.1 Ownership............................................................................................................... 2-1 2.2 Permittee ................................................................................................................. 2-1 2.3 Size and Type.......................................................................................................... 2-2 2.4 Site Location ........................................................................................................... 2-2 2.5 Property Owner....................................................................................................... 2-3 2.6 Alternative Sites Considered and Rejected............................................................. 2-4 2.7 Engineering and Operational Design...................................................................... 2-6
2.7.1 Primary Fuel Supply: Natural Gas.............................................................. 2-8 2.7.2 Secondary Fuel Supply: Low Sulfur Distillate Fuel Oil............................. 2-8 2.7.3 Natural Gas-fired Combustion Turbines..................................................... 2-9 2.7.4 Heat Recovery Steam Generators ............................................................. 2-10 2.7.5 Steam Turbine Generator.......................................................................... 2-11 2.7.6 Raw Water Treatment System .................................................................. 2-12 2.7.7 Demineralized Water Storage Tanks ........................................................ 2-14 2.7.8 Cooling Tower .......................................................................................... 2-14 2.7.9 Wastewater Collection/Treatment Systems .............................................. 2-15 2.7.10 Other (Ancillary) Structures/Buildings..................................................... 2-17
2.7.10.1 Auxiliary Boiler ......................................................................... 2-17 2.7.10.2 Emergency Generator ................................................................ 2-18 2.7.10.3 Fire Suppression Systems .......................................................... 2-18 2.7.10.4 Plant Buildings........................................................................... 2-19
2.7.11 Transformers............................................................................................. 2-20 2.7.12 Switchyard ................................................................................................ 2-20 2.7.13 Transmission............................................................................................. 2-20
2.8 Cost Estimate and Design Life ............................................................................. 2-20 2.9 Future Site Expansion and Generating Capacity Possibilities.............................. 2-21
T:\1294\01\02\Mankato Site Permit App.doc Mankato Energy Center Site Permit Application i

Table of Contents (Cont.)
T:\1294\01\02\Mankato Site Permit App.doc Mankato Energy Center Site Permit Application ii
3.0 INFRASTRUCTURE NEEDS AND CONNECTIONS ............................................. 3-1
3.1 Transportation......................................................................................................... 3-1 3.2 Gas Pipeline ............................................................................................................ 3-1 3.3 Electrical Transmission........................................................................................... 3-2 3.4 Water and Sewer..................................................................................................... 3-4 3.5 Other Utilities ......................................................................................................... 3-5
4.0 EFFECTS ON HUMAN ENVIRONMENT ................................................................ 4-1
4.1 Environmental Setting ............................................................................................ 4-1 4.2 Displacement .......................................................................................................... 4-2 4.3 Noise ....................................................................................................................... 4-2
4.3.1 Baseline Noise Survey................................................................................ 4-4 4.3.2 Noise During Facility Construction............................................................ 4-5 4.3.3 Noise During Facility Operation................................................................. 4-6
4.4 Aesthetics................................................................................................................ 4-7 4.5 Socioeconomic Impacts ........................................................................................ 4-10 4.6 Cultural Values ..................................................................................................... 4-11 4.7 Recreation ............................................................................................................. 4-12 4.8 Public Services...................................................................................................... 4-13
4.8.1 Transportation System .............................................................................. 4-13 4.8.2 Water and Sewer Services ........................................................................ 4-14 4.8.3 Waste Collection and Disposal ................................................................. 4-14 4.8.4 Fire and Police Protection......................................................................... 4-14
5.0 EFFECTS ON PUBLIC HEALTH AND SAFETY.................................................... 5-1
5.1 Air Emissions.......................................................................................................... 5-1 5.1.1 Sources of Emissions to the Air.................................................................. 5-1 5.1.2 Air Pollutants Emitted, Control Measures, and Compliance Testing......... 5-2
5.1.2.1 Air Pollutants Emitted.................................................................. 5-2 5.1.2.2 Emission Control Measures ......................................................... 5-4 5.1.2.3 Compliance Testing ..................................................................... 5-5
5.1.3 Criteria Pollutant Impacts ........................................................................... 5-5 5.1.3.1 Significant Impact Level Analysis............................................... 5-5 5.1.3.2 Increment Modeling..................................................................... 5-6
5.1.4 NAAQS Modeling ...................................................................................... 5-7 5.1.5 Air Emissions Risk Analysis ...................................................................... 5-8 5.1.6 Air Permitting Requirements ...................................................................... 5-9
5.2 Public Water Supply ............................................................................................... 5-9 5.3 Traffic ................................................................................................................... 5-10 5.4 Aircraft.................................................................................................................. 5-12

Table of Contents (Cont.)
T:\1294\01\02\Mankato Site Permit App.doc Mankato Energy Center Site Permit Application iii
5.5 Plumes................................................................................................................... 5-13
6.0 EFFECTS ON LAND-BASED ECONOMIES............................................................ 6-1
6.1 Agriculture .............................................................................................................. 6-1 6.2 Forestry ................................................................................................................... 6-2 6.3 Tourism................................................................................................................... 6-2 6.4 Mining..................................................................................................................... 6-2
7.0 ARCHAEOLOGICAL AND HISTORIC RESOURCES .......................................... 7-1
8.0 EFFECTS ON THE NATURAL ENVIRONMENT .................................................. 8-1
8.1 Air Quality .............................................................................................................. 8-1 8.2 Land ........................................................................................................................ 8-1
8.2.1 Subsurface Investigations ........................................................................... 8-3 8.3 Water Resources ..................................................................................................... 8-5
8.3.1 Floodplains.................................................................................................. 8-5 8.3.2 Shoreland Protection Areas ........................................................................ 8-5 8.3.3 Wetlands ..................................................................................................... 8-5 8.3.4 Groundwater ............................................................................................... 8-7 8.3.5 Stormwater Runoff ..................................................................................... 8-7
8.3.5.1 Stormwater Management ............................................................. 8-8 8.3.5.2 Storm Water Pollution Prevention Plan..................................... 8-10 8.3.5.3 Erosion and Sediment Control ................................................... 8-10
8.3.6 Temporary Dewatering ............................................................................. 8-11 8.3.7 Wastewater Discharges............................................................................. 8-11
8.4 Biological Resources ............................................................................................ 8-13
9.0 RARE AND UNIQUE NATURAL RESOURCES ..................................................... 9-1
10.0 UNAVOIDABLE ADVERSE EFFECTS AND MITIGATIVE MEASURES ....... 10-1
11.0 PERMITS AND APPROVALS .................................................................................. 11-1
12.0 CERTIFICATE OF NEED ......................................................................................... 12-1
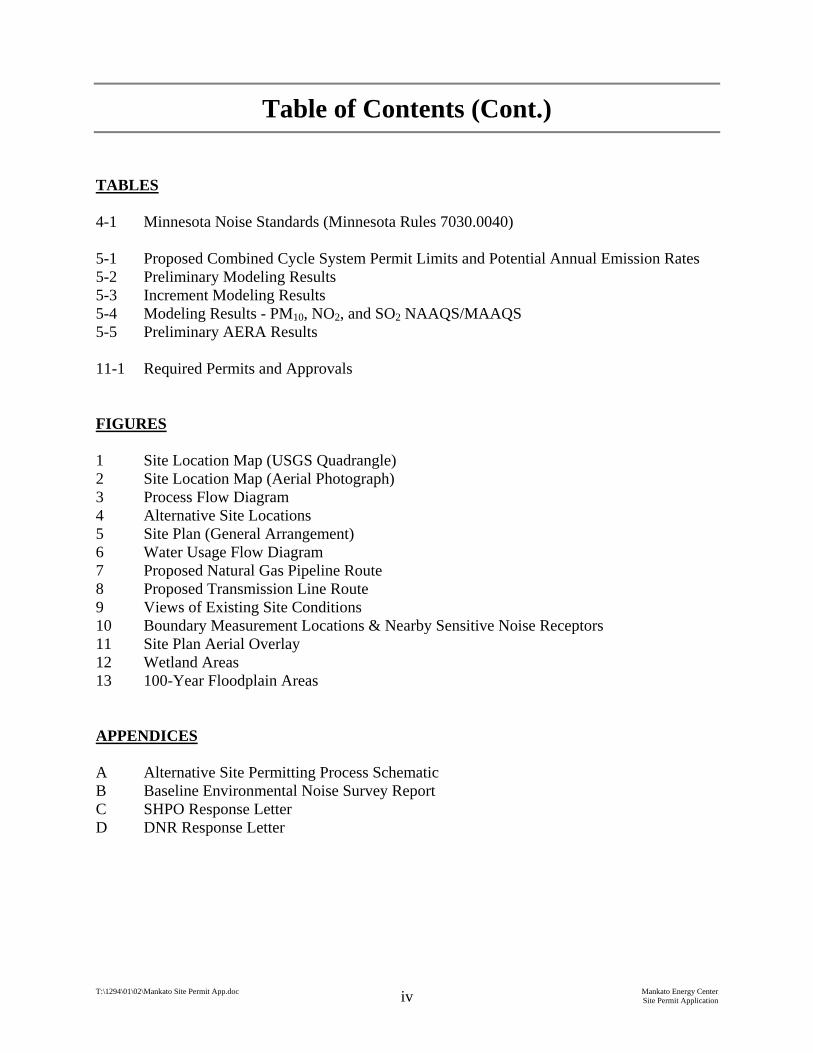
Table of Contents (Cont.)
T:\1294\01\02\Mankato Site Permit App.doc Mankato Energy Center Site Permit Application iv
TABLES 4-1 Minnesota Noise Standards (Minnesota Rules 7030.0040) 5-1 Proposed Combined Cycle System Permit Limits and Potential Annual Emission Rates 5-2 Preliminary Modeling Results 5-3 Increment Modeling Results 5-4 Modeling Results - PM10, NO2, and SO2 NAAQS/MAAQS 5-5 Preliminary AERA Results 11-1 Required Permits and Approvals FIGURES 1 Site Location Map (USGS Quadrangle) 2 Site Location Map (Aerial Photograph) 3 Process Flow Diagram 4 Alternative Site Locations 5 Site Plan (General Arrangement) 6 Water Usage Flow Diagram 7 Proposed Natural Gas Pipeline Route 8 Proposed Transmission Line Route 9 Views of Existing Site Conditions 10 Boundary Measurement Locations & Nearby Sensitive Noise Receptors 11 Site Plan Aerial Overlay 12 Wetland Areas 13 100-Year Floodplain Areas APPENDICES A Alternative Site Permitting Process Schematic B Baseline Environmental Noise Survey Report C SHPO Response Letter D DNR Response Letter
1.0 Introduction
1.1 BACKGROUND
The Minnesota Public Utilities Commission (“PUC” or “Commission”) approved the resource
planning process proposed by Northern States Power Company d/b/a Xcel Energy, in Docket E-
002/RP-00-787, In the Mater of Northern States Power Company’s Application for Approval of
its 2000-2014 Resource Plan, Order Approving Xcel Energy’s 2000-2014 Resource Plan. A part
of that approved process included a solicitation of proposals to increase its supply portfolio by
1,000 megawatts (“MW”). To meet this objective, on December 6, 2001 Xcel Energy issued a
Request for Supply Proposals with Power Deliveries Beginning 2005-2009 (the “RFP”). The
RFP outlined the baseload and peaking supply needs of Xcel Energy for the period at issue, and
encouraged potential bidders to propose any type of resource that they believed would enhance
Xcel Energy’s supply portfolio beginning in 2005 and extending into the year 2009.
Calpine Corporation (“Calpine”)1 responded to the RFP on March 14, 2002, with a bid of
approximately 280 MW baseload capacity (based on winter ambient conditions) and
approximately 360 MW in initial peaking capacity (based on winter ambient conditions) with
step increases in the peaking portion of the proposal of approximately 180 MW in the latter years
of the timeframe set by Xcel Energy in the RFP.
On June 19, 2003, Calpine was notified that it had been selected by Xcel Energy for negotiation
of a purchased power agreement (“PPA”). The negotiations, which are expected to be completed
in the very near future, contemplate the sale by Calpine and purchase by Xcel Energy of up to
290 MW baseload capacity (based on winter ambient conditions) and 85 MW of peaking
1 Calpine is the parent company of Mankato Energy Center, LLC, which is the project company organized to own the
Mankato Energy Center. There are places in this Application where Calpine and Mankato Energy Center, LLC are apparently used interchangeably. However, the intent is to be accurate in describing which entity may have been responsible for a certain action.
T:\1294\01\02\Mankato Site Permit App.doc 1-1 Mankato Energy Center Site Permit Application

capacity (year round availability). The baseload capacity will be generated by a natural gas-fired
combined cycle power plant. The peaking capacity will be generated by supplementally firing
the duct burners associated with the same source. The portion of the power plant that will supply
this electric energy is statutorily exempt from the Certificate of Need process pursuant to
Minnesota Statutes 216B.243; 216B.2422, subd.5(c). The PUC agreed with this characterization
in its order dated February 6, 2004, In the Matter of the Application of Calpine Corporation for a
Certificate of Need for a Large Electric Generating Facility, Order Granting Exemptions from
Filing Requirements and Limiting Scope (the “Exemption Order”).
In order to achieve certain construction and operational efficiencies, conserve resources (land,
water, labor, materials, etc.), and meet the expected energy growth needs in Minnesota in a
timely manner, Calpine proposes to configure the power plant that will supply power to Xcel
Energy larger than would be required solely to satisfy its obligations under the PPA. The power
supply obligations under the PPA will be met with a power plant configured with one
combustion turbine generator, one heat recovery steam generator, one steam turbine generator,
one condenser, one multi-cell cooling tower, and certain other appurtenant pieces of machinery
and equipment that are required for a safe and efficient operating power plant in the
configuration described.2 Calpine proposes to add one additional combustion turbine generator
and one additional heat recovery steam generator to the facility. The same steam turbine
generator, condenser, cooling tower, and appurtenant machinery and equipment used for the
supply of Commission-approved power will be used to supply the additional power that is
intended for sale to wholesale customers. It is the additional equipment and associated
generating capacity (approximately 355 MW (winter) and 325 MW (summer) of capacity) that
require a Certificate of Need.3
2 The power plant configuration consisting of one combustion turbine generator (“CT”), one heat recovery steam
generator {“HRSG”), one steam turbine generator (“ST”), and other appurtenant pieces of machinery and equipment described above is commonly referred to as a “1x1” configuration (meaning one CT/HRSG and one ST) or sometimes as a “1x1x1” configuration (meaning one CT, one HRSG, and one ST).
3 The type of power plant proposed by Calpine is commonly referred to as a “2x1” configuration or sometimes as a “2x2x1” configuration.
T:\1294\01\02\Mankato Site Permit App.doc 1-2 Mankato Energy Center Site Permit Application

1.2 PROJECT OVERVIEW
Mankato Energy Center, LLC (“Mankato Energy”), a wholly owned subsidiary of Calpine
Corporation, proposes to develop, construct, and operate a 2x1 natural gas-fired combined cycle
power plant to be known as the Mankato Energy Center (“Facility” or “Project”) at a location in
Blue Earth County, just north of the current Mankato city limits in Lime Township. Pursuant to
the terms of the Joint Resolution for Orderly Annexation between Lime Township and the City
of Mankato that was executed on November 12, 1997, once the Facility has received the
appropriate permits and approvals, the City of Mankato will annex the land comprising the
Facility site.
The Facility, scheduled to be operational by mid-2006, will be capable of generating
approximately 655 MW of electric power at summer ambient conditions. This generating
capacity includes both baseload capacity (approximately 505 MW) and peaking capacity
(approximately 150 MW) to be obtained from power augmentation equipment, i.e., duct firing
and steam injection. The operation of the power plant in both baseload and peaking modes is
described in more detail in Section 2.
The major equipment associated with the Facility includes the following:
• Two natural gas-fired combined cycle combustion turbine generators capable of using
low sulfur distillate oil for a back-up fuel.
• Two heat recovery steam generators each equipped with natural gas-fired duct burners.
• One steam turbine generator/condenser.
• One multi-cell mechanical draft cooling tower.
Natural gas will be delivered to the Facility through a new lateral distribution pipeline to be
installed to serve the Facility from the existing Northern Natural Gas interstate pipeline located
approximately 3.2 miles to the east of the site. Electricity generated at the Facility will be
carried through new overhead transmission line to Xcel Energy’s adjacent Wilmarth Substation
located 1,000 feet west of the site where the electricity will enter the transmission grid. Mankato
T:\1294\01\02\Mankato Site Permit App.doc 1-3 Mankato Energy Center Site Permit Application

Energy will enter into negotiations with both Northern Natural Gas and MISO to develop
interconnection agreements upon approval of the Facility.
1.3 REGULATORY PROCESS
In 1973 the Minnesota Legislature passed the Power Plant Siting Act (Minnesota Statues
116C.51-116C.69) requiring that any person who wants to build a large electric power
generating plant or high voltage transmission line is first required to obtain approval from the
Minnesota Environmental Quality Board (“EQB”) for a specific site for the plant or specific
route for the transmission line. The EQB first adopted rules for power plant siting in 1974, and
since then, the rules have been amended several times and are now found at Minnesota Rules
Chapter 4400. Consistent with state policy, the rules are intended to locate large electric
generating facilities in an orderly manner while minimizing adverse human and environmental
impacts.
In accordance with the Energy Security and Reliability Act passed by the Minnesota Legislature
in 2001 to address anticipated energy shortages in the coming years, the EQB recently amended
their rules regulating proposed large energy facilities (power plants of 50 megawatts or more and
transmission lines of 100 kilovolts or more) and administration of permits. The new Chapter
4400 rules went into effect on February 17, 2003, and are intended to streamline the
environmental review and permitting process for siting new power plants and routing
transmission lines to ensure that electric energy needs are met and fulfilled in an orderly, timely,
and environmentally sound manner.
1.3.1 Alternative Review
There are provisions in the law (Minnesota Statutes 116C.575) and new rules (Minnesota Rules
Chapter 4400.2000--4400.2950) that allow certain projects to be reviewed and approved in a
shorter, alternative process than required under the full permitting process. For example under
the alternative permitting process: a shorter environmental assessment is required instead of an
T:\1294\01\02\Mankato Site Permit App.doc 1-4 Mankato Energy Center Site Permit Application

environmental impact statement; the applicant does not have to propose any alternative sites to
the preferred site; a more informal hearing is required instead of a contented case hearing; and a
final decision must be made by the EQB within six months of receiving a complete application
as compared to 12 months under the full permitting process. A schematic prepared by the EQB
showing the alternative permitting process is included in Appendix A.
Pursuant to Minnesota Rules 4400.2000, Subp.1.B, Mankato Energy’s proposed 655 MW (at
summer ambient conditions) natural gas-fired power plant qualifies for review under the
alternative permitting process because it is a large electric power generating plant that is fueled
by natural gas. Mankato Energy provided written notice to the EQB on February 18, 2004 of its
intent to submit a site permit application for review under the alternative permitting process as
provided for in the Minnesota Rules. This notice was provided in compliance with the
requirements of Minnesota Rules 4400.2000, Subp. 2, which requires applicants to provide at
least a ten-day notice before submitting an application for a project to the EQB.
1.3.2 Site Permit Application Requirements
In accordance with Minnesota Rules 4400.2100, which define the contents of the application for
projects that qualify for the alternative review process, the following general information is
included in this site permit application:
Information on proposed ownership of the facility, permit applicant, and current
landowners.
•
•
•
•
•
•
•
Alternative sites considered and rejected.
Description of the facility and all associated equipment including size, type, and cost.
Engineering and operational design.
Future site expansion and generating capacity possibilities.
Identification of transportation, pipeline, and electrical transmission systems that will be
required to construct, maintain, and operate the facility.
Description of the proposed site and environmental setting.
T:\1294\01\02\Mankato Site Permit App.doc 1-5 Mankato Energy Center Site Permit Application

Effects of the facility on the human environment and natural environment that will be
used in preparing the environmental assessment.
•
• Listing and brief description of federal, state, and local permits that may be required for the
project.
• Documentation that a Certificate of Need application has been submitted to the PUC.
1.3.3 Environmental Assessment
Under the alternative review process, the EQB is responsible for preparing the environmental
assessment. The environmental assessment will contain information on potential human and
environmental impacts associated with the proposed project, and it is the only state
environmental review document that is required to be prepared by the EQB. The EQB will
determine the scope of the environmental assessment shortly after submittal of the site permit
application based the information provided in the application itself as well as input received
during a public meeting that will be held by the EQB to solicit comments regarding the scope of
the environmental assessment.
Once the environmental assessment has been completed, a public hearing will be held by the
EQB to review the document. The public hearing does not need to be conducted by an
administrative law judge as is required by the full permitting process, but instead will conducted
by EQB staff. Written comments received within ten days after the public hearing will also be
considered and included in the record. As stated above, a final decision on the site permit must
be made by the EQB within six months from the time the application is accepted, however, the
EQB may extend this time limit for up to three months for just cause or upon agreement of the
applicant.
1.3.4 Certificate of Need
A Certificate of Need from the PUC is required for all new power plants over 50 MW before the
EQB can issue a Site Permit. Questions regarding the need for, and the size, type, and timing of
new facilities, are ones that fall within the jurisdiction of the PUC. A project requiring a Site
T:\1294\01\02\Mankato Site Permit App.doc 1-6 Mankato Energy Center Site Permit Application

Permit must first apply for a Certificate of Need with the PUC before submitting a Site Permit
application to the EQB. Mankato Energy submitted a Certificate of Need application to the PUC
on March 2, 2004 for the additional equipment and associated generating capacity associated
with the wholesale power production of the plant (that portion of the Project that is not already
statutorily exempt from the Certificate of Need process). A copy of the Certificate of Need
application has been provided to the EQB.
Recent amendments to the EQB’s environmental review rules addressing the matter of
environmental review at the Certificate of Need stage before the PUC for proposed large electric
facilities require that the EQB prepare an environmental report (Minnesota Rules 4410.7010 to
4410.7070). The EQB has four months to complete the environmental report from the time a
copy of the Certificate of Need application is received. The new rules also allows the PUC and
EQB to consolidate the Certificate of Need and site permitting proceedings and hold one public
hearing if it is agreed upon by the both parties that consolidation is feasible, more efficient, and
may further the public interest.
Furthermore, the new rules also recognize that in the event the applicant for a Certificate of Need
also applies to the EQB at the same time for a Site Permit for a specific site and the project
qualifies for the alternative review under Part 4400.2000, the EQB may elect to prepare an
environmental assessment in lieu of the environmental report required under Parts 4410.7010 to
4410.7070. Mankato Energy is submitting the Certificate of Need and Site Permit applications
in a roughly concurrent timeframe (i.e. within a few days) and has requested that the two
proceedings be combined and that one environmental review document be prepared by the EQB.
T:\1294\01\02\Mankato Site Permit App.doc 1-7 Mankato Energy Center Site Permit Application

2.0 Project Description
2.1 OWNERSHIP
The proposed Facility will be built, owned, and operated by Mankato Energy Center, LLC
(“Mankato Energy”), a wholly owned subsidiary of Calpine Corporation (“Calpine”), an
independent power producer.
The following person should be contacted regarding any information presented in this
application:
Jason M. Goodwin, P.E. Regional Manager - Safety, Health & Environmental Midwest Power Region Calpine Corporation 4100 Underwood Road Pasadena, Texas 77507 Phone 832-476-4463 Fax 281-291-7089 Email [email protected]
2.2 PERMITTEE
The permittee to be named on the Site Permit is Mankato Energy Center, LLC. Transfer of the
permit is not contemplated at this time.
T:\1294\01\02\Mankato Site Permit App.doc 2-1 Mankato Energy Center Site Permit Application

2.3 SIZE AND TYPE
Mankato Energy proposes to build a power plant (the “Facility”) capable of producing
approximately 655 megawatts of electricity (at summer ambient conditions) using natural gas-
fired combustion turbines in a combined cycle configuration. Low sulfur distillate oil will be
used as a back-up fuel to ensure uninterrupted operation of the Facility. The Facility will be
designed to include two combustion turbine generators, two heat recovery steam generators
equipped with natural gas-fired duct burners, one steam turbine generator with associated heat
rejection system, and various appurtenant machinery and equipment required for a safe and
efficient operating power plant. A simplified process flow diagram for the combined cycle
turbines associated with the Facility is shown in Figure 3.
Cooling and process water will be supplied by treated wastewater effluent taken from the
municipal wastewater treatment system, located approximately one mile due south of the Facility
site on the east bank of the Minnesota River. The municipal wastewater will be treated prior to
delivery to the Facility at a new treatment facility that is anticipated to be located on land
adjacent to the existing municipal treatment plant. Cooling water and low-volume wastewater
will be discharged to the Minnesota River in accordance with applicable discharge limits.
The Facility will be connected by pipeline to the Northern Natural Gas pipeline located
approximately 3.2 miles east from the Facility site. The Facility will access the transmission grid
via Xcel Energy’s Wilmarth Substation located approximately 1,000 feet west of the site.
A more detailed description of the Facility is provided in Section 2.7
2.4 SITE LOCATION
The proposed Facility site is located just north of the Mankato city limits in Lime Township in
Blue Earth County, in the southwest ¼ of Section 31, Township 109N, Range 26W. The site is
located within an area zoned for industrial use. It is situated on the southern portion of an old
T:\1294\01\02\Mankato Site Permit App.doc 2-2 Mankato Energy Center Site Permit Application

limestone quarry that has been mined to completion and currently serves as a demolition waste
landfill and composting facility owned and operated by the Southern Minnesota Construction
Company, Inc. (“SMC”). The site is approximately 25 acres in size. The Facility location is
shown in Figures 1 and 2.
The site is located east of U.S. Highway 169, north of U.S. Highway 14, and west of County
Road 5 (3rd Avenue). A set of railroad tracks no longer in use runs along the south side of the
site. Access to the site is provided from the south off Summit Avenue. Industrial and
manufacturing facilities located adjacent to the site include Xcel Energy’s Wilmarth Generating
Plant, a waste processing company, auto salvage yards, scrap metal operations, a construction
company, a U.S. Postal Service mail processing facility, and a household hazardous waste
collection site. The closest residential dwelling is located approximately 1,500 feet from the
center of the site. The nearest residential areas of Mankato lie more than one-half mile to the
south on the other side of U.S. Highway 14.
The City of Mankato and Lime Township entered into a Joint Resolution for Orderly Annexation
in 1997, whereby the parties agreed that the City of Mankato would annex areas in Lime
Township to be developed for residential, commercial, industrial, and governmental purposes so
as to encourage orderly urban development using municipal services in a responsible, controlled,
and environmentally sound manner.
2.5 PROPERTY OWNER
Mankato Energy currently holds an option to purchase the site for the proposed Facility. The
property is part of a larger parcel of land currently owned by SMC. Mankato Energy anticipates
that it will exercise their option with SMC to obtain approximately 25 acres of land once it has
received all necessary permits and approvals for the Facility. This parcel includes a portion of a
the railroad tracks that runs along the southern end of the site, which is being purchased by SMC
and will be sold to Mankato Energy as part of the overall Facility site.
T:\1294\01\02\Mankato Site Permit App.doc 2-3 Mankato Energy Center Site Permit Application

2.6 ALTERNATIVE SITES CONSIDERED AND REJECTED
The parent company of Mankato Energy, Calpine, specializes in the development, construction,
and operation of combined cycle natural gas-fired facilities. One element of that specialization
consists of identifying areas within the United States that have energy needs. In some instances,
this decision is made quite simple when a local utility puts out a request for power supply
proposals. This was the case with this Facility; Calpine was selected to negotiate an agreement
with Xcel Energy for a portion of the Facility output. In other instances, the search is geared
toward identifying areas that have a need for energy and one or more utilities or other load-
serving entities that are receptive to contracting long-term for the purchase of electric power.
Calpine identified the geographic area served by Mid-Continent Area Power Pool (“MAPP”) as a
region where additional energy supplies were needed and is currently soliciting other nearby
utilities for power sales for the remaining portion of the Facility output.
Once the greater geographic area in which the need for electrical energy was identified, Calpine
sought to find a specific location within that geographic region in which to develop a power
generating project. Initial screening criteria used in determining the power plant location in
Minnesota included the following:
• Proximity to major electric transmission infrastructure, including adequately sized
transmission lines and substations.
• Proximity to adequately sized high-pressure natural gas pipeline(s).
• Proximity to adequate water supply (surface water, groundwater, or gray water from a
nearby water treatment facility).
• Avoidance of environmentally sensitive areas.
• Community acceptance and support.
Upon completion of the screening evaluation process, Calpine determined that the best location
for the Facility was in the Mankato area. In some instances, Calpine considered and rejected
certain locations because they did not meet the initial screening characteristics described above.
T:\1294\01\02\Mankato Site Permit App.doc 2-4 Mankato Energy Center Site Permit Application

In other instances, alternative sites were rejected because the advantages offered by the sites located
near Mankato were far superior to those alternatives in other parts of Minnesota. Once the
preferred location for the Facility was narrowed down to the Mankato area, Calpine conducted a
more detailed evaluation of potential sites. In addition to the proposed project site described
above, three other potential sites within Lime Township were considered. These alternative sites
are shown on Figure 4.
In addition to the initial screening criteria, Calpine evaluated specific criteria listed below in the
final site selection process considered important to the success of the project.
• Avoidance or minimization of human and environmental impacts.
• Distance from man-made features such as residential areas, airports, schools, hospitals,
campgrounds, parks, and tourist attractions.
• Land availability and landowner agreement.
• Topography.
• Proximity to existing rights-of-way (e.g., railroad easements, roadway shoulders,
transmission line rights-of-way, gas pipeline rights-of-way, bike paths, etc.) for off-site
lateral connections so as to avoid or minimize new impacts.
• Favorable construction conditions (e.g., adequate site access, avoidance of existing
utilities, and minimization of earthwork activities).
• Appropriate site zoning designation.
• Availability of municipal services (sewer and water).
• Consultation with state and local governmental agencies including the EQB, Minnesota
Pollution Control Agency (“MPCA”), Minnesota Department of Natural Resources
(“DNR”), Blue Earth County, and City of Mankato.
After careful consideration of these more refined siting criteria, the proposed site was determined
to be the most suitable location for the Facility. The main reasons for rejecting the other sites
were as follows:
• Greater distances from city municipal services (sewer, water, gray water) resulting in
T:\1294\01\02\Mankato Site Permit App.doc 2-5 Mankato Energy Center Site Permit Application

higher utility infrastructure costs. The preferred site is located immediately north the
Mankato city limits.
• Higher infrastructure costs to tie into the electric grid. The preferred site is located
immediately east of the existing Wilmarth Substation.
• Required rezoning. The preferred site is located in an area currently zoned for industrial
use while some of the alternative sites are not.
• Poor site access. The preferred site is accessible from the south via an existing driveway
off Summit Avenue that currently serves the SMC demolition waste landfill while access
roads would need to be constructed to the other sites. Also, the preferred site has access
to a rail spur that may be used to transport heavy equipment and materials.
• Greater potential for environmental impacts based on the above as well as other factors
considered.
2.7 ENGINEERING AND OPERATIONAL DESIGN
The Facility will be a combined cycle combustion turbine power electricity generating facility
fueled primarily by natural gas. The Facility will have the capacity to generate approximately
655 MW of electricity, at summer ambient conditions, and transmit that electricity to a part of
the electrical grid owned by Xcel and controlled by the Midwest Independent System Operator
(“MISO”).
The Facility will receive natural gas from a local area pipeline (primary fuel supply), distillate oil
(secondary fuel supply) and non-bulk chemicals by truck, and electricity for backup power
supply from Xcel Energy. The Facility will receive potable water from the Mankato municipal
water supply system, and process water from the Mankato wastewater treatment plant
(“WWTP”).
T:\1294\01\02\Mankato Site Permit App.doc 2-6 Mankato Energy Center Site Permit Application

Major equipment to be installed at the Facility will include:
• Two natural gas-fired combined cycle combustion turbine generators, capable of using
low sulfur distillate oil as a secondary fuel.
• Two heat recovery steam generators, each equipped with natural gas-fired duct burners.
• One steam turbine generator.
• A multi-cell mechanical draft evaporative cooling tower.
• Certain other appurtenant pieces of machinery and equipment required for a safe and
efficient operating power plant in the configuration described.
The proposed layout of the Facility is presented in Figure 5. Flow diagrams for the fuel handling
process and plant water usage are provided in Figures 3 and 6. The Facility fuel supply, major
equipment, and transmission considerations are discussed in more detail below.
The Facility potentially will generate base load, intermediate load and peak load electricity. The
Facility’s total electricity generating capacity of 655 MW will be composed of approximately
505 MW base load capacity at summer ambient conditions and 150 MW peak load service at
summer ambient conditions. At winter ambient conditions, the Facility will have approximately
580 MW base load capacity and 150 MW peaking capacity.
The 505 MW base load capacity of the Facility will be generated from the two combustion
turbine-driven generators and the single steam turbine-driven generator. The steam turbine
receives steam from the heat recovery steam generators (“HRSGs”), which use the waste heat
from the combustion turbine exhaust streams to produce steam. Supplemental firing of the duct
burners associated with the HRSGs will generate the 150 MW peak load capacity. This
combined cycle plant will offer a large efficiency advantage over a conventional simple-cycle
plant, which relies only on combustion turbine-driven generators. Injecting steam into the
combustion turbines can further augment the peak load generating capacity.
T:\1294\01\02\Mankato Site Permit App.doc 2-7 Mankato Energy Center Site Permit Application

2.7.1 Primary Fuel Supply: Natural Gas
The primary fuel for the Facility will be natural gas. Natural gas will be delivered through a new
lateral pipeline approximately 3.2 miles in length connecting the Facility to a branch of the
Northern Natural Gas Company mainline, just downstream of Northern Natural Gas Company’s
interconnection with Northern Border Gas Company at Welcome, Minnesota. At this connection
point, Northern Natural Gas Company currently receives up to 175 million standard cubic feet
per day (“MMscf/day”). This segment of the Northern Natural Gas Company’s system is further
reinforced by connections with their other north-south lines that run between Ventura and the
Minneapolis-St. Paul market. Due to the Facility’s close proximity to this existing large volume
gas pipeline system, construction of the Facility is not expected to require significant investment
in new pipeline facilities.
The Facility will have a peak daily gas requirement of approximately 135 MMscf/day at the peak
winter firing condition. On average, the Facility is expected to use about 32,500 MMscf per
year, or an average of 89 MMscf/day. By comparison, an average residential customer
consumes approximately 0.1 MMscf/day.
Designing the Facility with natural gas as the primary fuel source will yield significantly lower
impacts to the environment than using oil as a primary source. For example, emissions of sulfur
dioxide (“SO2”), carbon monoxide (“CO”), nitrogen oxides (“NOx”), and particulate matter
(“PM”) will all be lower because of the use of natural gas as the primary fuel instead of fuel oil.
Water use will also be slightly lower. However, during periods when gas supplies in Minnesota
are constrained because of high demand or a disruption of pipeline deliveries, the combustion
turbines will have the capability to switch to low sulfur distillate fuel oil as an alternate fuel for
limited periods.
2.7.2 Secondary Fuel Supply: Low Sulfur Distillate Fuel Oil
Above ground storage tank(s) will be installed at the Facility to store low sulfur distillate fuel oil
as a back-up fuel supply during periods when natural gas is not available and the Facility must
T:\1294\01\02\Mankato Site Permit App.doc 2-8 Mankato Energy Center Site Permit Application

generate and supply electricity to the grid. The storage capacity of the tank(s) will be as much as
900,000 gallons, which represents approximately 36 hours of uninterrupted electricity generation
at the Facility when operating both combustion turbines at baseload. Mankato Energy has
agreed to limit the Facility’s use of the fuel oil to 875 operating hours per year per combustion
turbine (based on an 12-month rolling average).
The fuel oil storage tank(s) will be located in the southwest portion of the Facility and will be
constructed with a tank within a tank design, which is designed to contain 110 percent of the
tank’s working volume and will meet the compliance requirements of all applicable state
aboveground storage and federal SPCC regulations. The low sulfur distillate fuel oil will be
delivered to the Facility via tanker truck. The tanker truck unloading area will also be equipped
with secondary containment in accordance with federal SPCC requirements. The incorporation
of low sulfur distillate fuel oil capability increases the operating flexibility of the Facility in that
having the ability to switch fuel sources can mitigate the restrictions or interruptions of natural
gas supplies.
2.7.3 Natural Gas-fired Combustion Turbines
The Facility will be equipped with two natural gas-fired combustion turbines located outdoors in
the central portion of the Facility. The combined cycle combustion turbines will be Siemens-
Westinghouse 501FD model turbines and will have an output of approximately 290 MW each
(combined cycle mode at winter ambient conditions). Each combustion turbine generator will be
3,600 rpm, 18kV or 15 kV, three phase, 60 Hz design. The maximum firing capacity of each
combustion turbine will be 2,040 million British thermal units per hour (“MMBtu/hr”) based on
higher heating value (“HHV”) of the fuel while firing natural gas and 2,052 MMBtu /hr (HHV)
when firing on fuel oil (both ratings at winter ambient conditions). The combustion turbines also
are capable of injecting steam into the combustion chamber to provide additional output during
periods of large electrical power demand. Steam augmentation is limited to 1,500 hours per year
per turbine.
T:\1294\01\02\Mankato Site Permit App.doc 2-9 Mankato Energy Center Site Permit Application

Ambient air will be drawn into the combustion turbine compressor, compressed, and directed to
the combustion chamber where natural gas is introduced, mixed with the compressed air, ignited
and burned. The turbines are equipped with dry low-NOx (“DLN”) combustors, which are used
when firing natural gas, as well as water injection equipment that is used during periods of fuel
oil firing. Each of these systems is used to control emissions of NOx within the combustion
turbine.
The resulting hot gases from the combustion chamber will be directed to the turbine section
where they will expand across a series of turbine blades, causing those blades to rotate. The
rotating blades will turn a shaft connected to an electric generator. Each combustion turbine
generator will then convert the mechanical energy from the rotating combustion turbines into
electrical energy. Electricity from the combustion turbine generators will be transferred along
above ground electrical bus duct to the transformer yard.
2.7.4 Heat Recovery Steam Generators
In this “combined cycle” plant, hot gases exhausted from each combustion turbine are directed to
a heat recovery steam generator. The heat in the exhaust gas, which would otherwise be directed
(wasted) up the exhaust stack, converts water that flows through tubes in the HRSG into steam.
The steam that is produced in each of the two HRSGs is directed to the single steam turbine
where it passes through a series of blades that rotate the steam turbine generator producing
additional electric power. Steam exiting the steam turbine is condensed into water and returned
to the HRSG for recirculation. The two HRSGs will be located outdoors and situated in line with
(and adjacent to) the two natural gas-fired combustion turbines.
Each HRSG will be designed to supply high-pressure steam to the steam turbine at a sliding
pressure between 1,200 psia and 2,200 psia at 1,050 oF. Inside the HRSGs are tubes containing
water, which the combustion turbine exhaust gases heat into steam. The HRSGs are multiple-
pressure, reheat-type steam generators capable of increased steaming output during periods of
higher ambient temperature. The pressure sections of each HRSG consist of an economizer,
T:\1294\01\02\Mankato Site Permit App.doc 2-10 Mankato Energy Center Site Permit Application

evaporator and superheater. Each HRSG will also be equipped with a reheater to improve cycle
efficiency further.
The HRSGs will be equipped with natural gas-fired duct burners used for supplemental duct
firing of the combustion turbine exhaust gases, to provide additional peaking capacity at the
steam turbine. Each duct burner incorporates a low-NOx burner technology and has a maximum
heat input rate of 800 MMBtu/hr.
A selective catalytic reduction system (“SCR”) will be used in each HRSG downstream of the
duct burners to reduce NOx emissions from the combustion turbines and duct burners. An
oxidation catalyst module will also be used in each HRSG to reduce emissions of CO and
volatile organic compounds (“VOCs”).
The exhaust gas from each HRSG will be directed to an exhaust stack. Exhaust stack emissions
will comply with the federally enforceable air emissions permit to be issued by the MPCA.
Anhydrous ammonia will be used in each of the Facility HRSGs as an SCR reagent. Ammonia
will be distributed to both HRSGs from two aboveground storage tanks, each with a 12,000-
gallon storage capacity. The ammonia tanks will be situated in the northeastern portion of the
Facility, west of the northern extent of the cooling towers. Ammonia will be delivered to the
tank via tanker truck and will be transferred from the main storage tank to each of the ammonia
injection skids situated immediately north of each HRSG.
2.7.5 Steam Turbine Generator
The Facility will be equipped with one condensing steam turbine, one hydrogen-cooled steam
turbine generator, and one associated steam turbine cooling system. The steam turbine generator
will be equipped with one heat rejection system. The condensing steam turbine and the steam
turbine generator will be placed in a weather enclosure.
T:\1294\01\02\Mankato Site Permit App.doc 2-11 Mankato Energy Center Site Permit Application

The steam turbine generator will be 3,600 rpm, 18kV, three phase, 60 Hz design, and will
convert mechanical energy from the rotating steam turbine into electrical energy. The steam
turbine will have the capacity to generate approximately 330 MW of additional electrical power.
Electricity from the steam turbine generator will be transferred along aboveground electrical bus
duct to the transformer yard.
The steam turbine will be a multiple admission, reheat, condensing turbine designed for sliding
pressure operation. The steam turbine will have its own lube and control oil systems, sized to
provide additional peaking capacity.
The high-pressure portion of the steam turbine will receive high-pressure superheated steam
from the two HRSGs, and then exhaust steam into the HRSG reheat section. Reheated steam will
be supplied to the intermediate pressure turbine section, which exhausts steam into the low-
pressure turbine section. The low-pressure turbine receives low-pressure superheated steam, and
exhausts steam into the condenser. Steam is then condensed into water, pumped to pressure and
returned to the HRSG for recirculation.
The steam turbine condenser converts exhausted steam from the steam turbine back into liquid
water so that it can again be returned to the HRSGs to be converted into steam. The steam
turbine condenser receives fresh demineralization water, cold water from the cooling tower and
exhausted steam from the steam turbine.
In the condenser, heat is transferred from the exhausted steam to the cooling tower cool water;
the resulting warm water is then returned to the cooling tower. Because the steam turbine
generator will use steam in a closed cycle, no additional air pollutants will be generated from this
portion of the Facility.
2.7.6 Raw Water Treatment System
Raw water will be supplied to the Facility for use as process water and non-contact cooling
water. The raw water supply source will be treated wastewater effluent or “gray water” from the
T:\1294\01\02\Mankato Site Permit App.doc 2-12 Mankato Energy Center Site Permit Application

City of Mankato’s WWTP, located approximately one mile due south of the Facility on the east
bank of the Minnesota River. Please refer to Figure 6 for a water usage flow diagram for the
Facility showing estimated flow values for the various water streams for both annual average and
summer average (maximum conditions).
The Facility will draw about 2.58 million gallons of water per day (“MGD”) on average and
about 4.88 MGD at maximum conditions from the Mankato WWTP. Prior to conveyance and
use at the Facility, effluent will be further treated in a new treatment system to be constructed
adjacent to the Mankato WWTP (proposed to be installed by Mankato Energy). The new gray
water treatment system will provide additional filtering and chlorination of the gray water in
order to meet the Facility’s process water quality needs. Additionally, a storage pond will be
constructed at the WWTP to provide a limited backup supply of cooling water for the Facility in
the unlikely even that the WWTP remains off-line for a limited period
Gray water from the Mankato WWTP will be piped directly to the Facility’s approximate 1.5
million gallon capacity above ground raw water storage tank, situated in the southeastern portion
of the Facility, west of the cooling towers. Water from the raw water storage tank will be
transferred as needed to the cooling tower and the HRSG quench water system. If required for
reliable service, a small service water tank (~10,000 gallons) may be installed to store potable
water prior to conveyance to the reverse osmosis (“RO”)/demineralizer and service water
system.
The Facility’s service water system will supply water to all general plant water use activities at
the Facility such as hose bibs, pump sealing water, and eye wash stations. The Facility’s service
water system will use approximately 10,000 gallons per day of potable water. Approximately
580,000 gallons per day of gray water will be discharged as quench water to the HRSG
blowdown tank.
T:\1294\01\02\Mankato Site Permit App.doc 2-13 Mankato Energy Center Site Permit Application

2.7.7 Demineralized Water Storage Tanks
The Facility will have two above ground storage tanks for demineralized water that are situated
outdoors in the central portion of the Facility. These storage tanks will each have a capacity of
approximately 200,000 gallons. The storage tanks will be connected to the circulating water
lines. Potable water from the City of Mankato distribution system will be pumped to the
RO/demineralization system for processing, then to the demineralized water storage tanks.
Demineralized water from these two tanks will be used in the Facility for steam cycle makeup
(HRSG and auxiliary boiler), as well as other purposes including combustion turbine on-line and
off-line compressor washes, steam injection, water injection for NOx control and inlet air
fogging. The off-line compressor wash water generated from washing the combustion turbines
to remove particulates accumulated on the compressor blades will be collected and disposed off-
site. All other uses of demineralized water will result in water emitted to the atmosphere as
vapor.
2.7.8 Cooling Tower
The Facility will be equipped with a multi-cell evaporative cooling tower, situated along the
eastern side of the Facility property. The cooling tower will cool hot water from the steam
turbine condenser and other heat loads, such as generators and lube oil systems, and return the
cooled water for reuse. The cooling tower will receive gray water at a rate of 2.50 MGD on
average and 4.86 MGD at maximum conditions to replace water lost to evaporation and
blowdown from cooling operations. The cooling tower will also receive small quantities of
recycled water from the oil/water separator and the HRSG blowdown tank.
Fans located at the top of each cooling tower unit will maintain a draft within the cooling tower.
The heated cooling water from the condenser will cool as it falls through the baffles from the top
of the cooling tower to a basin at the bottom. Approximately 1.95 MGD (average) and 3.72
MGD (maximum) of gray water will be emitted to the atmosphere from the cooling towers
through evaporation. Evaporative losses from the cooling towers will increase the dissolved
solids concentration of the cooling tower water. Due to the nature of this type of equipment, a
T:\1294\01\02\Mankato Site Permit App.doc 2-14 Mankato Energy Center Site Permit Application

portion of the total dissolved solids contained in the cooling water is emitted in the form of
particulate matter. Estimated air pollutant emission rates from the Facility cooling tower are
addressed in Section 5.
The cooling tower will operate with a water circulation rate of approximately 180,000 gallons
per minute. The cooling tower will have a liquid drift rate of approximately 0.0005 percent of the
water circulation rate, which will be achieved through the use of high efficiency (low-drift) mist
eliminators.
The cooling tower will receive chemical feeds from the chemical storage enclosure situated
approximately 75 feet west of the cooling tower. The chemicals will be stored in small quantities
and will be used to assist in maintaining the appropriate water quality parameters for efficient
operation of the cooling tower system.
The cooling tower will discharge water as cooling tower blowdown to maintain the appropriate
quality of water in the cooling tower system. The cooling tower blowdown, which will be
directed to the Minnesota River under a National Pollution Discharge Elimination System
(“NPDES”) wastewater discharge permit, will be treated onsite with a phosphorus removal and
dechlorination system prior to discharge to the river.
2.7.9 Wastewater Collection/Treatment Systems
Process wastewater will be collected and treated at the Facility prior to discharge to the
Minnesota River as authorized under an MPCA-issued NPDES wastewater discharge permit.
Approximately 0.68 MGD (average) and 1.44 MGD (maximum) of wastewater will be generated
from the combination of the following in-plant sources:
Cooling tower blowdown (85-95 percent). •
• RO/demineralization system (5-15 percent).
T:\1294\01\02\Mankato Site Permit App.doc 2-15 Mankato Energy Center Site Permit Application

Gray water from the Mankato WWTP that is treated and routed to the Facility would otherwise
be discharged directly to the Minnesota River under the Mankato WWTP’s existing NPDES
permit. Because this gray water will be further treated prior to being piped to the Facility, and
because the wastewater generated from the Facility will be treated to remove phosphorus and
chlorine prior to discharge from the Facility (as discussed above), it is anticipated that
phosphorus and total suspended solids loads to the Minnesota River will decrease as a result of
the Facility’s planned water use and discharge.
Two wastewater sump and pump systems will be installed at the Facility in outdoor locations.
One of the sumps will be on the west side of the Facility located near the step up transformer
containment basins. The other sump will be located east of Combustion Turbine No. 2. These
wastewater sump and pump systems will drain to the Facility oil/water separator.
The oil/water separator will be situated west of the cooling tower and approximately southeast of
the cooling tower chemical feed enclosure. Water from the oil/water separator system will be
recirculated into the cooling tower. Oil/sludge from the oil/water separator system will be
collected and shipped off-site for appropriate disposal as a waste material.
The Facility will be equipped with a blowdown tank, which will receive discharge water from
the HRSG and quench water from the raw water tank. Approximately 98 percent of the water
from the blowdown tank will be recirculated to the cooling towers, and the resulting 2 percent
will be flash-evaporated to the atmosphere.
Stormwater generated at the Facility will be managed in one of two ways. Stormwater runoff
that comes into contact with the outdoor steam generator step-up transformer pad and
combustion turbine pads, where there is potential for pollutant contamination by oils and other
chemicals from pumps and motors, will be confined within curbed areas and drain to two area
wastewater sump pump systems. The stormwater that is collected in the wastewater sumps will
then be pumped to the Facility’s oil/water separator and recycled into the cooling tower make-up
water system.
T:\1294\01\02\Mankato Site Permit App.doc 2-16 Mankato Energy Center Site Permit Application

Stormwater runoff from non-process areas of the Facility will be routed to the on-site stormwater
detention pond that will discharge to the existing drainage ditch along the east side of the site
that flows into the Minnesota River. Stormwater discharges from the site and detention pond
will be regulated under an NPDES general stormwater discharge permit and conditional use
permit.
Domestic wastewater generated from the Facility (i.e., bathrooms and sink areas in the
administrative building and water treatment building) will be discharged directly to the City of
Mankato sanitary sewer system. This discharge will be authorized by the City of Mankato and
subject to any appropriate discharge limits and monitoring requirements.
2.7.10 Other (Ancillary) Structures/Buildings
Certain other pieces of machinery and equipment that are required for a safe and efficient
operating power plant include:
• Auxiliary boiler.
• Emergency generator.
• Fire suppression systems, including a diesel-fueled fire pump.
• Fuel supply systems, consisting of a natural gas conditioning system and a distillate fuel
oil storage and handling system.
• Steam supply piping.
• Plant electrical systems.
• Plant buildings.
2.7.10.1 Auxiliary Boiler
There will be one auxiliary boiler installed at the Facility to provide steam for sparging HRSG
drums, condenser hotwell, and cooling tower basin to prevent freezing so that the Facility can
remain in ready-to-start status throughout the year. The auxiliary boiler will only run when the
plant is offline; even then, auxiliary boiler operation is likely only in the winter. The auxiliary
T:\1294\01\02\Mankato Site Permit App.doc 2-17 Mankato Energy Center Site Permit Application

boiler will be situated in the north-central portion of the Facility, just north of the northern
combustion turbine and HRSG.
The auxiliary boiler will receive water from the demineralized water tanks as part of the
Facility’s demineralized water system. Water discharged from the auxiliary boiler will be piped
to its blowdown tank and ultimately the cooling tower.
The auxiliary boiler will be capable of burning natural gas at a maximum firing capacity of 70
MMBtu/hr. The auxiliary boiler will not require a backup fuel supply such as low sulfur distillate
fuel oil. A 100-foot high exhaust stack will vent exhaust gas from the auxiliary boiler.
2.7.10.2 Emergency Generator
The Facility will be equipped with a 1,850 horsepower diesel fuel-powered electric generator
able to produce the relatively small amount of electrical power required to provide power to in-
house critical components in the event of a loss of station power. The emergency generator has a
maximum heat input capacity of 12.2 MMBtu/hr, and will operate no more than 300 hours per
year.
The emergency generator will be equipped with two skid-mounted 2,000-gallon capacity diesel
fuel tanks. Secondary containment will be provided for the diesel fuel tanks. The emergency
generator will be situated in the western portion of the Facility, immediately south of
Combustion Turbine Generator Step-up Transformer No. 2.
2.7.10.3 Fire Suppression Systems
The Facility will be equipped with one centrifugal electric pump and one back-up diesel driven
fire pump, if it is determined that the City of Mankato’s water supply system will not be able to
supply adequate flow to supply an underground fire water header. The header will supply water
to yard hydrants and installed sprinkler deluge systems. A jockey pump will maintain water
pressure in the firewater distribution header.
T:\1294\01\02\Mankato Site Permit App.doc 2-18 Mankato Energy Center Site Permit Application

The combustion turbine enclosures will be equipped with a carbon dioxide fire suppression
system. The low sulfur distillate fuel oil tank will be equipped with a foam suppression system.
The low sulfur distillate fuel oil unloading station will be equipped with foam nozzle and hose
stations for use in fire-fighting activities.
A 290-horsepower diesel engine-driven firewater pump will only be operated in the event of a
fire and loss of power to the electric motor-driven firewater pump. The firewater pump will be
equipped with a 300-gallon capacity diesel fuel tank. Secondary containment will be provided
for the diesel fuel tank. The diesel engine-driven firewater pump has a maximum heat input
capacity of 2.0 MMBtu/hr and will operate no more than 300 hours per year.
2.7.10.4 Plant Buildings
There will be an administrative/maintenance/warehouse/control building on the southern-most
portion of the site. A parking lot for employees and visitors will adjoin the administrative
building to the east and will be composed of one alley way and approximately 20 parking stalls.
The water treatment building will be situated just north of the administrative building and
employee parking lot. The water treatment building will contain the sample panel and lab, cycle
chemical feed, electrical switchgear and motor control centers, RO/demineralizer system and
redundant air compressors and dryers. A sump and pump that discharges to the cooling tower
will be situated in the outdoor area south of the water treatment building.
The steam turbine generation building will be situated immediately north of the administrative
building and will house the steam turbine, the hydrogen cooled steam turbine generator, steam
turbine auxiliary skids, condenser, and condensate pumps.
T:\1294\01\02\Mankato Site Permit App.doc 2-19 Mankato Energy Center Site Permit Application

2.7.11 Transformers
All electricity generated from the two combustion turbine generators and the steam turbine
generator is transferred to generator step-up transformers (one for each generator). The generator
step-up transformers will increase voltage from 18kV (steam turbine) or 15 kV (combustion
turbine) to either 345 kV or 115 kV. An ISO phase bus duct will be used to transfer electricity
from the generators to the generator step up transformers. Auxiliary transformers will be
installed to step down the combustion turbine generators 15 kV output to 4.16 kV. The 4.16 kV
power will be used to supply the Facility’s auxiliary load.
2.7.12 Switchyard
The switchyard will be a 75-feet by 485-feet area situated along the west edge of the Facility
property. The switchyard will consist of a high-side breaker and disconnect switch for each
generator unit connected to a dead-end structure. Xcel will connect transmission lines to these
dead-end structures to transport the high voltage electricity to the existing Wilmarth substation.
The interconnection will consist of two separate voltages, 345 kV and 115 kV.
2.7.13 Transmission
The Facility will transmit electricity from the switchyard through dedicated overhead
transmission lines extending due west from the site to Xcel Energy’s Wilmarth Station for
distribution within MAPP. The substation will be expanded on the north side to accommodate
the interconnection. The approximate length of the transmission lines is 1,000 feet and they will
be contained entirely on Xcel Energy’s property.
2.8 COST ESTIMATE AND DESIGN LIFE
The estimated cost of the Facility based in preliminary engineering estimates and evaluation of
market conditions is $240 million. This includes design and engineering, procurement of
T:\1294\01\02\Mankato Site Permit App.doc 2-20 Mankato Energy Center Site Permit Application

equipment, site preparation, building construction, equipment installation, plant start-up and
testing, and other costs associated with development and construction of the Facility. The
Facility is anticipated to have a useful life of at least 30 years.
2.9 FUTURE SITE EXPANSION AND GENERATING CAPACITY POSSIBILITIES
The proposed Facility will be constructed on an existing industrial site and will be designed as a
stand-alone facility to generate 655 megawatts (at summer conditions) of electricity for export
and sale to Xcel Energy and other customers. While there are no plans for future expansion of
the Facility to increase electrical output, Mankato Energy may elect to build the Facility in
stages. In such event, the construction of the first combustion turbine, the first HRSG, and the
steam turbine, along with all associated machinery and equipment, would commence
immediately. The second combustion turbine and the second HRSG would be installed at a
future date.
T:\1294\01\02\Mankato Site Permit App.doc 2-21 Mankato Energy Center Site Permit Application

3.0 Infrastructure Needs and Connections
3.1 TRANSPORTATION
The existing roadway network and site access road are adequate to serve the Facility and no
transportation improvements will be required for construction or operation. Access to the site is
provided west of 3rd Avenue off Summit Avenue via an existing paved road that currently serves
the demolition waste landfill. The closest main highway serving the facility is Highway 14
located approximately one-half mile to the south. A diamond intersection is located at the 3rd
Avenue crossing providing a safe entrance and exit to and from the highway.
3.2 GAS PIPELINE
As discussed in Section 2.71, Northern Natural Gas will supply natural gas to the Facility
through a new 12 or 16-inch diameter service distribution line with a maximum operating
pressure of 800 psi. The distribution line will be buried underground and connect into the
existing Northern Natural Gas 16-inch diameter interstate pipeline located approximately 3.2
miles east of the site near the Mankato Municipal Airport. A gas metering station will be
constructed either near the connection point at the pipeline tap or at the Facility on the project
site (downstream of the metering station, the operating pressure will be 475 psig). The proposed
route for the supply line from its connection at the Northern Natural Gas line to the Mankato
Energy site is shown on Figure 7 and generally follows an existing 115 kV transmission line
right-of-way, thus minimizing potential impacts to affected landowners. The pipeline would
require a 50-foot construction easement and 30-foot permanent right-of-way and would be
constructed using standard construction practices.
T:\1294\01\02\Mankato Site Permit App.doc 3-1 Mankato Energy Center Site Permit Application

The Mankato Energy Center will be a significant new gas load in comparison to the current size
of the Minnesota market. However, because of the Facility’s close proximity to Northern
Natural Gas’s existing large volume gas pipeline system and the Facility’s capability to switch to
low sulfur distillate fuel oil as an alternative fuel, there will be sufficient capacity to deliver the
full gas requirements of the Facility without requiring significant investment in new pipeline
facilities. At this time, an interconnection agreement has not been executed. Mankato Energy
will enter into negotiations with Northern Natural Gas to develop an interconnection agreement
upon approval of the Facility.
At this time, Mankato Energy intends to construct, own, and operate the service distribution line;
accordingly, a pipeline route permit application for the new pipeline will be prepared and
submitted to the EQB in accordance with the requirements of Minnesota Rules 4415. The EQB
would be the lead agency responsible for regulatory review of the interconnection line. That
regulatory review will require a separate environmental assessment to evaluate potential human
and environmental impacts associated with construction and operation of the proposed pipeline.
Mankato Energy would seek a partial exemption from the pipeline route selection procedures
allowed for qualifying projects under a shorter process, which does not require the applicant to
identify an alternative route and does not require a contested case hearing. The pipeline tap at
the connection point with the Northern Natural Gas mainline would be subject to federal
jurisdiction and requires approval by the Federal Energy Regulatory Commission (“FERC”). All
other necessary permits and approvals will be obtained prior to construction of the pipeline. The
Minnesota Office of Pipeline Safety will be involved in required inspections during and after
construction.
3.3 ELECTRICAL TRANSMISSION
Electricity generated at the Facility will be carried from a switchyard located on the west edge of
the Facility property through two new parallel overhead pole-mounted high voltage transmission
lines to Xcel Energy’s nearby Wilmarth Substation. The interconnection will consist of two
separate voltages, 345 kV and 115 kV. The approximate length of the transmission lines is 1,000
T:\1294\01\02\Mankato Site Permit App.doc 3-2 Mankato Energy Center Site Permit Application

feet and they will be contained entirely on Xcel Energy’s property. The substation will be
expanded on the north side to provide the necessary equipment to accommodate the
interconnection. The proposed transmission line route is shown on Figure 8. At the Wilmarth
Substation, electricity from the Facility will enter Xcel Energy’s transmission system for
distribution within MAPP.
While Mankato Energy has proposed the new transmission lines, the lines would be built,
owned, and operated by Xcel Energy. Electricity will pass through on-site step-up transformers,
which will convert the voltages to 345 kV and 115 kV. Dead-end structures will be constructed
within the switchyard for the 345 kV and 115 kV outputs, from which Xcel Energy will tie into
in completing the electrical interconnection between the Facility and the Wilmarth Substation.
Calpine performed an internal analysis to determine the amount of electric power generation that
could be added to the Xcel Wilmarth Substation without degrading or adversely impacting the
transmission system. The results of the analysis showed a generating plant capable of producing
approximately 550 MW could be constructed with little to no transmission upgrades. In fact, the
addition of Facility to the existing utility electric grid system will have positive impacts for
Minnesota in both generation and transmission benefits. The Minneapolis/St. Paul metro area is
a large load pocket located north of the Facility. For this reason, excess power that does not flow
through the Wilmarth transformers to serve local load will most likely flow from Mankato in a
northerly direction toward the large load area. Adding the Facility, which will be a large,
efficient, and low cost generator, in an area of Minnesota that does not have such a generator at
this time will benefit the stability and reliability of the system in that it will provide local voltage
support. The location of the Facility will also increase the geographic diversity of Minnesota’s
electric generation.
At this time, an interconnection agreement has not been executed. Mankato Energy will enter
into negotiations with MISO to develop an interconnection agreement upon approval of the
Facility. Once the Interconnect Agreement is approved, Xcel Energy will also proceed with the
line design and securing all necessary permits and approvals. In accordance with the
requirements of Minnesota Rules 4400, a transmission route permit application for the new
T:\1294\01\02\Mankato Site Permit App.doc 3-3 Mankato Energy Center Site Permit Application

transmission lines will be prepared and submitted to the EQB, which is the lead agency
responsible for regulatory review of new transmission lines. That regulatory review will require
a separate environmental assessment to evaluate potential human and environmental impacts
associated with construction and operation of the proposed transmission lines. The proposed
transmission lines qualify for the shorter alternative permitting process (high voltage
transmission lines in excess of 200 kV but less than five miles in length in Minnesota), which
does not require the applicant to identify an alternative route and does not require a contested
case hearing. As the proposed transmission lines are relatively short and located entirely on Xcel
Energy property, potential impacts are expected to be minimal.
3.4 WATER AND SEWER
Potable water for steam cycle makeup, fire protection, and domestic uses at the Facility such as
drinking water, eye wash stations, showers, toilets, sinks, and other incidental water needs will
be supplied by the City of Mankato through a lateral service line connection to the municipal
water supply system. Raw water used at the Facility for non-contact cooling water and process
water will be supplied by the City of Mankato in the form of treated wastewater effluent from
their municipal wastewater treatment plant. The Mankato WWTP is located approximately one
mile south of the project site on the east bank of the Minnesota River and treats municipal
wastewater flows received from both the communities of Mankato and North Mankato. The
Mankato WWTP, which recently underwent a $24.5 million upgrade and expansion in 2000, has
adequate capacity to meet the Facility’s water needs. The treated wastewater effluent will be
piped to the facility via a buried underground pipeline to be constructed within the right-of-way
of an existing city bike trail.
Domestic wastewater generated from the Facility (e.g., bathrooms and sink areas in the
administrative building and water treatment/electrical control building) will be discharged
directly to the City of Mankato sanitary sewer system through a lateral service line connection.
This discharge will be authorized by the City of Mankato and subject to any appropriate
discharge limits and monitoring requirements.
T:\1294\01\02\Mankato Site Permit App.doc 3-4 Mankato Energy Center Site Permit Application
The water and sewer connections described above would be constructed and paid for in
accordance with an interconnection agreement or service contract between Mankato Energy and
the City of Mankato. Negotiations are currently taking place including what type of additional
treatment of the wastewater effluent will be required (and associated pretreatment facilities to be
constructed on the wastewater plant site) prior to conveyance to the Facility.
3.5 OTHER UTILITIES
Details regarding other utility connections to the Facility including electricity, telephone, and
cable are not known at this time but will be worked out with local utility companies as necessary.
Wherever possible, utilities will follow existing easements to help reduce costs and minimize
local impacts.
T:\1294\01\02\Mankato Site Permit App.doc 3-5 Mankato Energy Center Site Permit Application
4.0 Effects on Human Environment
4.1 ENVIRONMENTAL SETTING
As described in Section 2.4, the proposed Facility site is located just north of the Mankato city
limits in Lime Township in Blue Earth County. The site is approximately 25 acres in size and is
located within an area zoned for industrial use. It is situated on the southern portion of an old
limestone quarry that has been mined to completion and currently serves as a demolition waste
landfill and composting facility owned and operated by SMC. A set of railroad tracks no longer
in use runs along the south side of the site. Access to the site is provided from the south off
Summit Avenue. Based on available records, the limestone quarry began operations back in the
mid-1950s. In 1992, the site began accepting construction and demolition wastes under a permit
issued by the MPCA. Site topography and a visual record of existing conditions and
environmental setting are shown in Figure 9.
The dominant feature of the site is the demolition waste landfill located to the north. A recently
improved gravel haul road leading to active landfill areas is located along the west side of the
site. The site currently contains a few buildings used primarily for sorting demolition waste
materials and storing equipment. An outside storage area containing sanitary and storm sewer
pipe and miscellaneous construction material is located on the east side of the site. A mobile
trailer located on the southern portion of the site is currently being used by SMC for office space.
The truck scale, recycling bins, and compost piles also are located in this area. The facility
accepts yard and garden waste, brush, and other vegetation debris, which is processed, placed
into compost piles and then sold to the general public. SMC also sells landscaping materials
including wood chips, decorative rock, and retaining wall blocks, which are stored outside on the
site property.
T:\1294\01\02\Mankato Site Permit App.doc Mankato Energy Center Site Permit Application 4-1

Adjacent lands consist of numerous industrial and manufacturing facilities including Xcel
Energy’s Wilmarth Generating Plant and electrical substation, a waste processing company, auto
salvage yards, scrap metal operations, a construction company, a U.S. Postal Service mail
processing facility, and a household hazardous waste collection site. There are numerous
railroad tracks and spur lines in the area as well as overhead electrical transmission lines. The
closest residential dwelling is located approximately 1,500 feet from the center of the site. The
nearest residential areas of Mankato lie more than one-half mile to the south on the other side of
U.S. Highway 14.
The Minnesota River is located approximately 1,800 feet west of the Facility site. The river and
adjacent wooded river bottoms provide wildlife habitat as well as recreational opportunities in
the form of boating, fishing, and hunting. There are also trails, parks, and other recreational
facilities in the general area. A large drainage ditch is located along the east side of the site,
which flows in a north/northwesterly direction to the Minnesota River. The Minnesota River
valley extends approximately one mile to the east of the site at which point steep bluffs rising
150 feet dominate the landscape. Outlying rural areas to the north and east of the site in Lime
Township consist predominately of agricultural and conservation lands.
4.2 DISPLACEMENT
The project site is appropriately zoned for industrial use. The closest residential dwelling is
located approximately 600 feet northeast of the Facility’s site boundary. No one will be
physically displaced by the Facility nor should the Facility alter the usage of adjacent property.
4.3 NOISE
The site is located within an established industrial and manufacturing area on the north edge of
Mankato more than one-half mile from the nearest residential areas of town. Two sensitive noise
receptors consisting of residential dwellings are located near the site and are shown on Figure 10.
T:\1294\01\02\Mankato Site Permit App.doc Mankato Energy Center Site Permit Application 4-2

The nearest residential dwelling (receptor 1) is located on the west side of 3rd Avenue just south
of Brad’s Auto Parts approximately 1,500 feet away from the center of the site. The next closest
residential dwelling (receptor 2) is approximately 2,500 feet away to the northeast. There are no
other known sensitive noise receptors in the area. Existing noise sources located in the general
vicinity of the proposed site include industrial facilities, highways, county roads, and railroad
tracks.
Noise will be generated during construction of the Facility as well as during normal operation of
the Facility. The largest potential noise impacts will likely be generated during the construction
of the Facility. Construction noise will be temporary and will be mitigated as described Section
in 4.3.2.
Noise associated with tanker truck traffic to replenish the back-up fuel oil supply tank will be
temporary and intermittent. Curtailment of the primary natural gas fuel supply, which would
require an increase in truck deliveries to replenish the back-up fuel oil supply, is expected to be
rare.
The major components of the plant that will generate noise during the operation of the Facility
include the cooling tower, the combustion turbine generators, electrical transformers and
HRSGs. Mankato Energy will utilize noise mitigation and control methods and equipment in the
final design of the Facility as necessary to mitigate noise emissions in excess of MPCA standards
during normal operation.
The Facility will be designed to operate within the State of Minnesota Noise Standards
(Minnesota Rules 7030.0040) listed in Table 4-1 below. The City of Mankato does not have a
noise ordinance but relies on the State’s noise level restrictions for local control of noise
problems. The noise area classification (“NAC”) is determined by the land use activity of the
receiver. Land use activities are generally divided into four NACs; 1) residential, 2) commercial,
3) industrial and agricultural, and 4) unclassified (undeveloped and unused land and water areas).
The Facility and adjacent industrial and manufacturing facilities would be characterized as NAC
3. The most sensitive receptor area would be classified as NAC 1 during the nighttime.
T:\1294\01\02\Mankato Site Permit App.doc Mankato Energy Center Site Permit Application 4-3

TABLE 4-1 MINNESOTA NOISE STANDARDS (MINNESOTA RULES 7030.0040)
Daytime
(7 am to 10 pm) Nighttime
(10 pm to 7 am) Receiver Noise
Area Classification (NAC) L50 L10 L50 L10
1 60 65 50 55 2 65 70 65 70 3 75 80 75 80
Noise limits are in decibels on the A scale, abbreviated dBA. L50 is the sound level exceeded for 50% of the time and is considered the “average” sound level. L10 is the sound level exceeded for 10% of the time.
4.3.1 Baseline Noise Survey
A baseline environmental noise survey was conducted on November 25 and 26, 2003 at the site
to document existing noise levels. Noise monitoring was conducted at three locations along the
west, south, and east site boundaries and two locations at nearby residential receptors (see Figure
10). A measurement location along the northern boundary of the Facility site was not included
due to the anticipated topography changes in this area associated with ongoing landfill operations
that would render these results meaningless in the future. Noise measurements were taken
during the daytime and nighttime hours in accordance with the procedures outlined in the
Minnesota Noise Standards. The results of these measurements will be used to evaluate the
noise impact under existing conditions and utilize this information in finalizing the design of the
Facility. Results of the noise survey are presented in a report included in Appendix B.
The daytime noise survey results showed that the baseline noise levels are below the applicable
limits at the residential and boundary locations. The major daytime noise sources during the
survey period included traffic on nearby roadways (3rd Avenue, U S Highways 169 & 14), traffic
associated with landfill operations and flyover of geese.
The nighttime noise survey results also were below the applicable limits at the residential and
boundary locations. The major nighttime noise sources during the survey period included traffic
on nearby roadways (3rd Avenue, U S Highways 169 & 14) and local industrial operations.
T:\1294\01\02\Mankato Site Permit App.doc Mankato Energy Center Site Permit Application 4-4

4.3.2 Noise During Facility Construction
Facility construction is expected to consist of site excavation and grading, foundation work, steel
erection, finishing, and the installation of Facility equipment. Sources of noise during the
construction period will include delivery trucks and haul trucks, earth moving and grading
equipment (bulldozers, graders), cranes, and fabrication activities (pneumatic wrenches, saws,
welding equipment). Many of these noise sources are intermittent and of short-term duration
during the construction period. The most intrusive sources of noise during construction would
be from dynamic pile driving activities, to the extent such activities would be required. Portions
of the construction of the Facility will involve indoor work such as pipefitting, electrical wiring,
and equipment installation. Those indoor activities normally do not result in appreciable outdoor
noise.
Construction noise is unavoidable, but the impacts are temporary as construction is a limited-
duration activity and a number of noise-abatement measures will be implemented to help
mitigate these impacts, including the following:
• Outdoor and noisy construction activity to will be limited to daylight hours to the extent
practicable.
• Controlling the extent and duration of pile driving and other noisy activities that may be
required during construction.
• Limiting the duration of the overall construction period, by contracting for sufficient
construction resources and through efficient scheduling and coordination of construction
activities.
Based on the mitigation measures that will be taken, existing background noise levels, and
distance to sensitive noise receptors, it is anticipated that any noise impacts due to the
construction of the Facility will be minimal.
T:\1294\01\02\Mankato Site Permit App.doc Mankato Energy Center Site Permit Application 4-5
4.3.3 Noise During Facility Operation
Sources of noise during routine Facility operation will include operation of process equipment,
fuel oil delivery trucks, and maintenance activities. Delivery of fuel oil and associated noise
from delivery trucks will be temporary and limited to those periods when fuel oil is burned as a
backup fuel, which is expected to be infrequent and of limited duration. In a worst-case situation
where the natural gas supply is interrupted for an extended period of time and the on-site fuel oil
storage is depleted, the average number of tanker trucks delivering backup fuel oil would be
approximately 56 trucks per day. This calculation is based on unloading of two 7,000-gallon
capacity tanker trucks simultaneously, with approximately 45 minutes per tanker truck required
for unloading and approximately 6 minutes required to switch from one tanker truck to another.
Noise from the Facility is expected to be relatively constant during operation. There may be
brief episodes of intrusive noise (e.g., relief valve discharges) during periods of abnormal
operations and Facility start-up and shut down. The major equipment noise sources during
normal operation include:
● Multi-cell cooling tower.
● Two combustion turbine generators.
● Three step-up electrical transformers.
● Steam turbine generator.
● Two heat recovery steam generators.
The potential impacts of noise on nearby residential receptors 1 and 2, which were identified
during the baseline noise survey, were evaluated quantitatively. Noise emission data for each
source was compiled from three references. The cooling tower noise emission data was provided
by Marley Cooling Technology (2/24/04). The HRSG noise estimate was supplied by another
equipment supplier, Nooter Eriksen (1/15/04). Data on noise from the combustion turbines was
provided by Siemens-Westinghouse (2/24/04). The remaining equipment noise levels were
taken from a noise assessment report prepared for a similar Calpine facility in Wisconsin.4
4 Fox Energy Center Noise Impact Assessment, July 2003.
T:\1294\01\02\Mankato Site Permit App.doc Mankato Energy Center Site Permit Application 4-6

The Facility will employ stack silencers, low-noise fans and related equipment at the cooling
tower, and equipment enclosures around the transformers and combustion turbines, which will
ensure noise emissions during normal operation will comply with applicable Minnesota Noise
Standards. It is anticipated that noise impacts due to Facility operations will not have an adverse
effect on the surrounding area.
Noise data for the selected equipment was adjusted to reflect the application of the planned noise
mitigation measures and combined with the baseline noise survey results to estimate noise levels
at nearby receptors and determine compliance with noise standards. At residential receptor 1, the
estimated daytime L50 is 53.2 dBA and the estimated nighttime L50 is 49.1 dBA. At residential
receptor 2, the estimated daytime L50 is 48.1 dBA and the estimated nighttime L50 is 46.4 dBA.
These levels are well below the Minnesota noise limits for residential areas.
The adjacent properties to the site are classified as NAC 3 (industrial) receptors, where the
Minnesota Noise Standards allow for greater noise levels than at NAC 1 (residential) receptors.
The calculated noise levels during Facility operations are shown on the noise contours of Figure
3 of the complete noise report in Appendix B. The projected noise levels at the industrial
receptors are well within the NAC 3 limits. Further numerical results and related discussion are
also provided in Appendix B.
4.4 AESTHETICS
The Facility will blend into the established industrial area on the north edge of Mankato. The
Facility site is adjacent to the Wilmarth Generating Station and related Wilmarth electrical
substation. The Wilmarth Generating Station is a two-unit generating plant that was built in the
late 1940s to burn coal. The facility’s two generating units were converted to burn processed
municipal solid waste in 1987. Other adjacent industrial and manufacturing facilities located
adjacent to the Facility site include a waste processing company, auto salvage yards, scrap metal
T:\1294\01\02\Mankato Site Permit App.doc Mankato Energy Center Site Permit Application 4-7

operations, a construction company, a U.S. Postal Service mail processing facility, and a
household hazardous waste collection site.
The various buildings, pieces of equipment, exhaust stacks, storage tanks, cooling tower, and
ancillary equipment that make up the Mankato Energy Center will be arranged on the site as
shown on the site plan (Figure 5). All roads at the Facility will be paved and will be designed to
efficiently and safely move traffic onto, around and off of the Site. Sufficient paved parking
areas for employees and visitors will also be provided on site.
The tallest building at the Facility will be the steam turbine generation building on the south side
of the site at an approximate design height of 110 feet above ground level. The other two main
buildings (administrative building and water treatment building) are based on approximate
design heights of 25 feet. The two HRSGs will be located outdoors with their design heights
varying between 60 and 114 feet. The height of the adjacent combustion turbine generators will
vary between 25 and 70 feet. The design height of the cooling tower to be located on the east
side of the site is 45 feet.
The tallest structures at the Facility will be the two HRSG stacks, which are proposed to be 200
feet tall. If the stacks were to exceed 200 feet in height, the Federal Aviation Administration
(“FAA”) could impose requirements such as obstruction warning lights and other measures
intended to improve visibility of the structures. Notification will be provided to the FAA of the
planned construction of these structures, and Mankato Energy expects that a determination of
“no hazard” will be issued and that no additional lighting requirements will be imposed.
The HRSG stacks would be most visible from the west end of Summit Avenue and would
possibly be visible from along the Minnesota River depending on the vantage point. The stacks
will look similar to the two stacks located at the nearby Wilmarth Generating Plant, which are
shown in the lower right-hand photo on Figure 9 and stand 158 feet tall. Due to the existing
topography, finished grades at the demolition waste landfill, a dense grove of mature trees
located around the perimeter of the site, and the distance away from adjacent roadways, most of
the other structures at the Facility should not be visible to the general public.
T:\1294\01\02\Mankato Site Permit App.doc Mankato Energy Center Site Permit Application 4-8

As flue gas is emitted from the HRSG stacks, the water vapor present in the flue gas may
condense to form a visible steam plume. In addition, water vapor emitted from cooling tower
may result in a similar, visible plume. The length and persistence of these visible plumes are
influenced by prevailing weather conditions such as temperature, relative humidity, and wind
speed. The plumes would be most persistent and visible during cold and damp weather,
principally during the winter. On most days of the year, however, visible steam or vapor plumes,
if present, would disperse and evaporate after traveling only a moderate distance aloft.
In addition to effects on visibility associated with water vapor, certain stack emissions have the
potential to impact local visibility. Emissions of particulate matter can reduce visibility by
scattering light, and emissions of nitrogen oxides can reduce visibility by absorbing light. The
Facility must apply Best Available Control Technology (“BACT”) for both of these visibility-
related pollutants, as explained in Section 5.1. Furthermore, the emissions of nitrogen oxides
will be continuously monitored to ensure compliance with BACT-related emission limits.
Accordingly, emissions from the Facility are not expected to have a significant impact on local
visibility. This conclusion is substantiated by the fact that the maximum projected air quality
impacts as presented in Section 5.1 have been shown to be well below the federal and state
ambient air quality standards.
Lighting at the Facility will be provided for security and plant operational purposes. Mankato
Energy will light the grounds in a manner similar to other industrial sites using directional
lighting and minimizing light impacts onto adjacent property. Off-site lighting impacts should
be minimal and are not expected to affect any residential areas.
The Facility is located within an industrial area on the north edge of Mankato, and most of the
buildings and structures will be far enough away from adjacent roadways or screened from view
by exiting trees or other physical barriers; therefore, no significant visual impacts to the
surrounding area are anticipated. Overall, the Facility will blend in well with existing adjacent
industrial and manufacturing facilities including the Wilmarth Generating Station, which has
been a part of the local landscape for more than 50 years.
T:\1294\01\02\Mankato Site Permit App.doc Mankato Energy Center Site Permit Application 4-9
4.5 SOCIOECONOMIC IMPACTS
The Facility will benefit the local and regional communities as well as the State of Minnesota.
The Mankato Facility will support efforts by Xcel Energy to enhance and diversify their power
supply portfolio in meeting the utility’s growing demand for electricity. The Facility utilizes
natural gas, a clean-burning fossil fuel, and highly efficient combustion technology to generate
reliable electricity while minimizing environmental impacts. The Facility has been carefully
sited close to a major natural gas pipeline and high-voltage electric transmission system
minimizing impacts associated with infrastructure connections.
The Facility will provide many benefits to the local community including economic benefits
resulting from the construction and operation of the Facility and through the purchase of local
goods and services. Some of the economic benefits include the following:
• Construction of the Facility is estimated to cost $240 million and will employ as many as
450 construction workers at peak construction periods. It is anticipated that workers
commuting to the site from the three-county area (Blue Earth, Nicollet, and Le Sueur)
will fill most of the construction job needs. These jobs (include welders, pipefitters, iron
workers, millwrights, carpenters, electricians, and other trades) will benefit the local
economy during the construction phase. Once in operation, the Facility will employ
approximately 24 full-time workers, with many of these positions being filled from
within the local community.
• The state of Minnesota and Blue Earth County will receive sales and income tax revenue
from the construction of the project as well as income taxes from permanent full-time
employees once the Facility is up and operating.
• The Facility will also bring indirect jobs to the area in the form of local support services.
• Mankato Energy intends to be an active member of the local community, participating in
charitable events, community service organizations, and outreach programs.
T:\1294\01\02\Mankato Site Permit App.doc Mankato Energy Center Site Permit Application 4-10

• The Facility is anticipated to have a useful life of at least 30 years, meaning that the
Facility will provide the City of Mankato and Blue Earth County area with a reliable,
consistent source of economic and other benefits for many years.
Addition of the Facility to the existing utility electric grid system also will have positive impacts
for Minnesota in terms of both generation and transmission benefits. The Minneapolis/St. Paul
metro area is a large load pocket located north of the Facility site. For this reason, excess power
that does not flow through the nearby Wilmarth Substation transformers to serve local load will
most likely flow from Mankato in a northerly direction toward the large load area. Adding the
Facility, a large, efficient, and low-cost generator, in this area of Minnesota will benefit the
stability and reliability of the system through local system voltage support. The location of the
Facility also will enhance the geographic and fuel diversity of Minnesota’s electric generation
fleet.
4.6 CULTURAL VALUES
Prior to the mid-1800s, the Mankato area along the banks of the Minnesota River was inhabited
mainly by Dakota (Sioux) Indian tribes. The first white settlers began to arrive in the area in the
early 1850s after the Dakota had ceded the land to the United States government under the
Treaty of Traverse des Sioux in 1851. The Minnesota River and its tributary streams provided
easy access to the area from the territorial capital of St. Paul (located 80 miles downstream) and
Mankato was one of several cities platted along the upper Minnesota River in 1852. Mankato
was named the Blue Earth County Seat in 1853, and the city grew rapidly in the 1850’s and 60’s
after a crude military road was built between Mankato and St. Paul and with the westerly
expansion of the railroads. Mankato became a railroad hub for southern Minnesota, which
helped establish the town as an important regional center for providing goods and services to the
surrounding area.
Today, the Cities of Mankato and North Mankato with a combined population of 44,245
continue to be a significant regional center for education, health care, commerce, industry, and
T:\1294\01\02\Mankato Site Permit App.doc Mankato Energy Center Site Permit Application 4-11

agriculture. In addition to serving as the county seat for Blue Earth County, Mankato provides
goods and services to the nearby Counties of Nicollet and Le Sueur as well as other outlying
areas of southern Minnesota.
The Facility site is located within an area zoned for industrial use and is situated on the southern
portion of an old limestone quarry that has been mined to completion and currently serves as a
demolition waste landfill and composting facility. A set of railroad tracks run along the south
side of the site. Based on available records, operation of the limestone quarry began in the mid-
1950s. In 1992, the site began accepting construction and demolition wastes under a permit
issued by the MPCA.
As discussed in Section 7, the Minnesota Historical Society was contacted about possible
archeological, historical or architectural resources located on or near the Site. Upon review of
their records, the State Historic Preservation Office (“SHPO”) concluded that there are no known
or suspected resources present on or near the site that would be affected by the Facility. Based
on SHPO’s findings and the disturbed nature of the site from past limestone and gravel mining
activities, construction and operation of the Facility should have no impact on cultural values in
the area.
4.7 RECREATION
There are no designated recreational facilities located on or immediately adjacent to the Facility
site. The Facility site is located in the southern end of the East Minnesota River State Game
Refuge. This refuge extends north to the town of Kasota along the east side of the Minnesota
River. There is no state-owned land within the game refuge; all land is under private ownership.
Based on discussions with DNR staff, state game refuge status is given to local property owners
who wish to protect waterfowl and deer by restricting firearm hunting on their property. This
refuge is not managed by the DNR and does not carry any special environmental regulations or
land use restrictions other than use for hunting. Proposed developments must follow typical
zoning requirements enforced by the local government agencies.
T:\1294\01\02\Mankato Site Permit App.doc Mankato Energy Center Site Permit Application 4-12

The Minnesota River is located approximately 1,800 feet west of the Facility site. The river and
adjacent river bottoms provide recreational opportunities in the form of boating, fishing, and
hunting. However, there are no public access points, boat landings, designated trails, or
developed public facilities along the stretch of river flowing near the Facility site.
The Sakatah Singing Hills State Trail is a 39-mile paved multi-use trail running between
Mankato and Faribault. The trail begins at Lime Valley Road approximately one mile east of the
Facility site and follows an abandoned railroad grade through the countryside near pastures,
farmland, and lakes, and passing through several small towns. The Sakatah Trail connects with
other trails in the area that are part of the Mankato trail system.
There are also several city parks and recreational facilities located in the general vicinity of the
Facility site including Columbia Park, Tourtelotte Park and swimming pool, Hiniker Pond Park,
and the Mankato Golf Club (a private club with an 18-hole golf course, driving range, and
swimming pool). These recreational facilities are located at least three-quarters of a mile from the
Facility site. There are numerous state parks, county parks, and wildlife management areas along
the Minnesota River and its tributary streams, but none within three miles of the Facility site.
Although there are recreational facilities in the area of the Facility site, as described above,
construction and operation of the Facility will not directly impact any existing public land, trails,
parks, or other areas used for recreation.
4.8 PUBLIC SERVICES
4.8.1 Transportation System
As discussed in Section 3.1, the existing public roadway network and site access road are
adequate to serve the Facility, and no public transportation improvements will be required for
construction or operation. Access to the site is provided west of 3rd Avenue off Summit Avenue
T:\1294\01\02\Mankato Site Permit App.doc Mankato Energy Center Site Permit Application 4-13

via an existing paved road that currently serves the demolition waste landfill. It has not yet been
determined if the set of existing railroad tracks running along the south side of the site will be
utilized to deliver any materials or equipment during construction of the facility. If these tracks
and the existing railway system are utilized, minor upgrades and improvements to the tracks may
be required.
The Mankato Municipal Airport, located approximately 3.7 miles to the northeast in Lime
Township, is the closest active airport to the site. As discussed later in Section 5.4, the Facility
should not affect airport operations in any way.
4.8.2 Water and Sewer Services
As discussed previously in Sections 2.7 and 3.4, water and sewer services will be provided by
the City of Mankato in accordance with an interconnection agreement or service contract
between Mankato Energy and the City. The City will supply both process water and potable
water to the Facility and will receive domestic wastewater discharges. Mankato Energy will
construct its own water storage facilities on site. Details regarding the location of utility lines to
be extended onto the site and connections to the existing municipal systems will be finalized at a
later date. Wherever possible, utilities will follow existing easements to help reduce costs and
minimize local impacts.
4.8.3 Waste Collection and Disposal
Mankato Energy will privately contract with local waste haulers to properly collect and dispose
of all liquid and solid wastes generated at the facility. No municipal services would be required.
4.8.4 Fire and Police Protection
During construction of the Facility, the City of Mankato will provide fire and police protection
and rescue services. The Facility will be equipped with a security system and fire suppression
system. The City of Mankato will continue to provide emergency services as necessary once the
T:\1294\01\02\Mankato Site Permit App.doc Mankato Energy Center Site Permit Application 4-14

plant is up and running, and coverage of the Facility should not affect the existing capabilities of
the City’s fire and police departments.
T:\1294\01\02\Mankato Site Permit App.doc Mankato Energy Center Site Permit Application 4-15

5.0 Effects on Public Health and Safety
5.1 AIR EMISSIONS
5.1.1 Sources of Emissions to the Air
The Facility will include two identical combined cycle combustion turbines (rated at
approximately 290 MW each in combined cycle mode at winter ambient conditions) equipped
with DLN combustors. The combustion turbines will be fired primarily by natural gas with low
sulfur distillate oil as a backup fuel. Backup oil firing is limited to 10 percent of the available
annual operating hours. The combustion turbines will also have the capability of injecting steam
for the generation of additional power as dictated by demand. This is referred to as power
augmentation. Each of the combustion turbines will exhaust to a separate HRSG having a
supplementary duct firing capacity of 800 MMBtu/hr. The duct burners are fired only with
natural gas. Mankato Energy will install a selective catalytic reduction system to reduce NOx
emissions and a catalyst oxidation system to control CO emissions from the combustion turbine
duct burner exhaust.
Secondary combustion sources include an auxiliary boiler with a rated heat input of 70
MMBtu/hr and an emergency generator. Mankato Energy will also install a fire pump engine if
it is determined that the City of Mankato’s water system will not be able to supply the Facility
with adequate flow. The auxiliary boiler will be fired with natural gas only and the emergency
generator and fire pump engine will be fired with diesel fuel. Other non-combustion related
sources include fuel oil storage tanks and the cooling tower.
T:\1294\01\02\Mankato Site Permit App.doc Mankato Energy Center Site Permit Application 5-1

5.1.2 Air Pollutants Emitted, Control Measures, and Compliance Testing
5.1.2.1 Air Pollutants Emitted
The Facility must obtain a Prevention of Significant Deterioration (“PSD”) permit from the
MPCA prior to construction of the Facility. An air permit application was submitted to the
MPCA on December 3, 2003. Combustion-related emissions of particulate matter, carbon
monoxide, nitrogen oxides, sulfur dioxide, volatile organic compounds and sulfuric acid are of
primary interest because these pollutants are emitted in quantities that exceed the threshold
triggering PSD review. The estimated annual emissions of these pollutants from the PSD
application are shown in Table 5-1. Emissions of sulfuric acid, ammonia, and other non-criteria
pollutants are addressed further in section 5.1.5.
T:\1294\01\02\Mankato Site Permit App.doc Mankato Energy Center Site Permit Application 5-2

TABLE 5-1 PROPOSED COMBINED CYCLE SYSTEM PERMIT LIMITS
AND POTENTIAL ANNUAL EMISSION RATES Maximum Emissions
Pollutant Proposed Permit Limit 1
Potential to Emit
(tpy)
Proposed Emission Controls
Compliance Basis
Particulate Matter (PM)/PM10
30.1 lb/hr natural gas combustion, 72.8-lb/hr distillate oil combustion.
301 Good combustion control practices and use of clean fuels.
Performance Test
Nitrogen Oxides (“NOx”)
3.0 ppmvd without power augmentation, 3.5 ppmvd with power augmentation, 5.5-ppmvd fuel oil combustion.
341 DLN combustor technology and the installation of selective catalytic reduction. (SCR) on the combined cycle combustion turbine systems.
Continuous Emission Monitor (CEM)
Carbon Monoxide (“CO”)
4.0 ppmvd without power augmentation, 4.5 ppmvd with power augmentation, 4.8 ppmvd fuel oil combustion.
254 Good combustion control practices and the installation of an oxidation catalyst system on the combined cycle combustion turbine systems.
Continuous Emission Monitor (CEM)
Volatile Organic Compounds (“VOCs”)
3.0 ppmvd without power augmentation, 3.8 ppmvd with power augmentation, 2.0 ppmvd fuel oil combustion.
121 Good combustion control practices and the installation of an oxidation catalyst system on the combined cycle combustion turbine systems.
Performance Test
Sulfur Dioxide (“SO2”)
< 0.8 grains of Sulfur/100 scf in natural gas, <0.05% sulfur content of distillate oil.
114 Good combustion practices and use of clean-burning fuel.
Monitor sulfur content of fuel.
Sulfuric Acid < 0.8 grains of Sulfur/100 scf in natural gas, <0.05% sulfur content of distillate oil.
13.6 Good combustion control practices and use of clean-burning fuel.
Monitor sulfur content of fuel.
1All concentrations based on a ppmdv are corrected to 15% oxygen.
T:\1294\01\02\Mankato Site Permit App.doc Mankato Energy Center Site Permit Application 5-3

In addition to the above pollutants, there will be a small release of ammonia from the combined
cycle system stacks. Mankato Energy is proposing to utilize SCR systems to control NOx
emissions from the combustion turbines. Ammonia emissions result from the use of ammonia
as a reagent in the SCR system. Ammonia emissions, also referred to as “ammonia slip,” will
be at a low concentration of less than 10 ppm.
5.1.2.2 Emission Control Measures
As noted earlier, Mankato Energy must obtain a PSD permit from the MPCA to authorize
construction of the proposed facility. This requires the application of the Best Available Control
Technology (“BACT”) to control emissions from the Facility’s emission units. Mankato Energy
will satisfy BACT requirements by applying the most effective of available options to control
NOx, CO, VOC, and organic emissions from the combustion turbines. The facility will utilize
the following emissions control strategies:
• Firing primarily natural gas in the turbines (distillate oil firing limited to 875 hours per
year) to minimize sulfur dioxide and particulate emissions from the turbine.
• DLN combustors and water injection are used while firing natural gas and oil,
respectively, to minimize the formation of oxides of nitrogen in the combustion turbines.
• SCR to reduce oxides of nitrogen emissions in the combustion turbine exhaust gas.
• Catalytic oxidation to reduce CO, VOC, and organic air pollutant emissions from the
combined cycle system exhaust gas.
• Firing solely natural gas in the auxiliary boiler to minimize pollutant emissions.
• Limiting operation of the emergency generator and fire pump to less than 300 hours per
year.
• Installation of high efficiency mist eliminators to reduce cooling tower drift rate to
minimize particulate matter emissions from the cooling tower.
T:\1294\01\02\Mankato Site Permit App.doc Mankato Energy Center Site Permit Application 5-4

5.1.2.3 Compliance Testing
Compliance with emissions permit limits will be demonstrated by means of Continuous
Emission Monitoring Systems (“CEMS”) operating according to demonstrated performance
criteria, by periodic stack emissions tests, or by monitoring fuel. Mankato Energy is proposing
to install CEMS to continuously measure CO and NOx emissions in the combined cycle system
exhaust. Stack testing or fuel monitoring will be required for the other pollutants as specified by
the MPCA in the air permit for the Facility.
5.1.3 Criteria Pollutant Impacts
5.1.3.1 Significant Impact Level Analysis
As part of the PSD permit application, air dispersion modeling was performed to demonstrate
that the emissions from the Facility will not cause or contribute to a violation of an ambient air
quality standard or PSD increment. Preliminary modeling was performed using a modeling
protocol that conforms to U.S. Environmental Protection Agency (“EPA”) standards to predict
the maximum ambient concentrations of NO2, CO, PM10, and SO2 resulting from the Facility’s
emissions alone. These concentrations were compared to the PSD ambient air significant impact
levels (“SILs”). The ambient impact significance levels serve as screening criteria to determine
if further analyses are required to verify that the emissions will not cause or contribute to an
exceedance of an ambient air quality standard or PSD increment. If all modeled concentrations
are below their respective SILs, then further modeling for the National and Minnesota Ambient
Air Quality Standards (“NAAQS” and “MAAQS”, respectively) and PSD increment compliance
is not required.
Preliminary modeling of the Facility’s emissions alone yielded predicted CO concentrations
below the PSD significant ambient impact levels; therefore, no further modeling was required for
CO. Further modeling to more thoroughly assess NAAQS/MAAQS and PSD increment
compliance was performed for NO2, SO2, and PM10. Table 5-2 summarizes the preliminary
modeling results and compares the results to their respective SIL.
T:\1294\01\02\Mankato Site Permit App.doc Mankato Energy Center Site Permit Application 5-5

TABLE 5-2 PRELIMINARY MODELING RESULTS
Pollutant
Averaging Period Predicted Ambient
Concentration (µg/m3)
PSD Significant Ambient Impact Level
(µg/m3) SO2 3-hour 86.72 25
24-hour 39.43 5 Annual 4.43 1
NOx Annual 3.79 1
PM10 24-hour 27.85 5 Annual 1.79 1
CO 1-hour 147.68 2,000 8-hour 81.77 500
5.1.3.2 Increment Modeling
PSD increments have been established for NO2, SO2, and PM10 to prevent degradation to air
quality by limiting the cumulative change in ambient concentrations that can occur due to
construction or modification of stationary sources in the region after the specific baseline date for
each pollutant. The baseline date for SO2 for this region was triggered in 1985 and the NO2
baseline date for this region was triggered in 2000. Therefore it is necessary to include changes
at other facilities occurring after the baseline date in assessing the PSD increments. The minor
source baseline date for PM10 is triggered by this project so only Mankato Energy sources are
included in the PM10 increment analysis.
The modeling results presented in Table 5-3 demonstrate compliance with the PSD increments
for all applicable averaging periods.
T:\1294\01\02\Mankato Site Permit App.doc Mankato Energy Center Site Permit Application 5-6

TABLE 5-3 INCREMENT MODELING RESULTS
Pollutant
Averaging Period Predicted Ambient
Concentration (µg/m3)
PSD Increment Ambient Impact Level
(µg/m3) PM10 24-hour 22.27 30
Annual 1.79 17
NO2 Annual 3.79 25
SO2 3-hour 88.2 512 24-hour 33.1 91 Annual 5.60 20
5.1.4 NAAQS Modeling
Mankato Energy sources were modeled to determine compliance with the ambient air quality
standards. MPCA guidance was relied upon in determining appropriate background
concentrations for NO2, SO2, and PM10. The modeling results for the PM10, NOx, and SO2
ambient air quality standards presented in Table 5-4 demonstrate compliance with the applicable
standards for all averaging periods.
TABLE 5-4 MODELING RESULTS - PM10, NO2, and SO2 NAAQS/MAAQS
Pollutant
Averaging Period
Facility’s Contribution to
Predicted Concentration
(µg/m3)
Background Concentration
(µg/m3)
Total Concentration
(µg/m3)
Ambient
Air Quality Standard (µg/m3)
PM10 24-Hour 22.27 42 64.27 150 Annual 1.79 21 22.79 50
NO2 Annual 3.79 23 26.79 100
SO2 1-Hour 104.47 181 285.47 1300 3-Hour 76.42 128 204.42 1300 24-Hour 33.36 60 93.36 365 Annual 4.43 5 9.43 80/60
T:\1294\01\02\Mankato Site Permit App.doc Mankato Energy Center Site Permit Application 5-7

A complete modeling report will be prepared as part of the PSD permit application. The PSD
permit application will be reviewed by the MPCA and will be placed on public notice in
accordance with the requirements of the application process.
5.1.5 Air Emissions Risk Analysis
Mankato Energy completed an Air Emissions Risk Analysis (“AERA”) in accordance with
MPCA technical guidance (Facility Air Emissions Risk Analysis Guidance; Version 1.0;
September 2003). The purpose of the AERA is to assess the potential health risk attributed to air
emissions from a given source. The AERA includes both quantitative and qualitative analyses.
In the quantitative portion of the analysis, the potential incremental cancer risks and non-cancer
hazard indices are estimated using procedures outlined in MPCA guidance. The qualitative
portion of the analysis identifies and discusses items of potential interest that cannot be easily
quantified. Detailed documentation for the AERA will be submitted to the MPCA for review.
A summary of the AERA and its findings are presented here.
MPCA guidance exempts natural gas-fired combustion units from review. Further, Mankato
Energy has agreed to accept limits of 300 hours per year or less on the diesel fired emergency
generator and fire pump. These limits exempt these units for AERA review under MPCA
guidance. Therefore, the AERA needed only to address the emissions resulting from combustion
of the low-sulfur distillate oil back-up fuel in the combustion turbines. Emission species
assessed included trace metals, acid gases, ammonia, and aromatic hydrocarbons resulting from
incomplete combustion.
The MPCA’s AERA guidance allows for a preliminary assessment based on the use of screening
level air dispersion modeling to predict exposure levels. However, since the project was
undergoing refined modeling for criteria pollutants, refined modeling inputs rather than
screening level modeling were used in the AERA. Maximum one-hour impacts for each
pollutant were determined for assessing acute exposures. The maximum annual impacts for each
pollutant were determined for assessing chronic exposures and/or cancer risk. These exposures
T:\1294\01\02\Mankato Site Permit App.doc Mankato Energy Center Site Permit Application 5-8

were then compared with pollutant-specific toxicity values supplied by the MPCA. Hazard
indices and cancer risks were then calculated. The results are summarized below.
Hazard indices were determined for acute, sub-chronic, and chronic exposures. A cancer risk
was also determined. These values are as follows:
TABLE 5-5 PRELIMINARY AERA RESULTS
Results Acceptable Level
Acute Hazard Index 0.3 1.0 Sub-chronic Hazard Index <0.01 1.0
Chronic Hazard Index 0.07 1.0 Cancer Risk 3 x 10⁻⁶ 1 x 10⁻⁵
5.1.6 Air Permitting Requirements
The Federal and MPCA air-permitting requirements anticipated for the Facility are summarized
in Section 11.0, Permits and Approval.
5.2 PUBLIC WATER SUPPLY
No groundwater wells will be installed on site to serve the Facility. Cooling and process water
will be supplied from effluent taken from the Mankato municipal wastewater treatment plant and
piped through a dedicated line to the Facility. Potable water for domestic uses such as drinking
water, showers, toilets, sinks, and other incidental water needs will be supplied by the municipal
water supply system through a lateral service line. Additionally it is anticipated that the Facility
will use potable water to supply its boiler makeup, consuming up to 200 gallons/minute (“gpm”).
The Cities of Mankato and North Mankato maintain separate municipal water supply systems.
Mankato has five groundwater wells located throughout the city and none are within two miles
of the project site. North Mankato has four groundwater wells and likewise, they are more than
T:\1294\01\02\Mankato Site Permit App.doc Mankato Energy Center Site Permit Application 5-9

two miles from the project site. Therefore, it is assumed the site is well beyond the boundaries of
the wellhead protection area and no potential impacts to existing groundwater resources or water
supplies that could affect public health and safety are anticipated as a result of construction and
operation of the Facility.
5.3 TRAFFIC
The existing roadway network and site access road are adequate to serve the Facility and no
transportation improvements will be required for construction or operation. Access to the site
will be provided off Summit Avenue via 3rd Avenue (County Road 5). The closest main
highway serving the facility is Highway 14 located approximately one-half mile to the south. A
diamond intersection is located at the 3rd Avenue crossing providing a safe entrance and exit to
and from the highway. There are no private residences along Summit Avenue or along the
section of 3rd Avenue between Summit and Highway 14 that would be affected by traffic
generated by the Facility. Vehicles going to and from the Facility would not have to pass
through the central business district or any nearby residential neighborhoods.
During normal operations, the Facility will employ approximately 24 full-time employees and
the impact on existing traffic is expected to be insignificant. Natural gas is the primary fuel for
the combustion turbines and will be transported to the site via an underground gas pipeline to be
constructed and connected to the main natural gas pipeline located approximately three miles
away. To ensure uninterrupted operation of the Facility and maintain MAPP accreditation, fuel
oil will be stored on-site and burned as a back-up fuel. The fuel oil will be stored in an
aboveground storage tank with a capacity of up to 900,000 gallons, which represents
approximately 36 hours of uninterrupted electricity generation (with two combustion turbines
operating) when the primary fuel is unavailable. Fuel oil will be delivered to the site via tanker
truck.
Mankato Energy has applied for an air emissions permit to operate the facility for up to 875
hours per year (roughly five weeks) on fuel oil but anticipates actual usage to be much less than
T:\1294\01\02\Mankato Site Permit App.doc Mankato Energy Center Site Permit Application 5-10

this as interruptions or curtailment of the natural gas supply are expected to be rare, isolated, and
of limited duration. Fuel oil tanker trucks hold an average of 7,000 gallons of fuel. Therefore, in
the extremely unlikely event of an extended use of fuel oil, it would take approximately 130
tanker truck deliveries to refill the storage tank. This would present a temporary, but significant,
increase in traffic on the local roadways. Fuel tanker truck deliveries could be spaced over
several days to refill the storage tank after the primary fuel supply has been restored; however, if
the primary fuel supply were interrupted for a period of time beyond the onsite storage capacity,
the average number of tanker truck delivering back-up fuel to the facility would be
approximately 56 trucks per day.
Existing traffic levels will increase temporarily during construction of the facility and will vary
during different phases of the construction period. Construction of the Facility will take place
over a period of approximately 20 months and will employ as many as 450 construction workers
at peak construction periods. It is anticipated that workers commuting to the site from the three-
county area (Blue Earth, Nicollet, and Le Sueur) will fill most of the construction job needs.
Construction traffic at the site will include the movement of work crews, delivery of construction
equipment and materials, and support personnel.
Impacts on local roads can be expected at the beginning and end of each workday and at shift
changes. Occasional large and/or slow-moving vehicles on local roadways (similar to the
movement of existing farm equipment and machinery) and utilities installed to serve the facility
(gas, sewer, water, telephone, etc.) may also temporarily impact traffic during construction and
could result in temporary lane closures and/or traffic rerouting. These temporary closures and
rerouting would be coordinated with the City, Township, and County as appropriate. A set of
existing railroad tracks no longer in use run along the south side of the site. It has not yet been
determined whether these tracks and the existing railway system will be utilized to deliver any
materials or equipment during construction of the facility. If the rail line is utilized, it would be
limited to transporting a few pieces of very large equipment and possibly some bulk equipment
like boiler pipes and traffic impacts would be minimal.
T:\1294\01\02\Mankato Site Permit App.doc Mankato Energy Center Site Permit Application 5-11

Given the location of the Facility in an industrial area on the edge of town and the capacity of
existing highways and local roads serving the site and surrounding area, vehicular traffic during
construction and operation of the facility should not significantly affect existing traffic flows
except on rare occasions when the natural gas supply is interrupted and tanker trucks are needed
to deliver fuel oil on a continuous basis.
5.4 AIRCRAFT
The FAA requires notification of all structures with a height of greater than 200 feet above
existing ground elevation or those with the potential to obstruct air navigation. FAA Form 7460-
1, Notice of Proposed Construction or Alteration, requires identification of the exact coordinates
and height of structures. Through review of this application, the FAA determines whether any
interference with flight patterns will result in impacts and may require obstruction marking and
lighting for aviation safety.
The tallest building structures at the Facility will be the two HRSG stacks, which are proposed to
be 200 feet tall; therefore, no structures exceed the 200-foot threshold triggering FAA
notification. The Mankato Municipal Airport, located approximately 3.7 miles to the northeast
in Lime Township, is the closest active airport to the site. It is one of the busiest municipal
airports in the state with two paved runways that accommodates personal, business/commercial,
and instructional uses. Orientations of the two runways at the airport are such that the site is not
located within the general flight paths for aircraft landing or takeoff. Furthermore, the airport is
located on top of the river bluff and the base elevation of the airport (1,020 feet) is higher than
the elevation of the top of the stacks (995 feet). Because of the distance from the airport and the
orientation and elevation of the runways, the Facility should not represent a potential impact to
aircraft operations.
T:\1294\01\02\Mankato Site Permit App.doc Mankato Energy Center Site Permit Application 5-12
5.5 PLUMES
As flue gas is emitted from the stacks, the water vapor present in the flue gas can condense to
form a visible steam plume. In addition, water vapor emitted from cooling towers can result in a
similar, visible plume. The length and persistence of these visible plumes are influenced by the
prevailing weather conditions such as temperature, relative humidity, and wind speed. The
plumes will be most persistent and visible during cold and damp weather, principally during the
winter. On most days of the year, however, visible steam or vapor plumes, if present, will
disperse and evaporate after traveling only a moderate distance aloft.
The visible plumes from the stacks and from the cooling tower at the Facility are not expected to
impair visibility or safety on adjacent roadways. The plume rising from the 200-foot stacks
should dissipate well before reaching ground level. The cooling tower will be designed to
incorporate “high efficiency drift eliminators to minimize fogging and icing potential from the
plant. Summit Avenue and 3rd Avenue, the nearest adjacent roadways, are at least 800 feet away
from the cooling tower.
T:\1294\01\02\Mankato Site Permit App.doc Mankato Energy Center Site Permit Application 5-13

6.0 Effects on Land-Based Economies
The Cities of Mankato and North Mankato with a combined population of 44,245 have
experienced tremendous growth over the past decade, evolving into a regional retail,
manufacturing, health care, and trade center providing goods and services to the surrounding
Counties of Blue Earth, Nicollet, and Le Sueur as well as other outlying areas of Southern
Minnesota. As previously discussed in Section 4.5, construction and operation of the Facility
will provide positive economic benefits to Mankato and the surrounding area.
The proposed project site is located within an area zoned for industrial use and is situated on the
southern portion of an old limestone quarry that has been mined to completion and is currently
being used as a demolition waste landfill and composting facility owned and operated by SMC.
The landfill began accepting construction and demolition wastes in 1992. SMC is currently in
the process of permitting a new demolition waste landfill site on property they own
approximately one mile to the north. SMC will eventually move their operations to this new site
once the storage capacity of the existing facility is reached and/or the landfill is closed. SMC
will be fairly compensated for the amount of land purchased by Mankato Energy upon which to
build their power plant.
As described below, the Facility will not affect the agricultural, forestry, or mining industries in
the area nor will the Facility adversely impact existing tourism.
6.1 AGRICULTURE
No agricultural land will be taken out of production as a result of the construction and operation
of the Facility. The closest agricultural lands are located approximately one-half mile to the
north and will not be affected by the Facility.
T:\1294\01\02\Mankato Site Permit App.doc Mankato Energy Center Site Permit Application 6-1

6.2 FORESTRY
There will be no adverse effects to the forestry economy as a result of the Facility. The Facility
site is not located on or near any commercial forestry land.
6.3 TOURISM
There will be no adverse effects to the tourism economy from the Facility. The Facility site is
not located on or near any tourist attractions.
6.4 MINING
There will be no adverse effects to the mining economy from the Facility. The Facility site is a
former limestone quarry that has been mined to completion. There are other old limestone
quarries in the area but no active mining is taking place at this time. Land is currently being
cleared along the west side of County Road 5 approximately one-mile north of the site for a
future gravel mining operation, but this area will not be affected by the Facility.
T:\1294\01\02\Mankato Site Permit App.doc Mankato Energy Center Site Permit Application 6-2

7.0 Archaeological and Historic Resources
Information was requested from the SHPO about possible archeological, historical, or
architectural resources located on or near the proposed project site. A response letter dated
September 9, 2003 was received from SHPO indicating that no known or suspected
archeological, historical, or architectural resources are present in the area that would be affected
by the project (see attached letter in Appendix C). Based on these findings and due to the
disturbed nature of the site from past limestone and gravel mining activities, construction and
operation of the proposed Facility will have no impact on any such resources.
T:\1294\01\02\Mankato Site Permit App.doc Mankato Energy Center Site Permit Application 7-1

8.0 Effects on the Natural Environment
8.1 AIR QUALITY
The maximum projected air quality impacts on plants, animals, and soils resulting from
construction and operation of the Facility are anticipated to be insignificant. As identified
previously in Section 5, the projected impacts from the Facility will comply with the primary and
secondary NAAQS and PSD increment standards. EPA has set the primary standards to protect
human health, and the secondary standards to protect public welfare, including that of visibility,
plants, soils, and animals. The PSD increment standards prevent the degradation of air quality in
areas with clean healthful air.
Additional information was gathered to further support this conclusion. Land in the immediate
vicinity of the proposed Facility, is classified in the 1999 Blue Earth County Land Use and
Cover Survey as consisting of gravel pits and open mines (mostly gravel and non-paved
surfaces.) Compliance with the secondary NAAQS will ensure that there are not adverse
impacts to the types of soils and vegetation in the vicinity of the proposed Facility.
8.2 LAND
Site topography and a visual record of existing conditions are provided in Figure 9. The Facility
site is approximately 25 acres in size and is located within an area zoned for industrial use. This
site is situated on the southern portion of an old limestone quarry that has been mined to
completion and currently serves as a demolition waste landfill and composting facility owned
and operated by SMC. A set of railroad tracks no longer in use runs along the south side of the
site. A paved access road to the site is provided from the south off Summit Avenue. Based on
T:\1294\01\02\Mankato Site Permit App.doc Mankato Energy Center Site Permit Application 8-1

available records, the limestone quarry began operations back in the mid-1950s. In 1992, the site
began accepting construction and demolition wastes under a permit issued by the MPCA.
The site currently contains a few buildings used primarily for sorting demolition waste materials
and storing equipment. An outside storage area containing sanitary and storm sewer pipe and
miscellaneous construction material is located on the east side of the site. A mobile trailer
located on the southern portion of the site is currently being used by SMC for office space. The
truck scale, recycling bins, and compost piles also are located in this area. The facility accepts
yard and garden waste, brush, and other vegetation debris, which is processed, placed into
compost piles and then sold to the general public. SMC also sells landscaping materials
including wood chips, decorative rock, and retaining wall blocks, which are stored outside on the
site property. A recently improved gravel haul road leading to active fill areas of the demolition
waste landfill is located on the west side of the site.
The majority of the site has been previously disturbed by activities associated with past gravel
and limestone gravel mining activities and more recently with demolition waste landfill and
compost operations described above. Wooded areas exist on the east edge of the site along a
drainage ditch, which receives stormwater runoff from the site and surrounding areas and flows
northerly to the Minnesota River. A railroad trestle is located east of the site access road where
the railroad tracks cross the drainage ditch. Wooded areas also exist along the south side of the
site along the railroad tracks.
Mankato Energy conducted a Phase I Environmental Site Assessment in September 2003 to
determine the potential for environmental liabilities associated with the Facility site and adjacent
properties. Findings from this environmental assessment are documented in a report prepared by
Wenck Associates, Inc. dated October 2003. Subsequently, a Limited Phase II Environmental
Site Assessment (“Phase II”) was conducted by Mankato Energy in November 2003 focusing on
those recognized environmental conditions identified in the Phase I study relevant to the site
itself. The Phase II study included a subsurface investigation that involved soil and groundwater
sampling at five locations. Based on the results presented in the Phase II report prepared by
T:\1294\01\02\Mankato Site Permit App.doc Mankato Energy Center Site Permit Application 8-2

Wenck Associates, Inc. dated December 2003, it was determined that no environmental hazards
were evident at the Facility site due to past land use that would require further action.
As shown on the site plan aerial overlay provided in Figure 11, roughly three-quarters of the 25-
acre site would be developed as part of the Facility. The proposed development is generally
confined to areas of the site previously disturbed by activities associated with gravel and
limestone gravel mining activities and demolition waste landfill and compost operations.
Existing wooded areas located along the east and south sides of the site will not be disturbed and
will continue to serve as a buffer and visual barrier between the site and adjacent properties
while also providing wildlife habitat.
Based on the contours from the topographic site survey completed by Mankato Energy in
November 2003, existing ground elevations on the site vary from approximately 780 feet to 810
feet. A large amount of cut and fill will be required to adequately level the site and allow for
construction of the Facility at a planned base elevation of 795 to 800 feet. The demolition waste
landfill operates under a MPCA permit that specifies a closure plan. The existing closure plan
will be amended to include a 50-foot setback between the north property line of the Facility site
and demolition waste landfill material that will eventually be placed in this part of the landfill as
part of the ongoing landfill operations. The final grade of the landfill cover will slope upwards
from this point at an approximate 5:1 slope to its planned final landfill elevation of
approximately 840 feet.
8.2.1 Subsurface Investigations
Eight soil borings were taken at various depths across the site in September 2003 as part of a
preliminary subsurface investigation and geotechnical evaluation. The investigation was
performed to determine existing soil conditions and aid in the design of building and major
equipment foundations, floor slabs, pavements, utility support, and earthworks for the Facility.
Subsurface site information was collected to help describe the site geology, characterize existing
soil conditions, and determine groundwater levels in the area. Results of the soils investigation
T:\1294\01\02\Mankato Site Permit App.doc Mankato Energy Center Site Permit Application 8-3

are provided in a written report to Calpine prepared by STS Consultants, Ltd., dated October 15,
2003.
The site is situated on a topographic high point in the area that has been impacted by historic
gravel and limestone quarrying operations. Based on bedrock geology mapping, the site is
located within a small residual knob of Platteville limestone underlain by Jordan sandstone. The
area surrounding the site was eroded during and after glacial times, and it consists of reworked
sandstone and outwash sand and gravel deposits resulting from flow through the glacial valley of
the Minnesota River. The limestone bedrock quarrying operations has resulted in removal of
most of the limestone from the site to the sandstone interface. Groundwater is estimated to flow
in a westerly direction toward the Minnesota River.
The soil profile generally consists of fill material of varying thickness consisting primarily of
sand, silty sand, gravel, clay, topsoil, and concrete rubble overlying weathered limestone bedrock
or Jordan sandstone. During the investigation, groundwater was encountered in three of the eight
borings varying in depths from 6.9 to 21.5 feet below the ground surface, corresponding to
elevations from 775 to 795 feet. The higher water level observed in one of the borings is likely
perched water above clayey fill material that was encountered. The long-term hydrostatic
groundwater table is probably closer to the lower elevation of 775, which is consistent with the
average groundwater levels observed in the monitoring wells installed on the site as part of the
Limited Phase II study described above. Variations in the location of the groundwater table
should be expected seasonally and with variations in precipitation, evaporation, and surface
runoff. Based on the above information, groundwater levels are roughly 20 feet below the
Facility’s proposed minimum base elevation of 795 feet and therefore, should not be impacted
during construction and operation of the Facility.
T:\1294\01\02\Mankato Site Permit App.doc Mankato Energy Center Site Permit Application 8-4
8.3 WATER RESOURCES
8.3.1 Floodplains
A review of the Federal Emergency Management Agency (“FEMA”) mapping done for Blue
Earth County and the City of Mankato indicate that the Facility site is not located with a
regulated 100-year floodplain area. Designated 100-year floodplain areas along the Minnesota
River within Blue Earth County and the City of Mankato were delineated as part of FEMA’s
National Flood Insurance Program. Figure 12 shows 100-year floodplain areas within the
general vicinity of the site. The 100-year floodplain elevations range from 774 to 775 feet.
Existing ground elevations vary from 780 feet in the low area of the old limestone quarry on the
north side of the site to 810 feet on the south side of the site where SMC’s office building and
compost piles are located. The final base elevation for the developed portion of the Facility site
is anticipated to be between 795 and 800 feet. Therefore, any site grading, excavation, and fill
activities associated with site development would occur well above the 100-year floodplain and
would not result in any floodplain impacts or undue risk of flooding.
8.3.2 Shoreland Protection Areas
Based on discussions with City of Mankato staff, the drainage ditch running along the east side
of the site is classified as a tributary stream in the Blue Earth County Shoreland Ordinance. Any
proposed structures must maintain a 50-foot setback from the top of the bank of the channel or a
10-foot setback from the top of the embankment if the embankment slope is greater than 10
degrees and further than 50 feet from the stream. These setback requirements are in place to
minimize impacts to the stream and protect water quality and have been taken into account in
preparing the site layout plan for the facility.
8.3.3 Wetlands
Based on visual observations made during site visits and review of existing wetland mapping,
there is no indication that existing wetlands would be impacted by the project. The U.S. Fish and
T:\1294\01\02\Mankato Site Permit App.doc Mankato Energy Center Site Permit Application 8-5

Wildlife National Wetlands Inventory (“NWI”) maps were reviewed to make a preliminary
evaluation of possible wetlands located on the project site. NWI maps covering the area were
prepared in 1990 based on interpretation of high altitude 1980 aerial photography and limited
field checks to classify and delineate approximate wetland locations.
Figure 13 shows the wetland areas identified on the NWI map within the general vicinity of the
project site. These wetlands are confined to low outlying areas and are generally classified as
seasonally flooded basins and inland shallow marshes. Since the portion of the site to be
developed for the Facility is in upland areas or within disturbed areas of the former limestone
quarry and current demolition waste landfill and composting site, it appears that no existing
wetlands would be impacted by the project.
The DNR Public Waters Inventory map for Blue Earth County (revised 1996) also was reviewed
for the presence of regulated waters and wetlands. The Minnesota River and an unnamed
tributary to the north that flows along the north side of the landfill and into the Minnesota River
are both classified as DNR protected watercourses. No other state protected waters or wetlands
are located in the general vicinity of the Project area.
The actual route and required easements across adjacent properties needed for the wastewater
discharge pipe from the Facility site to the Minnesota River have not been finalized at this time.
It is anticipated that the pipe will extend to the north and then turn west to the river, passing
through land owned by SMC. The buried pipe will have to cross the wetland area shown on
Figure 13 at some point. Wetland areas will be temporarily impacted during installation of the
pipe, but the utility work will not alter the original cross-sections of the basin. Impacts to the
wetland will be minimal, and all disturbed areas will be properly restored. Installation of the
pipe would be exempt from the Minnesota Wetland Conservation Act and will be covered under
a U.S. Army Corps of Engineers (“ACOE”) General Permit. Mankato Energy will obtain other
necessary permits from the DNR and ACOE for construction of the discharge outfall pipe and
structure along the bank of the Minnesota River.
T:\1294\01\02\Mankato Site Permit App.doc Mankato Energy Center Site Permit Application 8-6

8.3.4 Groundwater
No groundwater wells will be installed on site to serve the Facility and, therefore, no adverse
impacts to groundwater resources are anticipated. As discussed previously, raw water for
cooling and process water will be supplied in the form of treated wastewater effluent (“gray
water”) taken from the Mankato WWTP and piped through a dedicated line to the Facility. The
Mankato WWTP, which recently underwent a major upgrade and expansion in 2000, has
adequate capacity to meet the Facility’s water needs. The use of the gray water as a water source
will not require a DNR water appropriation permit. The DNR has made a determination that
gray water is not considered to be a "water of the state", and therefore is not regulated by the
DNR relative to water appropriation and consumptive use. Despite this regulatory
determination, the Minnesota Legislature approved the consumptive use of water for the
proposed Facility during its 2003 Legislative session.5
Potable water will be supplied by the City of Mankato’s municipal water supply system through
a lateral service line and used for steam cycle makeup and fire water, as well as for domestic
uses such as drinking water, eye wash stations, showers, toilets, sinks, and other incidental water
needs. Chemicals used at the Facility will be stored indoors or within appropriate containment
areas. Fuel oil storage tanks and unloading areas will be equipped with secondary containment
in accordance with federal SPCC requirements.
8.3.5 Stormwater Runoff
Stormwater runoff from the east half of the site currently flows overland to an existing drainage
ditch that flows along the east side of the site. Adjacent industrial properties to the south and
east of the site also drain to the ditch, which flows in a north/northwesterly direction discharging
to the Minnesota River. The Minnesota River, flows in a northeasterly direction eventually
discharging into the Mississippi River near Fort Snelling in St. Paul.
5 Minnesota Session Laws 2003, 1st Special Session, Chapter 11, Article 3, Section 15.
T:\1294\01\02\Mankato Site Permit App.doc Mankato Energy Center Site Permit Application 8-7

The west half of the site drains to the north into the bottom of the old limestone quarry where
stormwater runoff is then routed to a sediment basin located along the east side of the demolition
waste landfill. The sediment basin, constructed by SMC as part of the landfill’s operation plan,
also receives drainage from landfill areas to the north including both active fill areas and areas
that have been filled to capacity, capped, and vegetated. The sediment basin discharges to the
drainage ditch through a plastic perforated standpipe located on the east side of the basin. The
majority of the stormwater flowing into the basin infiltrates into the underlying permeable soils.
According to SMC staff, discharges from the stormwater basin to the drainage ditch typically
occur only in April or during heavy rainfall events.
As stated previously and as shown on the preliminary site plan aerial overlay (see Figure 11),
roughly three-quarters of the 25-acre site will be disturbed during site grading and construction
activities. Impervious surfaces will be added such as buildings and structures, power generation
equipment, concrete equipment pads, storage tanks, paved areas, and access and service roads
that will affect site drainage. There will also be hard-packed gravel surfaces scattered
throughout the Facility. Other areas of the Facility site will be landscaped as appropriate with
grass, trees and shrubs. Stormwater runoff from the Facility site will be managed as described in
the next section.
8.3.5.1 Stormwater Management
An increase in stormwater runoff can be expected as a result of the added impervious surfaces
from the proposed Facility. Stormwater runoff from general plant areas (non-process areas) will
be directed to a stormwater pond to be constructed on the east side of the site next to the cooling
tower as shown on Figure 11. The stormwater pond will provide settling capacity and discharge
rate control prior to discharging to the nearby drainage ditch. The stormwater pond and outlet
will be designed to meet the City of Mankato’s requirements for water retention areas for new
development projects that create new impervious surfaces of one acre or greater. Due to the
nature of the existing permeable soils and underlying bedrock material, it is anticipated that the
pond will function similar to an infiltration basin, retaining water for short periods of time and
T:\1294\01\02\Mankato Site Permit App.doc Mankato Energy Center Site Permit Application 8-8

thus providing additional stormwater treatment and further reducing runoff volumes and peak
discharge rates.
Stormwater runoff coming into contact with the outdoor steam generator step-up transformer
pad, combustion turbine pads and other process areas where there is potential for pollutant
contamination by oils and other chemicals from pumps and motors, will be confined within
curbed areas and drain to two area sump pump systems. The stormwater that is collected will
then be routed to the Facility’s oil/water separator and recycled into the cooling tower make-up
water system. To ensure efficient operation of the oil/water separator, routine inspection and
maintenance will be performed and accumulated materials cleaned out on an as-needed basis.
All materials removed from the structure will be properly managed and disposed of offsite in
accordance with applicable local, state, and federal requirements.
The Facility site will be properly maintained and good site housekeeping practices will be
implemented to keep all road surfaces clean, reducing solids loading in stormwater runoff.
Landscaped areas and natural vegetation buffer strips along the perimeter of the Facility site,
which have low runoff potential, will provide further treatment of stormwater runoff by filtering
out nutrients and suspended solids and promoting infiltration into underlying permeable soils.
The proposed best management practices (“BMPs”) described above that will be implemented at
the Facility have been proven to be effective methods of treating stormwater runoff and are
management techniques typically recommended by the MPCA, watershed management
organizations, and other water management and planning agencies. As a result, stormwater
runoff from the Facility is not expected to adversely affect the flow rates or water quality in
downstream receiving waters. The existing sediment basin constructed as part of the demolition
waste landfill will not be affected by construction of the Facility and will continue to serve
runoff from landfill areas in accordance with the landfill closure plan.
T:\1294\01\02\Mankato Site Permit App.doc Mankato Energy Center Site Permit Application 8-9

8.3.5.2 Storm Water Pollution Prevention Plan
A Stormwater Pollution Prevention Plan (“SWPPP”) will be prepared for the Facility in
compliance with coverage under Minnesota NPDES General Stormwater Discharge Permit MN
G611000 for industrial activities. The SWPPP will identify potential pollutant sources at the
Facility, outline operating procedures for material handling activities, and describe controls and
BMPs that will be implemented to minimize pollutants in stormwater runoff. In addition to the
stormwater management provisions described above, management practices will also include
storage of chemicals indoors or within appropriate containment areas, good site housekeeping
practices, and proper disposal of any waste materials.
8.3.5.3 Erosion and Sediment Control
A large amount of cut and fill will be required to adequately level the site and allow for
construction of the Facility to the planned base elevation. It is likely that borrow material
obtained from higher elevations will be used for fill material in low areas. A significant portion
of the on-site fill consists of fine to medium sand, which is suitable material for use in building
areas. Concrete rubble that is excavated will likely be crushed and reused as structural fill below
equipment and buildings and to balance soils on the site. If any of the existing soil material on
the site is found to be unsuitable for use, it will be excavated and hauled offsite and placed in a
designated upland area.
Since construction of the Facility will disturb more than one acre of land, a permit application for
coverage under Minnesota NPDES General Stormwater Discharge Permit MN R100001 for
construction activities is required and will be submitted to the MPCA prior to construction. The
permit application certifies that temporary and permanent erosion and sediment control plans
have been prepared and implemented to prevent soil particles from being transported offsite.
This general permit requires that runoff from a project’s new impervious surfaces must be
directed to an on-site stormwater treatment facility when development creates one or more acres
of cumulative impervious surface. The proposed stormwater pond will satisfy this requirement
and will be designed to in accordance with the criteria set forth in the General Permit for
T:\1294\01\02\Mankato Site Permit App.doc Mankato Energy Center Site Permit Application 8-10

sedimentation/infiltration basins. The pond will also serve as a temporary sediment basin during
construction.
Mankato Energy will work with the City of Mankato to ensure that adequate measures are taken
to minimize soil erosion and sedimentation on the site. Temporary erosion and sediment control
measures will be maintained during construction and will remain in place until the Facility site
has been stabilized and vegetation has been reestablished. In addition to the stormwater pond,
control measures such as silt fence, staked hay bales, sediment filters and traps, erosion control
matting, mulching, and crushed rock pads will also be used where applicable. All disturbed
areas of the Facility site will be seeded and mulched as soon as practical after the grading,
excavation work, and final development have been completed.
8.3.6 Temporary Dewatering
Temporary site dewatering of local groundwater may be required to facilitate excavation for
building and equipment foundations and underground utility installation work. If dewatering is
required, appropriate permits and approvals will be obtained from the DNR. Temporary
dewatering, if required, is expected to have a minimal impact on groundwater levels outside the
Facility development area.
8.3.7 Wastewater Discharges
The Mankato Energy Center will have two separate discharge points - one each for process and
domestic wastewater. The Facility has been designed to maximize water reuse and recycling and
to minimize wastewater discharges. As discussed in Section 2.7 and shown on the water usage
flow diagram (Figure 6), process wastewater consisting of cooling tower blowdown, reverse
osmosis reject, and other minor low volume waste streams will be discharged to the Minnesota
River under an NPDES discharge permit to be obtained from the MPCA. Boiler blowdown and
oil/water separator decant will be recycled to supplement the makeup water for the cooling tower
and are components of the cooling tower blowdown.
T:\1294\01\02\Mankato Site Permit App.doc Mankato Energy Center Site Permit Application 8-11

It is estimated that the discharge rate to the Minnesota River will be approximately 0.69 MGD
under average conditions and 1.47 MGD under maximum summertime conditions. The actual
rate of discharge will be influenced by the ambient temperature and operating load of the
Facility. Due to evaporative losses of water through the cooling tower, the dissolved solids in
the gray water will become more concentrated as the water is recirculated. However, the total
mass of dissolved solids will be essentially the same as that taken from the City of Mankato’s
WWTP. Any residual volatile compound left in the gray water after pretreatment will be
expected to have been removed at the cooling tower and therefore will not be expected in the
discharge effluent.
Process wastewater will be treated onsite with a phosphorus removal and dechlorination system
prior to discharge to the river. The Facility’s wastewater treatment equipment will be located in
the northwest corner of the site as shown on Figure 11. The phosphorus removal system will
consist of adding ferric chloride to the wastewater stream to chemically react with the phosphate
and induce precipitation of iron phosphate. The precipitate that settles out in the clarifier is
transferred to a sludge thickener where the solids content is increased through the addition of a
polymer as a flocculant aid. The sludge is then transferred to a filter press where solids
containing the precipitated phosphate are removed. The dewatered solids are collected and
transported off site for proper disposal. The treated wastewater from the clarifier is then routed
through a dechlorination system to remove residual chlorine prior to being piped to the
Minnesota River.
A minor amount of wastewater also will be generated from intermittent off-line washing of the
combustion turbines to remove any particulates accumulated on the compressor blades. The
used wash water will be collected and stored in an onsite holding tank and will be trucked to a
permitted offsite disposal facility by a licensed hauler on an as-needed basis.
The NPDES permit application is currently being prepared by Mankato Energy and is expected
to be submitted to the MPCA in March 2004. The NPDES permit will regulate the wastewater
discharge from the plant to ensure the protection of humans, aquatic life, wildlife, and beneficial
uses of the Minnesota River. The NPDES permit will include discharge limitations and
T:\1294\01\02\Mankato Site Permit App.doc Mankato Energy Center Site Permit Application 8-12

monitoring requirements to ensure compliance with permit conditions and water quality
standards for the Minnesota River.
Gray water from the Mankato WWTP that is treated and routed to the Facility would otherwise
be discharged directly to the Minnesota River under the Mankato WWTP’s existing NPDES
permit. Because this gray water will be further treated prior to being piped to the Facility, and
because the wastewater generated from the Facility will be treated for phosphorus and chlorine
removal prior to discharge from the Facility as described above, it is anticipated that phosphorus
and total suspended solids loads to the Minnesota River will be reduced as a direct result of the
Facility’s planned water use and discharge.
Domestic wastewater generated from the Facility will be discharged directly to the City of
Mankato’s sanitary sewer system through a lateral service connection line. This discharge will
be authorized by the City of Mankato and subject to any appropriate discharge limits and
monitoring requirements.
8.4 BIOLOGICAL RESOURCES
As discussed in Section 9, the U. S. Fish and Wildlife Service (“USFWS”) and the Minnesota
DNR were contacted about possible threatened and endangered plant and animal species that
may exist at or near the Facility and may be affected by the its construction and/or operation.
According to correspondence with the USFWS and DNR, review of their records indicates that
no significant species have been documented at the Facility site. Based on these findings and the
disturbed nature of the existing site and surrounding area, the Facility should not adversely affect
any significant biological resources including plants, animals, and critical wildlife habitat areas.
Although there may be some loss of vegetation, trees, and shrubs as a result of the Facility’s
construction, abundant wildlife habitat exists in areas surrounding the Site.
Existing wooded and wetland areas located on the east, west, and south sides on the Facility site
will not be disturbed by the development of the proposed Facility and will continue to provide
T:\1294\01\02\Mankato Site Permit App.doc Mankato Energy Center Site Permit Application 8-13

wildlife habitat for birds, deer, and other animals found in the area. The Facility site is located
approximately 1,800 east of the Minnesota River. As discussed previously, stormwater runoff
will be routed through an onsite stormwater pond prior to discharging into the existing drainage
ditch that flows into the Minnesota River. As a result of the substantial distance from the
Minnesota River and the stormwater management system that will be utilized at the Facility, the
Facility will not adversely affect fish and aquatic species or their habitat.
T:\1294\01\02\Mankato Site Permit App.doc Mankato Energy Center Site Permit Application 8-14

9.0 Rare and Unique Natural Resources
A review of the Minnesota Natural Heritage Information System database was requested from
the DNR to determine if any rare plant communities or animal species, unique resources, or other
significant natural features are known to occur on or near the proposed project site. As stated in
a letter from the DNR dated September 11, 2003, results of the database search indicated that
nine rare features consisting of animals (snakes, fish, and birds) and natural plant communities
(mesic prairie and floodplain forest) were known to occur within the vicinity of the project area.
These rare features are beyond the site boundaries and, therefore, will not be directly affected by
the project. This finding is confirmed in the DNR letter, which concludes that based on the
nature and location of the proposed project, the known occurrences of rare features identified by
the search would not be affected. A copy of the DNR letter is provided in Appendix D.
Information was also requested from the USFWS in a letter dated August 21, 2003 about
possible federally threatened and endangered species that may exist at or near the proposed
project site. Mankato Energy was verbally informed in a follow-up telephone conversation on
September 5, 2003 with Lori Fairchild, USFWS Wildlife Biologist covering Blue Earth County,
that a review of their records indicates that no federally listed species have been documented
near the project area. Based on this finding, she stated that the project would not adversely affect
any threatened and endangered species or their critical habitat. Due to budget constraints, the
USFWS only responds in writing if any issues or effects have been identified. The agency no
longer sends out confirmation letters if a “no effect” determination has been made.
T:\1294\01\02\Mankato Site Permit App.doc Mankato Energy Center Site Permit Application 9-1

10.0 Unavoidable Adverse Effects and Mitigative Measures
As discussed and documented within this application, the Mankato Energy Center will not cause
significant adverse effects to humans or the environment. As with any type of development,
there will be some unavoidable impacts; however, the Facility has been designed to minimize
potential impacts to the greatest practical extent. Furthermore, as listed in Table 11-1 in the next
section, Mankato Energy will obtain all federal, state, and local permits required for construction
and operation of the Facility.
Unavoidable impacts to the local community and natural environment are summarized below.
Noise Impacts
Noise will be generated during construction and operation of the Facility. The Site is located
within an established industrial area on the edge of Mankato more than one-half mile from the
nearest residential areas and approximately 1,500 feet from the nearest residential dwelling. Due
to the planned noise mitigation measures that will be taken at the Facility, other noise sources in
proximity to the Facility, and the distance to sensitive noise receptors, it is anticipated that any
noise generated due to Facility construction and operation will not adversely affect the
surrounding area. The Facility will comply with the Minnesota Noise Standards (Minnesota
Rules 7030.0040) for all off-site receptors.
Visible Plumes
Exhaust stacks associated with plant equipment, as well as the Facility’s cooling tower may
occasionally produce visible steam and vapor plumes. The length and persistence of these
plumes are influenced by the prevailing weather conditions such as temperature, relative
T:\1294\01\02\Mankato Site Permit App.doc Mankato Energy Center Site Permit Application 10-1

humidity, and wind speed. The plumes will be most persistent and visible during cold and damp
weather, principally during the winter. On most days of the year, however, visible steam or
vapor plumes, if present, will disperse and evaporate after traveling only a moderate distance
aloft and should not impact local roadways or residences. The impacts of these plumes, if any,
will be aesthetic, rather than environmental.
Air Emissions
Air pollutant emissions will be generated from the Facility as a result of combustion of fuels
from several sources within the proposed facility. The primary sources of combustion-related air
pollutant emissions are the combined-cycle gas turbines and associated duct firing systems.
Secondary sources of combustion-related emissions include the auxiliary boiler, emergency
generator, and fire pump engine. These emissions will result in ambient impacts that represent
only minor fractions of the applicable air quality standards and, therefore, will not adversely
impact public health and safety, plants, animals, or soils. Advanced emission control equipment
will be designed and implemented at the Facility to mitigate emissions to the air through the
exhaust stacks and from other equipment. Mankato Energy must obtain the required state and
federal air permits prior to construction and operation of the Facility and will comply with
requirements to monitor and test air pollutant emissions to demonstrate compliance with
established permit limits.
Traffic
Overall, vehicle traffic levels in the area will temporarily increase during construction of the
Facility and will vary during different stages of the construction period, which is expected to last
about 20 months. Minor impacts on local roads can be expected at the beginning and end of
each workday and at shift changes. To ensure the capability of the Facility to operate in the
event of a natural gas curtailment and maintain MAPP accreditation, fuel oil will be stored on-
site and burned as a back-up fuel. Because of the limited amount of onsite fuel storage capacity,
tanker trunks delivering fuel oil to the Facility during gas curtailments would represent a
temporary, but significant increase in traffic on the local roadways. Mankato Energy will be
T:\1294\01\02\Mankato Site Permit App.doc Mankato Energy Center Site Permit Application 10-2

limited under the MPCA air emissions operating permit as to the amount of time that each
combustion turbine is allowed to operate while firing on fuel oil. Instances where fuel oil will be
used is expected to be rare, isolated, and of limited duration. Furthermore, fuel tanker truck
deliveries required to refill the fuel storage tank(s) will be spaced over several days where
possible to minimize traffic impacts to the extent possible.
Wastewater Discharges
Cooling tower blowdown and low volume wastewater from the Facility will be discharged to the
Minnesota River. The process wastewater will be treated with ferric chloride and will be
processed through a dechlorination system to remove phosphorus and residual chlorine prior to
discharge to the river. This discharge will be authorized by an NPDES permit to be issued by the
MPCA. This permit will include discharge limitations and monitoring requirements to ensure
compliance and protection of humans, aquatic life, wildlife, and beneficial uses of the Minnesota
River.
T:\1294\01\02\Mankato Site Permit App.doc Mankato Energy Center Site Permit Application 10-3

11.0 Permits and Approvals
In addition to applying for a Site Permit in accordance with the Minnesota Power Plant Siting
Act as documented herein, the proposed project will require numerous federal, state, and local
permits and approvals for construction and operation of the Facility. Anticipated permits and
approvals are listed below in Table 11-1 and were discussed in previous sections of this permit
application.
TABLE 11-1 REQUIRED PERMITS AND APPROVALS
Unit of Government* Type of Approval Regulated Activity Status
Federal
FAA Notice of Proposed Stack Construction
Stack height greater than 200 feet above ground level
To be provided
U.S. EPA Acid Rain Permit Title IV Acid Rain Certificate of Representation for the discharge of sulfur oxides
To be obtained
Risk Management Plan/Process Safety Management (RMP/PSM)
Risk management plan is required for facilities possessing more than threshold quantities of regulated chemicals (e.g., anhydrous ammonia)
To be developed
Notice of Hazardous Waste Generation
Hazardous waste generation To be provided if needed; anticipated to qualify as CESQG
USACOE Section 404 Permit; GP/LOP-98-MN
Discharges of dredged or fill material within wetland areas associated with installation of cooling water discharge pipe and outfall structure; covered by General Permit (non-reporting)
No application required; confirm compliance with general permit terms and conditions prior to construction
Section 10 Permit Construction of outfall structure at the Minnesota River (a navigable water)
To be obtained
U.S. Fish & Wildlife Service
Threatened and Endangered Species Review
Review of agency records for federally threatened and endangered species that may exist at or near the site and may be affected by the project
Completed - Verbal comments received Sep-5-03
T:\1294\01\02\Mankato Site Permit App.doc Mankato Energy Center Site Permit Application 11-1

TABLE 11-1
REQUIRED PERMITS AND APPROVALS Unit of Government*
Type of Approval Regulated Activity Status
State of Minnesota
PUC Certificate of Need Certification that electricity generated by the facility is needed
Pending - Application submitted Mar-2-04
MAPP Approval as a Network Resource for Xcel
Generator interconnection and transmission access
To be obtained
EQB Power Plant Siting Permit
Review of potential human and environmental impacts associated with the siting of a large electric power generating plant. Qualifies for alternative review process for facilities fueled by natural gas
Pending - Permit application submitted Mar-4-04 (this document)
SHPO Cultural Resources Review
Review of agency records for the presence of archeological, historical, or architectural resources at or near the site that may be affected by the project
Completed - Received comment letter dated Sep-9-03
MDNR
Minnesota Natural Heritage Database Review
Review of the Minnesota Natural Heritage Information System database for the presence of any rare plant communities or animal species, unique resources, or other significant natural features at or near the site that may be affected by the project
Completed - Received comment letter dated Sep-11-03
Protected Waters Permit
Construction of outfall structure at the Minnesota River
To be obtained
MPCA NPDES/SDS Discharge Permit
Discharge of cooling water and other low volume wastewater to the Minnesota River
To be obtained
NPDES/SDS General Stormwater Discharge Permit (MN R100001) for Construction Activities
Stormwater discharges associated with construction activities disturbing one or more acres of land
To be obtained
NPDES/SDS General Stormwater Discharge Permit (MN G611000) for Industrial Activities
Stormwater discharges associated with industrial activities at the Facility. Coverage under the permit requires preparation of a Stormwater Pollution Prevention Plan
To be obtained
Air Emission Facility Permit (Combined Construction and Title V Operating)
Air emissions - permitting requirements associated with federal PSD new source review and NSPS requirements, and other applicable state/federal requirements
Pending - Permit application submitted Dec-3-03
Air Toxics Review Air emissions risk analysis to evaluate potential health risks associated with burning low sulfur distillate oil as back-up fuel
Pending - AERA report submitted Feb-19-04
T:\1294\01\02\Mankato Site Permit App.doc Mankato Energy Center Site Permit Application 11-2

TABLE 11-1
REQUIRED PERMITS AND APPROVALS Unit of Government* Type of Approval Regulated Activity Status
MPCA Section 401 Water Quality Certification
Review and certification of construction activities affecting wetlands requiring a USACOE permit
To be obtained
Hazardous Waste Generator License
Hazardous waste generation To be obtained if needed
Spill Prevention, Control and Countermeasure Plan
Aboveground storage of greater than 1,320 gallons of fuel oil; plan to be prepared and maintained at the facility
To be completed
Oil and chemical storage requirements
Certain tank construction and installation requirements must be met; provisions and measures to prevent discharges will be incorporated in the design of the fuel oil storage tank
To be met
Local
City of Mankato Conditional Use Permit Electric generating facility within areas zoned M-2, Heavy Industrial District
To be obtained
Building Permit Site grading, development, construction, and occupancy approval
To be obtained
Minnesota Wetland Conservation Act Exemption
Exemption from wetland replacement associated with installation of cooling water discharge pipe through wetland areas
To be obtained
Orderly Annexation City of Mankato and Lime Township entered into Joint Resolution for Orderly Annexation whereby the City agreed to annex areas to be developed for industrial purposes.
To be obtained
Other Applicable permits/approvals for connections to municipal sewer and water as well and gray water from WWTP
To be obtained if required
Other
Utilities Utility Connection Permits and Approvals
Installation of necessary utilities and related equipment (e.g., water, wastewater, gas pipelines, transmission lines, telecommunications)
Responsibility of Supplier Gas pipeline permits listed in separate pipeline route permit application submitted to the EQB
*Abbreviations:
EPA United States Environmental Protection Agency EQB Minnesota Environmental Quality Board FAA Federal Aviation Administration MAPP Mid-Continent Area Power Pool MDNR Minnesota Department of Natural Resources MPCA Minnesota Pollution Control Agency
T:\1294\01\02\Mankato Site Permit App.doc Mankato Energy Center Site Permit Application 11-3

PUC Minnesota Public Utilities Commission SHPO Minnesota State Historical Preservation Office USACOE United States Army Corps of Engineers NPDES/SDS National Pollution Discharge Elimination System/State Disposal System NSPS New Source Performance Standards PSD Prevention of Significant Deterioration
T:\1294\01\02\Mankato Site Permit App.doc Mankato Energy Center Site Permit Application 11-4

12.0 Certificate of Need
On November 25, 2003, Mankato Energy submitted a written request to the PUC to: (1) seek
exemptions, pursuant to Minnesota Rules 7849.0200, Subp. 6, from certain Certificate of Need
data requirements that are not necessary to determine the need for an independent power
production facility; and (2) establish that the scope of data required for Mankato Energy’s
application for a Certificate of Need should relate only to power generated for the wholesale
market, excluding data related to power production already certified through a Commission-
approved resource plan solicitation.
Mankato Energy asked that the first request for exemption be granted because the data at issue is
either not applicable to a generation project proposed by an independent power producer, not
reasonably available to Mankato Energy, or not necessary to determine the need for the proposed
facility. With regard to the second request, Mankato Energy presented its position that it is both
prudent and efficient to confirm the scope of required data before filing its Certificate of Need
application with the PUC.
Comments on Mankato Energy’s request were submitted by the Minnesota Department of
Commerce on December 29, 2004 with a recommendation that approval with modifications be
granted. On January 8, 2004, Mankato Energy issued a response to the Department’s comments.
The PUC considered the matter at their January 22, 2004 meeting and approved Mankato
Energy’s request in its entirety with qualifications as suggested by PUC staff in its briefing
papers prepared for the meeting. The PUC’s findings are summarized in an Order dated
February 6, 2004.
Mankato Energy submitted a Certificate of Need application to the PUC on March 2, 2004 for
the additional equipment and associated generating capacity associated with the wholesale power
production of the plant.
T:\1294\01\02\Mankato Site Permit App.doc Mankato Energy Center Site Permit Application 12-1

Figures

1800 Pioneer Creek CenterMaple Plain, MN 55359-0249
Wenck Associates, Inc.Environmental Engineers
CO
PYR
IGH
T
Site Location Map (USGS Quadrangle)
MAR 2004
Figure 1
MANKATO ENERGY CENTER
Industrial Dr
Lim
e Va
lley
Rd
Co
Rd
5 (3
rd A
ve)
Hw
y 16
9
Hwy 14
Mankato
NorthMankato
Project Site
1250 0 1250 2500 Feet
L:\1294\01\apr file\FINAL_Figures\Figure 1: DRG Site Location Map
Mankato East Quadrangle, 1993Mankato West Quadrangle, 1993
N
Blue Earth County
Mankato

1800 Pioneer Creek CenterMaple Plain, MN 55359-0249
Wenck Associates, Inc.Environmental Engineers
CO
PYR
IGH
T
Site Location Map (Aerial Photograph) Figure 2
Minnesota River
Hwy 14
Hw
y 16
9
Co
Rd
5 (3
rd A
ve)
Lim
e V
alle
y R
d
Industrial Dr
Benning
Mankato
NorthMankato
Project Site
1250 0 1250 2500 Feet
L:\1294\01\apr file\FINAL_Figures\Figure 2: 1991 DOQ Aerial Photograph Note:3-m DOQs (source: Mn DNR)
Mankato East Orthophotoquad, 1991Mankato West Orthophotoquad, 1991
N
Blue Earth County
Mankato
MANKATO ENERGY CENTER MAR 2004

1800 Pioneer Creek CenterMaple Plain, MN 55359
Wenck Associates, Inc.Environmental Engineers
WenckMANKATO ENERGY CENTER
Process Flow Diagram
MAR 2004
Figure 3
Mankato Energy CenterProcess Flow Diagram
Combined Cycle 2x1 Configuration
ExhaustStack
Gas
Air
Combustion Turbine
Power
Exhaust GasHeat Recovery
Steam Generator
Exhaust
CoolingTower
CoolingWater
Cooling Tower Blowdown
Gas
Condenser
ExhaustStack
Heat RecoverySteam Generator
SteamTurbine
Exhaust Gas
Combustion Turbine
Gas
Gas
Condensate
Steam Power
Warm Water
Cool Water
Exhaust
Air Power
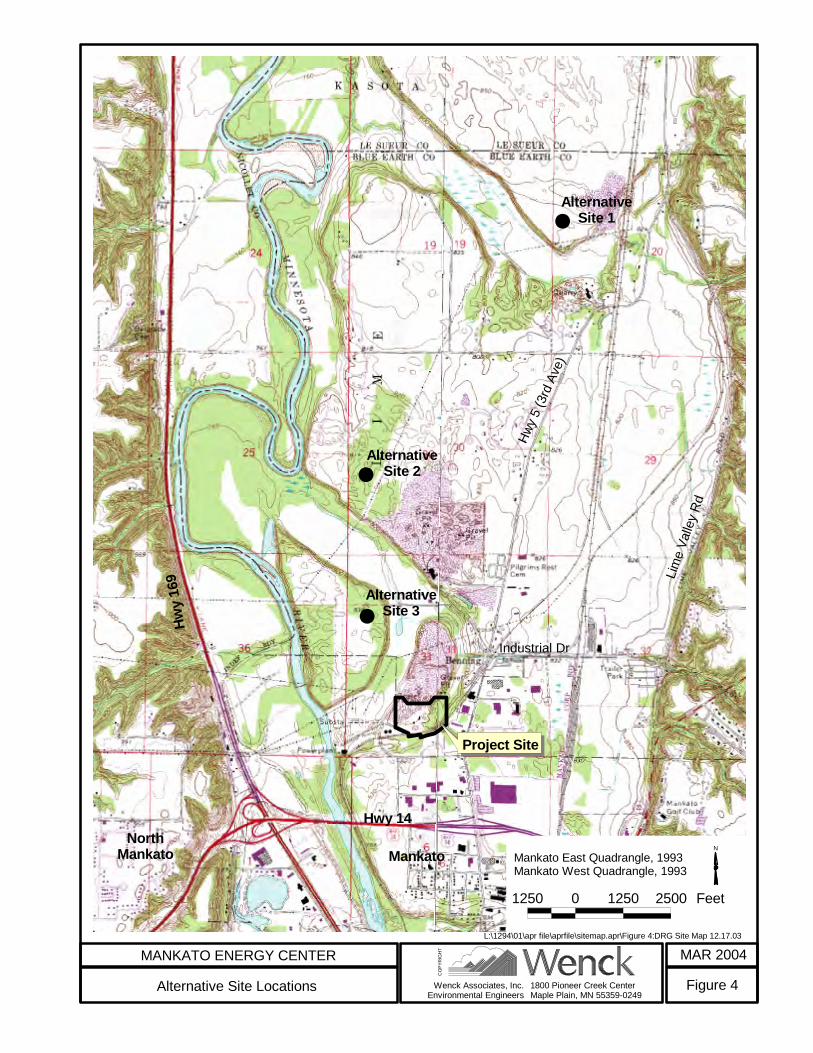
1800 Pioneer Creek CenterMaple Plain, MN 55359-0249
Wenck Associates, Inc.Environmental Engineers
CO
PYR
IGH
T
Alternative Site Locations
MAR 2004
Figure 4
MANKATO ENERGY CENTER
#
#
#
Industrial DrLi
me
Valle
y R
d
Hwy
5 (3
rd A
ve)
MankatoNorth
Mankato
AlternativeSite 1
AlternativeSite 2
AlternativeSite 3
Project Site
Hwy 14
Hw
y 16
9
1250 0 1250 2500 Feet
L:\1294\01\apr file\aprfile\sitemap.apr\Figure 4:DRG Site Map 12.17.03
Mankato East Quadrangle, 1993Mankato West Quadrangle, 1993
N

wboll
Site Boundary
wboll
wboll
Site Plan Figure 5

1800 Pioneer Creek CenterMaple Plain, MN 55359
Wenck Associates, Inc.Environmental Engineers
WenckMANKATO ENERGY CENTER
Water Usage Flow Diagram
MAR 2004
Figure 6
Mankato Energy CenterPlant Water Usage
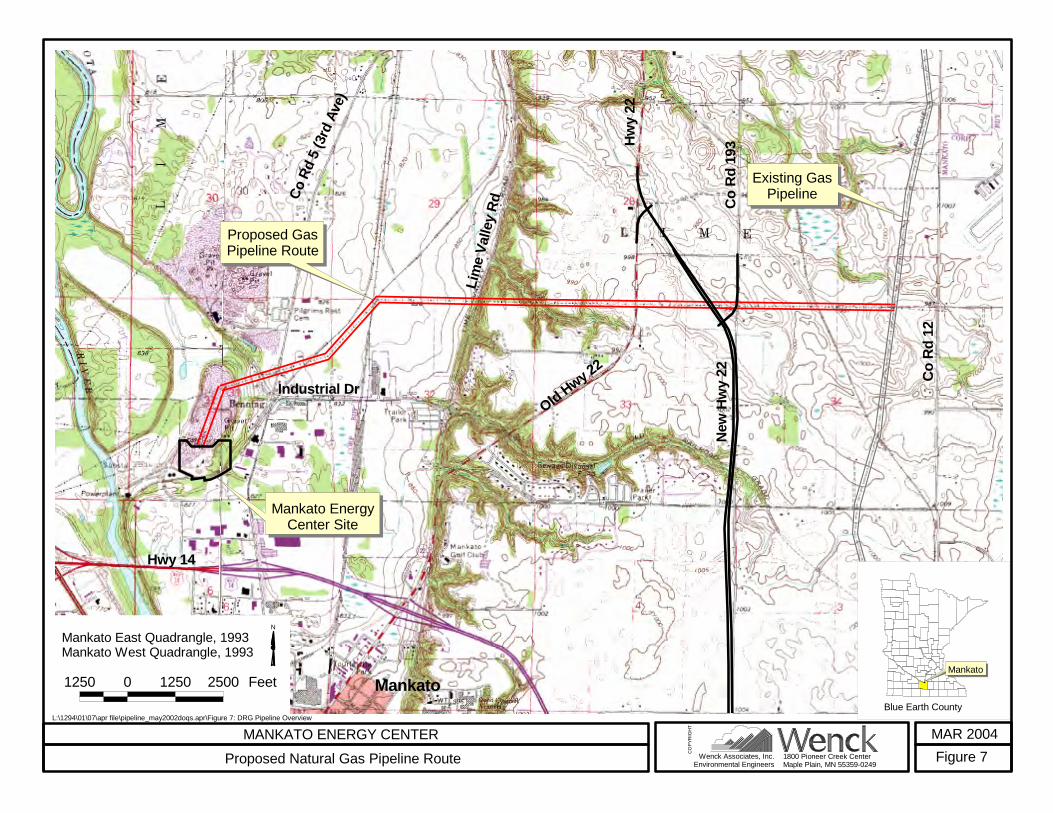
Figure 7MAR 2004
CO
PYR
IGH
T
Wenck Associates, Inc.Environmental Engineers
1800 Pioneer Creek CenterMaple Plain, MN 55359-0249
Industrial Dr
Lim
e V
alle
y R
dCo
Rd
5 (3
rd A
ve)
Hwy 14
Mankato
New
Hw
y 22
Old Hwy 22
Hw
y 22
Co
Rd
193
Co
Rd
12
Existing GasPipeline
Proposed GasPipeline Route
Mankato EnergyCenter Site
N
1250 0 1250 2500 Feet
L:\1294\01\07\apr file\pipeline_may2002doqs.apr\Figure 7: DRG Pipeline Overview
Mankato East Quadrangle, 1993Mankato West Quadrangle, 1993
MANKATO ENERGY CENTER
Proposed Natural Gas Pipeline Route
Blue Earth County
Mankato

Figure 8MAR 2004
CO
PYR
IGH
T
Wenck Associates, Inc.Environmental Engineers
1800 Pioneer Creek CenterMaple Plain, MN 55359-0249
Summit Ave
Switchyard
WilmarthSubstation
SubstationExpansion
Mankato EnergyCenter Site
Proposed 345 kV/115 kVTransmission Line Route
Min
neso
ta R
iver
N
200 0 200 400 Feet
MANKATO ENERGY CENTER
Orthophotoquad, May 2002
L:\1294\01\07\apr file\transmission.apr\Figure 8: Proposed Transmission Line Route Note: May 2002 1-m DOQs (source: Calpine)
Proposed Transmission Line Route

1800 Pioneer Creek CenterMaple Plain, MN 55359-0249
Wenck Associates, Inc.Environmental Engineers
CO
PYR
IGH
T
Views of Existing Site Conditions Figure 9
#S#S
#S
#S
#S<<
<
<
< Summit Ave3r
d A
ve
Project Site
300 0 300 600 Feet
L:\1294\01\apr file\Photo_figureView.apr\Figure 9: May 2002 DOQ Views of Existing Site Conditions Note:1-m DOQs (source: Calpine)
Orthophotoquad, May 2002N
MANKATO ENERGY CENTER MAR 2004
Xcel Energy WilmarthGenerating Plant

#
#
#
Summit Ave
3rd
Ave
C
Nearby Residential Receptor
2
Nearby Residential Receptor
1Project Site
A
B
C
1800 Pioneer Creek CenterMaple Plain, MN 55359-0249
Wenck Associates, Inc.Environmental Engineers
CO
PYR
IGH
T
Boundary Measurement Locations& Nearby Sensitive Noise Receptors Figure 10
300 0 300 600 Feet
L:\1294\01\apr file\noise fig1.apr\Figure 10: Boundary Measurement Locations & Nearby Sensitive Noise Receptors Note:1-m DOQs (source: Calpine)
Orthophotoquad, May 2002N
MANKATO ENERGY CENTER MAR 2004
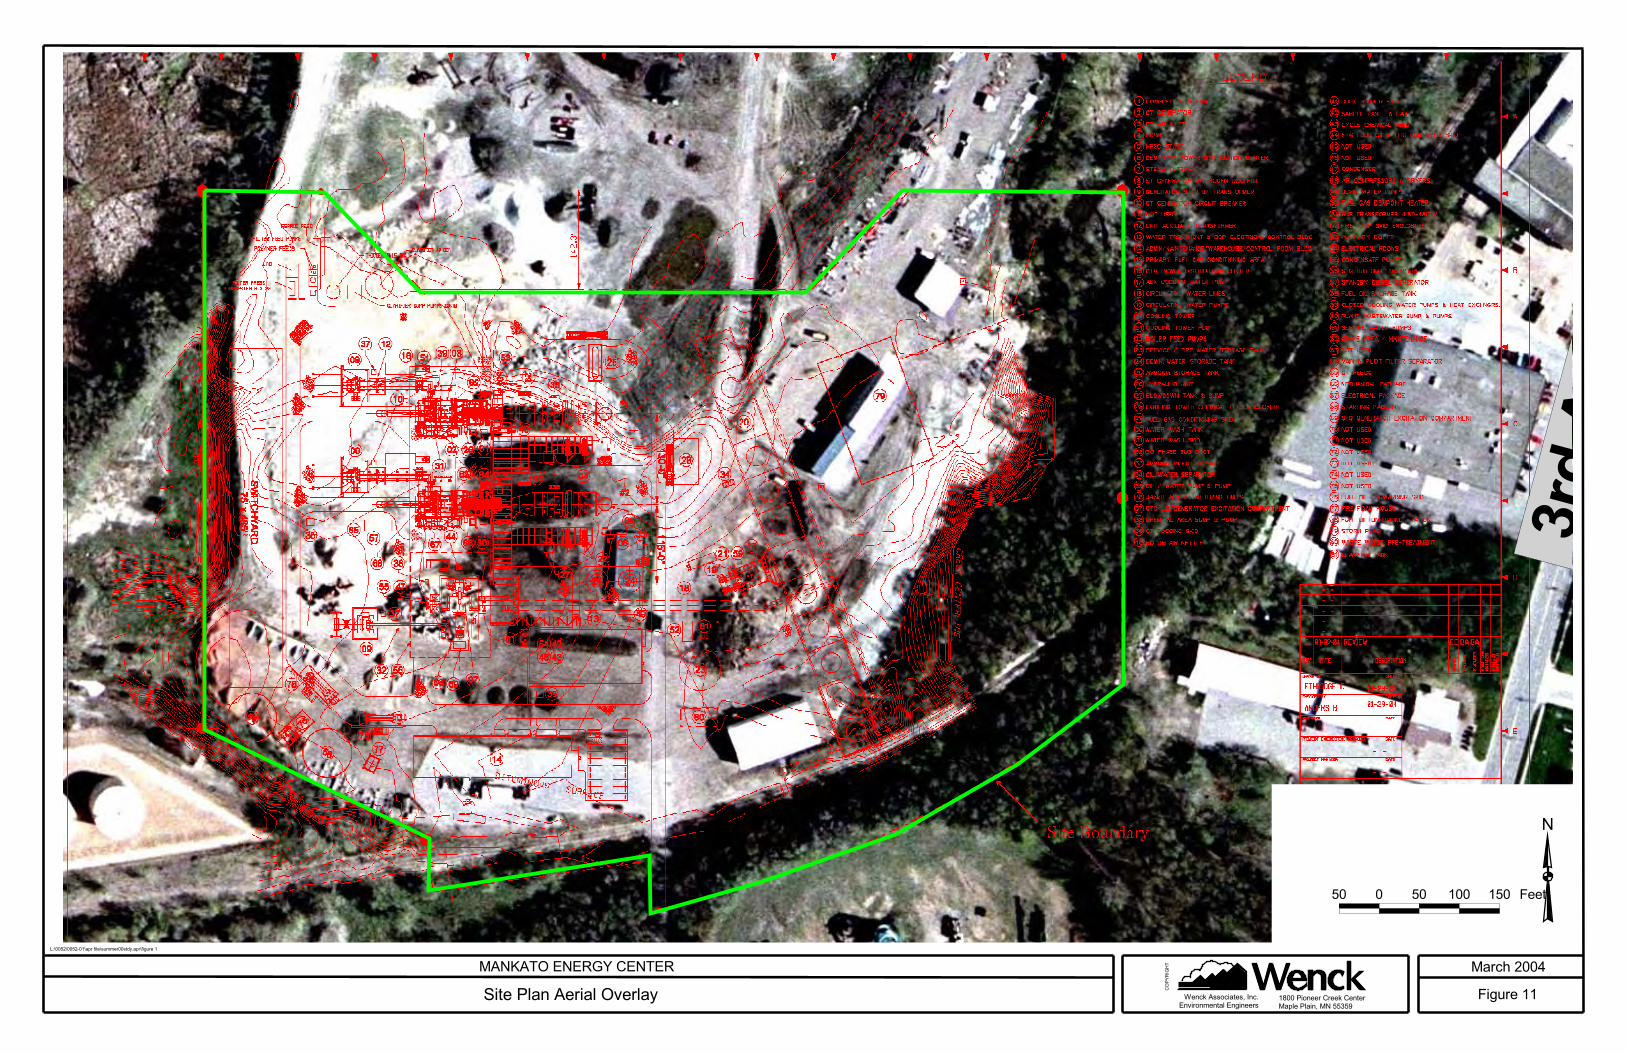
���������
�� ������������������������������������
������������� ����� �!��������� "�##$#%
&�������������������' �"(�����"�������"��� ���)�*��+
,��-����
./0��#*0��#*1��0�!��2��0�-�������3'��!�02��-���
�����
��
"
#� � #� ��� �#� ,�

1800 Pioneer Creek CenterMaple Plain, MN 55359-0249
Wenck Associates, Inc.Environmental Engineers
CO
PYR
IGH
T
100-year Floodplain Areas Figure 12
774
775
3rd
Ave
Summit Ave
Project Site
300 0 300 600 Feet
L:\1294\01\apr file\FINAL_Figures\Figure 12: FEMA 100yr Floodplain Note:1-m DOQs (source: Calpine)
Orthophotoquad, May 2002N
MANKATO ENERGY CENTER MAR 2004
100-year Flood Elevation100-year Floodplain
Legend
Based on FIS Rate Maps from Blue Earth County(Jul-21-99) and City of Mankato (Nov-20-00)
774

1800 Pioneer Creek CenterMaple Plain, MN 55359-0249
Wenck Associates, Inc.Environmental Engineers
CO
PYR
IGH
T
Wetland Areas Figure 13
Summit Ave
3rd
Ave
Summit Ave
Project Site
300 0 300 600 Feet
L:\1294\01\apr file\FINAL_Figures\Figure 13: NWI w 2002 DOQ Note:1-m DOQs (source: Calpine)
Orthophotoquad, May 2002N
MANKATO ENERGY CENTER MAR 2004
Based on 1990 National Wetland Inventory Maps
Legend
Wetland Areas

Appendix A
Alternative Site Permitting Process Schematic

Application Submitted(Chair has 10 days to accept or reject)
HVTL Route and Power Plant SiteAlternative* Permitting Process
Minn. Rule 4400.2000 to 4400.2900
0 ApplicationAccepted
ApplicationRejected
Advisory Task Force(Discretionary)
Public MeetingEAScopingProcess
EA
Public Hearing
State Register
Judicial Review
Board Decision
50
90
120
EA Scope
180
Days AfterAcceptance
210
Noticewithin 15 days after
submission of Application
*Utility Options for Alternative Review
· HVTLs between 100 and 200 kV
· HVTLs over 200 kV and less than 5 miles inlength or at least 80% located on existingHVTL right-of-way
· HVTL between 200 and 300 kV serving onecustomer and less than 10 miles in length
· HVTL rerouting for a single customer whereat least 80 % of the rerouted line will belocated on property owned or controlled bythe customer or to the owner of the line
· Large electric power generating plants witha capacity of less than 80 megawatts
· Large electric power generating plants thatare fueled with natural gas
Approved December 19, 2002
Appendix B
Baseline Environmental Noise Survey
and
Predicted Noise Levels During Facility Operations

TECHNICAL MEMORANDUM
To: Jason Goodwin, PE Calpine Corporation From: Tim Colliton, PE, CIH Wenck Associates, Inc. Re: Baseline Environmental Noise Survey and Predicted Noise Levels
During Facility Operation Calpine Mankato Energy Site Wenck Project No. 1294-01 Date: March 3, 2004
This technical memorandum presents the summary of the baseline environmental noise measurements at the Calpine Mankato Energy Site in Mankato, Minnesota. The noise measurements were made during daytime (7 am – 10 pm) and nighttime (10 pm – 7 am) hours on November 25 and 26, 2003. The purpose of the measurements was to assess the existing noise environment at the site boundary and at selected receptors in the area. Also included is an estimation of the plant operation noise. 1.0 BASELINE NOISE SURVEY
1.1 Summary of the Basic Noise Measurement Results The measurement results are summarized below by type of location and time of day, in military format. During all of the measurements, weather conditions were pleasant with cool temperatures and relative humidity ranging from 55 – 60 percent. The maximum and minimum sound levels, in dBA, are listed in the results tables for information only. The relevant regulatory limits are the L10 and L50 levels. Residential Receptors – Daytime
Results Location Lmax Lmin L10 L50 Site Conditions & Comments
1 77.8 45.6 54.8 51.8
1613 to 1715 November 25th – Clear sky with 3 mph winds from the SW and 34oF to 35oF – Audible traffic noise on 3rd Avenue; two heavy trucks pass by on 3rd Avenue; two light plane flyovers; geese flock flyovers at 1647 and 1658
2 61.7 42.7 49.5 46.61720 to 1821 November 25th – Clear sky with 2-3 mph winds from the SW and 33oF to 34oF – Two heavy trucks pass by on 3rd Avenue; geese flock flyovers at 1736 and 1758.
N/A N/A 60 65 Minnesota Daytime Noise Limits for NAC 1 receptors
Wenck Associates, Inc. 1800 Pioneer Creek Ctr. P.O. Box 249 Maple Plain, MN 55359-0249 (763) 479-4200 Fax (763) 479-4242 E-mail: [email protected]
T:\1294\01\Tech\02 Site Permit\Background Noise Survey\CALPINE - Noise Survey Report Memo.doc

Memorandum to: Jason Goodwin, PE Calpine Corporation March 3, 2004 Page 2
T:\1294\01\Tech\02 Site Permit\Background Noise Survey\CALPINE - Noise Survey Report Memo.doc Page 2 of 6
Site Boundary Locations – Daytime
Results Location Lmax Lmin L10 L50 Site Conditions & Comments
A 81.1 45.7 57.9 52.1
1239 to 1345 November 25th – Sunny with 5-6 mph wind gusts from the SW and 36oF – Audible traffic noise from U S highways 169 and 14; five small trucks and 2 heavy trucks pass by measurement location; two light plane flyovers.
B 86.2 46.7 67.8 54.9
1354 to 1455 November 25th – Sunny with 5-6 mph wind gusts from the SW and 35oF to 40oF – Two cars, fifteen small trucks, fifteen heavy trucks and four heavy equipment vehicles pass by measurement location; front end loader driven to salt shed at 1450.
C 86.9 45.6 56.9 52.31502 to 1603 November 25th – Sunny with 5-6 mph wind gusts from the SW and 35oF to 36oF – Two heavy trucks pass by in the vicinity of the measurement location.
N/A N/A 75 80 Minnesota Daytime Noise Limits for NAC 3 receptors The daytime readings are indicated at each location on the map in Figure 1. Residential Receptors – Nighttime
Results Location Lmax Lmin L10 L50 Site Conditions & Comments
1 82.2 38.1 47.9 43.30141 to 0243 November 26th – Clear sky with 5 mph winds from the SW and 23oF to 24oF – Audible traffic noise from three cars passing by on 3rd Avenue; one with defective muffler/loud music.
2 62.4 38.7 46.6 43.80253 to 0353 November 26th – Clear sky with 2-5 mph winds from the SW and 22oF – Intermittent noise from industrial operation east of 3rd Avenue.
N/A N/A 50 55 Minnesota Nighttime Noise Limits for NAC 1 receptors Site Boundary Locations – Nighttime
Results Location Lmax Lmin L10 L50 Site Conditions & Comments
A 61.9 43.6 52.1 48.92218 to 2319 November 25th – Clear sky with 5 mph wind from the SW and 24oF to 26oF – Audible traffic noise from U S highways 169 and 14; noise from nearby industries.
B 62.1 44.1 52.6 49.4 2325 to 0025 November 25th & 26th– Clear sky with 5 mph wind from the SW and 24oF – No nearby traffic noted.
C 62.7 41.5 52.1 48.1 0033 to 0133 November 26th – Clear sky 5 mph wind gusts from the SW and 22oF to 24oF.
N/A N/A 75 80 Minnesota Nighttime Noise Limits for NAC 3 receptors The nighttime readings are indicated at each location on the map in Figure 2.
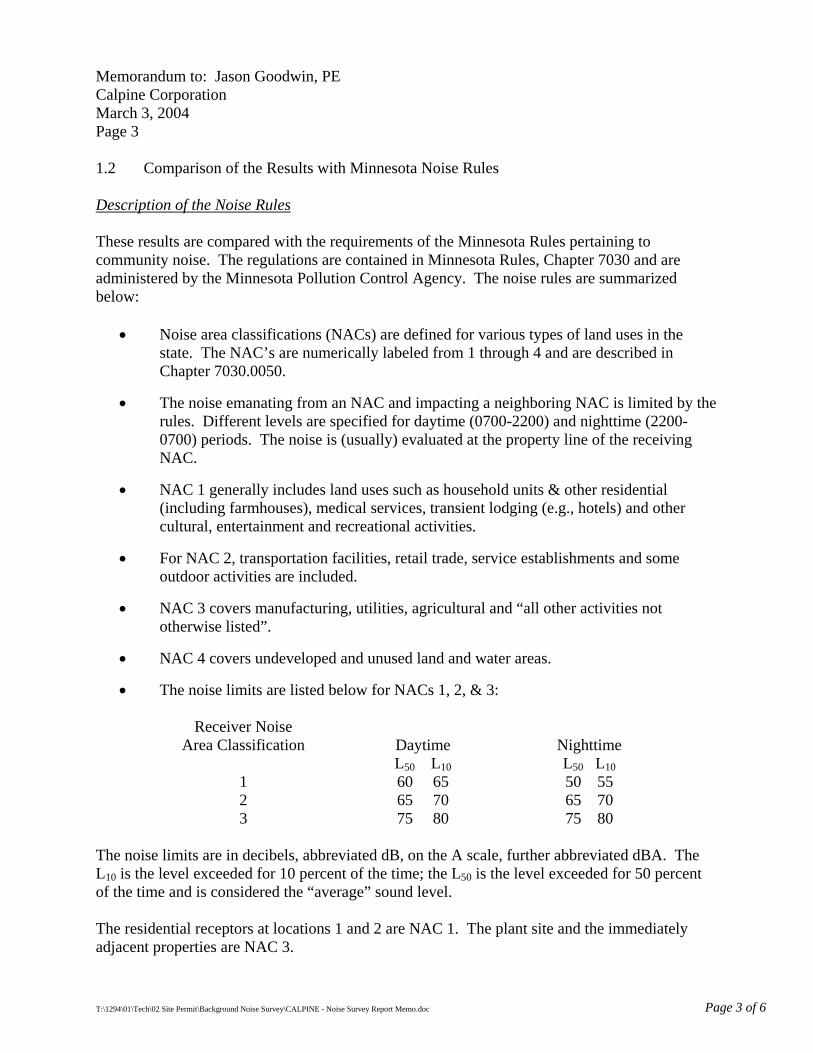
Memorandum to: Jason Goodwin, PE Calpine Corporation March 3, 2004 Page 3
T:\1294\01\Tech\02 Site Permit\Background Noise Survey\CALPINE - Noise Survey Report Memo.doc Page 3 of 6
1.2 Comparison of the Results with Minnesota Noise Rules Description of the Noise Rules These results are compared with the requirements of the Minnesota Rules pertaining to community noise. The regulations are contained in Minnesota Rules, Chapter 7030 and are administered by the Minnesota Pollution Control Agency. The noise rules are summarized below:
•
•
•
•
•
•
•
Noise area classifications (NACs) are defined for various types of land uses in the state. The NAC’s are numerically labeled from 1 through 4 and are described in Chapter 7030.0050.
The noise emanating from an NAC and impacting a neighboring NAC is limited by the rules. Different levels are specified for daytime (0700-2200) and nighttime (2200-0700) periods. The noise is (usually) evaluated at the property line of the receiving NAC.
NAC 1 generally includes land uses such as household units & other residential (including farmhouses), medical services, transient lodging (e.g., hotels) and other cultural, entertainment and recreational activities.
For NAC 2, transportation facilities, retail trade, service establishments and some outdoor activities are included.
NAC 3 covers manufacturing, utilities, agricultural and “all other activities not otherwise listed”.
NAC 4 covers undeveloped and unused land and water areas.
The noise limits are listed below for NACs 1, 2, & 3:
Receiver Noise Area Classification
Daytime
Nighttime
L50 L10 L50 L10 1 60 65 50 55 2 65 70 65 70 3 75 80 75 80
The noise limits are in decibels, abbreviated dB, on the A scale, further abbreviated dBA. The L10 is the level exceeded for 10 percent of the time; the L50 is the level exceeded for 50 percent of the time and is considered the “average” sound level. The residential receptors at locations 1 and 2 are NAC 1. The plant site and the immediately adjacent properties are NAC 3.

Memorandum to: Jason Goodwin, PE Calpine Corporation March 3, 2004 Page 4
T:\1294\01\Tech\02 Site Permit\Background Noise Survey\CALPINE - Noise Survey Report Memo.doc Page 4 of 6
Results Comparison – Daytime Measurements
At the residential receptors, the measured noise levels were below the daytime NAC 1 limits. The L10 readings were about 5 to 10 dBA below the limit; the L50 readings were 13 to 18 dBA below the limit. The major noise sources were traffic on nearby 3rd Avenue and flyovers of geese flocks.
At the boundary locations, the measured noise levels were below the daytime NAC 3 limits. The L10 readings were about 7 to 18 dBA below the limit; the L50 readings were 25 to 28 dBA below the limit. The most prominent noise source was truck and equipment traffic associated with the landfill operations. This was most notable at location B that was near the entrance driveway to the landfill. Traffic noise from nearby U S highways 169 and 14 was a contributing noise source at location A.
Results Comparison – Nighttime Measurements
At the residential receptors, the measured noise levels were below the nighttime NAC 1 limits. The L10 readings were about 2 to 3 dBA below the limit; the L50 readings were 11 to 12 dBA below the limit. The major noise sources were traffic on nearby 3rd Avenue and local industrial operations.
At the boundary locations, the measured noise levels were below the nighttime NAC 3 limits (which are the same as the daytime limits). The L10 readings were about 22 to 23 dBA below the limit; the L50 readings were 31 to 32 dBA below the limit. The landfill was closed during these measurements and the prominent noise sources were traffic on nearby U S highways 169 and 14 and nearby industrial operations.
1.3 Measurement Methodology
The noise measurements were made using an automated data logging sound level meter. This type of meter accumulates average noise level readings every second in its memory. The stored data is used to calculate the L10, L50 and other statistical data for the measurement period.
The measurement methodology followed that specified in Minnesota Rules 7030.0060. The meter was mounted on a tripod positioned at the measurement location. A windscreen provided by the meter manufacturer was placed over the microphone for all measurements. Each measurement period was at least one-hour duration.
The measurement locations are described in greater detail in the following table:
Location Description 1 Two hundred fifty feet northeast of residential dwelling and
fifteen feet east of driveway 2 One hundred thirty feet east of residential dwelling and twenty
five feet east of the centerline of 230 Lane A Fifty feet east of the western landfill haul road

Memorandum to: Jason Goodwin, PE Calpine Corporation March 3, 2004 Page 5
T:\1294\01\Tech\02 Site Permit\Background Noise Survey\CALPINE - Noise Survey Report Memo.doc Page 5 of 6
Location Description B At south entrance to SMC landfill 30 feet east of N-S driveway
and 25 feet north of the E-W railroad tracks C 180 feet southeast of the sorting shed
The sound level meter was a Larson Davis Model 820, serial number 1402. It was used with a Larson Davis Model PRM 828 microphone preamplifier (serial number 2121) and a Larson Davis ½ inch diameter microphone (serial number 2216). The meter was calibrated according to the manufacturer instructions using a Larson Davis Model CAL-200, serial number 2162, acoustic calibrator. The meter was calibrated at the beginning of the noise measurements, midway during the measurements and at the conclusion of the measurements. The meter calibration was stable throughout the measurements. 2.0 PREDICTED NOISE LEVELS DURING FACILITY OPERATION Noise generation data for various pieces of equipment and the results of the baseline noise survey (Appendix B-1) were used to estimate the noise levels at nearby receptors. Noise levels were calculated in accordance with methodologies specified in ISO 9613-2, Attenuation of Sound During Propogation Outdoors, 1996. The provisions for attenuation due to topography and vegetation were not exercised due to the height of the noise sources. 2.1 Sound Levels from Plant Noise Source Components Calpine provided the sound levels produced by the various pieces of plant equipment. The data has been “normalized” to a 50-foot distance so that relative source strengths are apparent. The listing of the equipment and their sound levels, from highest to lowest, is provided below:
Data Source
Equipment Description
Sound Level at 50 ft., dBA
Fox Energy Center Noise Impact Assessment, July, 2003
with Noise Suppression
Two Combustion Turbine Generators
71.9
Nooter/Eriksen Estimate 1/15/04
Two HRSGs 70.2
Marley Cooling Technology, 2/24/04
12 Cell Cooling Tower with 13 ft Wall
67
Fox Energy Center Noise Impact Assessment, July, 2003
with Noise Suppression
One Steam Turbine Transformer 64.7
Fox Energy Center Noise Impact Assessment, July, 2003
with Noise Suppression
Two Gas Turbine Transformers 61.9

Memorandum to: Jason Goodwin, PE Calpine Corporation March 3, 2004 Page 6
T:\1294\01\Tech\02 Site Permit\Background Noise Survey\CALPINE - Noise Survey Report Memo.doc Page 6 of 6
2.2 Estimation of Operational Noise The sound levels produced by the major equipment noise sources were used to calculate the noise impact of the plant. To calculate the noise impact, in dBA L50, the following information was used:
● The proposed plant equipment layout provided by Calpine on February 12, 2004.
● The HRSG’s discharge via a 200-foot high stack.
● The noise reduction with increasing distance from the source was calculated at the rate of 6 dBA per doubling of the distance.
● Excess noise reduction due to atmospheric effects was added for distances over 1000
feet from the sources.
● The noise impact of the plant is expressed in dBA L50. The distances from the noise sources to five noise level isopleths were calculated around the proposed plant site. The calculations included only the plant noise sources; the ambient sound levels were not added for this part of the evaluation. The results of these calculations are shown in Figure 3. At the two nearby residential receptors, the calculated noise impact from the plant was added to the measured baseline L50 sound levels. The results of these calculations are shown in Figure 4. At receptor 1, the estimated daytime L50 is 53.2 dBA and the estimated nighttime L50 is 49.1 dBA. At receptor 2, the estimated daytime L50 is 48.1 dBA and the estimated nighttime L50 is 46.4 dBA. The Minnesota daytime and nighttime noise standards will be met at both nearby residential receptors.

Figures

#
#
#
Summit Ave
3rd
Ave
CBoundary
Location A52.1 dBA L5057.9 dBA L10
BoundaryLocation B
54.9 dBA L5067.8 dBA L10
Site Boundary
Nearby ResidentialReceptor 1
51.8 dBA L5054.8 dBA L10
Nearby ResidentialReceptor 2
46.6 dBA L5049.5 dBA L10
BoundaryLocation C
52.3 dBA L5056.9 dBA L10
1800 Pioneer Creek CenterMaple Plain, MN 55359-0249
Wenck Associates, Inc.Environmental Engineers
CO
PYR
IGH
T
Daytime Baseline NoiseMeasurement Results Figure 1
300 0 300 600 Feet
L:\1294\01\apr file\noise fig1.apr\Figure 1: Daytime Noise Note:1-m DOQs (source: Calpine)
Orthophotoquad, May 2002N
MANKATO ENERGY CENTER MAR 2004

#
#
#
Summit Ave
3rd
Ave
CBoundary
Location A48.9 dBA L5052.1 dBA L10
BoundaryLocation B
49.4 dBA L5052.6 dBA L10
Site Boundary
Nearby ResidentialReceptor 1
43.3 dBA L5047.9 dBA L10
Nearby ResidentialReceptor 2
43.8 dBA L5046.6 dBA L10
BoundaryLocation C
48.1 dBA L5052.1 dBA L10
1800 Pioneer Creek CenterMaple Plain, MN 55359-0249
Wenck Associates, Inc.Environmental Engineers
CO
PYR
IGH
T
Nighttime Baseline NoiseMeasurement Results Figure 2
300 0 300 600 Feet
L:\1294\01\apr file\noise fig1.apr\Figure 2: Nighttime Noise Note:1-m DOQs (source: Calpine)
Orthophotoquad, May 2002N
MANKATO ENERGY CENTER MAR 2004

Summit Ave
3rd
Ave
Ð
Nearby ResidentialReceptor 2
Nearby ResidentialReceptor 1
45 dBA L50
50 dBA L50
55 dBA L50
60 dBA L150
65 dBA L50
Site Boundary
1800 Pioneer Creek CenterMaple Plain, MN 55359-0249
Wenck Associates, Inc.Environmental Engineers
CO
PYR
IGH
T
Calculated Plant Operational Noise Isopleths Figure 3
300 0 300 600 Feet
L:\1294\01\apr file\noise fig1.apr\Figure 3: Noise Iso Pleths Note:1-m DOQs (source: Calpine)
Orthophotoquad, May 2002N
MANKATO ENERGY CENTER MAR 2004
Ð Approximate Center ofMajor Plant EquipmentNoise Isopleths

3rd
Ave
C
Site Boundary
Summit Ave
Nearby ResidentialReceptor 2
48.1 dBA L50 - Daytime46.4 dBA L10 - Nighttime
Nearby ResidentialReceptor 1
53.2 dBA L50 - Daytime49.1 dBA L10 - Nighttime
1800 Pioneer Creek CenterMaple Plain, MN 55359-0249
Wenck Associates, Inc.Environmental Engineers
CO
PYR
IGH
T
Calculated Operational Noise at Nearby Residential Receptors Figure 4
300 0 300 600 Feet
L:\1294\01\apr file\noise fig1.apr\Figure 2: Nighttime Noise Note:1-m DOQs (source: Calpine)
Orthophotoquad, May 2002N
MANKATO ENERGY CENTER MAR 2004

Appendix C
SHPO Response Letter


Appendix D
DNR Response Letter