By SHABNAM MOSTARY - University of...
141
1 TRACE METALS LEACHABILITY CHARACTERIZATION OF PHOSPHOGYPSUM By SHABNAM MOSTARY A THESIS PRESENTED TO THE GRADUATE SCHOOL OF THE UNIVERSITY OF FLORIDA IN PARTIAL FULFILLMENT OF THE REQUIREMENTS FOR THE DEGREE OF MASTER OF ENGINEERING UNIVERSITY OF FLORIDA 2011
-
Upload
nguyentram -
Category
Documents
-
view
217 -
download
1
Transcript of By SHABNAM MOSTARY - University of...
1
TRACE METALS LEACHABILITY CHARACTERIZATION OF PHOSPHOGYPSUM
By
SHABNAM MOSTARY
A THESIS PRESENTED TO THE GRADUATE SCHOOL OF THE UNIVERSITY OF FLORIDA IN PARTIAL FULFILLMENT
OF THE REQUIREMENTS FOR THE DEGREE OF MASTER OF ENGINEERING
UNIVERSITY OF FLORIDA
2011

2
© 2011 Shabnam Mostary

3
To my Parents for all their love and support
4
ACKNOWLEDGMENTS
I would like to thank my committee chairman, Dr. Timothy G. Townsend for his
patience and encouragement throughout my graduate program. I also wish to thank the
remaining members of my committee, Dr. Paul A. Chadik and Dr. Ben Koopman for
their insight and review of this thesis.
I would also like to thank my fellow graduate students in Solid and Hazardous
Waste, for their assistance and support with this study.
Final thanks are extended to Mosaic Fertilizer, LLC, for supporting this research.
Special thanks go to Elizabeth Foeller (Research & Development Manager) and
Charlotte Brittain (Engineering Superintendent Environmental Solutions). Also I want to
thank the Solid Waste Management Division in Polk County, Florida for their help.
5
TABLE OF CONTENTS page
ACKNOWLEDGMENTS .................................................................................................. 4
LIST OF TABLES ............................................................................................................ 7
LIST OF FIGURES ........................................................................................................ 10
LIST OF ABBREVIATIONS ........................................................................................... 13
ABSTRACT ................................................................................................................... 15
CHAPTER
1 INTRODUCTION .................................................................................................... 17
1.1 Phosphogypsum and Its Management .............................................................. 17
1.2 Objectives ......................................................................................................... 19
2 LITERATURE REVIEW .......................................................................................... 20
2.1 Phosphoric Acid Production .............................................................................. 20
2.2 Potential Uses of Phosphogypsum ................................................................... 22
2.3 Leaching Tests in Solid Waste Management .................................................... 23
2.3.1 Toxicity Characteristic Leaching Procedure (TCLP) ................................ 24
2.3.2 Synthetic Precipitation Leaching Procedure (SPLP)................................ 25
2.3.3 The US EPA Multiple Extraction Procedure (MEP) ................................. 25
2.4 Leaching Tests for Assessing the Potential for Groundwater Contamination ... 26
2.5 Characteristics of Phosphogypsum................................................................... 27
2.6 Phosphogypsum Leaching Studies ................................................................... 28
3 METHODS AND MATERIALS ................................................................................ 33
3.1 Overview ........................................................................................................... 33
3.2 Sample Collection and Processing ................................................................... 33
3.3 Leaching Procedures ........................................................................................ 34
3.3.1 Toxicity Characteristic Leaching Procedure ............................................ 34
3.3.2 Synthetic Precipitation Leaching Procedure ............................................ 35
3.3.3 Extraction Procedure (EP) Toxicity Test Method ..................................... 35
3.3.4 Multiple Extraction Procedure .................................................................. 36
3.3.5 Batch Leaching Test with MSW Leachate ............................................... 36
3.3.5.1 Sulfate analysis .............................................................................. 37
3.3.5.2 Total dissolved solids (TDS) .......................................................... 37
3.3.6 Batch Leaching Test with DI Water ......................................................... 38
3.4 Total Metal Analysis .......................................................................................... 38
3.5 pH of Phosphogypsum ...................................................................................... 39

6
3.6 Quality Assurance and Quality Control ............................................................. 39
4 RESULTS ............................................................................................................... 40
4.1 Total Metal Analysis Results ............................................................................. 40
4.2 pH of Phosphogypsum ...................................................................................... 41
4.3 Toxicity Characteristic Leaching Procedure (TCLP) ......................................... 41
4.4 Synthetic Precipitation Leaching Procedure (SPLP) ......................................... 42
4.5 Extraction Procedure Toxicity ........................................................................... 42
4.6 USEPA Multiple Extraction Procedure .............................................................. 43
4.7 Additional Leaching Testing .............................................................................. 43
4.7.1 The Deionized Water Batch Leaching Test ............................................. 43
4.7.2 Batch Leaching Test with MSW Leachate ............................................... 44
5 DISCUSSION ......................................................................................................... 88
5.1 Comparison to Previous Studies ....................................................................... 88
5.2 Discussion of Leaching Results ........................................................................ 89
5.3 Assessing Potential for Beneficial Reuse .......................................................... 91
5.4 Limitations and Recommendations ................................................................... 94
6 CONCLUSION ........................................................................................................ 99
APPENDIX
A ICP-AES DETECTION LIMITS ............................................................................. 101
B TOTAL METAL ANALYSIS DATA ........................................................................ 102
C TOXICITY CHARACTERISTIC LEACHING PROCEDURE DATA ....................... 106
D SYNTHETIC PRECIPITATION LEACHING PROCEDURE (SPLP) DATA ........... 110
E EXTRACTION PROCEDURE TOXICITY TEST DATA ......................................... 114
F MUTIPLE EXTRACTION PROCEDURE TEST DATA .......................................... 115
G BATCH LEACHING TEST WITH DI WATER ........................................................ 124
H MSW LEACHATE BATCH LEACHING TEST DATA ............................................ 128
I QUALITY ASSURANCE/QUALITY CONTROL .................................................... 132
LIST OF REFERENCES ............................................................................................. 137
BIOGRAPHICAL SKETCH .......................................................................................... 141

7
LIST OF TABLES
Table page 2-1 Active phosphate rock mines in the United States in 2007 (USGS 2007) ........... 31
2-2 RCRA toxicity characteristics limits (metals only) ............................................... 31
2-3 US EPA drinking water standards ...................................................................... 31
2-4 Content of some trace elements in Phosphogypsum (PG) produced from different rock phosphate sources ........................................................................ 32
4-1 Metal concentrations (mg/kg) of PG samples ..................................................... 45
4-2 pH of PG samples .............................................................................................. 45
4-3 Total metal comparison with risk based standards for direct exposure .............. 46
4-4 pH results (Extraction Procedure Toxicity Test) .................................................. 46
4-5 pH results (Multiple Extraction Procedure Test) ................................................. 46
4-6 pH results (Batch leaching test with DI water) .................................................... 47
4-7 pH results (Batch leaching test with MSW leachate) .......................................... 47
5-1 TCLP results found in the previous studies ........................................................ 95
5-2 Comparisons of DI water leaching test ............................................................... 95
5-3 Comparison of SPLP with previous leaching studies .......................................... 95
5-4 Comparison of trace metal concentrations (mg/kg) ............................................ 96
A-1 Method Detection Limits ................................................................................... 101
B-1 Total metal analysis results of PG samples collected from north wall (mg/Kg) . 102
B-2 Total metal analysis results of PG samples collected from south wall (mg/Kg) 103
B-3 Total metal analysis results of PG samples collected from east wall (mg/Kg) .. 104
B-4 Total metal analysis results of PG samples collected from west wall (mg/Kg).. 105
C-1 TCLP test results of the samples collected from north wall (mg/L) ................... 106
C-2 TCLP test results of the samples collected from south wall (mg/L) .................. 107

8
C-3 TCLP test results of the samples collected from east wall (mg/L) .................... 108
C-4 TCLP test results of the samples collected from west wall (mg/L) .................... 109
D-1 SPLP test results of the samples collected from north wall (mg/L) ................... 110
D-2 SPLP test results of the samples collected from south wall (mg/L) .................. 111
D-3 SPLP test results of the samples collected from east wall (mg/L) .................... 112
D-4 SPLP test results of the samples collected from west wall (mg/L) .................... 113
E-1 EPTOX test results of the samples collected from south wall (mg/L) ............... 114
F-1 MEP test results of the samples collected from south wall (extraction 1) (mg/L) ............................................................................................................... 115
F-2 MEP test results of the samples collected from south wall (extraction 2) (mg/L) ............................................................................................................... 116
F-3 MEP test results of the samples collected from south wall (extraction 3) (mg/L) ............................................................................................................... 117
F-4 MEP test results of the samples collected from south wall (extraction 4) (mg/L) ............................................................................................................... 118
F-5 MEP test results of the samples collected from south wall (extraction 5) (mg/L) ............................................................................................................... 119
F-6 MEP test results of the samples collected from south wall (extraction 6) (mg/L) ............................................................................................................... 120
F-7 MEP test results of the samples collected from south wall (extraction 7) (mg/L) ............................................................................................................... 121
F-8 MEP test results of the samples collected from south wall (extraction 8) (mg/L) ............................................................................................................... 122
F-9 MEP test results of the samples collected from south wall (extraction 9) (mg/L) ............................................................................................................... 123
G-1 Metal analysis data after batch test of PG with DI water of NW PG samples (mg/L) ............................................................................................................... 124
G-2 Metal analysis data after batch test of PG with DI water of SW PG samples (mg/L) ............................................................................................................... 125
G-3 Metal analysis data after batch test of PG with DI water of EW PG samples (mg/L) ............................................................................................................... 126
9
G-4 Metal analysis data after batch test of PG with DI water of WW PG samples (mg/L) ............................................................................................................... 127
H-1 Batch leaching test with MSW leachate for PG samples collected from north wall (mg/L) ........................................................................................................ 128
H-2 Batch leaching test with MSW leachate for PG samples collected from south wall (mg/L) ........................................................................................................ 129
H-3 Batch leaching test with MSW leachate for PG samples collected from east wall (mg/L) ........................................................................................................ 130
H-4 Batch leaching test with MSW leachate for PG samples collected from west wall (mg/L) ........................................................................................................ 131
I-1 QA/QC for TCLP ............................................................................................... 132
I-2 QA/QC for SPLP ............................................................................................... 133
I-3 QA/QC for DI water batch leaching test ............................................................ 134
I-4 QA/QC for MSW batch leaching test ................................................................ 135
I-5 QA/QC for EPTOX ............................................................................................ 136

10
LIST OF FIGURES
Figure page 4-1 Silver (Ag) and Arsenic (As) concentrations of PG samples in TCLP test .......... 48
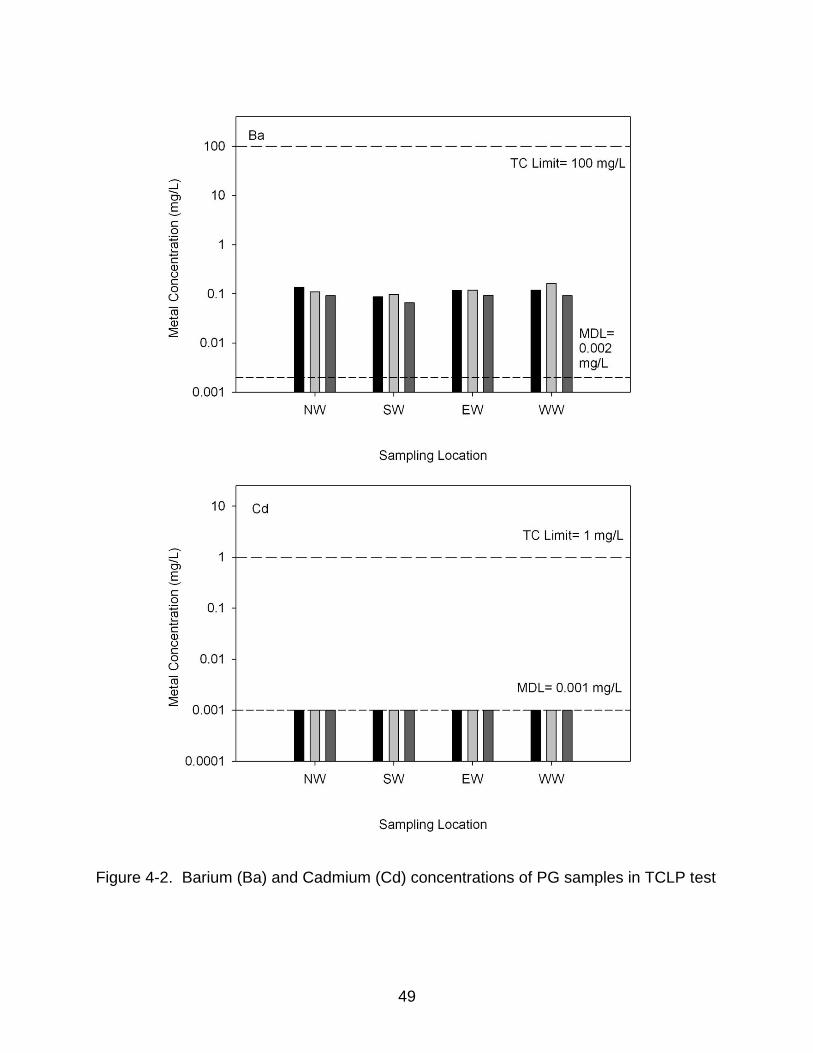
4-2 Barium (Ba) and Cadmium (Cd) concentrations of PG samples in TCLP test .... 49
4-3 Chromium (Cr) and Lead (Pb) concentrations of PG samples in TCLP test ....... 50
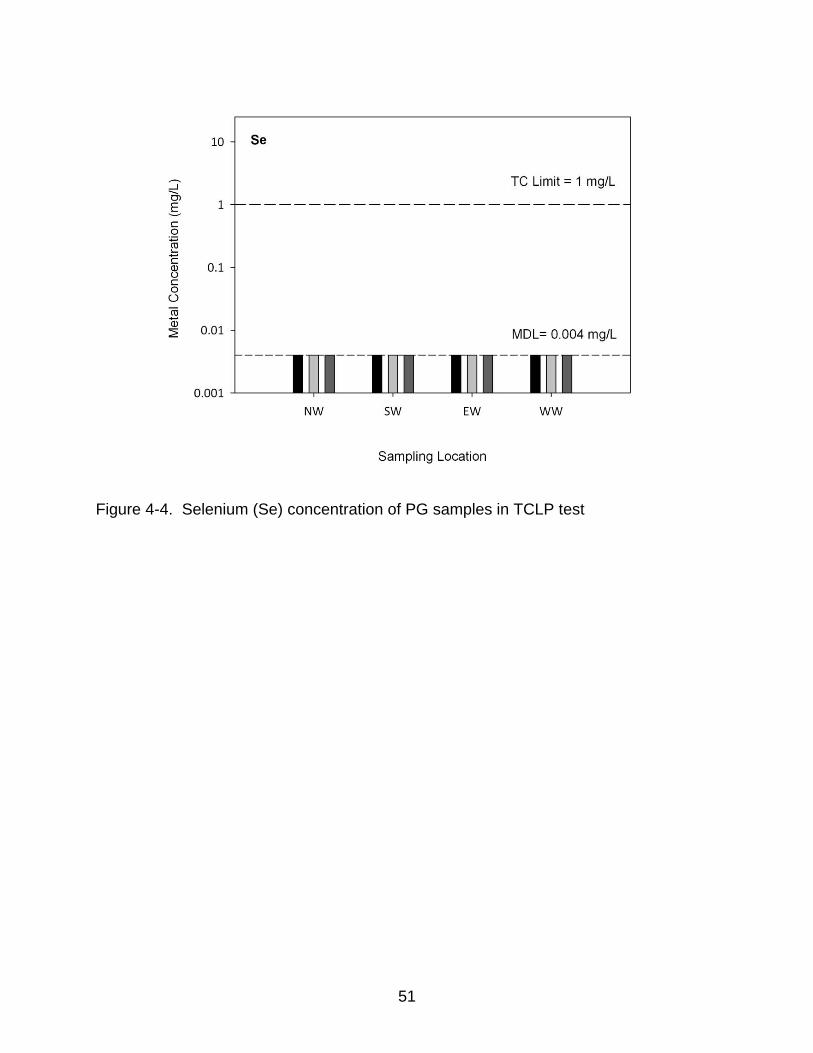
4-4 Selenium (Se) concentration of PG samples in TCLP test ................................. 51
4-5 Silver (Ag) and Aluminum (Al) concentrations of PG samples in SPLP test ....... 52
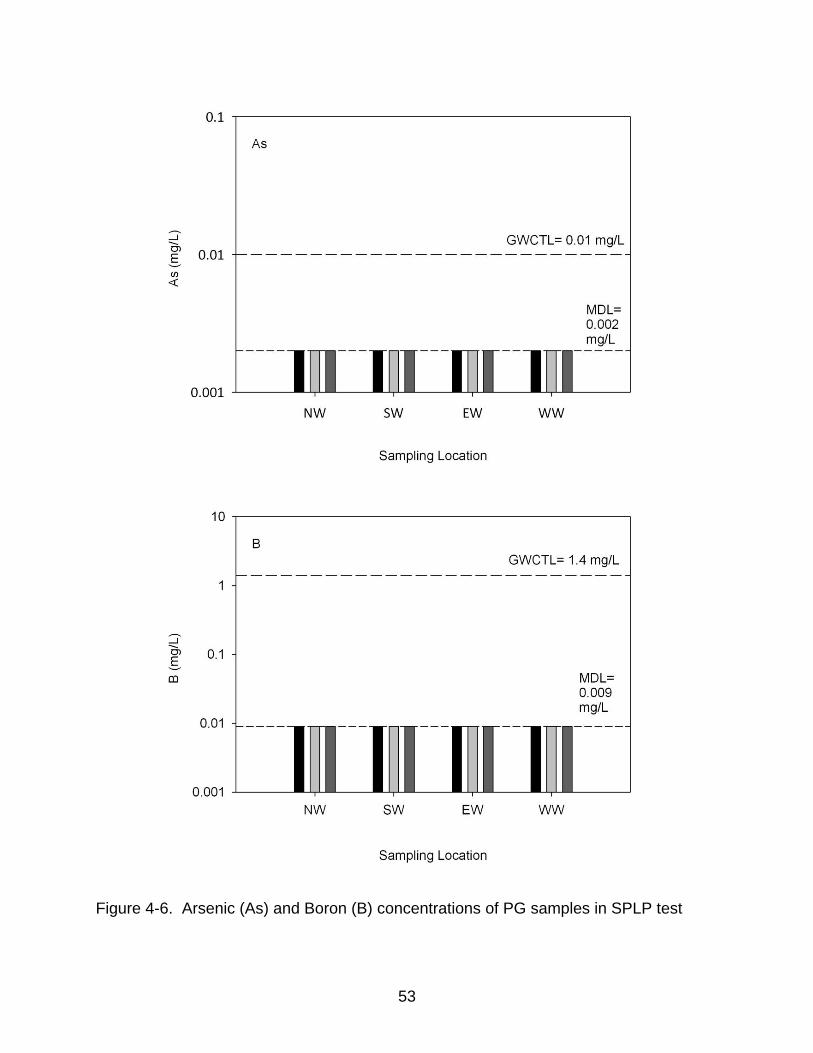
4-6 Arsenic (As) and Boron (B) concentrations of PG samples in SPLP test ........... 53
4-7 Beryllium (Be) and Cadmium (Cd) concentrations of PG samples in SPLP test ...................................................................................................................... 54
4-8 Chromium (Cr) and Copper (Cu) concentrations of PG samples in SPLP test ... 55
4-9 Iron (Fe) and Potassium (K) concentrations of PG samples in SPLP test .......... 56
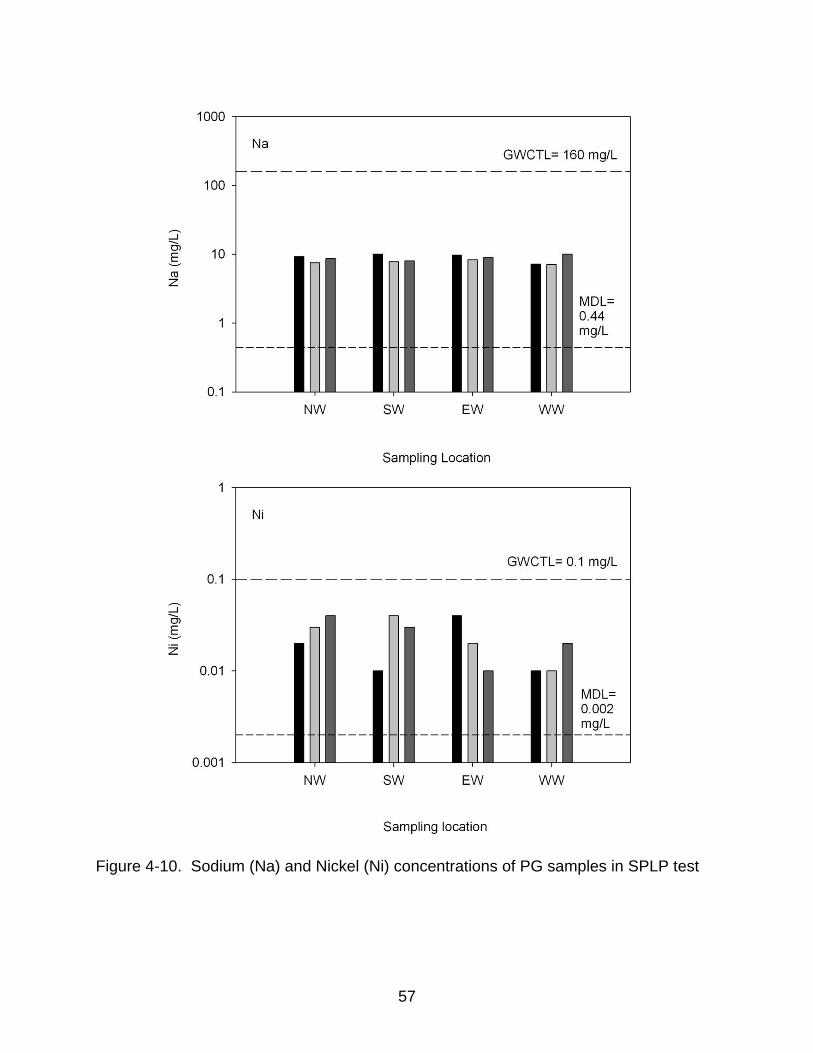
4-10 Sodium (Na) and Nickel (Ni) concentrations of PG samples in SPLP test .......... 57
4-11 Lead (Pb) and Antimony (Sb) concentrations of PG samples in SPLP test ........ 58
4-12 Tin (Sn) and Strontium (Sr) concentrations of PG samples in SPLP test ........... 59
4-13 Vanadium (V) and Zinc (Zn) concentrations of PG samples in SPLP test .......... 60
4-14 Toxicity Characteristic Leaching Procedure initial and final pH .......................... 61
4-15 Synthetic Precipitation Leaching Procedure initial and final pH .......................... 61
4-16 Aluminum (Al) and Barium (Ba) concentrations of PG samples (south wall) in EPTOX test......................................................................................................... 62
4-17 Calcium (Ca) and Chromium (Cr) concentrations of PG samples (south wall) in EPTOX test ..................................................................................................... 63
4-18 Copper (Cu) and Potassium (K) concentrations of PG samples (south wall) in EPTOX test......................................................................................................... 64
4-19 Magnesium (Mg) and Nickel (Ni) concentrations of PG samples (south wall) in EPTOX test ..................................................................................................... 65
4-20 Strontium (Sr) and Zinc (Zn) concentrations of PG samples (south wall) in EPTOX test......................................................................................................... 66

11
4-21 Aluminum (Al) and Barium (Ba) leachability in US EPA’s MEP .......................... 67
4-22 Beryllium (Be) and Calcium (Ca) leachability in US EPA’s MEP ........................ 68
4-23 Chromium (Cr) and Copper (Cu) leachability in US EPA’s MEP ........................ 69
4-24 Potassium (K) and Magnesium (Mg) leachability in US EPA’s MEP .................. 70
4-25 Nickel (Ni) and Strontium (Sr) leachability in US EPA’s MEP ............................. 71
4-26 Zinc (Zn) leachability in US EPA’s MEP ............................................................. 72
4-27 Aluminum (Al) and Barium (Ba) concentrations in DI water batch leaching test ...................................................................................................................... 73
4-28 Calcium (Ca) and Copper (Cu) concentrations in DI water batch leaching test .. 74
4-29 Potassium (K) and Sodium (Na) concentrations in DI water batch leaching test ...................................................................................................................... 75
4-30 Nickel (Ni) and Strontium (Sr) concentrations in DI water batch leaching test .... 76
4-31 Zinc (Zn) concentration in DI water batch leaching test ...................................... 77
4-32 Aluminum (Al) and Arsenic (As) concentrations in MSW leachate batch leaching test ....................................................................................................... 78
4-33 Boron (B) and Barium (Ba) concentrations in MSW leachate batch leaching test ...................................................................................................................... 79
4-34 Calcium (Ca) and Cobalt (Co) concentrations in MSW leachate batch leaching test ....................................................................................................... 80
4-35 Chromium (Cr) and Copper (Cu) concentrations in MSW leachate batch leaching test ....................................................................................................... 81
4-36 Iron (Fe) and Potassium (K) concentrations in MSW leachate batch leaching test ...................................................................................................................... 82
4-37 Magnesium (Mg) and Manganese (Mn) concentrations in MSW leachate batch leaching test .............................................................................................. 83
4-38 Sodium (Na) and Nickel (Ni) concentrations in MSW leachate batch leaching test ...................................................................................................................... 84
4-39 Antimony (Sb) and Strontium (Sr) concentrations in MSW leachate batch leaching test ....................................................................................................... 85

12
4-40 Vanadium (V) and Zinc (Zn) concentrations in MSW leachate batch leaching test ...................................................................................................................... 86
4-41 Sulfate concentration results of batch test with MSW leachate .......................... 87
4-42 TDS results of batch test with MSW leachate ..................................................... 87
5-1 Aluminum (Al) concentrations in different batch leaching tests .......................... 97
5-2 Barium (Ba) concentrations in different batch leaching tests .............................. 97
5-3 Chromium (Cr) concentrations in different batch leaching tests ......................... 98
5-4 Calcium (Ca) concentrations in different batch leaching tests ............................ 98
13
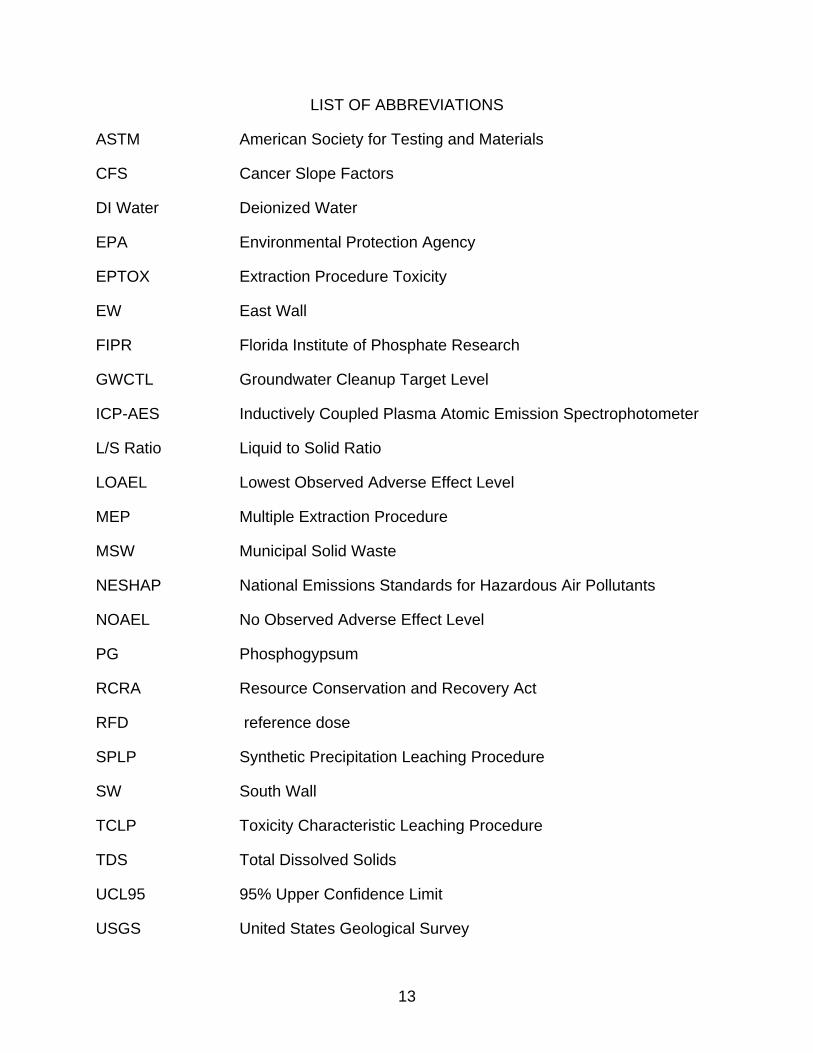
LIST OF ABBREVIATIONS
ASTM American Society for Testing and Materials
CFS Cancer Slope Factors
DI Water Deionized Water
EPA Environmental Protection Agency
EPTOX Extraction Procedure Toxicity
EW East Wall
FIPR Florida Institute of Phosphate Research
GWCTL Groundwater Cleanup Target Level
ICP-AES Inductively Coupled Plasma Atomic Emission Spectrophotometer
L/S Ratio Liquid to Solid Ratio
LOAEL Lowest Observed Adverse Effect Level
MEP Multiple Extraction Procedure
MSW Municipal Solid Waste
NESHAP National Emissions Standards for Hazardous Air Pollutants
NOAEL No Observed Adverse Effect Level
PG Phosphogypsum
RCRA Resource Conservation and Recovery Act
RFD reference dose
SPLP Synthetic Precipitation Leaching Procedure
SW South Wall
TCLP Toxicity Characteristic Leaching Procedure
TDS Total Dissolved Solids
UCL95 95% Upper Confidence Limit
USGS United States Geological Survey

14
WW West Wall
15
Abstract of Thesis Presented to the Graduate School of the University of Florida in Partial Fulfillment of the
Requirements for the Degree of Master of Engineering
TRACE METALS LEACHABILITY CHARACTERIZATION OF PHOSPHOGYPSUM
By
Shabnam Mostary
May 2011
Chair: Timothy G. Townsend Major: Environmental Engineering Sciences
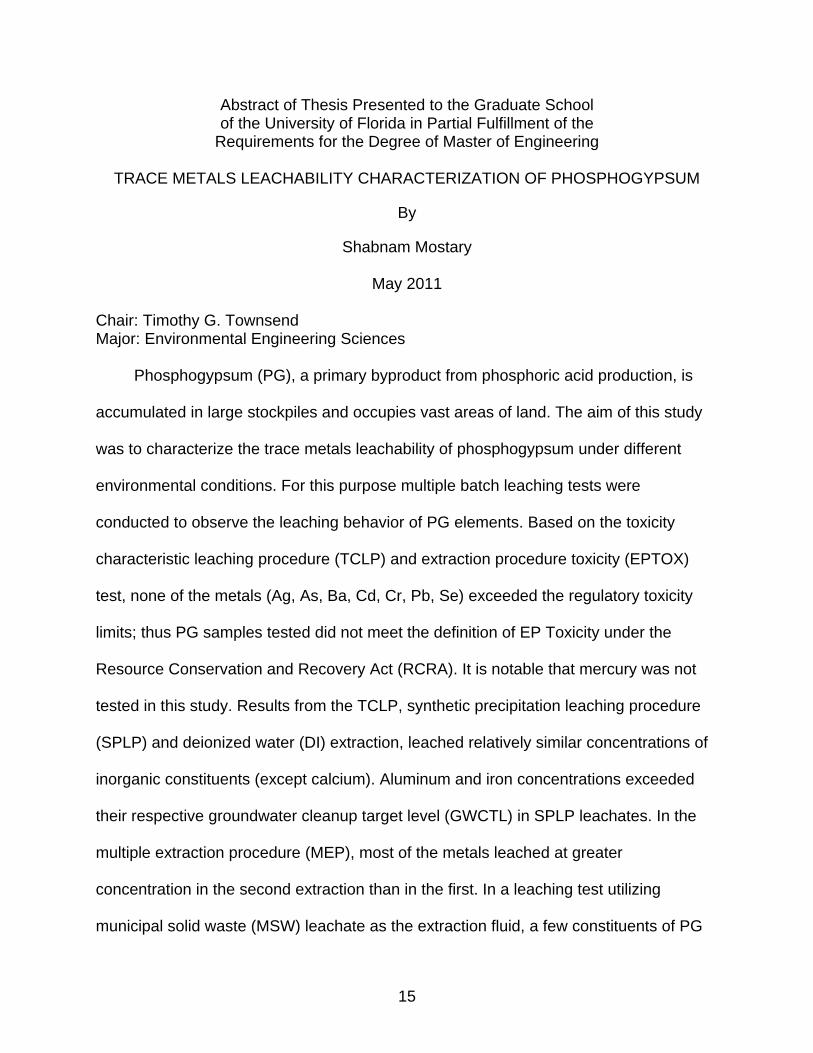
Phosphogypsum (PG), a primary byproduct from phosphoric acid production, is
accumulated in large stockpiles and occupies vast areas of land. The aim of this study
was to characterize the trace metals leachability of phosphogypsum under different
environmental conditions. For this purpose multiple batch leaching tests were
conducted to observe the leaching behavior of PG elements. Based on the toxicity
characteristic leaching procedure (TCLP) and extraction procedure toxicity (EPTOX)
test, none of the metals (Ag, As, Ba, Cd, Cr, Pb, Se) exceeded the regulatory toxicity
limits; thus PG samples tested did not meet the definition of EP Toxicity under the
Resource Conservation and Recovery Act (RCRA). It is notable that mercury was not
tested in this study. Results from the TCLP, synthetic precipitation leaching procedure
(SPLP) and deionized water (DI) extraction, leached relatively similar concentrations of
inorganic constituents (except calcium). Aluminum and iron concentrations exceeded
their respective groundwater cleanup target level (GWCTL) in SPLP leachates. In the
multiple extraction procedure (MEP), most of the metals leached at greater
concentration in the second extraction than in the first. In a leaching test utilizing
municipal solid waste (MSW) leachate as the extraction fluid, a few constituents of PG

16
such as calcium and sulfate considerably leached out. Calcium leached more in the
MSW leaching test than TCLP and SPLP. Aside from calcium and strontium there was
no significant leaching of other metals in the MSW leaching test. Though concentration
of arsenic (UCL95) was above GWCTL in total metal analysis, it was not detected in any
of the leaching test.
17
CHAPTER 1 INTRODUCTION
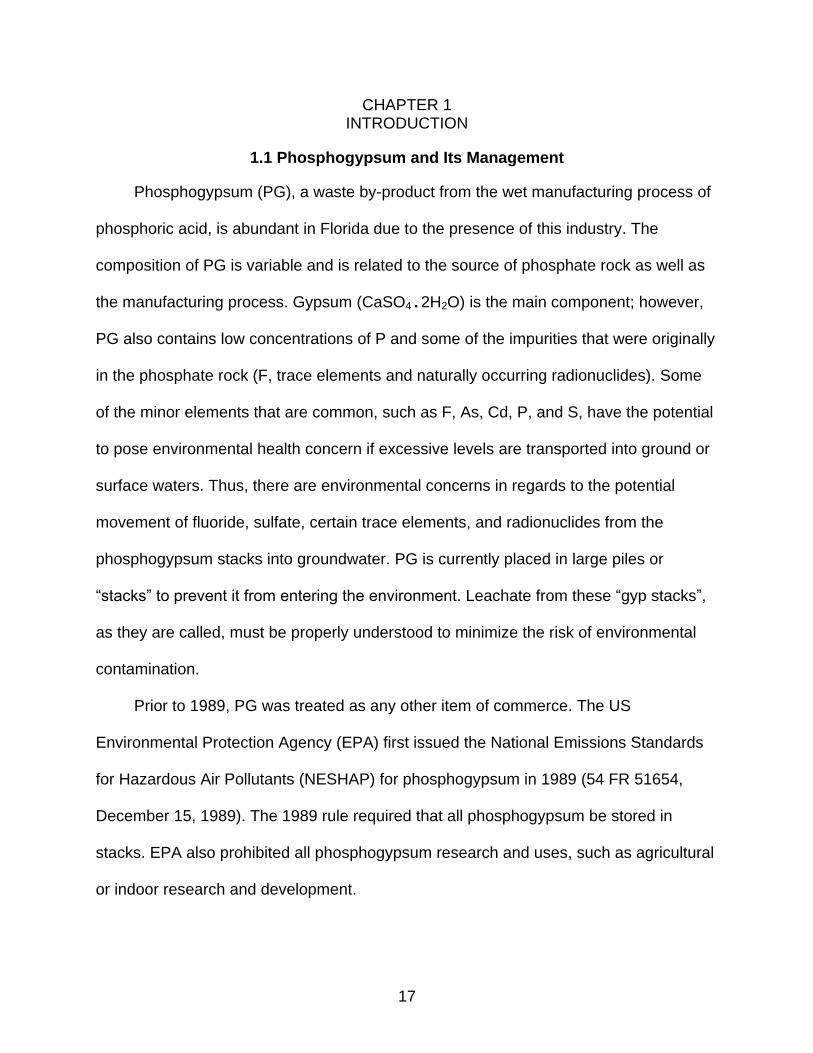
1.1 Phosphogypsum and Its Management
Phosphogypsum (PG), a waste by-product from the wet manufacturing process of
phosphoric acid, is abundant in Florida due to the presence of this industry. The
composition of PG is variable and is related to the source of phosphate rock as well as
the manufacturing process. Gypsum (CaSO4.2H2O) is the main component; however,
PG also contains low concentrations of P and some of the impurities that were originally
in the phosphate rock (F, trace elements and naturally occurring radionuclides). Some
of the minor elements that are common, such as F, As, Cd, P, and S, have the potential
to pose environmental health concern if excessive levels are transported into ground or
surface waters. Thus, there are environmental concerns in regards to the potential
movement of fluoride, sulfate, certain trace elements, and radionuclides from the
phosphogypsum stacks into groundwater. PG is currently placed in large piles or
“stacks” to prevent it from entering the environment. Leachate from these “gyp stacks”,
as they are called, must be properly understood to minimize the risk of environmental
contamination.
Prior to 1989, PG was treated as any other item of commerce. The US
Environmental Protection Agency (EPA) first issued the National Emissions Standards
for Hazardous Air Pollutants (NESHAP) for phosphogypsum in 1989 (54 FR 51654,
December 15, 1989). The 1989 rule required that all phosphogypsum be stored in
stacks. EPA also prohibited all phosphogypsum research and uses, such as agricultural
or indoor research and development.
18
In response to several petitions, EPA conducted risk assessments and revised the
standard to permit alternate uses of PG in 1992 (40 CFR Part 61, Subpart R). The 1992
revision permitted uses of PG for agricultural uses (as a conditioner for soils containing
high quantities of salt or low quantities of calcium and other nutrients), research and
development projects and other alternate uses that are approved by EPA on a case-by-
case basis.
In 1999 EPA increased the amount of phosphogypsum which may be used in
indoor laboratory research from 700 to 7,000 pounds per experiment, with no limit on
the number of experiments (40CFR 61.205). Under the 1999 rule, PG may be lawfully
removed from a stack and distributed in commerce for use in agriculture if the average
radium-226 concentration of the PG does not exceed 10 picocuries per gram
(pCi/g)(40CFR 61.204). The owner or operator of the stack from which the PG is
removed shall determine annually the average radium-226 concentration at the location
in the stack from which the PG will be removed. PG may not be lawfully removed from a
stack and distributed or used for any purpose other than agriculture and research
purposes without prior EPA approval (40CFR 61.204). This restriction on the maximum
radium radioactivity essentially eliminates the use of southern/central Florida
phosphogypsum because its radium-226 levels are commonly in the range of 20 to 35
pCi g-1 (Guidry 1990; May and Sweeney 1984a). The restriction does not impact
phosphogypsum from northern Florida or North Carolina, which generally have lower
levels of radium-226.
Considerable research has been conducted to evaluate the leachability of toxic
metals (As, Ba, Cd, Cr, Hg, Pb, Se and Ag) from phosphogypsum by TCLP and

19
EPTOX. Several researchers have conducted leaching tests to estimate mobility of
trace metals, radionuclides and rare earth metals from PG using different leaching
solutions like distilled water, aqua regia, salt water etc.
1.2 Objectives
The primary objective of this thesis was to determine typical trace metal leaching
behavior of PG using standardized regulatory leaching tests for solid wastes. Leaching
tests play an important role in the reuse of raw waste materials as secondary materials.
Analyses such TCLP, SPLP, EPTOX, MEP that would typically be required for a
beneficial use demonstration in Florida were conducted. These analyses were
conducted to evaluate the leachability of trace metals (Ag, Al, As, B, Ba, Ca, Cd, Co, Cr,
Cu, Fe, K, Mn, Na, Ni, Pb, Sb, Se, Sn, Sr, V, Zn) in PG. Laboratory leaching tests which
generate leachate from waste have been used to evaluate leachability of hazardous
constituents (As, Ba, Cd, Cr, Pb, Se, Ag) from PG. The results (total and leachable
concentrations of inorganic constituents) were compared to Florida’s risk-based target
levels like soil cleanup target level (SCTL) and groundwater cleanup target level
(GWCTL). PG leachability using different solutions like MSW leachate and DI water was
also examined. Knowledge on leaching behavior of PG could help to explore disposal
options and assess the risk associated with beneficial-use options for PG.
This study investigates one particular phosphogypsum stack in an attempt to
characterize PG leachability that would be typical for many of the other stacks in central
Florida. Chapter 2 investigates the literature pertinent to PG production and leachate
resulting from PG and leaching tests. Chapter 3 discusses the materials and
methodology used in this research. Chapter 4 presents the results from various leaching
tests. Finally, discussions of the results are presented in Chapter 5.
20
CHAPTER 2 LITERATURE REVIEW
2.1 Phosphoric Acid Production
Phosphogypsum is the primary byproduct generated from the wet-acid process for
producing phosphoric acid from phosphate rock. Phosphoric acid is an industrial raw
material required for the production of phosphate fertilizer. Phosphate rock, mined in
open pit mines, does not have a definite chemical composition and the composition
varies in different mining areas. Phosphate ore contains roughly one-third quartz sands,
one-third clay minerals, and one third phosphate particles (USEPA 1992). Impurities like
calcium, fluoride, chlorides, chromium, rare earths and radio nuclides are also common.
United States is the world’s leading producer and consumer of phosphate rock and
phosphate fertilizers (USGS 2002). Extensive deposits of phosphate rock are found in
Florida, Tennessee, North Carolina and Idaho. As a result of the low aqueous solubility
of calcium phosphate, the phosphate content of the rock is converted into phosphoric
acid to produce fertilizer. Phosphate ore composition partly determines the nature of the
phosphorus fertilizer and phosphogypsum. For every ton of phosphoric acid produced,
4.5-5.5 tons of phosphogypsum are produced (Saylak et al. 1988).
According to a mineral industry survey conducted by U.S. Geological Survey
(USGS) in 2007, a total of twelve phosphate rock producing mines were active
nationwide (Table 2-1). In Florida, phosphate rock is mined and processed by three
companies: CF Industries, Inc., The Mosaic Co., and PCS Phosphate Co., Inc. (USGS
2007).
Phosphate rock is usually treated by a physical process called beneficiation; a
process prior to acid treatment in order to concentrate the P content of the ore (Becker

21
1989). Beneficiation often involves concentration by washing, screening and flotation.
Phosphoric acid is produced either by dry thermal or wet acid methods. The dry thermal
method produces elemental phosphorus using an electric arc furnace. Phosphoric acid
produced by dry thermal process is of a much higher purity and is used in the
manufacture of high grade chemicals, pharmaceuticals, detergents, food products,
beverages, and other non fertilizer products.
In the wet acid process, phosphate rock is treated with concentrated sulfuric acid
and water to produce gypsum (CaSO4.2H2O), phosphoric acid and hydrogen fluoride.
Wet process phosphoric acid is used in fertilizer production because it is more
economical. The following is a simplified chemical reaction to illustrate the process
(Luther et al. 1992).
Ca10(PO4)6F2 + 10H2SO4 + 20H2O →10CaSO4.2H20 + 6H3PO4 + 2HF
Once crystallized, the gypsum is separated from the acid by filtration, mixed with
water and transferred as slurry to onsite disposal areas referred to as phosphogypsum
stacks. The phosphogypsum stacks are an integral part of the overall wet process.
The phosphogypsum slurry is pumped to the top of the stack and discharged into
perimeter deposition ponds. The process water is decanted into a center storage pond
and then removed from the stack for recycle via a siphon. The phosphogypsum slurry
begins to form a small pond on top of the stack with the growth of stack. Workers
dredge gypsum from the pond to build up the dike around it and the pond gradually
becomes a reservoir for storing and supplying process water. As the wet process
requires large quantities of water, the water impounded on the stack is used as a
reservoir that supplies and balances the water needs of the process.

22
2.2 Potential Uses of Phosphogypsum
EPA first banned any use of phosphogypsum in 1989. Since then it has been a
divisive issue on if and how to use phosphogypsum. As a local material,
phosphogypsum stacks can be found extensively in Florida. However, due to the 1992
EPA ban on the use of phosphogypsum, research has slowed dramatically. As a result,
special provisions must be made to FDEP and EPA before this material can be used
other than agricultural purposes.
It is of interest to the fertilizer industry to find effective and economical long-term
solutions for the management of PG; this would help to minimize space requirements
and the potential for environmental impact caused by the accumulation of PG stacks.
Several research projects have investigated practical application of PG for a
variety of purposes, including its use as road fill material (May 1983; Chang 1989; Lloyd
1985) and as a soil stabilizer (Degirmenci 2006). Several roads and parking lots were
constructed using PG or cement-PG. They are used daily in Florida and Texas with no
reported negative environmental impacts (Nifong and Harris 1993). Sulfur deficiencies
exist in soils of the southeastern US. Phosphogypsum soil amendment is a possible
solution to correct this deficiency because it provides a sulfur source that is slowly
available to the plants and is not easily leached out of the soil by rainfall (Lloyd 2004).
Stanley and Lloyd (1992) studied phosphogypsum, reporting that PG is currently
being wasted and that PG enriches the soil. Lloyd states that “PG has been proven to
be a suitable amendment for many soil types and is an excellent fertilizer source of
sulfur, calcium and phosphorous”. He argues that “Any soil that tends to surface-harden

23
and resist water would benefit from PG. It creates a more porous texture that soaks up
rainfall”.
In the past, countries such as France and Japan used phosphogypsum for
construction of roadways and landfills and as a building material for houses. Research
has been conducted in France to use PG for embankment construction (Moussa et al.
1984). Their study showed that re-utilization of PG is possible in well-determined
conditions of placement and use.
Studies suggest that PG along with coal fly ash can be used as an amendment to
improve rice paddy soil fertility (Lee et al. 2009). It was concluded that the fly ash and
PG mixture could be a good source of inorganic soil amendments to restore the soil
nutrient balance in rice paddy soil.
Extensive research has been conducted to recover sulfur from PG. In general,
sulfate is converted to sulfur dioxide by a high temperature decomposition of calcium
sulfate in the PG. The sulfur dioxide is scrubbed from the gaseous emissions and sent
to the facility’s chemical plant where it is converted to sulfuric acid. This is then utilized
in the wet acid process (US EPA 1992). This method is not economical if the price of
sulfur is too low.
2.3 Leaching Tests in Solid Waste Management
Leaching is a method to remove soluble components from a solid matrix. Many
leaching test procedures have been developed to simulate the leaching processes of
wastes in landfills or other disposal scenarios; these assist in evaluating potential risks
to human health and environment from solid wastes. Therefore, leaching tests are often
used in the decision making process of solid waste management. Leaching tests are
used to estimate the potential concentration of contaminant that leaches from a solid

24
waste when exposed to water or similar extraction solution. In general, there are two
types of leaching tests: batch leaching tests and dynamic column/lysimeter tests. Some
common batch leaching tests include Extraction Procedure Toxicity (EPTOX), Toxicity
Characteristic Leaching Procedure (TCLP), Synthetic Precipitation Leaching Procedure
(SPLP), American Society for Testing and Materials (ASTM) extraction test and Multiple
Extraction Procedure (MEP). While batch leaching tests are characterized by a constant
liquid to solid ratio, dynamic leaching tests are characterized by increasing liquid to solid
ratio as the experiment proceeds. Batch tests typically involve adding waste to an
extraction solution and then agitating the mixture for a short period of time (typically less
than 24 hour).Thus, batch tests offer a relatively rapid, cost effective method for the
assessment of metal leachability. Batch tests are primarily conducted as a regulatory
tool but they can also be conducted in a manner to examine a specific variable’s
influence on metal mobility, like impact of pH, liquid to solid ratio, etc.
2.3.1 Toxicity Characteristic Leaching Procedure (TCLP)
TCLP (EPA Method 1311) is the most frequently used batch test in the
management of solid waste. The TCLP was designed by the US Environmental
Protection Agency (EPA) to provide a relatively quick test to determine whether a solid
waste should be characterized as hazardous and thus be managed in a more controlled
manner. The TCLP attempts to mimic reducing, low pH environmental conditions in
MSW landfills. The extraction fluid (pH 4.93 ± 0.05) simulates a scenario where a
potentially hazardous waste is co-disposed with MSW. The primary extraction fluid is a
buffered acetic acid solution in a liquid to solid ratio of 20:1 for 18 ± 2 hours. Particle
size reduction is required if the particle is greater than 1 cm in its narrowest dimension.
The concentrations of contaminants are compared to toxicity characteristic (TC) limit
25
concentrations outlined in 40CFR261.3 to determine hazardous waste designation. The
TC limits for the eight metals used in determination of hazardous waste are presented in
Table 2-2. Note that there are a number of organic contaminants which also carry a
toxicity characteristic limit. TCLP uses acetic acid (weak acid) which has a strong ability
to complex or chelate metals.
2.3.2 Synthetic Precipitation Leaching Procedure (SPLP)
The SPLP is an EPA SW-846 analytical method (EPA Method-1312) designed to mimic
the mobility of toxic contaminants when exposed to acidic rainfall. The SPLP is thus
used to evaluate the potential for metal leaching into ground and surface waters from
waste exposed to rainfall (Jang and Townsend 2001; Brantley and Townsend 1999).
The time and liquid-to-solid ratio are the same as in the TCLP, but SPLP utilizes an
extraction fluid intended to simulate precipitation or acid rain. Particle size reduction is
required if the particle is greater than 1 cm in its narrowest dimension The extraction
fluid (pH 4.2 ± 0.05) is made of two inorganic acids (nitric and sulfuric acid) to simulate
acidic rainwater.
2.3.3 The US EPA Multiple Extraction Procedure (MEP)
The MEP simulates leaching caused by the repetitive precipitation of acid rain
water (EPA Method 1320). MEP may be used to address long-term leachability. MEP is
designed to simulate the leaching that a waste will undergo from repetitive precipitation
of acid rain on an improperly designed sanitary landfill. The repetitive extractions will
give the highest concentration of each constituent that is likely to leach in a natural
environment. This test utilizes an initial acetic acid extraction (pH 5 ± 0.2) followed by
sequential extractions with simulated acid rain So, MEP combines aspects from both
the TCLP and the SPLP. Extraction on the first day calls for TCLP extraction fluid at a

26
liquid-to-solid ratio of 20:1; thereafter, the procedure calls for SPLP extraction solution
(pH 3 ± 0.2) (at least eight subsequent extractions) at the same liquid-to-solid ratio.
Details are discussed in Chapter 3.
2.4 Leaching Tests for Assessing the Potential for Groundwater Contamination
Leaching of pollutants to groundwater is a very complex process influenced by
several factors such as meteorological parameters (e.g., rainfall), soil properties
(particle size distribution, organic carbon content), and physical-chemical characteristics
(Kördel and Klein 2006).
Regulation of groundwater quality is generally under state jurisdiction; most states
have their own risk-based regulatory thresholds regarding contaminant transport from
soil to groundwater. The state of Florida has what are known as Soil and Groundwater
Cleanup target Levels (SCTL and GWCTL). The SCTLs consist of over 350 individual
chemicals with pre-calculated total constituent concentration thresholds based on-direct
human contact with soil and potential for soil contamination to migrate to groundwater.
Different limits reflect different possible groundwater uses. The worst case scenario is
where the water is assumed to be used for direct human consumption.
The GWCTLs are a similar list of maximum leachable concentrations for various
constituents. For particularly hazardous constituents, the US EPA primary and
secondary drinking water standards (Table 2-3) are generally used for the GWCTL.
SCTL were developed based on direct human contact (i.e., direct exposure), and based
on soil acting as a source of groundwater or surface water contamination (i.e.,
leachability). The US EPA has developed measurements of cancer potency of
carcinogens, which are termed cancer slope factors (CSFs). Risk-based soil cleanup
guidelines have been developed for both carcinogens and non carcinogens. For non-
27
cancer risks, the reference dose (RfD) is the term used to refer to the maximum
acceptable exposure. RfD’s are determined from Lowest Observed Adverse Effect
Level (LOAEL) or No Observed Adverse Effect Level (NOAEL) measurements that have
been multiplied by a series of uncertainty factors. There are separate RfDs for different
pathways of exposure (Oral, inhalation). For calculating SCTL, we need to consider
different pathways (ingestion, inhalation, dermal exposure). As for example, equation for
a cancer risk from soil exposure through ingestion will be, CTL (mg/Kg) = {Target
Cancer risk X Body weight (Kg)}/ {Oral Cancer Slope Factor (mg/kg-day)-1X ingestion
rate (mg/day)}.
The formula for calculating GWCTL (carcinogen) is, GWCTL (mg/L) = {Target
Cancer risk X Body weight (Kg)}/ {Oral cancer slope factor ((mg/kg-day)-1 X Average
Water Consumption Rate (L/day)}.
Body weight and water consumption are assumed for calculation. For non
carcinogen it will be only, GWCTL= {(RFDX Body Weight)/Water consumption rate}.
Since metals present in land-applied solid waste may leach from the waste and migrate
to the groundwater (Townsend et al. 2003), possible risk to ground water should be
assessed. In Florida and many other states, leaching risk is evaluated by conducting the
SPLP and comparing the results to the aforementioned risk-based groundwater
standards. This approach is typically viewed as being more representative because the
chemical nature of the waste, which can impact leaching, is tested.
2.5 Characteristics of Phosphogypsum
The chemical and mineralogical characteristics of phosphogypsum vary depending
upon the nature of the phosphate ore, the type of process used in fertilizer
manufacturing, the efficiency of plant operation, the age and location of the stockpile,

28
and any contaminants which may be introduced into the phosphogypsum at the
production plant (Arman and Seals 1990). Calcium and sulfate dominate the
composition of phosphogypsum because it is approximately >90% gypsum (Berish
1990). PG normally has a pH between 4.5 and 5.0. Acidity of PG is due to residual
phosphoric acid, sulfuric acid and fluoride acids contained within the pore spaces. May
and Sweeney (1984a) found the pH of extracts from Florida phosphogypsum to range
between 2.1 and 5.5. Metal concentrations in PG have been thoroughly characterized
and typical concentrations are summarized in Table 2-4. These elemental compositions
may vary greatly depending on the source of the phosphate rock.
2.6 Phosphogypsum Leaching Studies
The leaching behavior of materials depends on several parameters. These include
specific element solubility and availability or release potential. Again solubility can be
influenced by pH, complexation by inorganic species or dissolved organic matter, and
reducing properties (Kim 2002).
May and Sweeney (1984a) investigated nine PG stacks in Florida to study various
physical and chemical characteristics of PG. Results for this analysis showed that the
trace elements were uniformly distributed within the PG stacks. May and Sweeney
(1984b) evaluated the leachability of Ra and elements the EPA has classified as toxic
(As, Ba, Cd, Cr, Pb, Hg, Se, and Ag) by using the standard EPA 'EP' extraction
procedure (Federal Register 1980). The concentrations of toxic elements in the extract
were all below EPA maximal concentrations, therefore the material was considered non-
toxic by EPA standards. The authors estimated that the inclusion of Ra into the
phosphogypsum crystal structure would be 89% of the amount originally present,
indicating that very little Ra would be leached. They concluded that phosphogypsum

29
could not be classified as a hazardous waste because it was neither corrosive nor
caustic (pH was > 2 and < 12.5). In addition the average total elemental concentrations
of elements classified as toxic by the EPA were less than the EPA allowable toxic
elemental criteria for toxic hazardous waste (Federal Register 1980).
Rusch and Seals (2004) conducted TCLP on raw PG and oven dried PG samples
(oven-dried at 45oC for 12 hours and ground to pass through a US Standard sieve
No.10.) collected from Louisiana. The metal concentrations in the leachate from both
type, were also well below the US EPA toxicity characteristics limits. Also, there was no
significant difference between these two types of samples.
Kendron (1996) conducted EPTOX and TCLP on raw PG specimens to
understand the leaching behavior of As, Ba, Cd, Cr, Pb, Ag, Hg and Se through
phosphogypsum. The results indicated a potential leaching of these species. Although,
the leachate concentration levels were below the US EPA toxicity limits, the
concentrations failed to meet the US EPA drinking water limits for several species.
To determine the potential environmental impact of phosphogypsum, Naff (1984)
conducted EPTOX on phosphogypsum. The results were within the permissible EPA
limits for toxicity; however SO42- and fluoride levels exceeded drinking water standards.
Haridasan (2002), conducted leaching studies on PG samples (Kochi, India) using
distilled water (pH 6.0) and rainwater (pH= 5.0–5.8) as leachants. They varied contact
time and solid/liquid ratio in the leaching procedures. The laboratory results indicated
that rainwater leached less 226Ra than distilled water.
The leachability of Cd, Cu, U and Zn in Syrian PG was studied by Al-Masri et al.
(2004). They did leaching test of PG with distilled water and concluded that Cu and Cd

30
are easily transferrable to water or surrounding environment. They also grouped PG into
six different particle sizes to observe the effect of particle size on leachability and found
that fine particles (45–75 mm) yielded a relatively high solubility.

31
Table 2-1. Active phosphate rock mines in the United States in 2007 (USGS 2007)
Owner Mine State
CF Industries, Inc. South Pasture Florida Mosaic Co, The Four Corners Florida Do Hookers Prairie Florida Do Hopewell Florida Do South Fort Meade Florida Do Wingate Creek Florida Nu-West Industries, Inc. (Agrium Inc.) Dry Valley Idaho P4 Production, LLC. (Monsanto Co.) South Rasmussen Idaho PCS Phosphate Co., Inc. Aurora North Carolina Do Swift Creek Florida Simplot, J.R., Co. Smoky Canyon Idaho Do Vernal Utah
Table 2-2. RCRA toxicity characteristics limits (metals only)
Metal RCRA TC Limit (mg/L)
As 5.0 Ba 100 Cd 1.0 Cr 5.0 Hg 0.2 Se 1.0 Ag 5.0 Pb 5.0
Table 2-3. US EPA drinking water standards
Primary Secondary
Contaminant Standard (mg/L) Contaminant Standard (mg/L)
As 0.01 Al 0.2
Ba 2.0 Cu 1.0
Be 0.004 Fe 0.3
Cd 0.005 Mn 0.05
Cr 0.1 Zn 5
Cu 1.3 Cl- 250
Pb 0.015 SO42- 250
Sb 0.006 TDS 500
Se 0.05
Tl 0.002

32
Table 2-4. Content of some trace elements in Phosphogypsum (PG) produced from different rock phosphate sources; also included are typical literature values for soil
Element Florida Source PGa
Idaho Source PGb
South African
Source PGc
Tunisian Source PGd
Typical soile
mg/Kg
Ag <1 1-11 0.05 As 40 <1-2 7.2
Au (g/kg) 3-15
B 3 <10-30 33 Ba 7 20-140 140 580 Be 1 1-2 0.92 Br 1-2 0.85 Cd 7 9-28 40 0.35 Cl <100-300 100 Co 2 <1 8 9.1 Cr <10-70 54 Cu 8 10-42 103 6 25
Hg (g/kg) <50 14000 90
Mn 15 <2-10 550 Mo 16 <1-2 5 0.97 Ni 2 3-15 15 19 Pb 1 3-7 13 19 Rb <10-20 67 Sb 100 0.3-0.8 0.66 Se 4-67 0.39 Sr 10 610-670 240 Th <1 9.4 U 6-13 2.7 V 19 10-40 80 Y 2 100-120 50 25 Zn 9 18-112 6 315 60 Zr 10 <10-110 185 230 aMay and Sweeney (1984a) bLuther and Dudas (1993) cMalan (1988) dRouis and Bensalah (1990) eSposito (1989)

33
CHAPTER 3 METHODS AND MATERIALS
3.1 Overview
To assess the leachability of various trace metals from phosphogypsum (PG),
samples were extensively analyzed with respect to composition and leaching behavior.
Inorganic element concentration from acid digestion and leaching samples were
analyzed using Inductively Coupled Plasma Atomic Emission Spectroscopy (ICP-
AES).This section will describe the preparation of the samples and methods that were
followed to carry out the leaching tests.
3.2 Sample Collection and Processing
PG was sampled from the top of a PG stack located in Mulberry, Florida. Samples
were collected from four locations: the north, south, east, and west walls of the top
stack. Samples were retrieved from depths of 1 to 2 feet from the top of the stack. PG
samples were named north wall (NW), south wall (SW), east wall (EW) and west wall
(WW) based on their locations. PG samples were collected by using cleaned scoops,
trowels, shovels, and were placed in five-gallon buckets (HDPE) then sealed with lids.
PG samples were then transported to the UF laboratory. A total of 330 kg of PG was
collected from each of the four sampling locations. In the lab, samples collected from
different locations were not mixed together. But samples collected from different depths
for each location were thoroughly mixed to get a homogenous sample for that location
Samples were stored in closed containers in the lab at room temperature. To perform
research on PG, the requirements of 40 CFR 61.205 were followed; all PG was
accompanied by certification documents that conformed to the requirements of 40 CFR
61.208. The total quantity of PG at a facility did not exceed 7000 lbs. Containers of PG
34
were labeled with the following warning: “Caution: Phosphogypsum Contains Elevated
Levels of Naturally Occurring Radioactivity”.
3.3 Leaching Procedures
Four regulatory-based leaching tests were performed-TCLP, SPLP, EPTOX, and
MEP. The TCLP, SPLP, EPTOX, and MEP were developed by the US Environmental
Protection Agency (EPA). In addition, several experiments were conducted in a similar
fashion as TCLP but substituting actual landfill leachates and DI water as the leaching
solution.
3.3.1 Toxicity Characteristic Leaching Procedure
The TCLP method is defined in EPA Method 1311.TCLP uses one of two different
extraction fluids, depending on the alkalinity of the waste. Extraction fluid 1 is prepared
by diluting a mixture of 11.4 mL acetic acid (CH3COOH) and 128.6 mL of 1N sodium
hydroxide (NaOH) to 2L deionized water (DI). The resulting solution pH is 4.93 ± 0.05.
Extraction fluid 2 is used for highly alkaline materials. This solution is prepared by
adding 11.4 mL acetic acid to 2L deionized water. pH of this solution should be
2.8±0.05. Because the pH of the PG sample was less than 5, extraction fluid 1 was
used. The TCLP requires that samples first be size-reduced to less than 0.95 cm in any
dimension. One hundred grams of the size-reduced samples were placed in a 2.2-L
TCLP extraction vessel, and 2.00 L of the extraction solution were added. The slurry
was mixed on a rotary extractor for 18 ± 2 hr at 30 ± 2 revolutions per minute and then
filtered through a 0.7 μm glass fiber filter. The filtrate was collected in 500 mL plastic
bottles (HDPE) and preserved by adjusting the pH to less than 2 using nitric acid. The
leachates generated by the TCLP process were acid digested and analyzed using ICP-
AES.

35
3.3.2 Synthetic Precipitation Leaching Procedure
SPLP leachates were prepared according to the procedure outlined in EPA
method 1312. A concentrated SPLP solution was prepared by adding 100 mL of one
percent (by volume) solution of concentrated nitric acid and 100 mL of one percent
solution of concentrated sulfuric acid, and then combining these in a 2 parts nitric to 3
parts sulfuric ratio (40%:60%). Then, 0.4 - 0.5 mL of concentrated SPLP solution was
added to reagent water in a 2-L volumetric flask and diluted to 2-L. The resulting SPLP
solution pH was required to be 4.20 ± 0.05. The SPLP requires that samples first be
size-reduced to less than 0.95 cm. One hundred grams of the size-reduced samples
were placed in a 2.2-L SPLP extraction vessel, and 2 L of the SPLP solution were
added. The slurry was mixed on a rotary extractor for 18 ± 2 h. After the extraction
procedures, separation of the leachate solution from PG was completed using a
vacuum filtration set-up. The filter used was a 0.7 μm acid-washed glass fiber filter .The
rotary extractor was used during the TCLP and SPLP tests was designed to rotate eight
2-L bottles in an end-over-end fashion. When loaded with a full load, each extractor
rotates at 30 rpm as required by the TCLP and SPLP procedures. The filtrate was
collected in 500-mL plastic bottles and preserved by adjusting the pH to less than 2
using nitric acid.
3.3.3 Extraction Procedure (EP) Toxicity Test Method
The method is defined in EPA Method 1310b.This test requires the continual
addition of acid to maintain a constant extraction pH. For the EPTOX, 100 g of sample
were placed in 1.6 L of deionized water and agitated for 24 hours. The method requires
that the pH of the mixture be maintained at 5 ± 0.2 by adding 0.5N acetic acid. The PG
samples in this study did not require any further acid addition. After 24 h of extraction,

36
deionized water was added to bring the total volume of the extraction fluid to 2 L. The
leachate was filtered using 0.45-μm filter.
3.3.4 Multiple Extraction Procedure
This test utilizes an initial acetic acid extraction followed by sequential extractions
with simulated acid rain. The initial extraction fluid is the same as the EPTOX. The
simulated rainfall extraction solution is similar to the SPLP leaching fluid but with a pH of
3.0 ± 0.2. This synthetic acid rain extraction fluid was prepared by adding 60% sulfuric
acid and 40% nitric acid (weight percent) to distilled deionized water until the pH is 3.0 ±
0.2. The residual solids after the extraction were re extracted nine times consecutively
using synthetic acid rain extraction fluid. An initial sample size of 12.5 g was used. Each
extraction step is performed at an L/S ratio of 20:1 for 24 h. After each filtration, both the
filter and the sample were added to the next extraction vessel. The final pH values of
leachates and metal ion concentrations were determined for each extraction.
3.3.5 Batch Leaching Test with MSW Leachate
This batch leaching test mimicked the condition that MSW landfill leachate directly
contacts PG and measured any constituent change before and after mixing MSW
leachate with PG. This test method is similar to the TCLP or SPLP test except that it
uses MSW landfill leachate as the extract solution. A 100 g sample of PG was mixed
with 2 L of MSW leachate and mixed for 18 ± 2 hours using a rotating shaker at 30 rpm.
The mixture of MSW landfill leachate and PG was filtered using 0.7 μm glass fiber filter
after the rotation. Inorganics were analyzed after acid digestion. For this test, MSW
landfill leachate was obtained from Polk County North Central landfill. The pH of
leachate was 7.6 and totals dissolved solids (TDS) was 6300 mg/L.

37
3.3.5.1 Sulfate analysis
Sulfate concentration in leachate samples from batch leaching test of PG (with
MSW leachate) was determined using a spectrophotometer (DR/4000 UV-VIS, HACH,
Loveland, CO) with HACH Method 8051. A sample cell was filled with 25 mL of sample.
One SulfaVer® 4 reagent powder was added to the cell. Sulfate ions in the sample react
with barium in the SulfaVer® 4 and form a precipitate of barium sulfate. The amount of
turbidity formed is proportional to the sulfate concentration.
3.3.5.2 Total dissolved solids (TDS)
Total dissolved solids (TDS) of the leaching solution from the batch leaching test
with MSW leachate was determined following EPA method 160.1. For this, aluminum
weighing dishes were placed in an 180oC drying oven one day before the test.
Desiccators were used to cool the dishes. Pre-dried dishes were weighed. A total of 100
mL sample was filtered using vacuum filtration. Filtrates were placed into an oven at
95oC for 18 hours to allow the samples to evaporate to dryness. After 18 hours,
temperature was increased to 180oC and continued at least for another 4 hours. The
dishes are removed from the oven and placed in the desiccators to cool for 30 minutes.
Then the dishes were returned to the 180oC oven for 1-2 hours and weighed. This
drying and weighing cycle was repeated until the last two weighings differ by less than
0.5 mg. Dishes were then placed in the desiccators to cool for at least one hour. Then
the dish containing the oven-dried sample was weighed to the nearest 0.1 mg. TDS was
determined using Equation 3-1.
(
)
(3-1)

38
3.3.6 Batch Leaching Test with DI Water
This test is similar to TCLP/SPLP except DI water was used as the leaching
solution. For this batch test 100 grams of PG was mixed with 2 L of DI water in a 2.2 L
glass jar. The mixture was agitated using a rotator for 16 to 20 hrs. After tumbling, the
slurry was filtered to separate PG leachate from the slurry. Then samples of this PG
leachate was retained for the chemical analysis.
3.4 Total Metal Analysis
Samples were digested to prepare them for trace metal analysis. The leaching test
samples from various batch tests were digested according to US EPA Method 3010. To
determine total metal concentration of PG, samples were digested according to the US
EPA 3050B. Digestion procedure was used to prepare aqueous leachate samples that
may contain insoluble colloidal particles for analysis by Inductively Coupled Plasma
Atomic Emission Spectrophotometer (ICP-AES). Leached and digested samples were
analyzed using ICP-AES as per US EPA SW846 method 6010B.
For digestion of aqueous samples nitric acid is added to a specified volume (50
mL) to the sample. The sample is refluxed with additional portion of nitric acid until the
digestate is clear or the color is stable. When the digestate reduced to a low volume, it
is then finally refluxed with hydrochloric acid and brought up to volume. The digested
sample is than analyzed by ICP-AES.
For digestion of solid PG, 1 gram (dry weight) sample was digested with repeated
additions of nitric acid (HNO3) and hydrogen peroxide (H2O2). For ICP-AES analyses,
hydrochloric acid (HCl) is added to the final digestate and the sample is refluxed.

39
3.5 pH of Phosphogypsum
The pH values of PG samples were determined by EPA method 9045D. For this,
20 grams of PG was mixed with 20 mL of reagent water and stirred continuously for 5
min. Then it was allowed to stand for 1 hour. After that, pH was measured.
3.6 Quality Assurance and Quality Control
All sampling equipment and containers were cleaned and prepared according to
the US EPA established standards. In the laboratory, analysis blanks, duplicates and
calibration check samples were analyzed as appropriate. For total metal analysis every
digestion event included (approximately 20 samples) a blank sample, a duplicate
sample, a triplicate sample, a matrix spike, a matrix spike duplicate for digestion. All
regulatory batch leaching test were conducted in triplicate. However for digestion, a
blank, duplicate sample, a sample spike and a sample spike duplicate were included.

40
CHAPTER 4 RESULTS
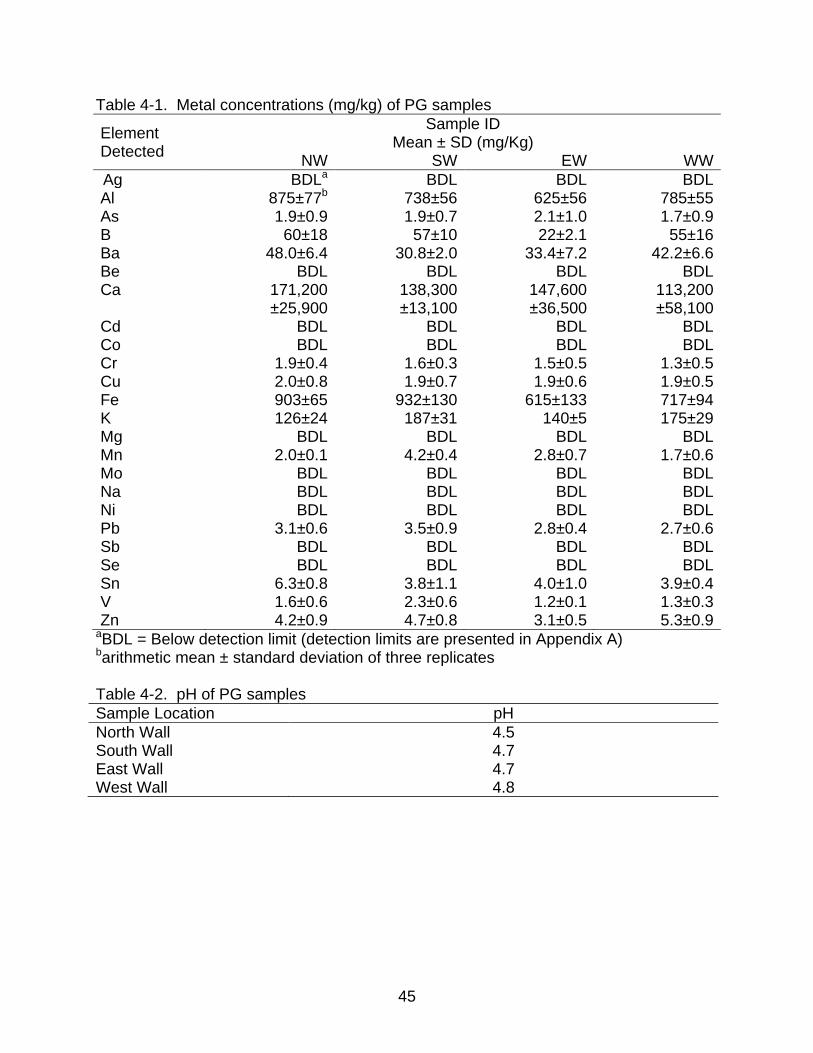
4.1 Total Metal Analysis Results
The chemical composition, which was determined using the US EPA Method
3051b, of the PG samples from each location is shown in Table 4-1. Samples were
analyzed for 23 metals (silver, aluminum, arsenic, boron, barium, beryllium, calcium,
cadmium, cobalt, chromium, copper, iron, potassium, magnesium, manganese sodium,
nickel, lead, antimony, selenium, tin, vanadium and zinc.). Calcium was the most
abundant metal detected in PG and ranges from 113,220 (± 58,100) to 171,200 (±
25,900) mg/kg. The minor constituents of raw PG were Al, Fe and K which each had a
concentration that exceeded 100.0 mg/kg. Trace elements, such as As, B, Ba, Cr, Cu,
Mn, Pb , Sn, V and Zn were also present. Ag, Cd, Co, Mg, Mo, Na, Ni, Sb and Se were
not detectable in the samples that were tested. For PG metal analysis, triplicate
samples from each location were analyzed. Of the RCRA TC limit metals, barium had
the highest concentration (38.6 mg/Kg). Concentrations of other toxic metals (As, Cr,
Pb) were below 3 mg/Kg. To use PG beneficially, to where direct human contact with
the PG is possible, comparison with risk based standards is needed. Although risk
assessment through direct exposure is not the focus of this research, it is discussed
briefly as it would certainly need to be considered as part of any beneficial use
application. Table 4-3 compares the concentration for each metal with its respective
Florida’s risk based soil cleanup target level. Florida’s SCTLs examine direct exposure
in two scenarios, residential and industrial settings. Of the metals detected in PG, the
95% Upper Confidence Limit (UCL95) of only one metal (arsenic) was slightly above its
SCTL for residential exposure but below the industrial limit. UCL95 was calculated using

41
samples from all four locations. In Table 4-1, the average concentrations with standard
deviations for each PG sample are presented. Detailed total analysis results are given
in Appendix B.
4.2 pH of Phosphogypsum
The pH of PG samples used in this study was in the range of 4.5-4.8 (Table 4-2).
One PG sample from each location was tested for pH. The pH of DI water used for this
experiment was 6.3. Though PG is composed primarily of the slightly soluble neutral
salt, calcium sulfate dihydrate, the acidity may be due to residual phosphoric and
sulfuric acids plus hydrofluoric and fluosilicic acids (Smith and Wrench 1984).
4.3 Toxicity Characteristic Leaching Procedure (TCLP)
US EPA specifies toxicity characteristic limits based on the metal concentrations in
the TCLP leachates. If any listed compound (mentioned in Chapter 2) exceeds the level
specified, the original waste is considered hazardous. The TCLP leachates for raw PG
were analyzed for trace metals that are on EPA’s list of toxicity characteristic elements
such as silver, arsenic, barium, cadmium, chromium, lead and selenium. Mercury was
not tested in this study. The TCLP was performed on 12 samples (triplicate samples for
each of the 4 locations). All the metal concentrations in the TCLP leachate analyzed for
each location were well below the respective regulatory levels. TCLP test data are
presented in Figures 4-1 through 4-4. Samples whose concentrations are below
detection limits are presented in the plots on the MDL (method detection limit) line. In
general, barium leached at higher concentrations than chromium. The mean barium
concentration of all 12 samples was 0.11 mg/L (0.07–0.16 mg/L).

42
4.4 Synthetic Precipitation Leaching Procedure (SPLP)
The average concentrations (from the four samples; each sample was measured
in triplicate) of 21 inorganic elements in the extraction fluids from SPLP test were
determined. Eleven of them were detected at concentrations above their respective
detection limit. As, B, Be, Cd, Co, Pb, Sb, Sn, Sr, V were not detected in SPLP.SPLP
results were compared with Groundwater Cleanup Target Levels (GWCTL). Most of the
metals were well below GWCTL except for aluminum and iron. Aluminum concentration
is greater than the GWCTL for all the samples. Iron concentration is greater than
GWCTL for six samples out of twelve. Even though aluminum and iron are the
secondary standards, these results may be questioned by a regulatory agency when
PG is considered for use in land application. SPLP results are presented in Figures 4-5
through 4-13 and detailed data are given in Appendix C.
Figures 4-14 and 4-15 show the initial and final pH’s for the TCLP test and SPLP
test, respectively. The final pH in the SPLP test was consistently lower than the TCLP
test in terms of final pH. Figure 4-15, which shows the initial and final pH’s in the SPLP
tests, shows that the final pH’s are generally consistent regardless of the location of the
sample.
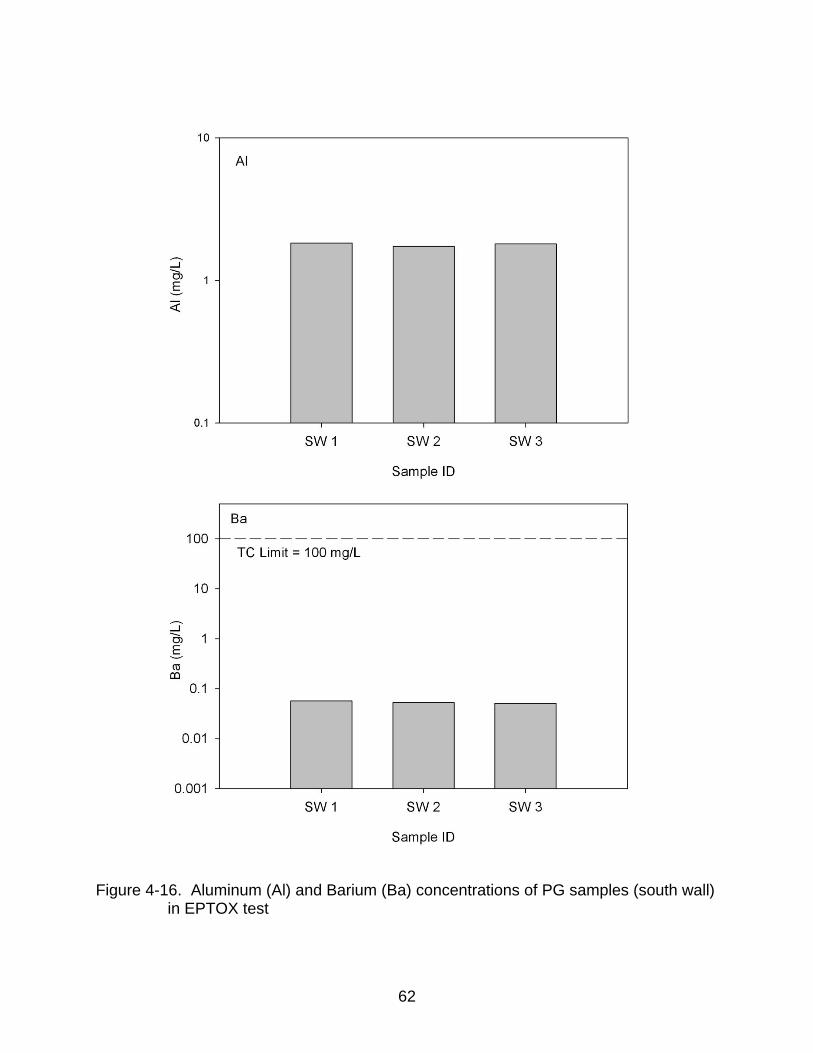
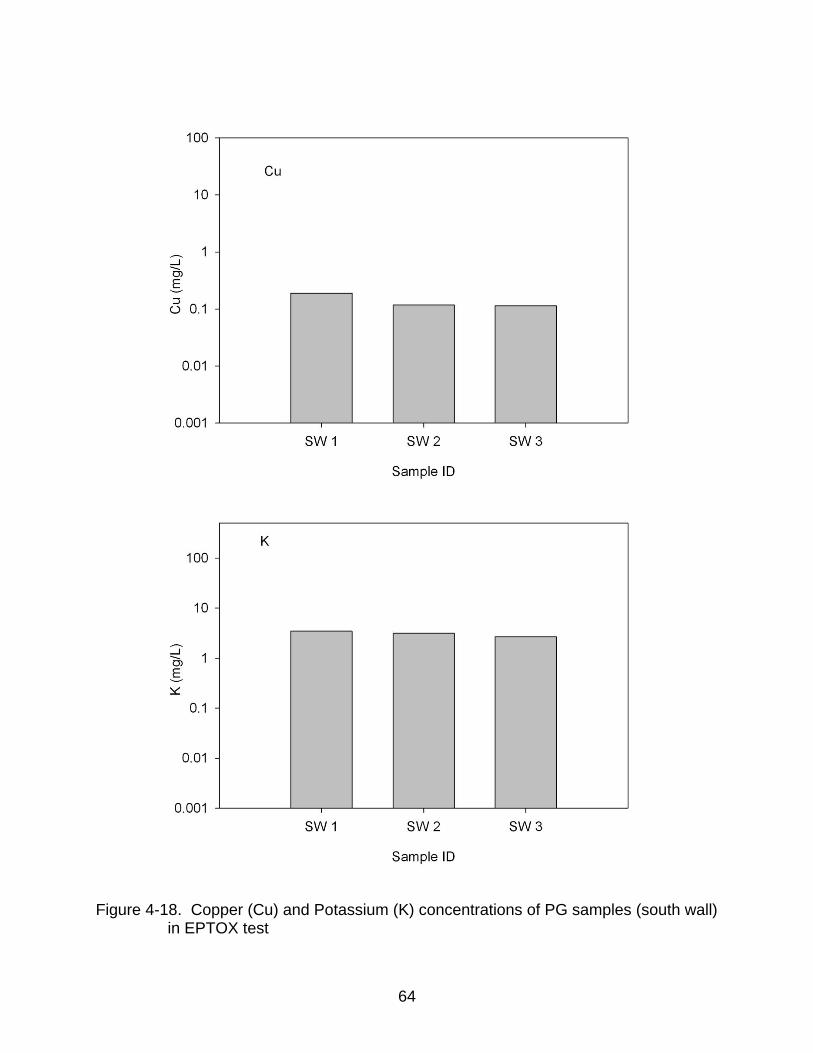
4.5 Extraction Procedure Toxicity
EPTOX was conducted on PG samples of one location (SW) in triplicate and of the
22 metals analyzed aluminum, barium, calcium, chromium, copper, iron, potassium,
magnesium, nickel, strontium and zinc were detected. Final pHs of extraction fluids
were greater than SPLP but close to TCLP test (Table 4-4). The TCLP extracted slightly
higher concentrations of all the metals than EPTOX except copper, nickel and zinc.
Both tests use acetic acid as leaching solution but they have different pH. EPTOX
43
results are presented in Figures 4-16 through 4-20 and detailed data are given in
Appendix E.
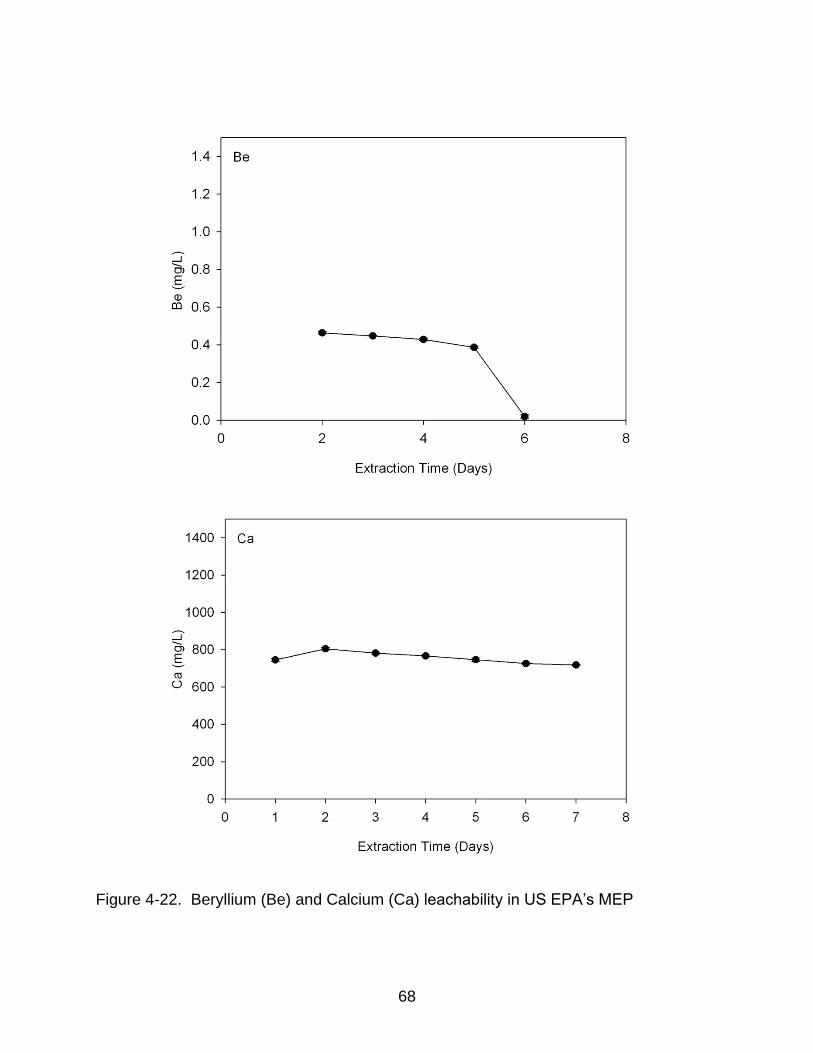
4.6 USEPA Multiple Extraction Procedure
The MEP is used to assess long-term leachability of waste by combining aspects
from both the TCLP and the SPLP. The method requires sequential extraction of the
same waste. With each subsequent extraction, it is usually expected that leaching
concentrations will be decreased with time as there are less contaminants available for
leaching. As samples from all the locations showed similar leaching concentrations, the
MEP was conducted on samples from only one location (SW) in triplicate. Of the 21
metals analyzed only aluminum, barium, beryllium calcium, chromium, copper,
potassium, magnesium, nickel, strontium and zinc were detected above their respective
detection limit. The barium, copper, magnesium and potassium results are typical of
most sequential leaching tests, with the concentrations decreasing with consecutive
extractions. However, for other detected metals, an increase in concentration is
observed in the second extraction compared to the first extraction. This may be due to
the change in pH (Table 4-5). After the initial increase the metal concentration stabilized
and began to decrease with subsequent extractions. Results are presented in Figures
4-21 through 4-26.
4.7 Additional Leaching Testing
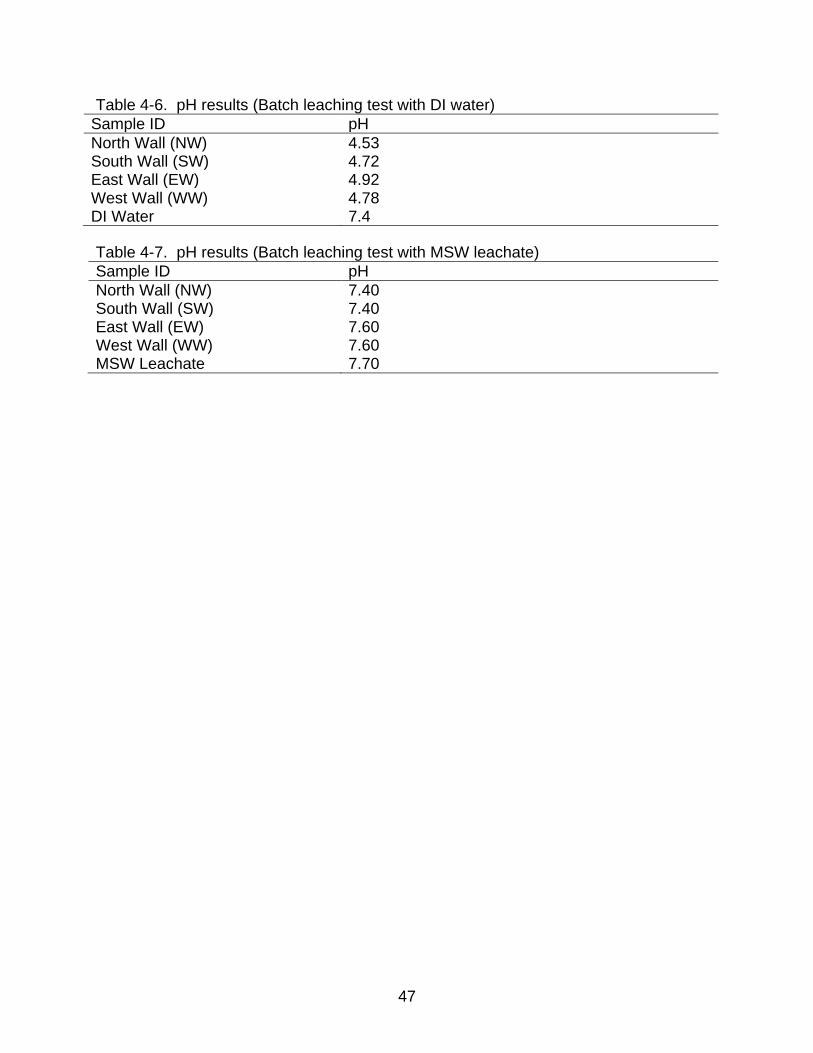
4.7.1 The Deionized Water Batch Leaching Test
Batch leaching test with DI water was conducted on samples of all four locations in
duplicate (Figures 4-27 through 4-31, Table 4-6). Calcium, which was predominant,
leached more in DI leachate than SPLP. Average calcium concentration in SPLP
leachate is 656 mg/L and 808 mg/L in DI water leachate. Of the 22 metals analyzed

44
only aluminum, barium, calcium, copper, potassium, molybdenum, sodium, nickel,
strontium and zinc were detected above their respective detection limit. Iron, which was
detected both in SPLP and TCLP test, was below its detection limit when leached with
DI water. Barium concentration was also higher in both TCLP and SPLP than DI water
leaching test. Again, copper concentrations leached by DI water were higher than both
SPLP and TCLP. Other than these metals, when PG samples were leached with DI
water; extracted concentrations were somewhat similar to the SPLP.
4.7.2 Batch Leaching Test with MSW Leachate
Figures 4-32 through 4-40 present the results of the leaching tests where MSW
leachates were used as the extraction fluids. Table 4-7 presents the result of the final
pH of MSW leaching solutions. This leaching test was carried out on samples of all four
locations in triplicate. Samples were analyzed for 22 metals. Only antimony, copper,
selenium and tin were below their respective detection limit. Concentrations of most
cations in the MSW leaching solution were similar to those in the MSW leachate except
calcium, iron and strontium. While iron concentration decreased after contacting with
leachate, strontium concentration increased. Calcium concentrations in MSW leaching
solution were up to one order of magnitude greater than those in the MSW leachate.
Concentrations of sulfate and TDS in the MSW leachate were compared to those in the
original MSW leaching solutions (Figure 4-41 and 4-42). Sulfate concentrations in the
leachate ranged from 3,000-3,250 mg/L. These sulfate concentrations are 15 times
greater than those in original MSW leachate. TDS measured in the leaching solutions
ranged from 9,350-9,500 mg/L. TDS concentration in the original MSW leachate was
about 6,300 mg/L.
45
Table 4-1. Metal concentrations (mg/kg) of PG samples
Element Detected
Sample ID Mean ± SD (mg/Kg)
NW SW EW WW
Ag BDLa BDL BDL BDL Al 875±77b 738±56 625±56 785±55 As 1.9±0.9 1.9±0.7 2.1±1.0 1.7±0.9 B 60±18 57±10 22±2.1 55±16 Ba 48.0±6.4 30.8±2.0 33.4±7.2 42.2±6.6 Be BDL BDL BDL BDL Ca
171,200 ±25,900
138,300 ±13,100
147,600 ±36,500
113,200 ±58,100
Cd BDL BDL BDL BDL Co BDL BDL BDL BDL Cr 1.9±0.4 1.6±0.3 1.5±0.5 1.3±0.5 Cu 2.0±0.8 1.9±0.7 1.9±0.6 1.9±0.5 Fe 903±65 932±130 615±133 717±94 K 126±24 187±31 140±5 175±29 Mg BDL BDL BDL BDL Mn 2.0±0.1 4.2±0.4 2.8±0.7 1.7±0.6 Mo BDL BDL BDL BDL Na BDL BDL BDL BDL Ni BDL BDL BDL BDL Pb 3.1±0.6 3.5±0.9 2.8±0.4 2.7±0.6 Sb BDL BDL BDL BDL Se BDL BDL BDL BDL Sn 6.3±0.8 3.8±1.1 4.0±1.0 3.9±0.4 V 1.6±0.6 2.3±0.6 1.2±0.1 1.3±0.3 Zn 4.2±0.9 4.7±0.8 3.1±0.5 5.3±0.9
aBDL = Below detection limit (detection limits are presented in Appendix A) barithmetic mean ± standard deviation of three replicates Table 4-2. pH of PG samples
Sample Location pH
North Wall 4.5 South Wall 4.7 East Wall 4.7 West Wall 4.8

46
Table 4-3. Total metal comparison with risk based standards for direct exposure
Metal
Mean Concentration ± SD (mg/Kg)
UCL95 (mg/Kg)
Florida SCTL
Residential (mg/Kg)
Industrial (mg/Kg)
Al 756108a 817 80000 NA
As 1.90.8 2.37 2.1 12
B 48.519.8 59.7 17000 430000
Ba 38.68.8 43.6 120 130000
Ca 14259029550 159296 NA NA
Cr 1.60.4 1.82 210 470
Cu 1.90.6 2.28 150 89000
Fe 792166 886 53000 NA
K 15733.4 176 NA NA
Mn 2.71.1 3.31 3500 43000
Pb 3.00.7 3.4 400 1400
Sn 4.51.3 5.26 47000 880000
V 1.60.6 1.93 67 10000
Zn 4.31.1 4.95 26000 630000 aarithmetic mean ± standard deviation of all (12) samples Table 4-4. pH results (Extraction Procedure Toxicity Test)
Sample ID pH
SW 1 4.71 SW 2 4.69 SW 3 4.72 DI Water 7.20
Table 4-5. pH results (Multiple Extraction Procedure Test)
Extraction Number pH
1 4.71 2 3.39 3 3.44 4 3.40 5 3.26 6 3.34 7 3.34 8 3.30 9 3.15
47
Table 4-6. pH results (Batch leaching test with DI water)
Sample ID pH
North Wall (NW) 4.53 South Wall (SW) 4.72 East Wall (EW) 4.92 West Wall (WW) 4.78 DI Water 7.4
Table 4-7. pH results (Batch leaching test with MSW leachate)
Sample ID pH
North Wall (NW) 7.40 South Wall (SW) 7.40 East Wall (EW) 7.60 West Wall (WW) 7.60 MSW Leachate 7.70

48
Figure 4-1. Silver (Ag) and Arsenic (As) concentrations of PG samples in TCLP test
49
Figure 4-2. Barium (Ba) and Cadmium (Cd) concentrations of PG samples in TCLP test

50
Figure 4-3. Chromium (Cr) and Lead (Pb) concentrations of PG samples in TCLP test
51
Figure 4-4. Selenium (Se) concentration of PG samples in TCLP test

52
Figure 4-5. Silver (Ag) and Aluminum (Al) concentrations of PG samples in SPLP test
53
Figure 4-6. Arsenic (As) and Boron (B) concentrations of PG samples in SPLP test

54
Figure 4-7. Beryllium (Be) and Cadmium (Cd) concentrations of PG samples in SPLP test

55
Figure 4-8. Chromium (Cr) and Copper (Cu) concentrations of PG samples in SPLP test

56
Figure 4-9. Iron (Fe) and Potassium (K) concentrations of PG samples in SPLP test
57
Figure 4-10. Sodium (Na) and Nickel (Ni) concentrations of PG samples in SPLP test

58
Figure 4-11. Lead (Pb) and Antimony (Sb) concentrations of PG samples in SPLP test
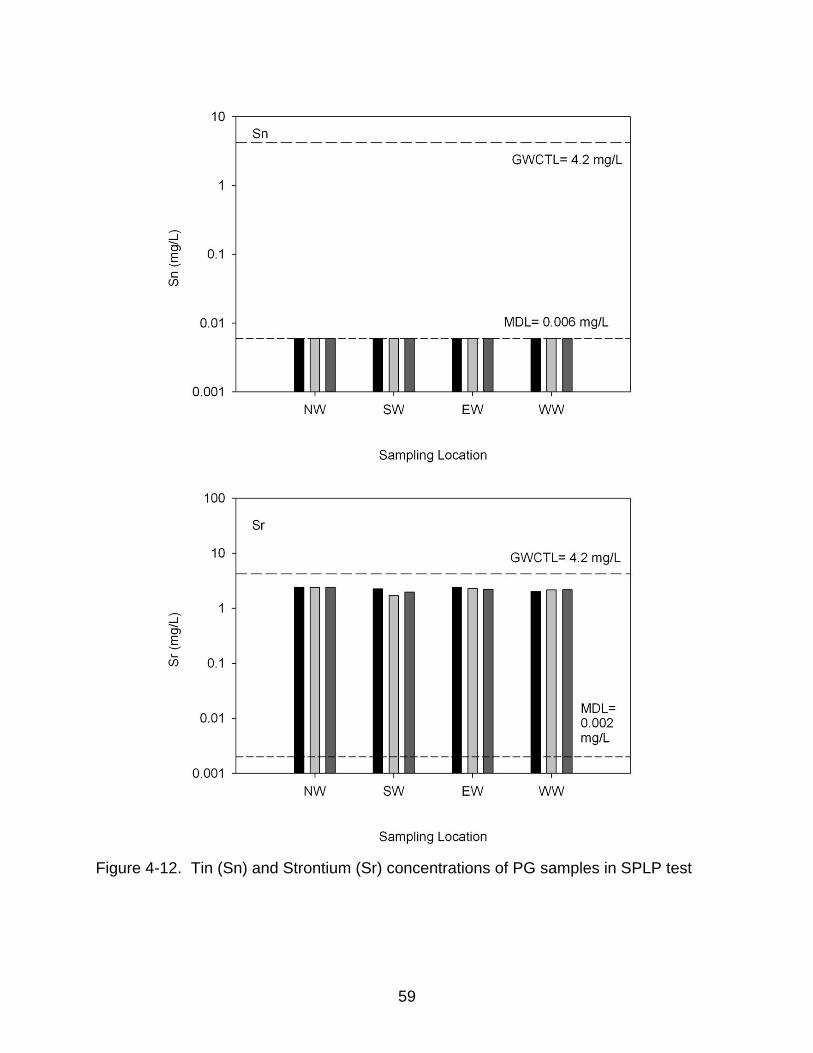
59
Figure 4-12. Tin (Sn) and Strontium (Sr) concentrations of PG samples in SPLP test

60
Figure 4-13. Vanadium (V) and Zinc (Zn) concentrations of PG samples in SPLP test

61
Figure 4-14. Toxicity Characteristic Leaching Procedure initial and final pH
Figure 4-15. Synthetic Precipitation Leaching Procedure initial and final pH
4.6
4.7
4.8
4.9
5
NWSW
EWWW
pH
Sample Location
Final
Initial
3.8
4
4.2
4.4
4.6
4.8
NWSW
EWWW
pH
Sample Location
Initial
Final
62
Figure 4-16. Aluminum (Al) and Barium (Ba) concentrations of PG samples (south wall) in EPTOX test

63
Figure 4-17. Calcium (Ca) and Chromium (Cr) concentrations of PG samples (south wall) in EPTOX test
64
Figure 4-18. Copper (Cu) and Potassium (K) concentrations of PG samples (south wall) in EPTOX test

65
Figure 4-19. Magnesium (Mg) and Nickel (Ni) concentrations of PG samples (south wall) in EPTOX test

66
Figure 4-20. Strontium (Sr) and Zinc (Zn) concentrations of PG samples (south wall) in EPTOX test

67
Figure 4-21. Aluminum (Al) and Barium (Ba) leachability in US EPA’s MEP
68
Figure 4-22. Beryllium (Be) and Calcium (Ca) leachability in US EPA’s MEP

69
Figure 4-23. Chromium (Cr) and Copper (Cu) leachability in US EPA’s MEP

70
Figure 4-24. Potassium (K) and Magnesium (Mg) leachability in US EPA’s MEP
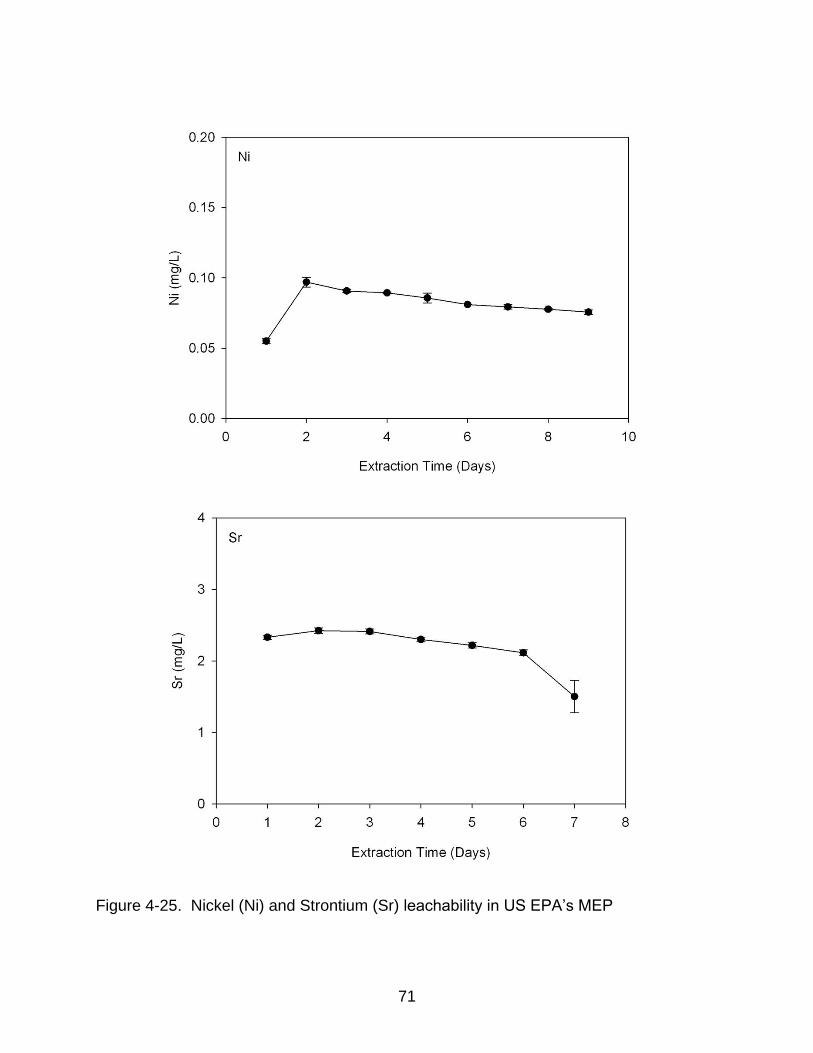
71
Figure 4-25. Nickel (Ni) and Strontium (Sr) leachability in US EPA’s MEP
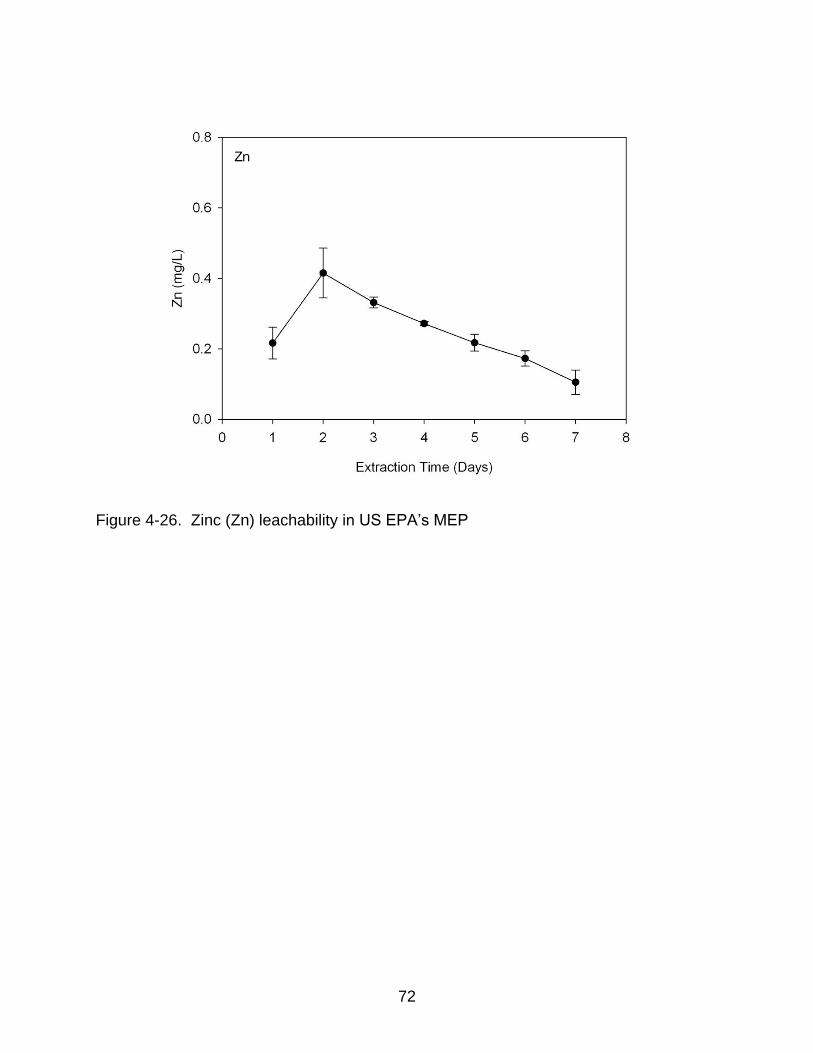
72
Figure 4-26. Zinc (Zn) leachability in US EPA’s MEP

73
Figure 4-27. Aluminum (Al) and Barium (Ba) concentrations in DI water batch leaching test

74
Figure 4-28. Calcium (Ca) and Copper (Cu) concentrations in DI water batch leaching test
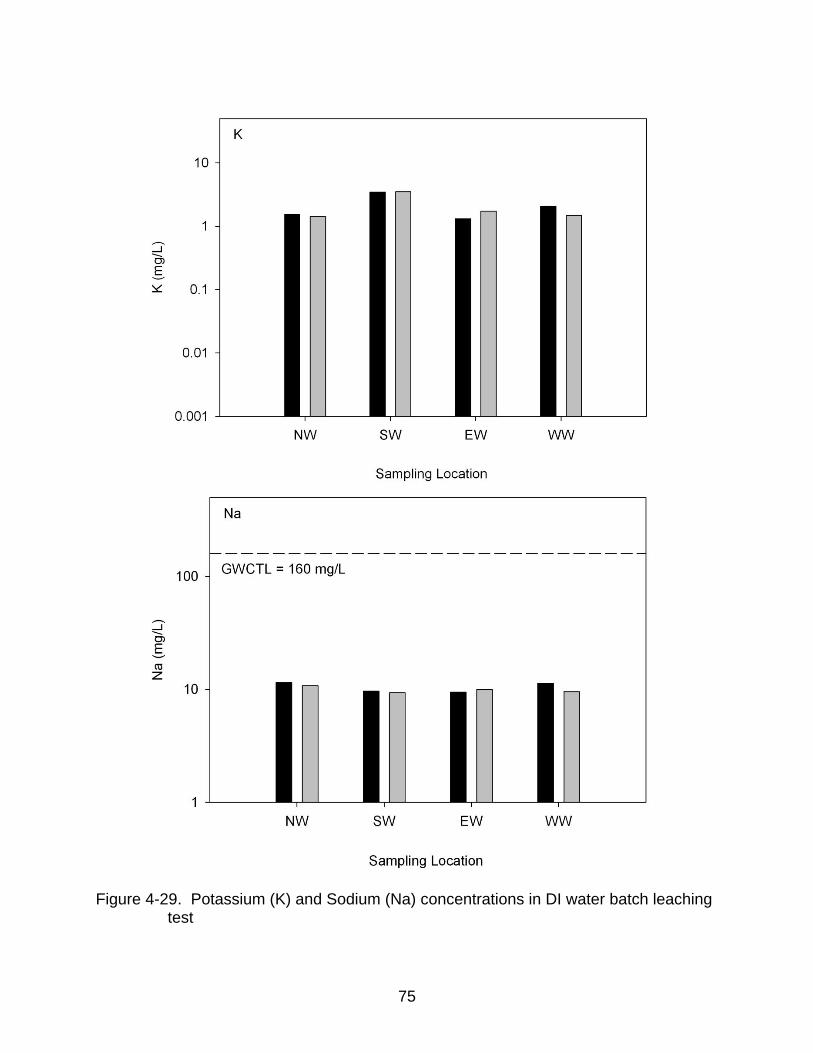
75
Figure 4-29. Potassium (K) and Sodium (Na) concentrations in DI water batch leaching
test

76
Figure 4-30. Nickel (Ni) and Strontium (Sr) concentrations in DI water batch leaching test
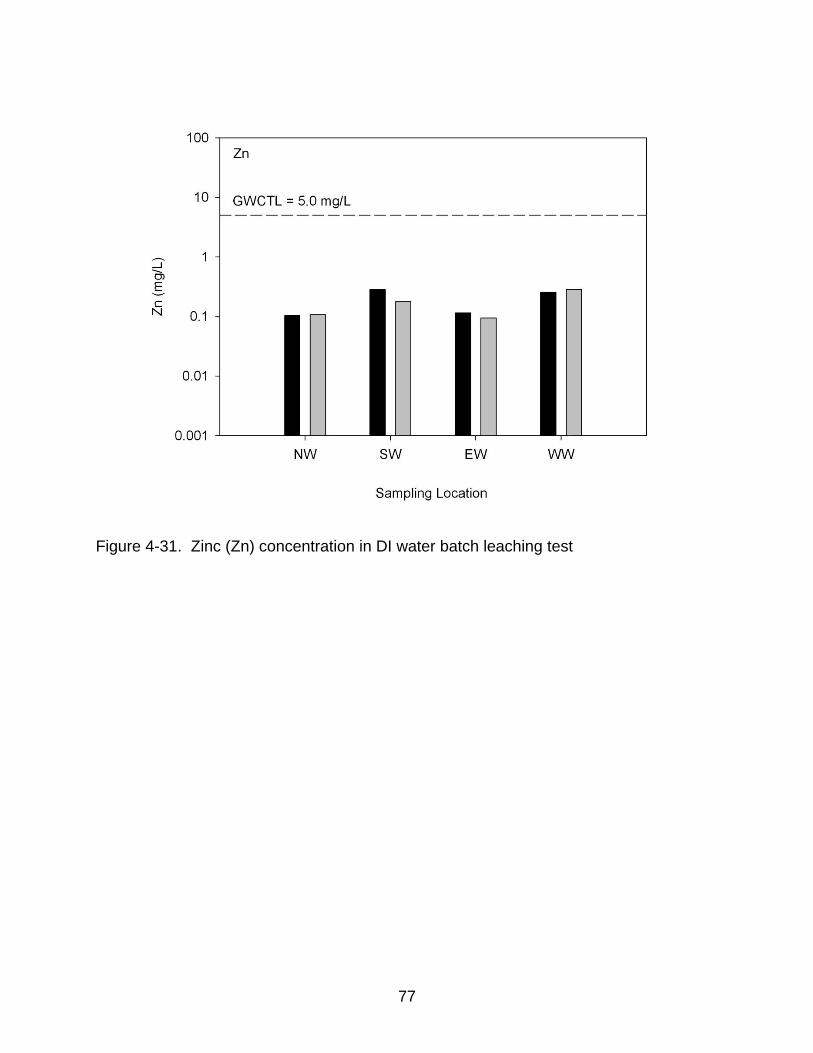
77
Figure 4-31. Zinc (Zn) concentration in DI water batch leaching test
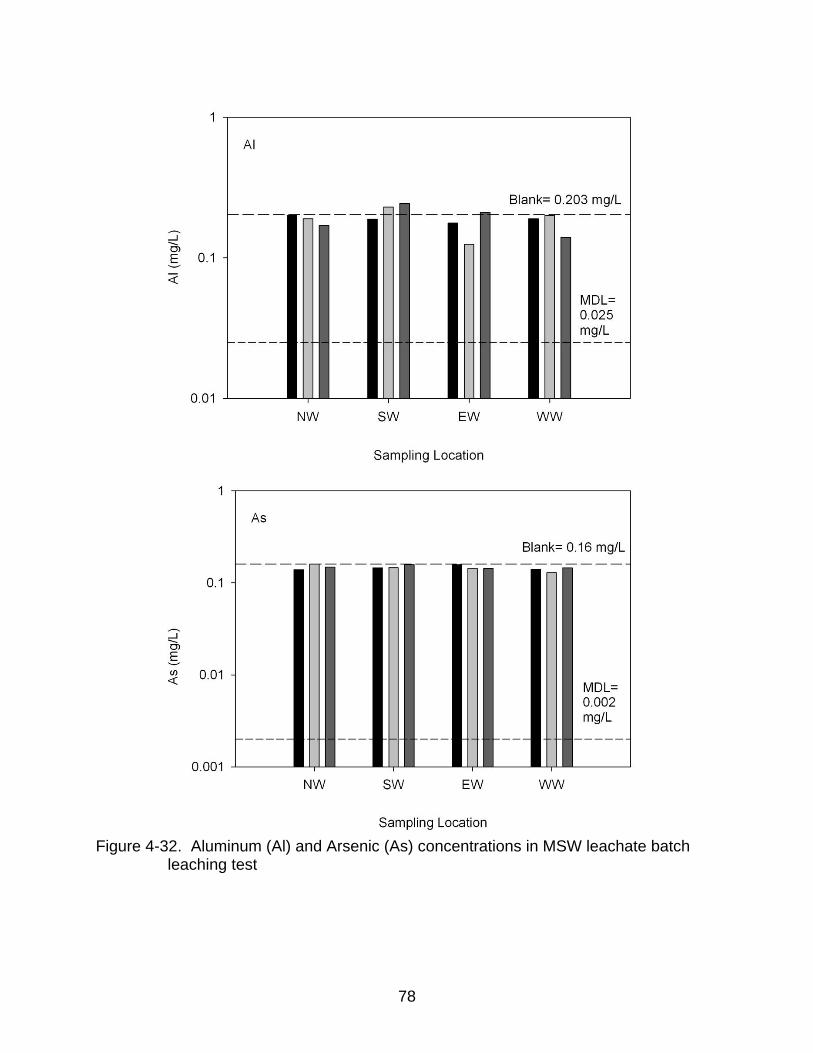
78
Figure 4-32. Aluminum (Al) and Arsenic (As) concentrations in MSW leachate batch
leaching test

79
Figure 4-33. Boron (B) and Barium (Ba) concentrations in MSW leachate batch
leaching test

80
Figure 4-34. Calcium (Ca) and Cobalt (Co) concentrations in MSW leachate batch
leaching test

81
Figure 4-35. Chromium (Cr) and Copper (Cu) concentrations in MSW leachate batch
leaching test

82
Figure 4-36. Iron (Fe) and Potassium (K) concentrations in MSW leachate batch
leaching test

83
Figure 4-37. Magnesium (Mg) and Manganese (Mn) concentrations in MSW leachate
batch leaching test

84
Figure 4-38. Sodium (Na) and Nickel (Ni) concentrations in MSW leachate batch
leaching test

85
Figure 4-39. Antimony (Sb) and Strontium (Sr) concentrations in MSW leachate batch
leaching test

86
Figure 4-40. Vanadium (V) and Zinc (Zn) concentrations in MSW leachate batch
leaching test
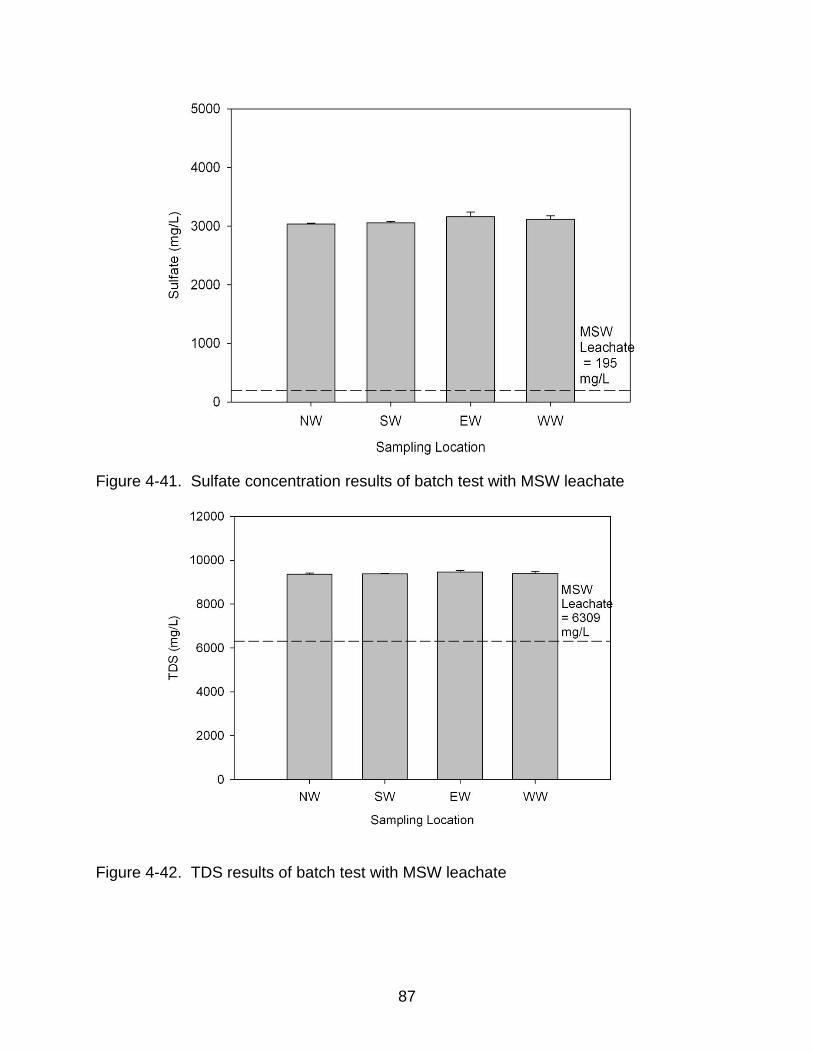
87
Figure 4-41. Sulfate concentration results of batch test with MSW leachate
Figure 4-42. TDS results of batch test with MSW leachate

88
CHAPTER 5 DISCUSSION
5.1 Comparison to Previous Studies
TCLP results found in the previous studies are presented in Table 5-1. In the
present study only barium and chromium were detected above detection limits in TCLP,
and both were below their respective TC limits. Concentrations of these toxic metals
were found below their TC limits in previous studies as well. Mercury was not analyzed
in this study; Kendron (1996) reported mercury concentration in TCLP leaching solution
from PG below its toxicity limit.
Al Masri et al. (2004) conducted leaching of PG (Syrian) using DI water as a first
step of sequential leaching test. In their study they used 1 g PG and 100ml DI water for
leaching (L/S ratio of 100:1). The results of the current DI water leaching test are
compared with the results obtained in the 2004 study for Cd, Zn and U in Table 5-
2.Though Cd was not detected in this study, Zn was leached at a much higher
concentration than the previous study. This may be due to the high L/S ratio (20:1) used
for this study. The bioavailability and mobility of trace metals (As, Cd, Cr, Cu, U, Zn)
were estimated by Al-Hwaiti et al. (2010) using aqua regia leaching solution. Results are
presented in Table 5-3.They used 50 mg of dried PG and 5 ml of nitric acid and
hydrochloric acid (aqua regia) and rotated for 48 hours. All the metals tested leached
below 10% (fraction leached) but the concentrations of all the metals were above
detection limits. In comparison to that study, SPLP performed in this study leached a
higher percentage of Cr, Cu and Zn.
Metal concentrations of PG is compared with gypsum wallboard in Table 5-4
Relative to gypsum wallboard, PG was elevated in total content of Al, As, Ba and K.

89
5.2 Discussion of Leaching Results
Arsenic was detected above SCTL in total metal analysis. But it was not detected
in any of the leaching tests. When metal concentrations extracted by the SPLP are
compared to those of the TCLP, calcium was leached to a greater extent in the TCLP
than in the SPLP; silver, arsenic, boron, cadmium, cobalt, magnesium, lead, antimony,
tin and vanadium were not detected in either test. Barium, chromium, iron and strontium
concentrations in the TCLP leachate were higher than the SPLP leachate, but relatively
similar. Only sodium was dramatically greater in the TCLP compared to the SPLP, but
this was because sodium is used in the TCLP solution. The TCLP and SPLP extracted
statistically similar concentrations of aluminum, copper, potassium, nickel and zinc.
Comparisons of TCLP and SPLP for other wastes have found that TCLP typically
extracts more metals than SPLP because of the buffered pH of the TCLP and the ability
of acetic acid to complex heavy metals. The degree of complexation differs depending
on the metal. Differences in metal leachability between TCLP and SPLP could be result
from several other factors. The initial pH of the SPLP solution (4.2) is less than the initial
pH of the TCLP solution (4.9). Also changes in the solution pH that occur during the 18
hour of leaching may differ between SPLP and TCLP, and thus result in different
amounts of metal leaching. In the case of PG, the pH difference between the two tests
was not very pronounced. The difference in metal concentrations between SPLP and
TCLP for PG are relatively small.
Figures 5-1 through 5-4 compare the average leachate concentrations using
SPLP, TCLP, DI and EPTOX for aluminum, barium, chromium and calcium. For
aluminum, all the tests leached similar concentrations and all of them were above
GWCTL. Barium was below TC limit for all the tests and TCLP leached barium greater

90
than SPLP and EPTOX. While MSW leaching solution leached calcium more than
TCLP, EPTOX and DI showed similar concentrations of calcium.
When the PG samples were leached with DI water, extracted concentrations were
relatively similar to the SPLP except calcium. DI water leached more calcium than
SPLP. The pH of DI water used for this test was greater than the TCLP and SPLP
extraction solutions. The pH is known as a major controlling factor for metal leachability
(Van der Sloot et al. 2001; Townsend, et al. 2004). The solubility of some metals
increased under extreme pH but this may not be applicable for all. For some metals the
change in pH had no effect (Tolaymat et al. 2008; Chuan et al. 1996). For some wastes
like wood, tire ash and wood ash, calcium, potassium and sodium concentrations were
controlled by solubility rather than pH (Tolaymat et al. 2008).This may be the case for
PG also.
The fact that most of the metals (except calcium) leached less in the MSW landfill
leachate relative to TCLP and SPLP is likely a result of the higher pH. Average pH of
leaching solution after 18 hours of agitation was 7.5 and initial pH of MSW leachate was
7.7 (Table 4-7). MSW leachate also leached considerable amount of sulfate from PG.
Under anaerobic landfill conditions, sulfate-reducing bacteria produce hydrogen sulfide
(H2S) from the sulfate (SO4-2) in gypsum and the organic carbon in waste material:
SO4-2 + 2CH2O ---> 2HCO3
-1 + H2S.
Here a simple hydrocarbon is used as a surrogate for organic wastes. This may
cause odor issues and possible health problems for workers.
For MEP some metals showed an increase in concentration in the second
extraction from the first extraction. As a reminder, the first extraction of the MEP was

91
performed using EPTOX extraction fluid (at a pH of 5.0). The subsequent extractions
were performed using a pH 3 synthetic rainwater solution. After first extraction, average
pH of leaching solutions was 4.71 (after 20:1 dilution) and after second extraction, the
pH decreased to 3.39. Studies have demonstrated that as pH decreases, metal
desorption increases; thus, metals are more soluble under acidic conditions, which
could be attributed to the tendency of metals to form soluble metal oxides in acidic
environments. After second extraction metal concentrations decreased with subsequent
extractions as there are less contaminant available for leaching.
5.3 Assessing Potential for Beneficial Reuse
The research presented here provides helpful information for making preliminary
assessments for phosphogypsum uses. Of all the trace elements analyzed in total metal
analysis test, only arsenic (UCL95) was found to exceed its respective SCTL value
(residential exposure). Following typical risk assessment procedures for the state of
Florida, this suggests that PG cannot be land applied in a setting where direct human
exposure might occur. When the SCTLs are utilized to assess risk from land application
of a waste, the waste materials are assumed to be present in a manner where they
replace the soil. In the case of an amendment such as PG, the waste is mixed with soil
and the concentration of chemicals that an individual is exposed to is not only a function
of the PG composition, but also of the background soil concentration and the rate of
application (Tolaymat et al. 2008). Also PG can be used in conjunction with other
materials such as coal ash for soil amendment (Lee et al. 2008). Further study with
mixed materials may explore beneficial use options. One important factor in the use of
phosphogypsum on agricultural lands is the possibility of radioactive element uptake by
plants. Mays and Mortvedt (1986) applied phosphogypsum containing 25 pCi g-1 226Ra

92
at rates up to 112 Mg ha-1 to the surface of a silt loam soil and grew successive crops of
corn, wheat, and soybean. Application of phosphogypsum at a rate of 112 Mg ha-1 had
no effect on the radioactivity levels in grain of corn, wheat, or soybeans. Analyses of soil
after soybean harvest showed that the level of radioactivity in the surface 15-cm layer
increased from 35 Bq kg-1 to 73 Bq kg-1at 112Mg ha-1 PG rate; the radioactivity level in
the subsurface layer was not affected. The 112 Mg ha-1 rate was more than 200 times
the normal rate of gypsum used for peanut fertilization. Additionally, they noted no
increases in grain Cd levels, but at the highest rate they found that corn growth slowed.
They speculated that the slower growth was due to an imbalance of Ca and Mg.
PG leached Al and Fe above GWCTL in SPLP, therefore cannot be reused in
Florida for land application, however, Al and Fe are secondary standards, and the other
leaching tests showed low leachability of heavy metals, so beneficial use possibilities
may exist under different regulatory scenarios. In fact PG can be used to alleviate AI
toxicity(In soil solutions containing abundant SO42- and F-, AI that is not complexed with
either of the ligands) from acid soil due to its precipitation and complexation reactions
with SO42- and F-. The reduction of Al toxicity in the subsoil by PG is a result of complex
set of mechanisms, including precipitation of aluminum as the result of liberation of OH-
ions from oxidic surfaces by ligand exchange with SO42-, formation of insoluble basic Al
sulfates, formation of complexes of Al with F (AlF2+, AlF+2 and AlF3).which are less toxic
than the uncomplexed forms of Al (Carvalho and Raij 1997, Alva and Sumner 1991).
From the leaching tests (TCLP, EPTOX, MSW leaching) it can be said that none of
the toxic metals that were tested in this study leached above TC limits. One potential
beneficial use of PG is its utilization as part of MSW landfill construction and

93
maintenance activities. Other possibilities are using PG as daily and intermediate landfill
cover and landfill foundation. At new landfill sites, compacted PG may be used as a
substitute for the large volume of soil required to be placed under the liner to provide
necessary grades. When MSW leachate contacts with PG, a few constituents of PG
such as calcium and sulfate, may be considerably leached out. PG samples released
considerable amount of calcium in all the leaching tests. Increased calcium
concentration in MSW leachate may enhance scaling in the leachate collection and
removal system. Sulfate also was considered as an easily mobile constituent from PG
to MSW leachate. Increasing sulfate in MSW leachate may be a concern in terms of
odor issues. On the other hand, in an anaerobic environment of landfill, PG could
enhance biodegradation of municipal solid waste (MSW) in the landfill. Since PG is
enriched with sulfate, it is reasonable to assume that a sulfate using bacterial colony
present in landfills will use phosphogypsum as an energy source after oxygen is
depleted. So use of phosphogypsum as landfill cover could enhance biological
decomposition of MSW.
However, if PG is utilized as a base material under a landfill bottom liner, these
issues may not be concerns because the contact of PG with MSW leachate would be
prevented by the landfill liner. However use of PG, in applications where it is in contact
with the MSW (either as cover material or as a direct amendment), needs to balance the
potential benefits (less soil usage, greater stabilization) with the potential deleterious
impacts (odors, impact on biogas collection and conversion systems). Exploration of
these uses was not the main focus of this study. But results of this study can be used
for the feasibility study.

94
5.4 Limitations and Recommendations
In this study, leachability characterization of PG was conducted using only batch
leaching test. For better understanding of PG leachability, dynamic leaching test and
other batch leaching test using different pH solutions and solid liquid ratios could help
evaluate how several test variables can affect leaching behavior of PG. Also leachability
studies could be conducted on PG along with other materials to see how they affect
leachability characteristics of PG.

95
Table 5-1. TCLP results found in the previous studies
Element Regulatory limit (mg/L)
FIPR, 1995 (Kendron)
(mg/L)
FIPR, 2005 (Rusch & Seals)
(mg/L)
In this study (mg/L)
As 5.0 0.882 NDa <0.002
Ba 100 0.17 ND 0.16-0.07
Cd 1.0 0.01 ND <0.001
Cr 5.0 0.05 - 0.04-0.02
Pb 5.0 0.1 ND <0.003
Ag 5.0 0.05 - <0.005
Hg 0.2 0.005 - -
Se 1.0 0.1 ND <0.004 aND = Not detected Table 5-2. Comparisons of DI water leaching test
Element % Fraction leacheda % Fraction leachedb
Cr 10 BDLc U 20 -- Zn 58 82
aAl Masri et al. (2004) bIn this study cBDL = Below detection limit (detection limits are presented in Appendix A) Table 5-3. Comparison of SPLP with previous leaching studies
Element % Fraction leacheda % Fraction leachedb (SPLP)
As 3 BDLc Cd 1 BDL Cr 5 15 Cu 9 21 U 4 -- Zn 3 51
aAl-Hwaiti et al. (2010) bIn this study cBDL = Below detection limit (Detection limits are presented in Appendix A)

96
Table 5-4. Comparison of trace metal concentrations (mg/kg)
Element Gypsum Wallboarda Phosphogypsumb Al 295 756 As -- 1.9 B 42.5 48.5 Ba -- 38.5 Ca 169360 142590 Cd 3.1 BDLc Co 9.2 BDL Cr 11.6 1.6 Cu 7.1 1.9 Fe 942 792 K -- 157 Mg 8475 BDL Mo 2.7 -- Mn 45.6 2.7 Ni 20.1 BDL S 133821 -- Pb 15.6 3 Se -- BDL Zn 16.6 4.3
aR. P. Wolkowski (2000) bIn this study cBDL = below detection limit

97
Figure 5-1. Aluminum (Al) concentrations in different batch leaching tests
Figure 5-2. Barium (Ba) concentrations in different batch leaching tests

98
Figure 5-3. Chromium (Cr) concentrations in different batch leaching tests
Figure 5-4. Calcium (Ca) concentrations in different batch leaching tests
99
CHAPTER 6 CONCLUSION
Phosphate mining in Florida is currently one of the state’s largest industries, and
produces approximately 40 million tons of waste material per year (Burnett et al. 1996).
The total and leachable concentrations in PG were characterized for a number of
metals. These data were then used to examine a variety of issues associated with
determining whether the PG could be beneficially used outside of a landfill (e.g., land
application as fill material, soil amendment).
Metal release was assessed using standardized batch leaching tests and
additional leaching experiments using specific leaching solutions. To identify potential
chemicals of concern, the concentrations of pollutants in the samples were compared
with the risk-based standards. Based on the TCLP test, none of the TCLP results
exceeded the regulatory toxicity limits showing PG samples did not meet the definition
of EPA Toxicity Characteristic under RCRA (40 CFR Part 261.30). Note that Mercury
and radionuclide were not tested in this study. However, in the SPLP tests aluminum
and iron exceeded their respective Florida groundwater cleanup target levels. When
MSW leachate contacts with PG, a few constituents of PG such as calcium and sulfate,
may be considerably leached. Increasing sulfate in MSW leachate may be a concern in
terms of increased hydrogen sulfide generation; hydrogen sulfide carries concerns of
odor and potential deleterious health effects to those exposed. PG samples released
considerable amounts of calcium in the TCLP, SPLP, EPTOX and in the leaching test
with MSW leachate and DI water.
The TCLP and the SPLP extracted relatively similar metal concentrations (except
calcium). Although arsenic was detected at high concentrations in the PG totals

100
analysis, it did not leach at concentrations that may pose a risk to human health and the
environment in all the leaching tests. In terms of risk assessment, from a direct human
exposure pathway, arsenic was found to be the most limiting element. The SPLP results
did not find arsenic to pose a risk, but has aluminum and iron concentrations above
GWCTL.
It is important to examine potential impacts of PG management to the groundwater
because in Florida, over 90% of residents rely on groundwater for a potable water
source. Also the results of this study can assist in the consideration of land application
of PG.

101
APPENDIX A ICP-AES DETECTION LIMITS
Table A-1. Method Detection Limits
Element MDL(mg/L)
Ag 0.005 Al 0.025 As 0.002 B 0.009 Ba 0.002 Be 0.001 Ca 0.07 Cd 0.001 Co 0.001 Cr 0.002 Cu 0.002 Fe 0.06 K 0.06 Mg 0.02 Mn 0.002 Mo 0.004 Na 0.44 Ni 0.002 Pb 0.003 Sb 0.006 Se 0.004 Sn 0.006 Sr 0.002 V 0.002 Zn 0.003
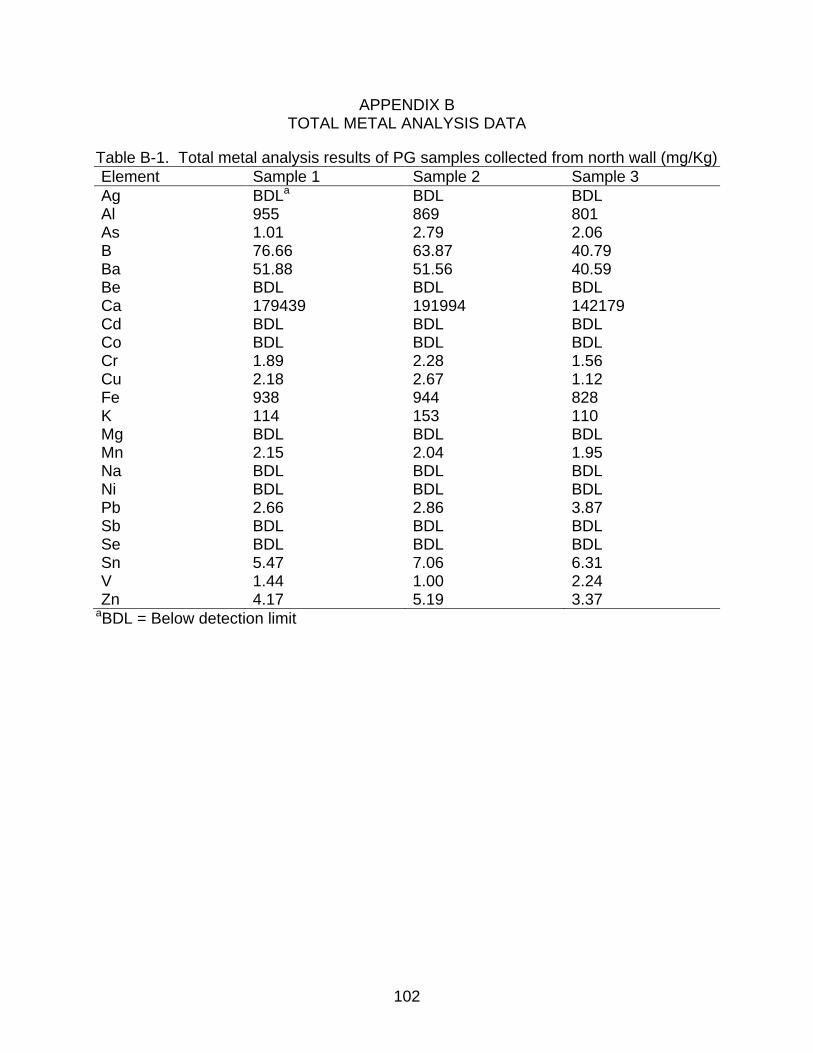
102
APPENDIX B TOTAL METAL ANALYSIS DATA
Table B-1. Total metal analysis results of PG samples collected from north wall (mg/Kg)
Element Sample 1 Sample 2 Sample 3
Ag BDLa BDL BDL Al 955 869 801 As 1.01 2.79 2.06 B 76.66 63.87 40.79 Ba 51.88 51.56 40.59 Be BDL BDL BDL Ca 179439 191994 142179 Cd BDL BDL BDL Co BDL BDL BDL Cr 1.89 2.28 1.56 Cu 2.18 2.67 1.12 Fe 938 944 828 K 114 153 110 Mg BDL BDL BDL Mn 2.15 2.04 1.95 Na BDL BDL BDL Ni BDL BDL BDL Pb 2.66 2.86 3.87 Sb BDL BDL BDL Se BDL BDL BDL Sn 5.47 7.06 6.31 V 1.44 1.00 2.24 Zn 4.17 5.19 3.37
aBDL = Below detection limit

103
Table B-2. Total metal analysis results of PG samples collected from south wall (mg/Kg)
Element Sample 1 Sample 2 Sample 3
Ag BDLa BDL BDL Al 736 683 795 As 1.19 2.07 2.54 B 46.01 58.57 65.78 Ba 32.31 28.63 31.31 Be BDL BDL BDL Ca 152259 126366 136369 Cd BDL BDL BDL Co BDL BDL BDL Cr 1.74 1.2 1.84 Cu 1.47 1.53 2.78 Fe 807 1067 924 K 204 151 206 Mg BDL BDL BDL Mn 3.77 4.56 4.20 Na BDL BDL BDL Ni BDL BDL BDL Pb 3.94 4.14 2.54 Sb BDL BDL BDL Se BDL BDL BDL Sn 3.20 3.21 5.16 V 2.72 1.64 2.62 Zn 5.29 3.78 4.93
aBDL = Below detection limit
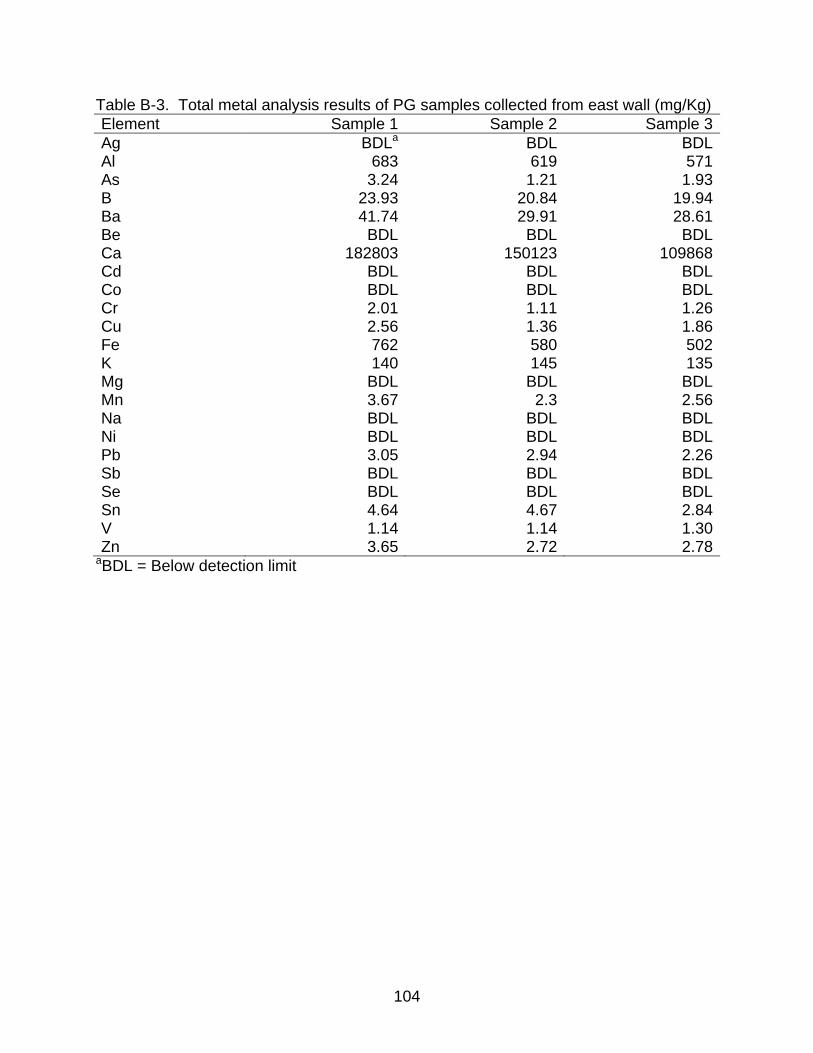
104
Table B-3. Total metal analysis results of PG samples collected from east wall (mg/Kg)
Element Sample 1 Sample 2 Sample 3
Ag BDLa BDL BDL Al 683 619 571 As 3.24 1.21 1.93 B 23.93 20.84 19.94 Ba 41.74 29.91 28.61 Be BDL BDL BDL Ca 182803 150123 109868 Cd BDL BDL BDL Co BDL BDL BDL Cr 2.01 1.11 1.26 Cu 2.56 1.36 1.86 Fe 762 580 502 K 140 145 135 Mg BDL BDL BDL Mn 3.67 2.3 2.56 Na BDL BDL BDL Ni BDL BDL BDL Pb 3.05 2.94 2.26 Sb BDL BDL BDL Se BDL BDL BDL Sn 4.64 4.67 2.84 V 1.14 1.14 1.30 Zn 3.65 2.72 2.78
aBDL = Below detection limit

105
Table B-4. Total metal analysis results of PG samples collected from west wall (mg/Kg)
Element Sample 1 Sample 2 Sample 3
Ag BDLa BDL BDL
Al 788 838 728
As 2.80 1.38 1.00
B 70.95 55.5 39
Ba 43.10 48.26 35.16
Be BDL BDL BDL
Ca 107139 118809 113622
Cd BDL BDL BDL
Co BDL BDL BDL
Cr 1.31 0.9 1.86
Cu 2.58 1.71 1.65
Fe 808 620 725
K 170 206 149
Mg BDL BDL BDL
Mn 2.41 1.35 1.46
Na BDL BDL BDL
Ni BDL BDL BDL
Pb 3.14 1.99 2.96
Sb BDL BDL BDL
Se BDL BDL BDL
Sn 4.19 4.08 3.53
V 1.62 1.19 1.04
Zn 4.3 5.45 6.25 aBDL = Below detection limit
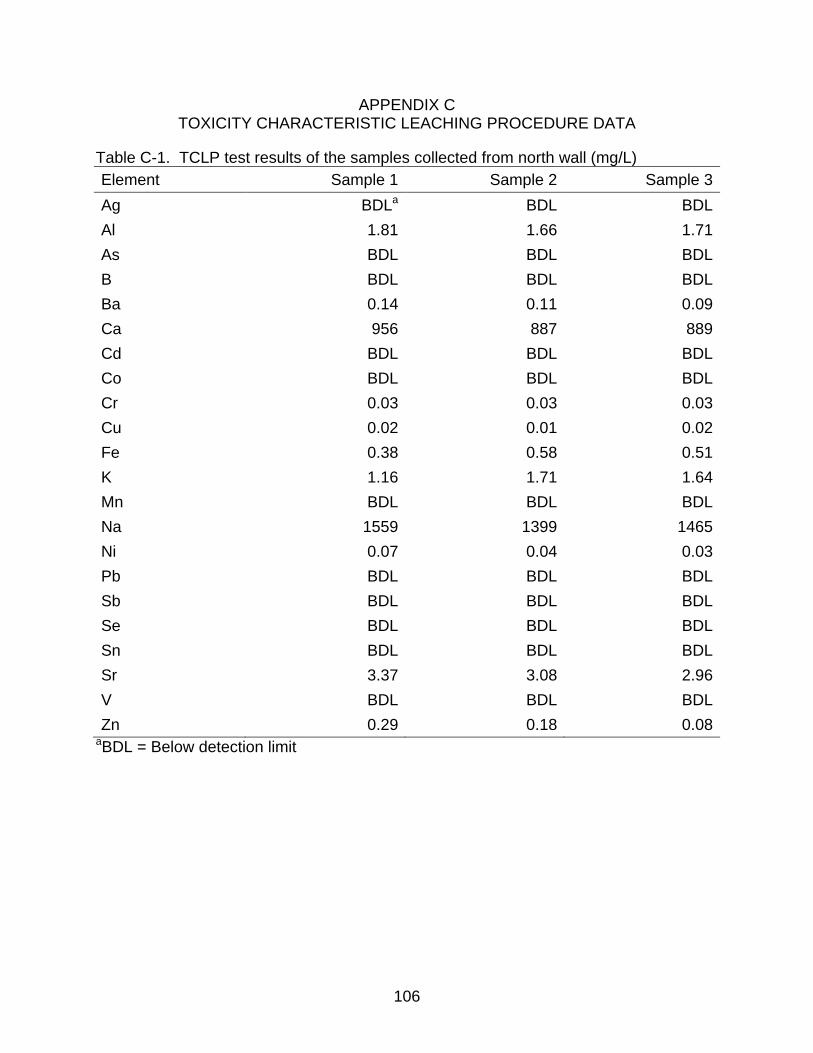
106
APPENDIX C TOXICITY CHARACTERISTIC LEACHING PROCEDURE DATA
Table C-1. TCLP test results of the samples collected from north wall (mg/L)
Element Sample 1 Sample 2 Sample 3
Ag BDLa BDL BDL
Al 1.81 1.66 1.71
As BDL BDL BDL
B BDL BDL BDL
Ba 0.14 0.11 0.09
Ca 956 887 889
Cd BDL BDL BDL
Co BDL BDL BDL
Cr 0.03 0.03 0.03
Cu 0.02 0.01 0.02
Fe 0.38 0.58 0.51
K 1.16 1.71 1.64
Mn BDL BDL BDL
Na 1559 1399 1465
Ni 0.07 0.04 0.03
Pb BDL BDL BDL
Sb BDL BDL BDL
Se BDL BDL BDL
Sn BDL BDL BDL
Sr 3.37 3.08 2.96
V BDL BDL BDL
Zn 0.29 0.18 0.08 aBDL = Below detection limit
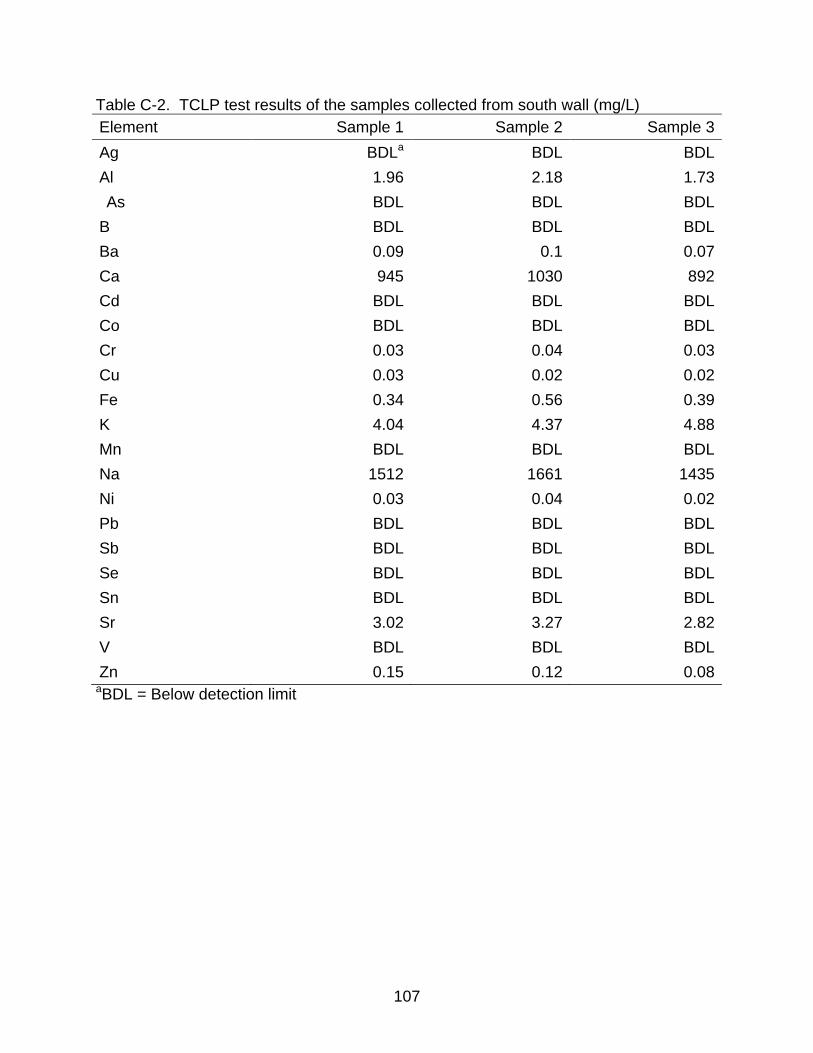
107
Table C-2. TCLP test results of the samples collected from south wall (mg/L)
Element Sample 1 Sample 2 Sample 3
Ag BDLa BDL BDL
Al 1.96 2.18 1.73
As BDL BDL BDL
B BDL BDL BDL
Ba 0.09 0.1 0.07
Ca 945 1030 892
Cd BDL BDL BDL
Co BDL BDL BDL
Cr 0.03 0.04 0.03
Cu 0.03 0.02 0.02
Fe 0.34 0.56 0.39
K 4.04 4.37 4.88
Mn BDL BDL BDL
Na 1512 1661 1435
Ni 0.03 0.04 0.02
Pb BDL BDL BDL
Sb BDL BDL BDL
Se BDL BDL BDL
Sn BDL BDL BDL
Sr 3.02 3.27 2.82
V BDL BDL BDL
Zn 0.15 0.12 0.08 aBDL = Below detection limit

108
Table C-3. TCLP test results of the samples collected from east wall (mg/L)
Element Sample 1 Sample 2 Sample 3
Ag BDLa BDL BDL
Al 1.73 1.69 1.75
As BDL BDL BDL
B BDL BDL BDL
Ba 0.12 0.12 0.09
Ca 948 971 914
Cd BDL BDL BDL
Co BDL BDL BDL
Cr 0.03 0.02 0.02
Cu 0.03 0.06 0.02
Fe 0.57 0.52 0.56
K 1.42 1.95 1.83
Mn BDL BDL BDL
Na 1500 1552 1445
Ni 0.02 0.02 0.02
Pb BDL BDL BDL
Sb BDL BDL BDL
Se BDL BDL BDL
Sn BDL BDL BDL
Sr 3.2 3.25 3.01
V BDL BDL BDL
Zn 0.17 0.15 0.05 aBDL = Below detection limit

109
Table C-4. TCLP test results of the samples collected from west wall (mg/L)
Element Sample 1 Sample 2 Sample 3
Ag BDLa BDL BDL
Al 1.9 2.13 2.08
As BDL BDL BDL
B BDL BDL BDL
Ba 0.12 0.16 0.09
Ca 953 1003 990
Cd BDL BDL BDL
Co BDL BDL BDL
Cr 0.03 0.04 0.04
Cu 0.03 0.02 0.02
Fe 0.54 0.36 0.32
K 1.81 1.09 1.92
Mn BDL BDL BDL
Na 1480 1571 1576
Ni 0.03 0.01 0.03
Pb BDL BDL BDL
Sb BDL BDL BDL
Se BDL BDL BDL
Sn BDL BDL BDL
Sr 3.05 3.17 3.14
V BDL BDL BDL
Zn 0.1 0.26 0.1 aBDL = Below detection limit

110
APPENDIX D SYNTHETIC PRECIPITATION LEACHING PROCEDURE (SPLP) DATA
Table D-1. SPLP test results of the samples collected from north wall (mg/L)
Element Sample 1 Sample 2 Sample 3
Ag BDLa BDL* BDL
Al 2.12 1.79 1.81
As BDL BDL BDL
B BDL BDL BDL
Ba 0.09 0.07 0.08
Be BDL BDL BDL
Ca 697 632 639
Cd BDL BDL BDL
Co BDL BDL BDL
Cr 0.01 0.01 0.02
Cu 0.02 0.01 0.02
Fe 0.38 0.46 0.41
K 1.41 1.37 1.34
Na 9.25 7.53 8.66
Ni 0.02 0.03 0.04
Pb BDL BDL BDL
Sb BDL BDL BDL
Sn BDL BDL BDL
Sr 2.41 2.4 2.42
V BDL BDL BDL
Zn 0.08 0.1 0.13 aBDL = Below Detection Limit

111
Table D-2. SPLP test results of the samples collected from south wall (mg/L)
Element Sample 1 Sample 2 Sample 3
Ag BDLa BDL* BDL
Al 2.12 1.72 1.79
As BDL BDL BDL
B BDL BDL BDL
Ba 0.06 0.05 0.06
Be BDL BDL BDL
Ca 676 521 602
Cd BDL BDL BDL
Co BDL BDL BDL
Cr 0.02 0.01 0.01
Cu 0.02 0.03 0.06
Fe 0.3 0.18 0.22
K 3.3 2.26 2.51
Na 10.08 7.84 8.02
Ni 0.01 0.04 0.03
Pb BDL BDL BDL
Sb BDL BDL BDL
Sn BDL BDL BDL
Sr 2.25 1.7 1.98
V BDL BDL BDL
Zn 0.08 0.09 0.11 aBDL = Below detection limit

112
Table D-3. SPLP test results of the samples collected from east wall (mg/L)
Element Sample 1 Sample 2 Sample 3
Ag BDLa BDL BDL
Al 1.67 1.55 1.5
As BDL BDL BDL
B BDL BDL BDL
Ba 0.13 0.1 0.08
Be BDL BDL BDL
Ca 675 637 628
Cd BDL BDL BDL
Co BDL BDL BDL
Cr 0.01 0.01 0.01
Cu 0.01 0.01 0.01
Fe 0.45 0.31 0.27
K 1.43 1.29 1.38
Na 9.75 8.31 8.98
Ni 0.04 0.02 0.01
Pb BDL BDL BDL
Sb BDL BDL BDL
Sn BDL BDL BDL
Sr 2.42 2.28 2.22
V BDL BDL BDL
Zn 0.21 0.14 0.1 aBDL = Below detection limit
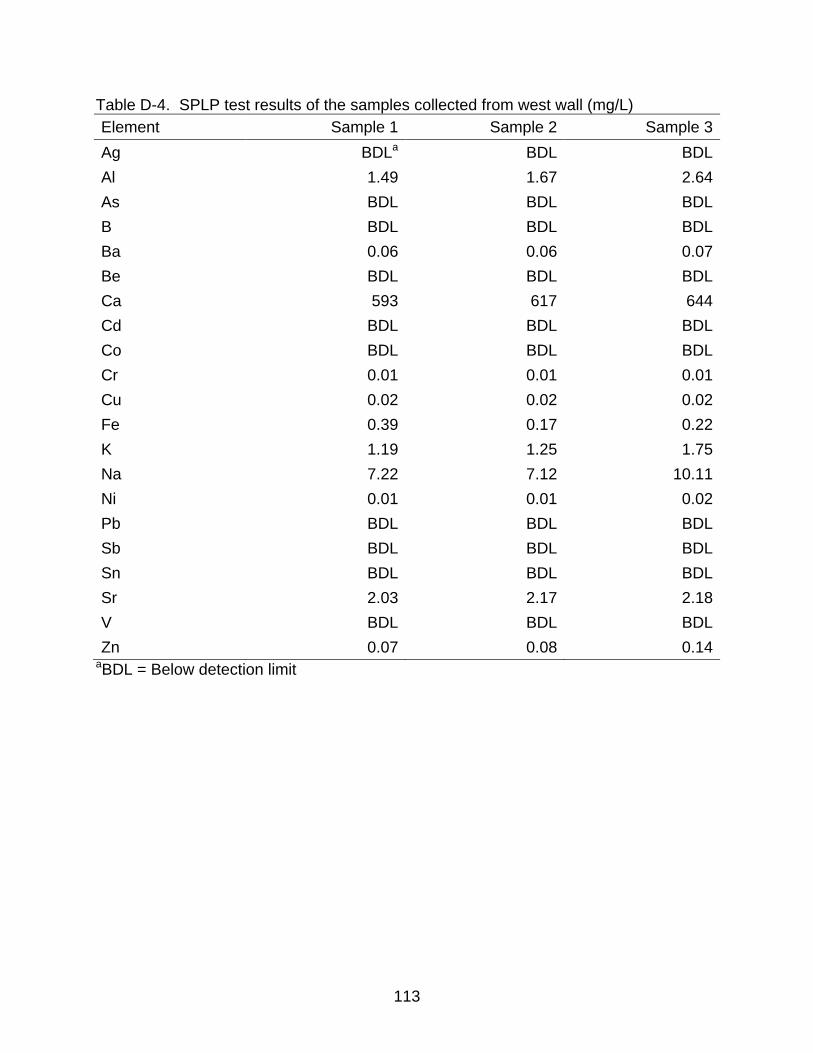
113
Table D-4. SPLP test results of the samples collected from west wall (mg/L)
Element Sample 1 Sample 2 Sample 3
Ag BDLa BDL BDL
Al 1.49 1.67 2.64
As BDL BDL BDL
B BDL BDL BDL
Ba 0.06 0.06 0.07
Be BDL BDL BDL
Ca 593 617 644
Cd BDL BDL BDL
Co BDL BDL BDL
Cr 0.01 0.01 0.01
Cu 0.02 0.02 0.02
Fe 0.39 0.17 0.22
K 1.19 1.25 1.75
Na 7.22 7.12 10.11
Ni 0.01 0.01 0.02
Pb BDL BDL BDL
Sb BDL BDL BDL
Sn BDL BDL BDL
Sr 2.03 2.17 2.18
V BDL BDL BDL
Zn 0.07 0.08 0.14 aBDL = Below detection limit

114
APPENDIX E EXTRACTION PROCEDURE TOXICITY TEST DATA
Table E-1. EPTOX test results of the samples collected from south wall (mg/L)
Element Sample 1 Sample 2 Sample 3
Ag BDLa BDL BDL
Al 1.83 1.73 1.80
As BDL BDL BDL
B BDL BDL BDL
Ba 0.06 0.05 0.05
Be BDL BDL BDL
Ca 752 743 739
Cd BDL BDL BDL
Co BDL BDL BDL
Cr 0.04 0.04 0.04
Cu 0.19 0.12 0.12
Fe BDL BDL BDL
K 3.46 3.12 2.67
Mg 0.71 0.77 0.78
Mn BDL BDL BDL
Ni 0.06 0.06 0.05
Pb BDL BDL BDL
Sb BDL BDL BDL
Se BDL BDL BDL
Sn BDL BDL BDL
Sr 2.34 2.30 2.35
V BDL BDL BDL
Zn 0.26 0.21 0.17 aBDL = Below detection limit
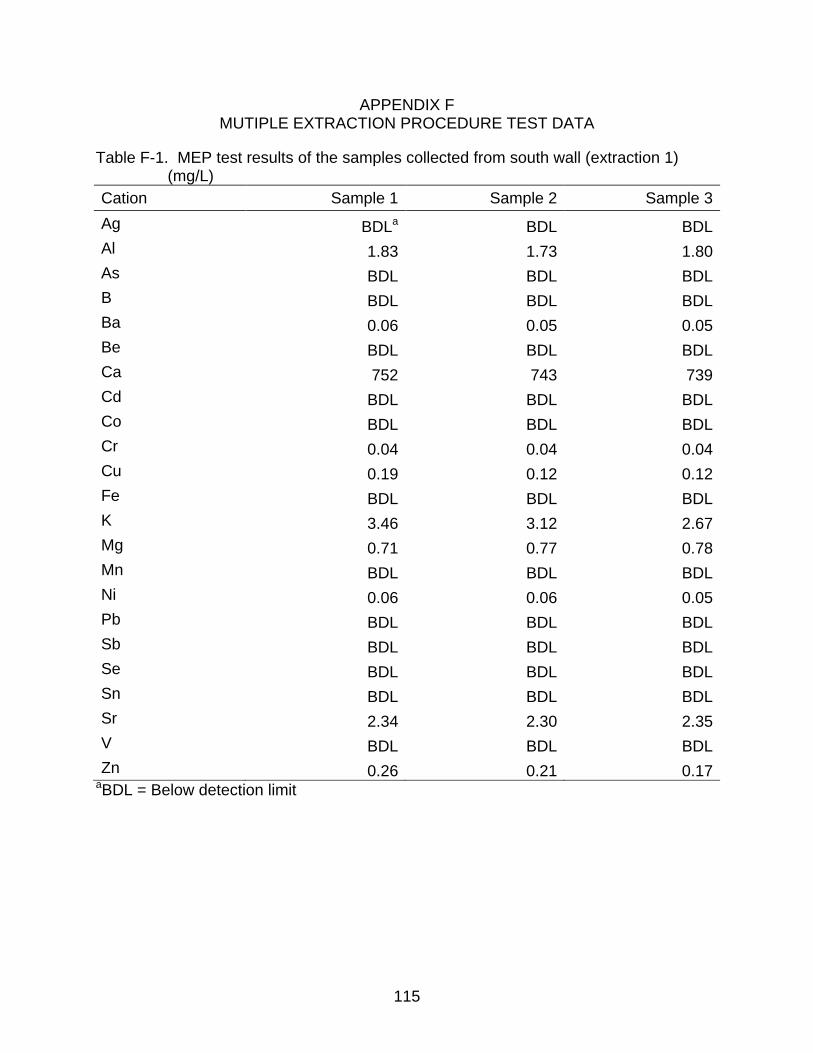
115
APPENDIX F MUTIPLE EXTRACTION PROCEDURE TEST DATA
Table F-1. MEP test results of the samples collected from south wall (extraction 1) (mg/L)
Cation Sample 1 Sample 2 Sample 3
Ag BDLa BDL BDL
Al 1.83 1.73 1.80
As BDL BDL BDL
B BDL BDL BDL
Ba 0.06 0.05 0.05
Be BDL BDL BDL
Ca 752 743 739
Cd BDL BDL BDL
Co BDL BDL BDL
Cr 0.04 0.04 0.04
Cu 0.19 0.12 0.12
Fe BDL BDL BDL
K 3.46 3.12 2.67
Mg 0.71 0.77 0.78
Mn BDL BDL BDL
Ni 0.06 0.06 0.05
Pb BDL BDL BDL
Sb BDL BDL BDL
Se BDL BDL BDL
Sn BDL BDL BDL
Sr 2.34 2.30 2.35
V BDL BDL BDL
Zn 0.26 0.21 0.17 aBDL = Below detection limit

116
Table F-2. MEP test results of the samples collected from south wall (extraction 2) (mg/L)
Cation Sample 1 Sample 2 Sample 3
Ag BDL BDL BDL
Al 2.97 2.81 2.90
As BDL BDL BDL
B BDL BDL BDL
Ba 0.05 0.05 0.05
Be 0.47 0.46 0.46
Ca 813 801 801
Cd BDL BDL BDL
Co BDL BDL BDL
Cr 0.06 0.05 0.05
Cu 0.11 0.11 0.10
Fe BDL BDL BDL
K 2.16 2.87 1.12
Mg 0.75 0.53 0.78
Mn BDL BDL BDL
Ni 0.09 0.09 0.09
Pb BDL BDL BDL
Sb BDL BDL BDL
Se BDL BDL BDL
Sn BDL BDL BDL
Sr 2.39 2.47 2.41
V BDL BDL BDL
Zn 0.49 0.41 0.35
*BDL = Below Detection Limit

117
Table F-3. MEP test results of the samples collected from south wall (extraction 3) (mg/L)
Cation Sample 1 Sample 2 Sample 3
Ag BDLa BDL BDL
Al 2.87 2.75 2.67
As BDL BDL BDL
B BDL BDL BDL
Ba 0.04 0.04 0.04
Be 0.45 0.45 0.45
Ca 786 782 776
Cd BDL BDL BDL
Co BDL BDL BDL
Cr 0.05 0.05 0.05
Cu 0.10 0.10 0.09
Fe BDL BDL BDL
K 0.87 0.76 0.66
Mg 0.65 0.50 0.40
Mn BDL BDL BDL
Ni 0.09 0.09 0.09
Pb BDL BDL BDL
Sb BDL BDL BDL
Se BDL BDL BDL
Sn BDL BDL BDL
Sr 2.44 2.43 2.37
V BDL BDL BDL
Zn 0.34 0.34 0.31 aBDL = Below detection limit

118
Table F-4. MEP test results of the samples collected from south wall (extraction 4) (mg/L)
Cation Sample 1 Sample 2 Sample 3
Ag BDLa BDL BDL
Al 2.65 2.65 2.57
As BDL BDL BDL
B BDL BDL BDL
Ba 0.04 0.04 0.04
Be 0.43 0.43 0.42
Ca 813 801 801
Cd BDL BDL BDL
Co BDL BDL BDL
Cr 0.05 0.05 0.05
Cu 0.09 0.09 0.08
Fe BDL BDL BDL
K BDL BDL BDL
Mg 0.37 0.38 0.34
Mn BDL BDL BDL
Ni 0.09 0.09 0.09
Pb BDL BDL BDL
Sb BDL BDL BDL
Se BDL BDL BDL
Sn BDL BDL BDL
Sr 2.34 2.28 2.28
V BDL BDL BDL
Zn 0.28 0.27 0.27 aBDL = Below detection limit

119
Table F-5. MEP test results of the samples collected from south wall (extraction 5) (mg/L)
Cation Sample 1 Sample 2 Sample 3
Ag BDLa BDL BDL
Al 2.55 2.53 2.50
As BDL BDL BDL
B BDL BDL BDL
Ba 0.04 0.04 0.04
Be 0.39 0.39 0.38
Ca 756 747 737
Cd BDL BDL BDL
Co BDL BDL BDL
Cr 0.05 0.05 0.05
Cu 0.08 0.08 0.08
Fe BDL BDL BDL
K BDL BDL BDL
Mg 0.23 0.21 0.21
Mn BDL BDL BDL
Ni 0.09 0.09 0.09
Pb BDL BDL BDL
Sb BDL BDL BDL
Se BDL BDL BDL
Sn BDL BDL BDL
Sr 2.24 2.23 2.18
V BDL BDL BDL
Zn 0.24 0.21 0.20 aBDL = Below detection limit

120
Table F-6. MEP test results of the samples collected from south wall (extraction 6) (mg/L)
Cation Sample 1 Sample 2 Sample 3
Ag BDLa BDL BDL
Al 2.31 2.30 2.26
As BDL BDL BDL
B BDL BDL BDL
Ba 0.04 0.04 0.04
Be 0.01 0.03 0.02
Ca 734 723 722
Cd BDL BDL BDL
Co BDL BDL BDL
Cr 0.05 0.05 0.04
Cu 0.08 0.07 0.07
Fe BDL BDL BDL
K BDL BDL BDL
Mg BDL BDL BDL
Mn BDL BDL BDL
Ni 0.08 0.08 0.08
Pb BDL BDL BDL
Sb BDL BDL BDL
Se BDL BDL BDL
Sn BDL BDL BDL
Sr 2.14 2.14 2.07
V BDL BDL BDL
Zn 0.19 0.17 0.15 aBDL = Below detection limit
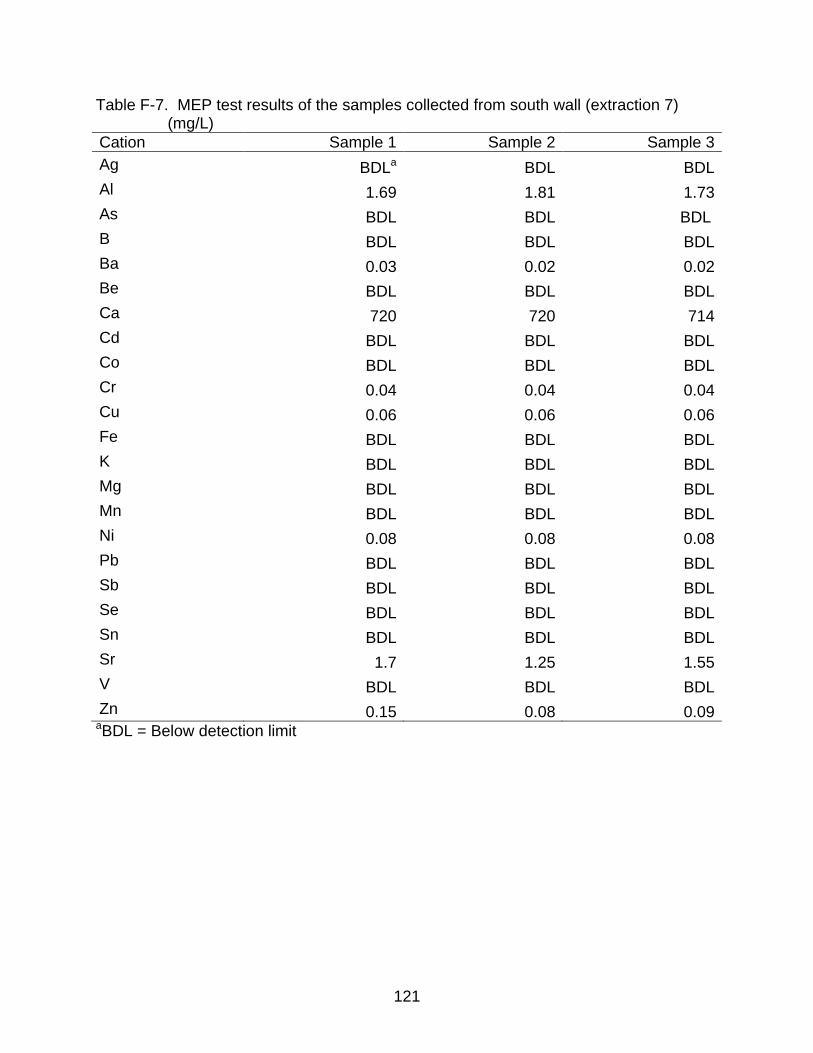
121
Table F-7. MEP test results of the samples collected from south wall (extraction 7) (mg/L)
Cation Sample 1 Sample 2 Sample 3
Ag BDLa BDL BDL
Al 1.69 1.81 1.73
As BDL BDL BDL
B BDL BDL BDL
Ba 0.03 0.02 0.02
Be BDL BDL BDL
Ca 720 720 714
Cd BDL BDL BDL
Co BDL BDL BDL
Cr 0.04 0.04 0.04
Cu 0.06 0.06 0.06
Fe BDL BDL BDL
K BDL BDL BDL
Mg BDL BDL BDL
Mn BDL BDL BDL
Ni 0.08 0.08 0.08
Pb BDL BDL BDL
Sb BDL BDL BDL
Se BDL BDL BDL
Sn BDL BDL BDL
Sr 1.7 1.25 1.55
V BDL BDL BDL
Zn 0.15 0.08 0.09 aBDL = Below detection limit

122
Table F-8. MEP test results of the samples collected from south wall (extraction 8) (mg/L)
Cation Sample 1 Sample 2 Sample 3
Ag BDLa BDL BDL Al BDL BDL BDL As BDL BDL BDL B BDL BDL BDL Ba BDL BDL BDL Be BDL BDL BDL Ca 710 714 706 Cd BDL BDL BDL Co BDL BDL BDL Cr 0.04 0.04 0.04 Cu 0.06 0.06 0.05 Fe BDL BDL BDL K BDL BDL BDL Mg BDL BDL BDL Mn BDL BDL BDL Ni 0.08 0.08 0.08 Pb BDL BDL BDL Sb BDL BDL BDL Se BDL BDL BDL Sn BDL BDL BDL Sr BDL BDL BDL V BDL BDL BDL Zn BDL BDL BDL
aBDL = Below detection limit

123
Table F-9. MEP test results of the samples collected from south wall (extraction 9) (mg/L)
Cation Sample 1 Sample 2 Sample 3
Ag BDLa BDL BDL Al BDL BDL BDL As BDL BDL BDL B BDL BDL BDL Ba BDL BDL BDL Be BDL BDL BDL Ca 705 694 691 Cd BDL BDL BDL Co BDL BDL BDL Cr 0.04 0.04 0.04 Cu 0.05 0.04 0.04 Fe BDL BDL BDL K BDL BDL BDL Mg BDL BDL BDL Mn BDL BDL BDL Ni 0.08 0.08 0.07 Pb BDL BDL BDL Sb BDL BDL BDL Se BDL BDL BDL Sn BDL BDL BDL Sr BDL BDL BDL V BDL BDL BDL Zn BDL BDL BDL
aBDL = Below detection limit

124
APPENDIX G BATCH LEACHING TEST WITH DI WATER
Table G-1. Metal analysis data after batch test of PG with DI water of NW PG samples (mg/L)
Element Sample 1 Sample 2
Ag BDLa BDL Al 1.50 1.45 As BDL BDL B BDL BDL Ba 0.02 0.02 Ca 816 831 Cd BDL BDL Co BDL BDL Cr BDL BDL Cu 0.11 0.10 Fe BDL BDL K 1.55 1.42 Mn BDL BDL Mo 0.09 0.10 Na 11.51 10.79 Ni 0.02 0.02 Pb BDL BDL Sb BDL BDL Se BDL BDL Sn BDL BDL Sr 2.65 2.54 V BDL BDL Zn 0.10 0.11
aBDL = Below detection limit

125
Table G-2. Metal analysis data after batch test of PG with DI water of SW PG samples (mg/L)
Element Sample 1 Sample 2
Ag BDLa BDL Al 1.50 1.39 As BDL BDL B BDL BDL Ba 0.03 0.03 Ca 775 804 Cd BDL BDL Co BDL BDL Cr BDL BDL Cu 0.17 0.14 Fe BDL BDL K 3.45 3.50 Mn BDL BDL Mo 0.04 0.03 Na 9.65 9.32 Ni 0.01 0.02 Pb BDL BDL Sb BDL BDL Se BDL BDL Sn BDL BDL Sr 2.23 2.34 V BDL BDL Zn 0.28 0.18
aBDL = Below detection limit

126
Table G-3. Metal analysis data after batch test of PG with DI water of EW PG samples (mg/L)
Element Sample 1 Sample 2
Ag BDLa BDL Al 1.83 1.94 As BDL BDL B BDL BDL Ba 0.05 0.06 Ca 783 779 Cd BDL BDL Co BDL BDL Cr BDL BDL Cu 0.12 0.11 Fe BDL BDL K 1.32 1.72 Mn BDL BDL Mo 0.02 0.03 Na 9.42 9.97 Ni 0.01 0.01 Pb BDL BDL Sb BDL BDL Se BDL BDL Sn BDL BDL Sr 2.59 2.64 V BDL BDL Zn 0.12 0.1
aBDL = Below detection limit

127
Table G-4. Metal analysis data after batch test of PG with DI water of WW PG samples (mg/L)
Element Sample 1 Sample 2
Ag BDLa BDL Al 1.20 2.21 As BDL BDL B BDL BDL Ba 0.04 0.06 Ca 779 772 Cd BDL BDL Co BDL BDL Cr BDL BDL Cu 0.12 0.09 Fe BDL BDL K 2.07 1.47 Mn BDL BDL Mo 0.06 0.02 Na 9.55 11.33 Ni 0.04 0.01 Pb BDL BDL Sb BDL BDL Se BDL BDL Sn BDL BDL Sr 2.39 2.49 V BDL BDL Zn 0.26 0.29
aBDL = Below detection limit
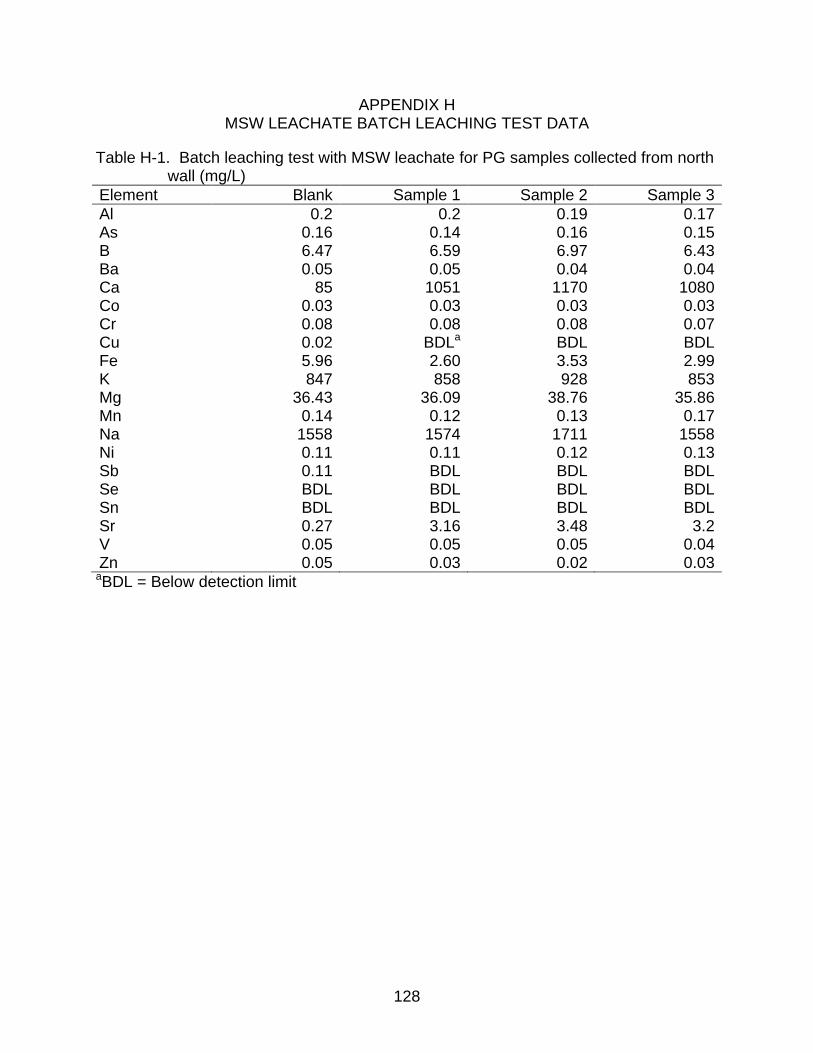
128
APPENDIX H MSW LEACHATE BATCH LEACHING TEST DATA
Table H-1. Batch leaching test with MSW leachate for PG samples collected from north wall (mg/L)
Element Blank Sample 1 Sample 2 Sample 3
Al 0.2 0.2 0.19 0.17 As 0.16 0.14 0.16 0.15 B 6.47 6.59 6.97 6.43 Ba 0.05 0.05 0.04 0.04 Ca 85 1051 1170 1080 Co 0.03 0.03 0.03 0.03 Cr 0.08 0.08 0.08 0.07 Cu 0.02 BDLa BDL BDL Fe 5.96 2.60 3.53 2.99 K 847 858 928 853 Mg 36.43 36.09 38.76 35.86 Mn 0.14 0.12 0.13 0.17 Na 1558 1574 1711 1558 Ni 0.11 0.11 0.12 0.13 Sb 0.11 BDL BDL BDL Se BDL BDL BDL BDL Sn BDL BDL BDL BDL Sr 0.27 3.16 3.48 3.2 V 0.05 0.05 0.05 0.04 Zn 0.05 0.03 0.02 0.03
aBDL = Below detection limit

129
Table H-2. Batch leaching test with MSW leachate for PG samples collected from south wall (mg/L)
Element Blank Sample 1 Sample 2 Sample 3
Al 0.2 0.19 0.23 0.24 As 0.16 0.15 0.15 0.16 B 6.47 6.76 6.93 6.99 Ba 0.05 0.03 0.04 0.04 Ca 85 1061 1175 1217 Co 0.03 0.03 0.03 0.03 Cr 0.08 0.08 0.08 0.08 Cu 0.02 BDLa BDL BDL Fe 5.96 2.57 3.50 3.66 K 847 903 903 933 Mg 36.43 37.2 37.11 38.13 Mn 0.14 0.12 0.12 0.13 Na 1558 1639 1638 1700 Ni 0.11 0.10 0.10 0.12 Sb 0.11 BDL BDL BDL Se BDL BDL BDL BDL Sn BDL BDL BDL BDL Sr 0.27 2.95 3.19 3.32 V 0.05 0.06 0.05 0.05 Zn 0.05 0.03 0.03 0.04
aBDL = Below detection limit

130
Table H-3. Batch leaching test with MSW leachate for PG samples collected from east wall (mg/L)
Element Blank Sample 1 Sample 2 Sample 3
Al 0.2 0.18 0.13 0.21 As 0.16 0.16 0.14 0.14 B 6.47 7.00 6.34 6.37 Ba 0.05 0.06 0.05 0.03 Ca 85 1119 1154 1157 Co 0.03 0.03 0.03 0.03 Cr 0.08 0.08 0.07 0.07 Cu 0.02 BDLa BDL BDL Fe 5.96 2.96 2.74 2.51 K 847 917 869 855 Mg 36.43 37.72 36.06 35.57 Mn 0.14 0.11 0.1 0.1 Na 1558 1670 1577 1550 Ni 0.11 0.11 0.10 0.09 Sb 0.11 BDL BDL BDL Se BDL BDL BDL BDL Sn BDL BDL BDL BDL Sr 0.27 3.32 3.38 3.38 V 0.05 0.05 0.04 0.04 Zn 0.05 0.03 0.03 BDL
aBDL = Below detection limit

131
Table H-4. Batch leaching test with MSW leachate for PG samples collected from west wall (mg/L)
Element Blank Sample 1 Sample 2 Sample 3
Al 0.2 0.19 0.2 0.14 As 0.16 0.14 0.13 0.15 B 6.47 6.79 6.27 6.3 Ba 0.05 0.04 0.06 0.03 Ca 85 1169 1034 903 Co 0.03 0.03 0.02 0.02 Cr 0.08 0.07 0.06 0.07 Cu 0.02 BDLa BDL BDL Fe 5.96 2.62 2.41 2.75 K 847 889 819 816 Mg 36.43 36.9 34.34 34.36 Mn 0.14 0.1 0.09 0.1 Na 1558 1620 1485 1480 Ni 0.11 0.1 0.17 0.12 Sb 0.11 BDL BDL BDL Se BDL BDL BDL BDL Sn BDL BDL BDL BDL Sr 0.27 3.22 2.87 2.56 V 0.05 0.05 0.05 0.05 Zn 0.05 0.04 0.16 0.13
aBDL = Below detection limit
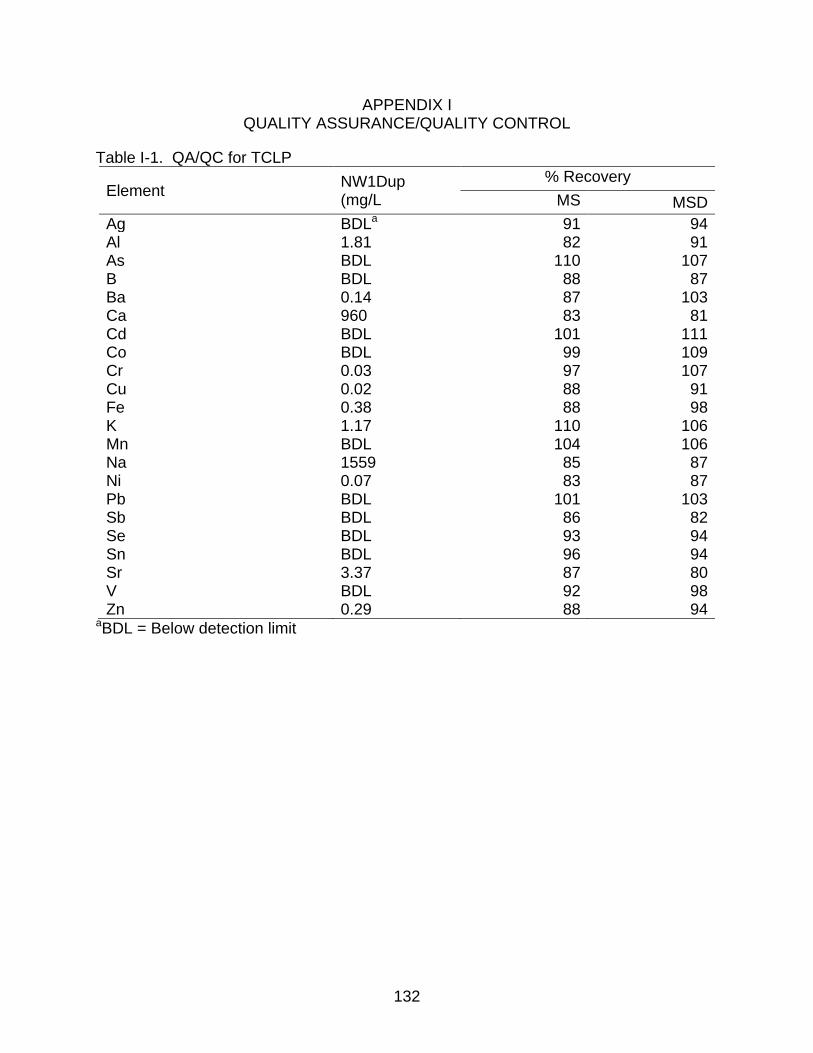
132
APPENDIX I QUALITY ASSURANCE/QUALITY CONTROL
Table I-1. QA/QC for TCLP
Element NW1Dup (mg/L
% Recovery
MS MSD
Ag BDLa 91 94 Al 1.81 82 91 As BDL 110 107 B BDL 88 87 Ba 0.14 87 103 Ca 960 83 81 Cd BDL 101 111 Co BDL 99 109 Cr 0.03 97 107 Cu 0.02 88 91 Fe 0.38 88 98 K 1.17 110 106 Mn BDL 104 106 Na 1559 85 87 Ni 0.07 83 87 Pb BDL 101 103 Sb BDL 86 82 Se BDL 93 94 Sn BDL 96 94 Sr 3.37 87 80 V BDL 92 98 Zn 0.29 88 94
aBDL = Below detection limit

133
Table I-2. QA/QC for SPLP
Element NW1Dup (mg/L
% Recovery
MS MSD
Ag BDLa 104 105 Al 2.2 110 106 As BDL 103 107 B BDL 96 99 Ba 0.09 95 100 Be BDL 93 97 Ca 700 90 95 Cd BDL 95 97 Co BDL 95 99 Cr 0.01 93 98 Cu 0.02 102 108 Fe 0.38 85 84 K 1.41 101 108 Na 9.25 85 94 Ni 0.02 93 98 Pb BDL 97 101 Sb BDL 87 96 Sn BDL 95 102 Sr 2.41 98 100 V BDL 90 91 Zn 0.08 90 97
aBDL = Below detection limit

134
Table I-3. QA/QC for DI water batch leaching test
Element NW1Dup (mg/L
% Recovery
MS MSD
Ag BDLa 97 95 Al 1.50 81 85 As BDL 98 94 B BDL 84 87 Ba 0.023 93 97 Ca 816 104 100 Cd BDL 97 99 Co BDL 87 86 Cr BDL 98 104 Cu 0.11 85 88 Fe BDL 93 95 K 1.55 105 102 Mn BDL 101 99 Mo BDL 100 103 Na 11.51 83 88 Ni 0.018 85 84 Pb BDL 118 110 Sb BDL 95 103 Se BDL 105 105 Sn BDL 101 102 Sr 2.65 100 96 V BDL 85 87 Zn 0.103 94 98
aBDL = Below detection limit

135
Table I-4. QA/QC for MSW batch leaching test
Element NW1Dup (mg/L
% Recovery
MS MSD
Al BDLa 105 103 As 0.14 101 98 B 6.59 100 95 Ba 0.05 91 93 Ca 1051 95 98 Co 0.03 108 104 Cr 0.08 95 98 Cu BDL 104 101 Fe 2.60 98 99 K 858 97 99 Mg 36.1 109 103 Mn 0.12 82 86 Na 1574 87 89 Ni 0.11 100 96 Sb BDL 105 101 Se BDL 94 97 Sn BDL 87 93 Sr 3.16 88 94 V 0.05 94 99 Zn 0.03 95 102
aBDL = Below detection limit

136
Table I-5. QA/QC for EPTOX
Element SW1Dup (mg/L
% Recovery
MS MSD
Ag BDLa 94 99 Al 1.83 87 92 As BDL 102 97 B BDL 98 104 Ba 0.06 99 98 Be BDL 95 98 Ca 752 108 104 Cd BDL 95 98 Co BDL 104 101 Cr 0.04 95 98 Cu 0.19 104 101 Fe BDL 98 99 K 3.46 97 99 Mg 0.71 109 103 Mn BDL 82 86 Ni 0.06 97 99 Pb BDL 87 86 Sb BDL 98 104 Se BDL 85 88 Sn BDL 89 94 Sr 2.34 100 102 V BDL 99 103 Zn 0.26 94 96
aBDL = Below detection limit

137
LIST OF REFERENCES
Al-Hwaiti, M. S., Ranville, J. F., and Ross, P.E. (2010). “Bioavailability and mobility of trace metals in phosphogypsum from Aqaba and Eshidiya, Jordan.” Chemie der Erde, 70, 283–291.
Al-Masri, M. S., Amin, Y., Ibrahim, S., and Al-Bich, F. (2004). “Distribution of some trace metals in Syrian phosphogypsum.” Appl. Geochem., 19, 747–753.
Alva, A. K., and Sumner, M. E. (1991) “Characterization of phytotoxic aluminum in soil solutions from phosphogypsum amended soils”. Water, Air, and Soil Pollution, 57-58, 121-130.
Arman, A., and Seals, R. K. (1990). “A preliminary assessment of utilization alternatives for phosphogypsum.” Proc., Int. Symp. on Phosphogypsum, FIPR, Orlando, FL, 562–575.
Becker, P. (1989). “Phosphates and phosphoric acid: raw materials technology, and economics of the wet process.” Marcel Dekker, New York, 752.
Berish, C. W. (1990). “Potential environmental hazards of phosphogypsum storage in central Florida.” Proc., Int. Symp. on Phosphogypsum, FIPR, Orlando, FL, 1–29.
Brantley, A. S., and Townsend, T. (1999). “Leaching of pollutants from reclaimed asphalt pavement.” Environ. Eng. Sci., 16(2), 105–116.
Burnett, W. C., Schultz, M. K., and Hull, C. D. (1996). “Radionuclide flow during the conversion of phosphogypsum to ammonium sulphate.” J. Environ. Radioactivity, 32, 33–52.
Carvalho, M. C. S., and Raij, B. van. (1997). “Calcium sulphate, phosphogypsum and calcium carbonate in the amelioration of acid subsoils for root growth.”
Plant and Soil, 192, 37–48.
Chang, W. F., Chin, D. A., and Robert, H. (1989). “Phosphogypsum for secondary road construction.” Final Rep., Florida Institute for Phosphate Research, Bartow, FL.
Chuan, M., Shu, G., and Liu, J. (1996). “Solubility of heavy metals in a contaminated soil: effects of redox potential and pH.” Water Air Soil Poll., 90, 543-556.
Federal Register. (1980). 45(98), 33122–33127-33131.
138
Guidry, J. J. (1990). “Environmental impact of airborne radioactivity emissions from a phosphogypsum stack.” Proc., Int. Symp. on Phosphogypsum, FIPR, Orlando, FL, 74–86.
Haridasan, P. P., Maniyan, C. G., Pillai, P. M. B., and Khan, A. H. (2002). “Dissolution characteristics of 226Ra from phosphogypsum.” J. Environ. Radioactivity, 62, 287–294.
Jang, Y., and Townsend, T. (2001). “Occurrences of organic pollutants in recovered soil fines from construction and demolition waste.” Waste Manag., 21, 703–715.
Kördel, W., and Klein, M. (2006). “Prediction of leaching and groundwater contamination by pesticides.” Pure Appl. Chem., 78(5), 1081–1090.
Kendron, T. J. (1996). “Sulfur recovery from phosphogypsum.” Proc., Phosphogypsum Fact Finding Forum, Tallahassee, FL.
Kim, A. G. (2002). “CCB Leaching summary: survey of methods and results.” Proc., Technical Interactive Forum, Coal Combustion By-Products and Western Coal Mines, Golden, CO, 179−195.
Lee, C. H., Ha, B. Y., Lee, Y. B., and Kim, P. J. (2009). “Effect of alkalized phosphogypsum on soil chemical and biological properties.” Comm., Soil Science and Plant Analysis, 40(13/14), 2072-2086.
Lloyd, G. (1985). “Phosphogypsum: a review of the Florida Institute of Phosphate Research programs to develop uses for phosphogypsum.” Final Rep., Florida Institute for Phosphate Research, Bartow, FL.
Luther, S. M., Dudas, M. J., and Rutherford, P. M. (1992). “Radioactivity and chemical characteristics of Alberta phosphogypsum.” Water Air Soil Poll., 69, 277–290.
Luther, S. M., and Dudas, M. J. (1993). “Pore water chemistry of phosphogypsum-treated soil.” J. Environ. Qual., 22, 103–108.
Malan, J. J. (1988). “Utilization of phosphogypsum: structure and achievements of a cooperative research programme.” Proc., Int. Symp. on Phosphogypsum, FIPR, Miami, FL, 131–139.
May, A. (1983). “Use of Florida phosphogypsum in synthetic construction aggregate.” Final Rep., Florida Institute for Phosphate Research, Bartow, FL.

139
May, A., and Sweeney, J. W. (1984a). “Assessment of environmental impacts associated with phosphogypsum in Florida.” The Chemistry and Technology of Gypsum, ASTM Special Technical Publication No. 861, 116–139.
May, A., and Sweeney, J. W. (1984b). “Evaluation of radium and toxic element leaching characteristics of Florida phosphogypsum stockpiles.” The Chemistry and Technology of Gypsum, ASTM Special Technical Publication No. 861, 140–159.
Mays, D. A., and Mortvedt, J. J. (1986). “Crop response to soil applications of phosphogypsum”. J. Environ. Quality, 15, 78–81.
Moussa, D., Crispel, J. J., Legrand, C., and Thenoz, B. (1984). “Laboratory study of the structure and compactibility of Tunisian phosphogypsum (SFAX) for use in embankment construction”, Resour. Conserv., 11 (2), 95–116.
Naff, D. B. (1984). “The classification of phosphogypsum for environmental purposes.” Fertilizer Institute Environmental Symposium, Kissimmee, FL, 373-404.
Nifong, G., and Harris, J. (1993). “Environmental monitoring of Polk and Columbia Counties experimental phosphogypsum roads.” Final Rep., Florida Institute for Phosphate Research, Bartow, FL.
Rouis, M., and Bensalah, A. (1990). “Phosphogypsum management in Tunisia: environmental problems and required solutions.” Proc., Int. Symp. on Phosphogypsum, FIPR, Orlando, FL, 87-105.
Rusch, K. A., and Seals, R. K. (2004). “Development of economically stabilized phosphogypsum composites for saltwater application.” Final Rep., Florida Institute for Phosphate Research, Bartow, FL.
Saylak, D., Gadalla, A. M., and Yung, C. C. (1988). “Strength development in waste industrial gypsum from the dihydrate.” Ind. Eng. Chem. Res., 707-712.
Smith, A., and Wrench, B. (1984). “Aspects of environmental control of phosphogypsum waste disposal.” Proc., Reg. Conf. for Africa on Soil Mechanics and Foundation Engineering, 487-490.
Sposito, G. (1989). “The chemistry of soils.” Oxford Univ. Press, New York.
Stanley, D. (1992). “What a waste! phosphogypsum enriches the soil.” Agricultural Research, 40(10), 12-14.
140
Tolaymat, T., Dubey, B., and Townsend, T. (2008). “Assessing risk posed by land application of ash from the combustion of wood and tires.” J. Residuals Science and Technology, 5(2) .
Townsend, T., Solo-Gabriele, H., Tolaymat, T., and Stook, K. (2003). “Impact of chromated copper arsenate (CCA) in wood mulch.” Science of the Total Environment, 309, 173-185.
Townsend, T., Tolaymat, T., Solo-Gabriele, H., and Dubey, B. (2004). “Leaching of CCA-treated wood: implications for waste disposal.” J. Hazardous Materials, B114, 75–91.
US EPA. <http://www.epa.gov/radiation/neshaps/subpartr/questions_rule.html>.
US EPA. (1992). “Potential uses of Phosphogypsum and associated risks.” Final Rep., United States Environmental Protection Agency.
USGS. (2007). “2007 minerals yearbook.”United States Geological Survey.
USGS. (2002). “Phosphate rock-mineral industry surveys-crop year 2001.” United States Geological Survey.
Van der Sloot, H., Hoede, D., Cresswell, D., and Barton, J. (2001). “Leaching behavior of synthetic aggregates.” Waste Manag., 21: 221–228.
Wolkowski, R. P. (2000). “Land application of crushed gypsum wallboard waste for Alfalfa.” Comm. Soil Sci. Plantanal., 31(1&2), 187-199.
141
BIOGRAPHICAL SKETCH
Shabnam Mostary was born in Cox's Bazar, a city in Bangladesh. She started her
education in Little Jewels School, and continued in Ispahani Public School and College
and Chittagong College. She joined to the Civil Engineering Department at Bangladesh
University of Engineering and Technology (BUET), where she got her B.Sc. Degree in
January 2008. She was accepted into the graduate program in the Department of
Environmental Engineering at University of Florida in August 2009. Her research
interests include water, wastewater and solid and hazardous waste management. She
received her ME from University of Florida in the spring of 2011.