By Rizal Mohd Nor [email protected]
25
Evaluating a Fisheye View of Source Code Mikkel Rønne Jakobsen & Kasper Hornbæk Department of Computing University of Copenhagen Copenhagen East, Denmark [email protected], [email protected] By Rizal Mohd Nor [email protected]
-
Upload
isabella-adrian -
Category
Documents
-
view
43 -
download
5
description
Evaluating a Fisheye View of Source Code Mikkel Rønne Jakobsen & Kasper Hornbæk Department of Computing University of Copenhagen Copenhagen East, Denmark [email protected], [email protected]. By Rizal Mohd Nor [email protected]. Introduction. - PowerPoint PPT Presentation
Transcript of By Rizal Mohd Nor [email protected]

Evaluating a Fisheye View of Source Code
Mikkel Rønne Jakobsen & Kasper HornbækDepartment of ComputingUniversity of Copenhagen
Copenhagen East, [email protected], [email protected]
By Rizal Mohd Nor

Introduction
• Source code grows in size and complexity, navigation becomes mentally demanding.
• Information visualization, previous methods are linear methods, and
• Fisheye views– source code lines are assigned a degree of interest– integrate pertinent information in just one view
• The benefits of applying fisheye views to programming have not been examined empirically.
Authors Contribution
• The author provides an empirical evaluation of the fisheye view that emphasizes usability and analysis of interaction patterns.
• The author suggest potential improvements to the algorithms and user interface design for fisheye view.
Research Questions
1. How to use the display space in the fisheye view, ie. how to handle a large amount of lines with the same high degree of interest?
2. How to establish the user’s focus in the source code, needed to calculate the distance component of the degree of interest function?
3. Whether we can utilize richer information about the program structure, that is, enhancing the degree of interest function beyond using just indentation level.

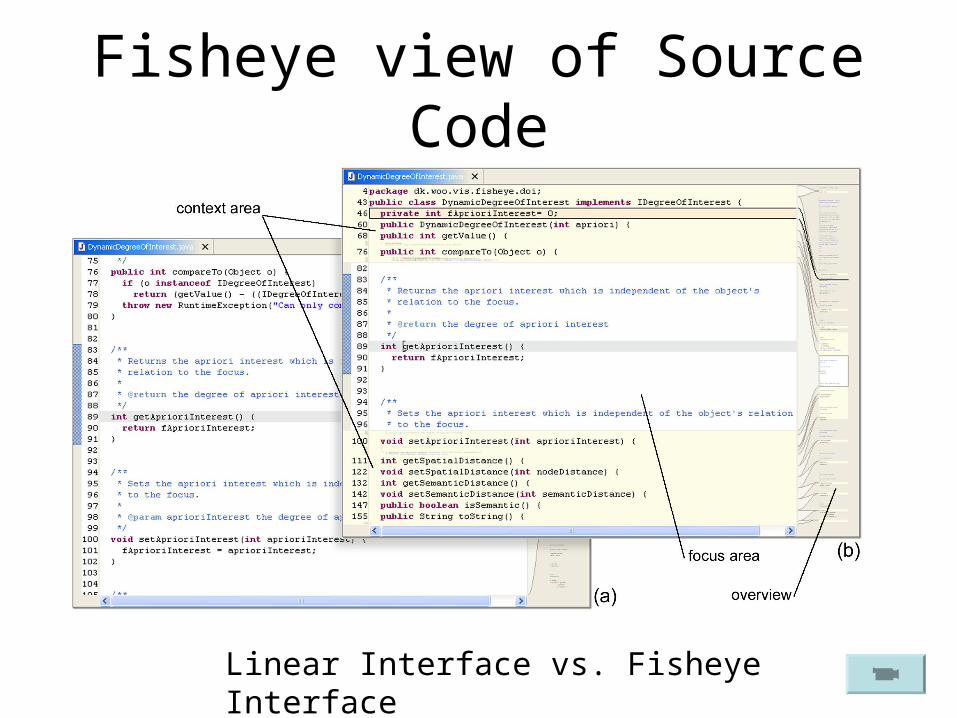
Fisheye view of Source Code
• The fisheye plugin extends the Java editor included in Eclipse’s Java Development Tools.
• The overview shows the source code reduced in size to fit the entire document within the space of the overview area.
• The text is unreadable, but it is possible to discern structural features such as method boundaries and blocks of javadoc comments
Fisheye View Design (1)
• Focus and Context Area– The detail view of the source code is divided into two
areas• the focus area• the context area.
– The editable part of the view, the focus area, is reduced in size to accommodate a context area.
– The context area uses a fixed amount of space above and below the focus area.
Fisheye view of Source Code
Linear Interface vs. Fisheye Interface
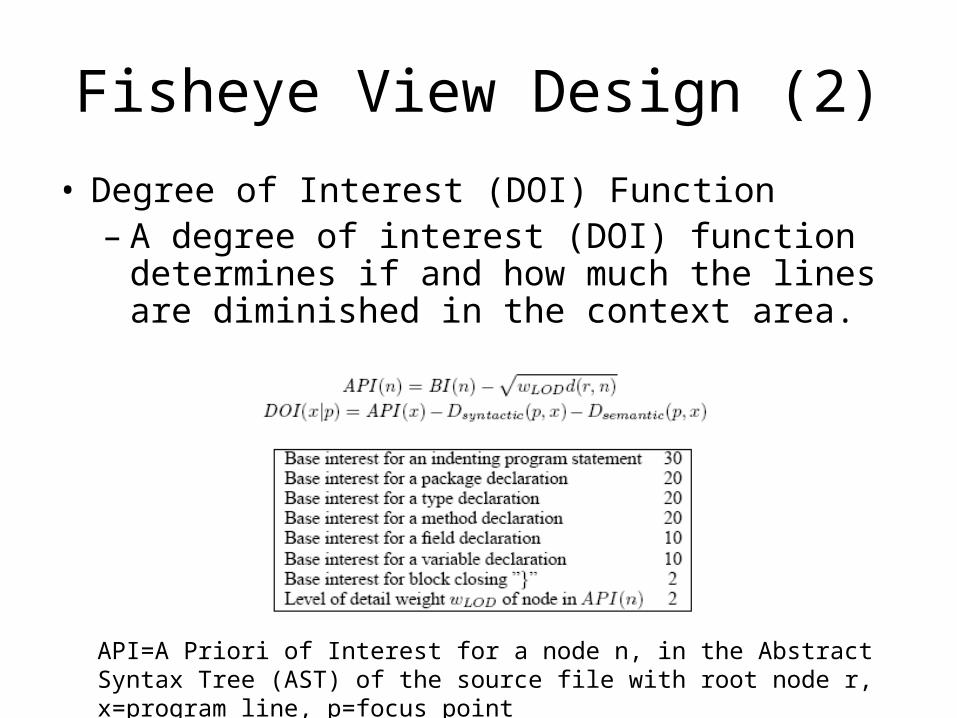
Fisheye View Design (2)
• Degree of Interest (DOI) Function– A degree of interest (DOI) function determines
if and how much the lines are diminished in the context area.
API=A Priori of Interest for a node n, in the Abstract Syntax Tree (AST) of the source file with root node r, x=program line, p=focus point

Fisheye View Design (3)
• Magnification Function– A magnification function prioritizes each
program line according to its degree of interest in order to reduce the size of the least interesting lines.
– Lines with similar degrees of interest are prioritized according to their distance in lines from the focus area, so that lines closest to the focus area are allocated space first.

Fisheye View Design (4)
• User Interaction– The focus area offers the same facilities for
interaction as a normal editor.– By moving, or brushing, the mouse over lines
in the context area, those lines are highlighted in the overview.
– Clicking on a line in the context area centers the focus area around that line and places the caret in the line.
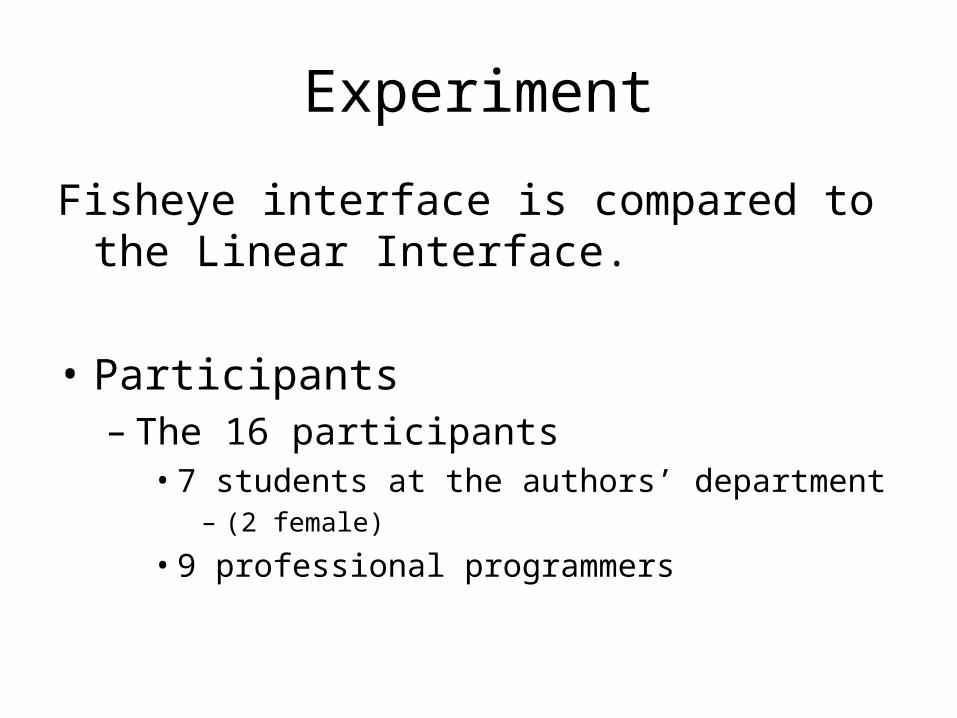
Experiment
Fisheye interface is compared to the Linear Interface.
• Participants– The 16 participants
• 7 students at the authors’ department – (2 female)
• 9 professional programmers

Experiment (Tasks)
• One step navigation task– Finding a call to a specific method– “In the method ‘update’, find the program line with the first call to
method ‘Math.min’?”• Two step navigation task
– Finding the return type of a method call– ”In the method ’hasGreen’, find the return type of the method
that is called last?”• Determine-field-encapsulation
– Determine whether or not two fields are encapsulated, that is, whether the variables are protected from external reference and corresponding get- and set-methods exist.
– ”How many of the fields ’fText’ and fFont’ are encapsulated correctly?”

Experiment
• Determine-delocalization tasks– Determining delocalization in the source code– ”The method ’update’ (line 207–214) contains a total
of 6 method calls. How many of the methods called are declared in this file?”
• Determine-control-structure tasks– the control structure within a single method.– ”In the method ’mergeTermInfos’ (line 201–238), how
many for, while and if/else statements enclose line 233?”
– ”In the method ’renameFile’ (line 225–281), find the line containing the ’}’ that ends the if-block which starts on line 241.”

Experiment (Materials)
• Laptop computer for the experiment with the screen set to a 1024 x 768 resolution with 16-bit color.
• The Eclipse window used all available screen space. • For input, participants used the laptop’s keyboard and an
optical, wireless mouse. • Tasks were presented in a task view in Eclipse next to
the editor view. • Participants typed their answer to the tasks in the task
view and clicked a button to continue, as time is recorded.

Experiment (design)
• A within-subjects experimental design was used• The independent variables being interface type (Fisheye,
Linear) and task type (One-step-navigation, Two-step-navigation, Determine-field-encapsulation, Determine-delocalization, Determine-control-structure).

Experiment (Procedure)
• Participants were given an introduction lasting about 30 minutes.
• After the introduction, a set of nine experimental tasks were performed with each of the two interfaces.
• Finally, questionnaires about the interfaces were administered.
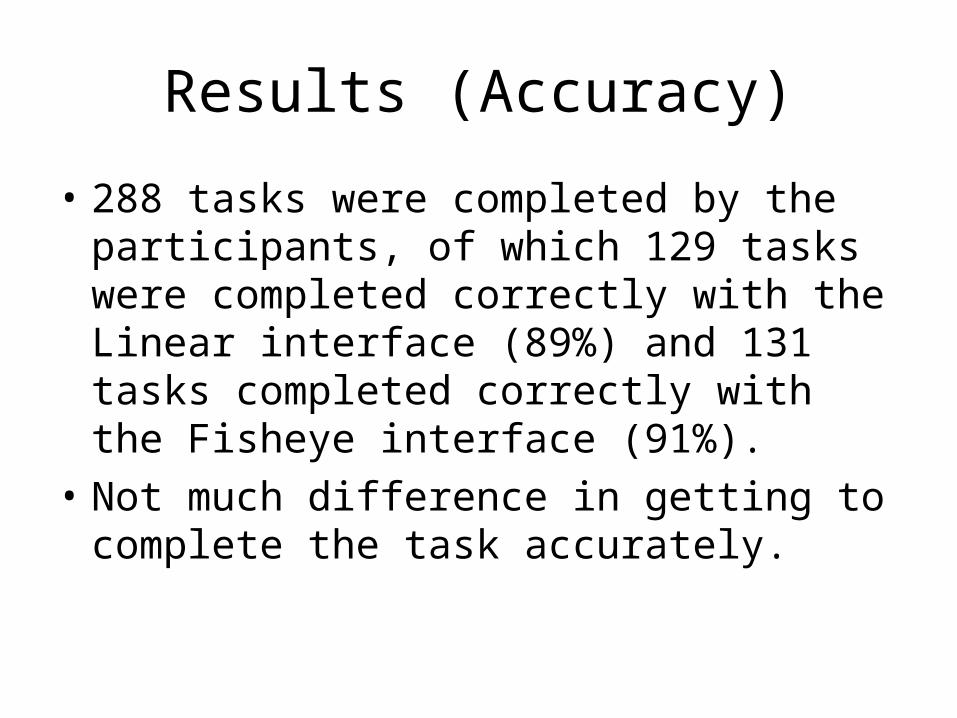
Results (Accuracy)
• 288 tasks were completed by the participants, of which 129 tasks were completed correctly with the Linear interface (89%) and 131 tasks completed correctly with the Fisheye interface (91%).
• Not much difference in getting to complete the task accurately.

Results (Task Completion Times)
• Completion times show no significant difference between the interfaces in one-step-navigation tasks,
• In two-step-navigation tasks, participants used significantly less time with the Fisheye interface compared with the Linear interface, a difference of 18% in average completion time.
• However, the results suggest improvements only when navigating to methods that are visible and highlighted because they are being referenced in the focus area, which occurred in the second step of the two-step-navigation tasks.
Task completion times in seconds. Significantly lower times are shown in bold. (a) N=32, (b) N=16.

Results (Satisfaction)
• Overall, participants preferred the Fisheye interface compared with the Linear interface
• 3 participants mentioned Fisheye interface required more training to use effectively.
• On the scale from confusing to clear, the Fisheye interface to be significantly less clear than the Linear interface
Results (Interaction with Interfaces)
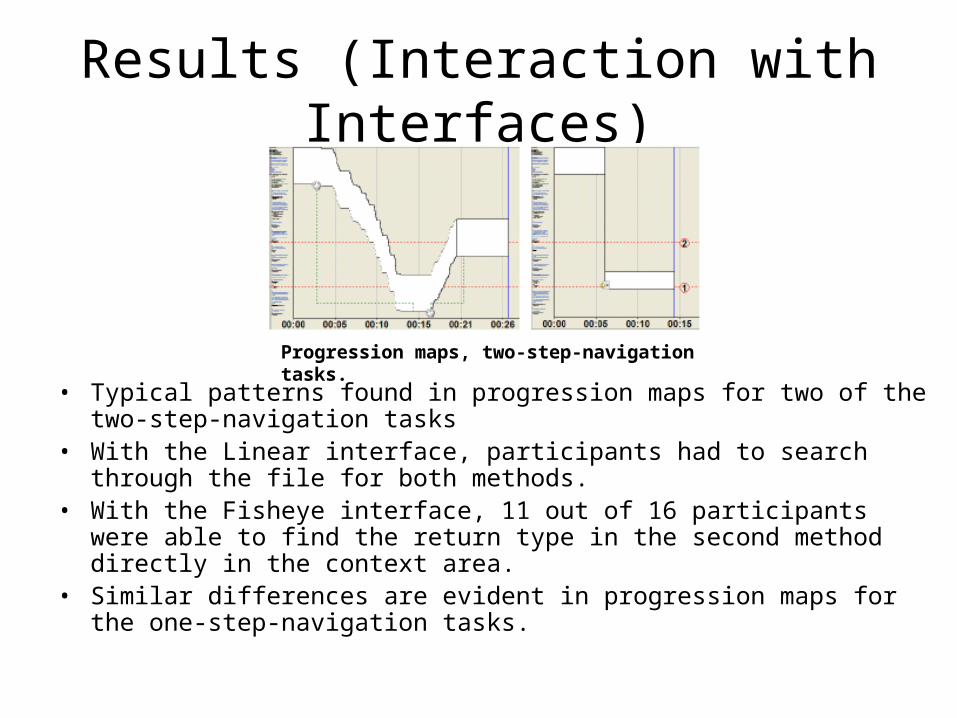
• Typical patterns found in progression maps for two of the two-step-navigation tasks
• With the Linear interface, participants had to search through the file for both methods.
• With the Fisheye interface, 11 out of 16 participants were able to find the return type in the second method directly in the context area.
• Similar differences are evident in progression maps for the one-step-navigation tasks.
Progression maps, two-step-navigation tasks.

Results (Interaction with Interfaces)
• The patterns indicate that participants found places of interest and jumped in the context area in the Fisheye interface, they also needed to scroll to search the methods.
• Analysis of the progression maps does not yield any explanation why participants solved this type of task slower with the Fisheye
• interface, as the task completion time results suggest. • One possible cause is that participants searched more slowly by
scrolling in the Fisheye interface than in the Linear interface.
Progression maps, determine-field-encapsulation tasks.

Results (Interaction with Interfaces)
• Typical interaction patterns can be seen in the representative progression maps for determine-delocalization tasks in left (involving variables) and in the right (involving methods).
• The progression maps for the Fisheye interface show that once participants had navigated to the method, they were able to use the fisheye view’s context area to find the information necessary to complete the tasks.
• In the Fisheye interface, 12 out of the 16 participants completed the tasks with minimal interaction.
Progression maps for determine-delocalization tasks involving variables.
Progression maps, determine-delocalization tasks involving methods.

Results (Interaction with Interfaces)
• The first task. Six out of eight participants using the Fisheye interface continued to scroll the focus area to determine the control structure and answer the task. Figure (b).
• The Fisheye interface thus makes the task of finding the enclosing statements harder for participants.
• The second task, Figure (d), shows a different result.• Seven of eight participants using the Fisheye interface, however,
could determining the control structure using the context area without scrolling any further.
Progression maps for determine-control-structure tasks concerned with counting enclosing statements. The line numbered 1 indicates the program line given in the task, line 2 the farthest line needed to answer the task.

Discussion & Conclusion
• How to use the display space in a fisheye– Propose to have mainly readable text displayed in the context
area. Allows direct use of the information in the context view.
• How to establish the user’s focus point in the source code.– Use a focus area spanning many lines as the focus point gives
the interface stability, because the context view rarely needs updating.
• Whether we can utilize richer information about the program structure.– In establishing the degree-of-interest, the data shows that the
Fisheye interface helped participants to find and navigate to a method, if the method is semantically related to the focus area.

My thoughts
• Similar ideas can be implemented in reading documentation, text and web browsing.
• Put less focus on method declaration and variables, which could also effect performance for a novice programmer.
• Better methods to find degree of interest could be developed, by observing user behavior towards the source code.