By-Right Subdivision Development - Fiscal and Economic ... · By-Right Subdivision Development -...
7
By-Right Subdivision Developm ent - Fiscal and Economic Impact Analysis TABLE OF CO NTENTS Table BRSD-l: Key Demographics, Economic and Development Assumptions Table BRSD-2: Estimated Infrastructure Construction Costs Table BRSD-3: Proposed Development Program Table BRSD-4 : Estimated Residential Gross Market Value at Build-out Table BRSD-5: Estimated Annual Project Based Public Service Costs Table BRSD -6: Net Fiscal Impact Table BRSD-7: Student Generation Calculations Additional fiscal and economic impact analysis data available upon request.
Transcript of By-Right Subdivision Development - Fiscal and Economic ... · By-Right Subdivision Development -...

By-Right Subdivision Development - Fiscal and Economic Impact Analysis
TABLE OF CONTENTS
Table BRSD-l Key Demographics Economic and Development Assumptions
Table BRSD-2 Estimated Infrastructure Construction Costs
Table BRSD-3 Proposed Development Program
Table BRSD-4 Estimated Residential Gross Market Value at Build-out
Table BRSD-5 Estimated Annual Project Based Public Service Costs
Table BRSD-6 Net Fiscal Impact
Table BRSD-7 Student Generation Calculations
Additional fiscal and economic impact analysis data available upon request
By-Right Subdivision Development - Fiscal and Economic Impact Analysis Northumberland County
Table BRSD-2 Estimated Infrastructure Construction Costs
0 1 2 3 4 5 6 7 8 9 ilrastrllctllre Type ]014 2015 201 6 2017 2018 2019 2020 2021 2022 2023 TOTAL
$Shoreline Stabilization Stonnwater Management $
Wastewater Treatment $ 746208 $ 746208 $ 746208 $ 373104 $ 373 ]04 $ 373 104 $ 373104 $ 373104 $ 373104 $ 373104 $ 4850350
Potable Water System $ 451745 $ 225873 $ 225873 $ 225873 $ 225873 $ 225 873 $ 225873 $ 225873 $ 225873 $ 225873 $ 2484600
Roads and Utilities $ 588660 $ 392440 $ 392440 $ 196220 $ 196220 $ 196220 $ 196220 $ 196220 $ 196220 $ 196220 $ 2747080
Total Investment by Year $ 1786613 $ 1364521 $ l364520 $ 795197 $ 795197 $ 795197 $ 795197 $ 795197 $ 795197 $ 795197 $ 10082030 I
SOlree BhdlPoill -Iodings LLC Hall -Iowertoll
By-Right Subdi vision Development - Fi scal and Economic Impact Analysis Northumberland County
Table BRSD-3 Proposed Development Program
7vpe ofProd1 UI1I IS Bwlt RUllI UnU Inblill ProdCI Slat Year JNJrS 10 Absorh Allnu1 Ahwrh 8l1b Avl( Acr~I_OI lOla AcllY AlgFI2 UIIIIarvl Creek Mubifall1lly Gro Build SF96 80~o 77 19 6 8 10 033 3 168 1600j arvlS (Nick Single Family 123200 175 80 140 35 3 10 14 028 49 1500 Cemral Srngle Family 210000 144 80 115 29 5 10 12 028 4032 1500 Bluff 101111 ReilIemiol 172500 34 80 27 7 2 6 5 8 272 2900C f Single Family 783005 80 4 I 9 3 I 10 50 1500 BhllPOlllli ()Jd MII IIIomlly 600012 80 10 2 8 2 5 028 336 1700 SOlllh S ingle Family 17000 70 80 56 14 7 8 7 028 196 1200 67200TOTAL 536 429 107 53 46596 674200
AmenJy kjcriptlon UnIS Unll ofNleawr~ SIan Y~(lr Replacement emr Ini( Nonh Clubhouse ana 1001 SI 8 S 160 Medical Center SF $300 General County Store SF S250C1ltral 1gt001 and f aci litie SF 4 $250 Childer Facility SF 6 $ 160 Recreation Fie ld SF 520000
Source ESRI Business Analyst 2008 Info USA 2008 BJuff Point Holdings LLe Hart Howerton AECOM 2009
By-Right Subdivision Development - Fiscal and Economic Impact Analysis Northumberland County
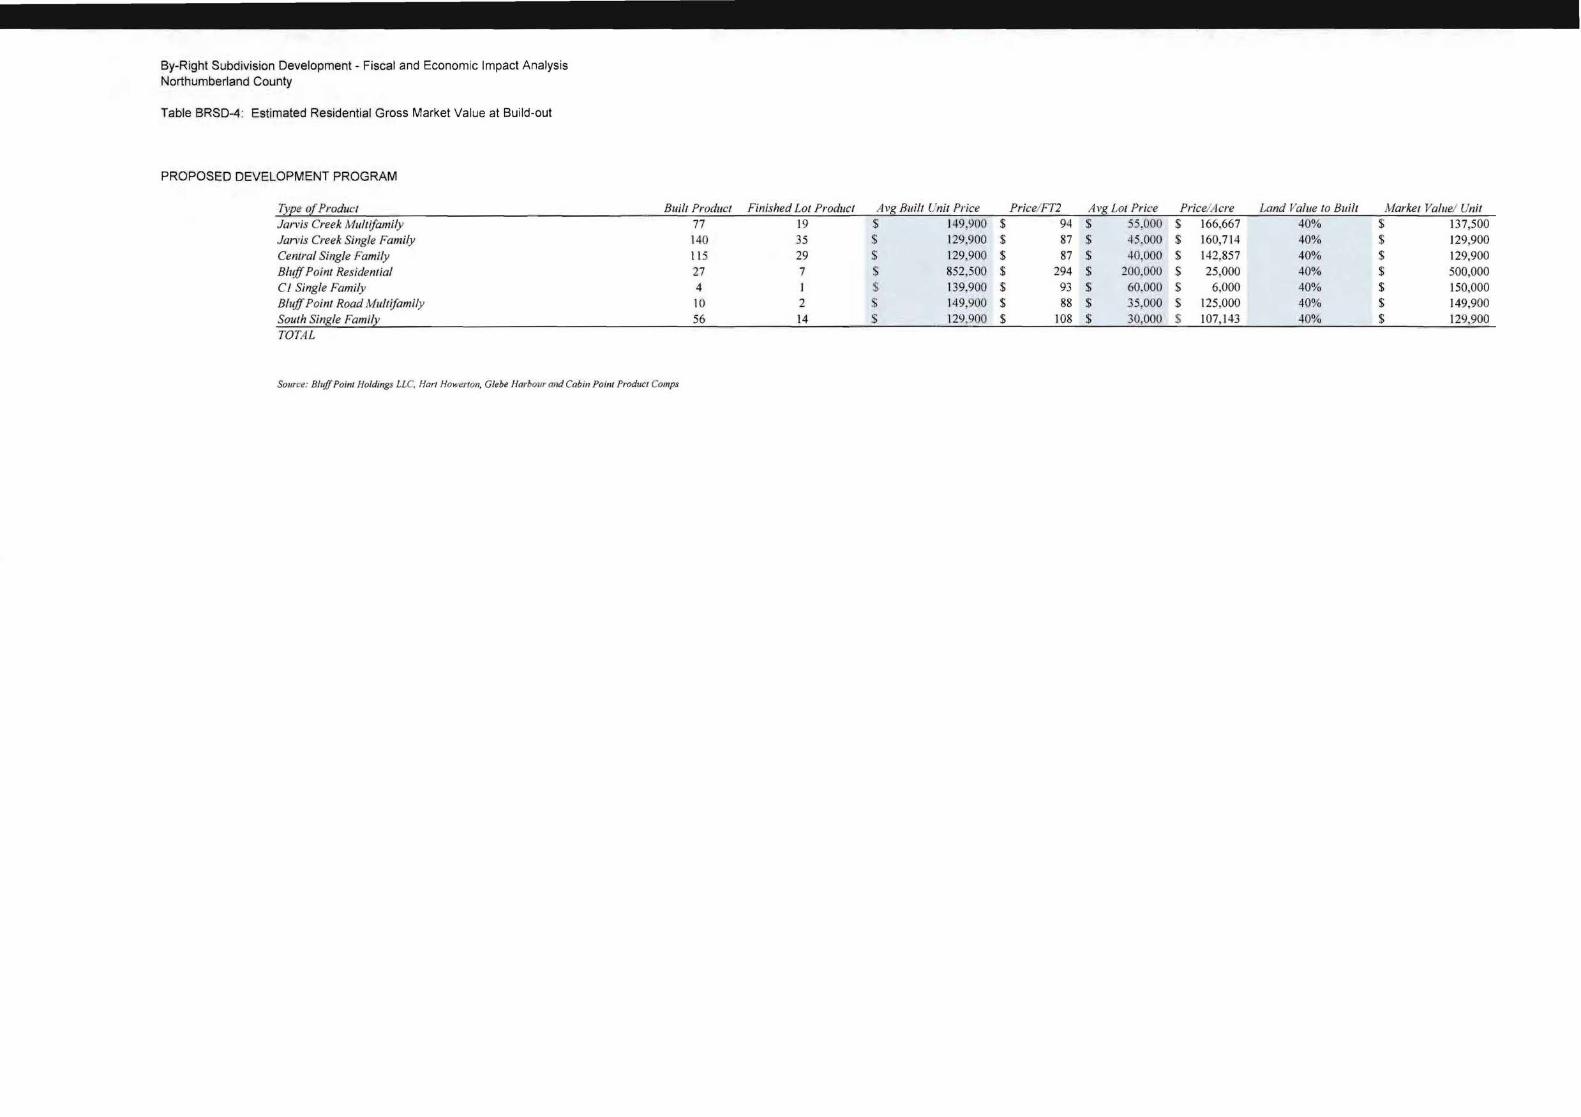
Table BRSD-4 Estimated Residential Gross Market Value at Build-out
PROPOSED DEVELOPMENT PROGRAM
TYee ofPIoduct Jarvis Creek Multifamily Jarvis Creek Single Family Central Single Family BluffPoint Residential Cl Single Family BIffPoint Road Multifamily SoulhSingleFamily TOlA L
Built Product 77 140 115 27 4 10 56
Finished Lo Product 19 35 29 7
2 14
Avg Built Unit Price $ 149900 $ 129900 $ 129900 S 852500 $ 139900 $ 149900 $ 129900
PriceFT2 $ 94 $ 87 $ 87 $ 294 $ 93 $ 88 $ 108
Avg La Price $ 55000 $ 45 000 $ 40000 $ 200000 $ 60000 $ 35000 $ 30000
PriceAcre $ 166667 $ 160714 $ 142857 $ 25000 $ 6000 $ 125000 $ 107143
Land Vallie to Built 40 40 40 40 40 40 40
Market Value Unit $ 137500 $ 129900 $ 129900 $ 500000 $ 150000 $ 149900 $ 129900
Source Bluff Point Holdings LLC Hart Howerton Glebe Harbour alld Cabin Point Product Comps
By-Right Subdivision Development - Fiscal and Economic Impact Analysis Northumberland County
Table BRSD-5 Estimated Annual Project-Based Public Service Costs
0 J 2 3 4 5 6 7 8 9 10 JJ 12 13 14 15 Buildout Year 10]1 201 5 2016 2017 2018 2019 2020 202 1 2022 2023 2024 2025 2026 2027 2028 2029
Cumulathe Residential Population 0 0 4 77 151 233 342 469 6 10 751 879 994 11 09 115 5 1174 1174
Cumulative Employment Generation deg 0 deg 0 I I 6 8 14 14 14 14 14 14 14 14
Total New Residents after Intcrnal Capture 0 0 J 62 121 187 273 375 88 601 703 795 887 924 939 939
Total New Employees after Intcrnal Capture 0 0 0 0 I I 6 8 I I 14 14 14 14 14
Public Service Costs Residential $ 152 S $ S 454 $ 9397 $ 18340 S 28327 S 4 J 511 $ 57008 $ 74 137 $ 9 1267 Ii 106763 S 120764 $ 134764 S 140274 $ 142 587 S 142 587
Commercial $
Fixed Public Service Costs
114 $
$
$
$
$
$
S
$
- $
100000 S
57 S
100000 $
57 $
100000 $
627 $
100000 S
855 $
100000 $
1567 $
100000 $
1567 S
100000 $
1567 S
100 000 $
1567 $
100000 $
I 567 $
100 000 $
1567 $
100000 S
1 567 S
100000 $
1567
100000
Fired and EMS Costs $ - $ - $ S - $ S $ 55000 $ 55000 S 55000 $ 11 0000 S 110000 S 110000 $ 11 0000 $ 165 000 $ 165000 $ 165000
Public Edllcation Costs to County $ Is - 1$ 471 5 I $ 97700 I $ 190684 I $ 2945 14 1$ 43 1586 I $ 592706 I S 770800 I $ 948895 I $ 1 11 0015 I $ 1255574 I $ 140 1 134 I $ 1 458424 I $ 1482m I $ 1482472
Total Varhble Costs to County - - 1169 II (Ir JII 1 42_tll 612 8tlltmiddot 1f4l1 ) or Lmiddotr lmiddotlf 15-1Jtr 1~6~ J(U65 II~ 1(16 ( 119162(
Srwrcl Nurllnmbcrland (utIIlY ESRJ IJlIflJlcJ Anal)H 101raquo5 bfo ltSA 2V08 ImllUte ofl rUR~portalioll Engbtu n Hon IIml Iflon A~COM 2009
By-Right Subdivision Development - Fiscal and Economic Impact Analysis Northumberland County
Table BRSD-6 Net Fiscal Impact
Real Property Taxes $
0 1011
S 2015
$
2 2016
1000 $
3 20J~
18332 S
~
2018 35663 S
5 2019
63128 S
6 2020
97110 S
7 2021
135539 S
8 2022
177566 S
9 2023
219592 S
10 202
258021 S
l 2025
285317 S
12 2026
312613
13 2027
323577 $
-I 2028
328023 S
15 2029
328 O~3
Car and Boat Property Taxes S $ $ ISO S 3 108 S 6066 $ 9369 S 13 730 ~ 18855 $ 24521 30186 S 35312 S 39942 S 44 573 S 46395 $ 47160 S ~7 160
Retail and Commercial Taxes $ S S S 500 $ 3625 S 3625 $ 19625 S 32125 64625 S 64 625 $ 64 625 $ 641)25 S 64625 S 64l25 $ 64 625 S 64625
Subtotal S $ $ 1150 S 21 940 S 45354 S 761 22 $ 130465 $ 186l19 S 266711 314403 S 357958 S 3892884 $ 421810 S 434~97 $ 439808 5 439808
Sales Tax Reve Due to County $ $ $ 1865 $ 34990 S 34990 S 3312 5 S 50 152 S 60245 S 70040 S 71 590 $ 65 245 S 66 395 S 66395 $ 33 271 18843 $ 9750
Total Project Tax Revenuei __ S S $ 3015 $ 56929 $ 80344 S _ j09246 $ 180617 $ 246765 S 336752 $ 3115994 t 423203 _$- 456279 ~ 488205 467867 $ 458651 $ 449558
Total Public Service Costs s s 5169 $ 207097 S 309082 $ 422898 62 8724 $ 805 568 $ 1001505 1251 729 $ 1428346 1587905 S 1747465 S 1865265 $ 1891 626 S 1891 626
Net Fiscal Impact ~ ~ ~ (I SJI) (lIb~~l51 (IU 41)
SOlJra Nhwnbcrland COfllly lJoold ofSj~~()rs f37U RIHlm~middot~ AnaJyu JOCM b(oUSA l OUlJ mlll lllC 0)7raJuponalWII J~gcrrs RujJoim LLC Hart HtJwcn o AhLOM 2009
By-Right Subdivision Development - Fisca l Economic Impact Analysis Table BRSD-7 Student Generation Calculations
Study
I 2
3
Study Type
AECOM Fiscal Impact Analysis - 2009 Method Allocation based on 20tO Northumberland COllllty SllIdent and 2010 Census Data US Bureau ofthe Census Study - 2004
Pupils per Housing Unit
062
0 92 177
314 $5184
Number of Students
194 286 556
Expected Number of Households at Build-out with Children COSIIO County per School Age Child
Student Calcuation 1
Type ofStudent Pupils per flousillg Unit Elementary School 005 Middle School 024 High School 033 Total Per Household 062 Northumberland County residents in the parenting age group (Ages 20 - 49) Source Virginia Department ofEducation 2008 Dividing the 3630 parent age population by the average household size of 224
results in an estimated 1621 households in the County with children Dividing the Fxpected Number of Households at Build-out with Children 314 1474 school children by the 1621 households with children results in an average of Total Number of School Children at Build-out 194 91 children per household that has children
Total Cost to County at Buildout
Student Calculation 2
Northumberland County Schools Composition (2010-2011)
$1005608 Although the majority of households in the BRSD are expected to have children it was assumed that 25 of residences will not have any children Based on this assumption the subdvision is expected to have 286 children at buildout at an annual cost of $1482472 to the County
Type ofSchool Students
High School lvliddle School
Elementary School
431 338 705
TOTAL 1474 Source Virginia Department ofEducation hupsllplpedoe virginiagoWrep0rcardl 2010-20 I J
Demographics by Age Group
Age Rallge Residellts
20 - 24 386 25 - 29 385 30 - 34 564 35 - 39 729 40 - 44 803 45 - 49 763
The number of students residing in the By-Right Subdivision Development has a material impact on the estimated cost of the plan to the County There is no straight forward and simple calcualtion to estimate the number of school children that might reside in the subdivision For this reason three different Pupils per Home calculations were examined providing a range of student counts and costs to the County Calculations 1 and 3 resulted in the lowest and highest student counts and cost respectively Calculation 2 is a mid range estimate and is deemed the most realistic Below is a narrative of Calcuation 2
The BSRD is designed as a lower to middle income housing development with amenities to attract families with children Thus it is expected that mostly families with children will live in this community Using the VA Dept of Education 2010-2011 data there were 1474 school children in Northumberland County with 3630
TOTAL 3630
Northumberland County Households with Children 3630
Northumberland County School-age Children 14 79 Northumberland Counry Residents per Household 224 Northumberland Residences with Children 1621
School-age Children pe r H ousehold Northu mberland County 091 Source Virginia Empoyment Commission 2010 Page 5 hllpAlIwwalex vec virginiagovlnnlpdfslcommunitJprojilesl5 J04000 133pdf
Expected Number of Households at Build-OUl with Children 314 Total Number of School Children at Build-out 286
Total Cost to County at Buildout $1348421
Student Calculation 3
School-Age Children Per Housthold 177
Source US Bureau ofthe Census Study Release 2004 httpwww censusgovlpopulalionsocdemolhh-f am1tabST-Fl-2000pdf
Ex pected Number of Households at Build-out with Children 314 Total Number of School Children at Build-out 556
Totsl Cost to County at Buildout $5106156

By-Right Subdivision Development - Fiscal and Economic Impact Analysis Northumberland County
Table BRSD-2 Estimated Infrastructure Construction Costs
0 1 2 3 4 5 6 7 8 9 ilrastrllctllre Type ]014 2015 201 6 2017 2018 2019 2020 2021 2022 2023 TOTAL
$Shoreline Stabilization Stonnwater Management $
Wastewater Treatment $ 746208 $ 746208 $ 746208 $ 373104 $ 373 ]04 $ 373 104 $ 373104 $ 373104 $ 373104 $ 373104 $ 4850350
Potable Water System $ 451745 $ 225873 $ 225873 $ 225873 $ 225873 $ 225 873 $ 225873 $ 225873 $ 225873 $ 225873 $ 2484600
Roads and Utilities $ 588660 $ 392440 $ 392440 $ 196220 $ 196220 $ 196220 $ 196220 $ 196220 $ 196220 $ 196220 $ 2747080
Total Investment by Year $ 1786613 $ 1364521 $ l364520 $ 795197 $ 795197 $ 795197 $ 795197 $ 795197 $ 795197 $ 795197 $ 10082030 I
SOlree BhdlPoill -Iodings LLC Hall -Iowertoll
By-Right Subdi vision Development - Fi scal and Economic Impact Analysis Northumberland County
Table BRSD-3 Proposed Development Program
7vpe ofProd1 UI1I IS Bwlt RUllI UnU Inblill ProdCI Slat Year JNJrS 10 Absorh Allnu1 Ahwrh 8l1b Avl( Acr~I_OI lOla AcllY AlgFI2 UIIIIarvl Creek Mubifall1lly Gro Build SF96 80~o 77 19 6 8 10 033 3 168 1600j arvlS (Nick Single Family 123200 175 80 140 35 3 10 14 028 49 1500 Cemral Srngle Family 210000 144 80 115 29 5 10 12 028 4032 1500 Bluff 101111 ReilIemiol 172500 34 80 27 7 2 6 5 8 272 2900C f Single Family 783005 80 4 I 9 3 I 10 50 1500 BhllPOlllli ()Jd MII IIIomlly 600012 80 10 2 8 2 5 028 336 1700 SOlllh S ingle Family 17000 70 80 56 14 7 8 7 028 196 1200 67200TOTAL 536 429 107 53 46596 674200
AmenJy kjcriptlon UnIS Unll ofNleawr~ SIan Y~(lr Replacement emr Ini( Nonh Clubhouse ana 1001 SI 8 S 160 Medical Center SF $300 General County Store SF S250C1ltral 1gt001 and f aci litie SF 4 $250 Childer Facility SF 6 $ 160 Recreation Fie ld SF 520000
Source ESRI Business Analyst 2008 Info USA 2008 BJuff Point Holdings LLe Hart Howerton AECOM 2009
By-Right Subdivision Development - Fiscal and Economic Impact Analysis Northumberland County
Table BRSD-4 Estimated Residential Gross Market Value at Build-out
PROPOSED DEVELOPMENT PROGRAM
TYee ofPIoduct Jarvis Creek Multifamily Jarvis Creek Single Family Central Single Family BluffPoint Residential Cl Single Family BIffPoint Road Multifamily SoulhSingleFamily TOlA L
Built Product 77 140 115 27 4 10 56
Finished Lo Product 19 35 29 7
2 14
Avg Built Unit Price $ 149900 $ 129900 $ 129900 S 852500 $ 139900 $ 149900 $ 129900
PriceFT2 $ 94 $ 87 $ 87 $ 294 $ 93 $ 88 $ 108
Avg La Price $ 55000 $ 45 000 $ 40000 $ 200000 $ 60000 $ 35000 $ 30000
PriceAcre $ 166667 $ 160714 $ 142857 $ 25000 $ 6000 $ 125000 $ 107143
Land Vallie to Built 40 40 40 40 40 40 40
Market Value Unit $ 137500 $ 129900 $ 129900 $ 500000 $ 150000 $ 149900 $ 129900
Source Bluff Point Holdings LLC Hart Howerton Glebe Harbour alld Cabin Point Product Comps
By-Right Subdivision Development - Fiscal and Economic Impact Analysis Northumberland County
Table BRSD-5 Estimated Annual Project-Based Public Service Costs
0 J 2 3 4 5 6 7 8 9 10 JJ 12 13 14 15 Buildout Year 10]1 201 5 2016 2017 2018 2019 2020 202 1 2022 2023 2024 2025 2026 2027 2028 2029
Cumulathe Residential Population 0 0 4 77 151 233 342 469 6 10 751 879 994 11 09 115 5 1174 1174
Cumulative Employment Generation deg 0 deg 0 I I 6 8 14 14 14 14 14 14 14 14
Total New Residents after Intcrnal Capture 0 0 J 62 121 187 273 375 88 601 703 795 887 924 939 939
Total New Employees after Intcrnal Capture 0 0 0 0 I I 6 8 I I 14 14 14 14 14
Public Service Costs Residential $ 152 S $ S 454 $ 9397 $ 18340 S 28327 S 4 J 511 $ 57008 $ 74 137 $ 9 1267 Ii 106763 S 120764 $ 134764 S 140274 $ 142 587 S 142 587
Commercial $
Fixed Public Service Costs
114 $
$
$
$
$
$
S
$
- $
100000 S
57 S
100000 $
57 $
100000 $
627 $
100000 S
855 $
100000 $
1567 $
100000 $
1567 S
100000 $
1567 S
100 000 $
1567 $
100000 $
I 567 $
100 000 $
1567 $
100000 S
1 567 S
100000 $
1567
100000
Fired and EMS Costs $ - $ - $ S - $ S $ 55000 $ 55000 S 55000 $ 11 0000 S 110000 S 110000 $ 11 0000 $ 165 000 $ 165000 $ 165000
Public Edllcation Costs to County $ Is - 1$ 471 5 I $ 97700 I $ 190684 I $ 2945 14 1$ 43 1586 I $ 592706 I S 770800 I $ 948895 I $ 1 11 0015 I $ 1255574 I $ 140 1 134 I $ 1 458424 I $ 1482m I $ 1482472
Total Varhble Costs to County - - 1169 II (Ir JII 1 42_tll 612 8tlltmiddot 1f4l1 ) or Lmiddotr lmiddotlf 15-1Jtr 1~6~ J(U65 II~ 1(16 ( 119162(
Srwrcl Nurllnmbcrland (utIIlY ESRJ IJlIflJlcJ Anal)H 101raquo5 bfo ltSA 2V08 ImllUte ofl rUR~portalioll Engbtu n Hon IIml Iflon A~COM 2009
By-Right Subdivision Development - Fiscal and Economic Impact Analysis Northumberland County
Table BRSD-6 Net Fiscal Impact
Real Property Taxes $
0 1011
S 2015
$
2 2016
1000 $
3 20J~
18332 S
~
2018 35663 S
5 2019
63128 S
6 2020
97110 S
7 2021
135539 S
8 2022
177566 S
9 2023
219592 S
10 202
258021 S
l 2025
285317 S
12 2026
312613
13 2027
323577 $
-I 2028
328023 S
15 2029
328 O~3
Car and Boat Property Taxes S $ $ ISO S 3 108 S 6066 $ 9369 S 13 730 ~ 18855 $ 24521 30186 S 35312 S 39942 S 44 573 S 46395 $ 47160 S ~7 160
Retail and Commercial Taxes $ S S S 500 $ 3625 S 3625 $ 19625 S 32125 64625 S 64 625 $ 64 625 $ 641)25 S 64625 S 64l25 $ 64 625 S 64625
Subtotal S $ $ 1150 S 21 940 S 45354 S 761 22 $ 130465 $ 186l19 S 266711 314403 S 357958 S 3892884 $ 421810 S 434~97 $ 439808 5 439808
Sales Tax Reve Due to County $ $ $ 1865 $ 34990 S 34990 S 3312 5 S 50 152 S 60245 S 70040 S 71 590 $ 65 245 S 66 395 S 66395 $ 33 271 18843 $ 9750
Total Project Tax Revenuei __ S S $ 3015 $ 56929 $ 80344 S _ j09246 $ 180617 $ 246765 S 336752 $ 3115994 t 423203 _$- 456279 ~ 488205 467867 $ 458651 $ 449558
Total Public Service Costs s s 5169 $ 207097 S 309082 $ 422898 62 8724 $ 805 568 $ 1001505 1251 729 $ 1428346 1587905 S 1747465 S 1865265 $ 1891 626 S 1891 626
Net Fiscal Impact ~ ~ ~ (I SJI) (lIb~~l51 (IU 41)
SOlJra Nhwnbcrland COfllly lJoold ofSj~~()rs f37U RIHlm~middot~ AnaJyu JOCM b(oUSA l OUlJ mlll lllC 0)7raJuponalWII J~gcrrs RujJoim LLC Hart HtJwcn o AhLOM 2009
By-Right Subdivision Development - Fisca l Economic Impact Analysis Table BRSD-7 Student Generation Calculations
Study
I 2
3
Study Type
AECOM Fiscal Impact Analysis - 2009 Method Allocation based on 20tO Northumberland COllllty SllIdent and 2010 Census Data US Bureau ofthe Census Study - 2004
Pupils per Housing Unit
062
0 92 177
314 $5184
Number of Students
194 286 556
Expected Number of Households at Build-out with Children COSIIO County per School Age Child
Student Calcuation 1
Type ofStudent Pupils per flousillg Unit Elementary School 005 Middle School 024 High School 033 Total Per Household 062 Northumberland County residents in the parenting age group (Ages 20 - 49) Source Virginia Department ofEducation 2008 Dividing the 3630 parent age population by the average household size of 224
results in an estimated 1621 households in the County with children Dividing the Fxpected Number of Households at Build-out with Children 314 1474 school children by the 1621 households with children results in an average of Total Number of School Children at Build-out 194 91 children per household that has children
Total Cost to County at Buildout
Student Calculation 2
Northumberland County Schools Composition (2010-2011)
$1005608 Although the majority of households in the BRSD are expected to have children it was assumed that 25 of residences will not have any children Based on this assumption the subdvision is expected to have 286 children at buildout at an annual cost of $1482472 to the County
Type ofSchool Students
High School lvliddle School
Elementary School
431 338 705
TOTAL 1474 Source Virginia Department ofEducation hupsllplpedoe virginiagoWrep0rcardl 2010-20 I J
Demographics by Age Group
Age Rallge Residellts
20 - 24 386 25 - 29 385 30 - 34 564 35 - 39 729 40 - 44 803 45 - 49 763
The number of students residing in the By-Right Subdivision Development has a material impact on the estimated cost of the plan to the County There is no straight forward and simple calcualtion to estimate the number of school children that might reside in the subdivision For this reason three different Pupils per Home calculations were examined providing a range of student counts and costs to the County Calculations 1 and 3 resulted in the lowest and highest student counts and cost respectively Calculation 2 is a mid range estimate and is deemed the most realistic Below is a narrative of Calcuation 2
The BSRD is designed as a lower to middle income housing development with amenities to attract families with children Thus it is expected that mostly families with children will live in this community Using the VA Dept of Education 2010-2011 data there were 1474 school children in Northumberland County with 3630
TOTAL 3630
Northumberland County Households with Children 3630
Northumberland County School-age Children 14 79 Northumberland Counry Residents per Household 224 Northumberland Residences with Children 1621
School-age Children pe r H ousehold Northu mberland County 091 Source Virginia Empoyment Commission 2010 Page 5 hllpAlIwwalex vec virginiagovlnnlpdfslcommunitJprojilesl5 J04000 133pdf
Expected Number of Households at Build-OUl with Children 314 Total Number of School Children at Build-out 286
Total Cost to County at Buildout $1348421
Student Calculation 3
School-Age Children Per Housthold 177
Source US Bureau ofthe Census Study Release 2004 httpwww censusgovlpopulalionsocdemolhh-f am1tabST-Fl-2000pdf
Ex pected Number of Households at Build-out with Children 314 Total Number of School Children at Build-out 556
Totsl Cost to County at Buildout $5106156
By-Right Subdivision Development - Fiscal and Economic Impact Analysis Northumberland County
Table BRSD-4 Estimated Residential Gross Market Value at Build-out
PROPOSED DEVELOPMENT PROGRAM
TYee ofPIoduct Jarvis Creek Multifamily Jarvis Creek Single Family Central Single Family BluffPoint Residential Cl Single Family BIffPoint Road Multifamily SoulhSingleFamily TOlA L
Built Product 77 140 115 27 4 10 56
Finished Lo Product 19 35 29 7
2 14
Avg Built Unit Price $ 149900 $ 129900 $ 129900 S 852500 $ 139900 $ 149900 $ 129900
PriceFT2 $ 94 $ 87 $ 87 $ 294 $ 93 $ 88 $ 108
Avg La Price $ 55000 $ 45 000 $ 40000 $ 200000 $ 60000 $ 35000 $ 30000
PriceAcre $ 166667 $ 160714 $ 142857 $ 25000 $ 6000 $ 125000 $ 107143
Land Vallie to Built 40 40 40 40 40 40 40
Market Value Unit $ 137500 $ 129900 $ 129900 $ 500000 $ 150000 $ 149900 $ 129900
Source Bluff Point Holdings LLC Hart Howerton Glebe Harbour alld Cabin Point Product Comps
By-Right Subdivision Development - Fiscal and Economic Impact Analysis Northumberland County
Table BRSD-5 Estimated Annual Project-Based Public Service Costs
0 J 2 3 4 5 6 7 8 9 10 JJ 12 13 14 15 Buildout Year 10]1 201 5 2016 2017 2018 2019 2020 202 1 2022 2023 2024 2025 2026 2027 2028 2029
Cumulathe Residential Population 0 0 4 77 151 233 342 469 6 10 751 879 994 11 09 115 5 1174 1174
Cumulative Employment Generation deg 0 deg 0 I I 6 8 14 14 14 14 14 14 14 14
Total New Residents after Intcrnal Capture 0 0 J 62 121 187 273 375 88 601 703 795 887 924 939 939
Total New Employees after Intcrnal Capture 0 0 0 0 I I 6 8 I I 14 14 14 14 14
Public Service Costs Residential $ 152 S $ S 454 $ 9397 $ 18340 S 28327 S 4 J 511 $ 57008 $ 74 137 $ 9 1267 Ii 106763 S 120764 $ 134764 S 140274 $ 142 587 S 142 587
Commercial $
Fixed Public Service Costs
114 $
$
$
$
$
$
S
$
- $
100000 S
57 S
100000 $
57 $
100000 $
627 $
100000 S
855 $
100000 $
1567 $
100000 $
1567 S
100000 $
1567 S
100 000 $
1567 $
100000 $
I 567 $
100 000 $
1567 $
100000 S
1 567 S
100000 $
1567
100000
Fired and EMS Costs $ - $ - $ S - $ S $ 55000 $ 55000 S 55000 $ 11 0000 S 110000 S 110000 $ 11 0000 $ 165 000 $ 165000 $ 165000
Public Edllcation Costs to County $ Is - 1$ 471 5 I $ 97700 I $ 190684 I $ 2945 14 1$ 43 1586 I $ 592706 I S 770800 I $ 948895 I $ 1 11 0015 I $ 1255574 I $ 140 1 134 I $ 1 458424 I $ 1482m I $ 1482472
Total Varhble Costs to County - - 1169 II (Ir JII 1 42_tll 612 8tlltmiddot 1f4l1 ) or Lmiddotr lmiddotlf 15-1Jtr 1~6~ J(U65 II~ 1(16 ( 119162(
Srwrcl Nurllnmbcrland (utIIlY ESRJ IJlIflJlcJ Anal)H 101raquo5 bfo ltSA 2V08 ImllUte ofl rUR~portalioll Engbtu n Hon IIml Iflon A~COM 2009
By-Right Subdivision Development - Fiscal and Economic Impact Analysis Northumberland County
Table BRSD-6 Net Fiscal Impact
Real Property Taxes $
0 1011
S 2015
$
2 2016
1000 $
3 20J~
18332 S
~
2018 35663 S
5 2019
63128 S
6 2020
97110 S
7 2021
135539 S
8 2022
177566 S
9 2023
219592 S
10 202
258021 S
l 2025
285317 S
12 2026
312613
13 2027
323577 $
-I 2028
328023 S
15 2029
328 O~3
Car and Boat Property Taxes S $ $ ISO S 3 108 S 6066 $ 9369 S 13 730 ~ 18855 $ 24521 30186 S 35312 S 39942 S 44 573 S 46395 $ 47160 S ~7 160
Retail and Commercial Taxes $ S S S 500 $ 3625 S 3625 $ 19625 S 32125 64625 S 64 625 $ 64 625 $ 641)25 S 64625 S 64l25 $ 64 625 S 64625
Subtotal S $ $ 1150 S 21 940 S 45354 S 761 22 $ 130465 $ 186l19 S 266711 314403 S 357958 S 3892884 $ 421810 S 434~97 $ 439808 5 439808
Sales Tax Reve Due to County $ $ $ 1865 $ 34990 S 34990 S 3312 5 S 50 152 S 60245 S 70040 S 71 590 $ 65 245 S 66 395 S 66395 $ 33 271 18843 $ 9750
Total Project Tax Revenuei __ S S $ 3015 $ 56929 $ 80344 S _ j09246 $ 180617 $ 246765 S 336752 $ 3115994 t 423203 _$- 456279 ~ 488205 467867 $ 458651 $ 449558
Total Public Service Costs s s 5169 $ 207097 S 309082 $ 422898 62 8724 $ 805 568 $ 1001505 1251 729 $ 1428346 1587905 S 1747465 S 1865265 $ 1891 626 S 1891 626
Net Fiscal Impact ~ ~ ~ (I SJI) (lIb~~l51 (IU 41)
SOlJra Nhwnbcrland COfllly lJoold ofSj~~()rs f37U RIHlm~middot~ AnaJyu JOCM b(oUSA l OUlJ mlll lllC 0)7raJuponalWII J~gcrrs RujJoim LLC Hart HtJwcn o AhLOM 2009
By-Right Subdivision Development - Fisca l Economic Impact Analysis Table BRSD-7 Student Generation Calculations
Study
I 2
3
Study Type
AECOM Fiscal Impact Analysis - 2009 Method Allocation based on 20tO Northumberland COllllty SllIdent and 2010 Census Data US Bureau ofthe Census Study - 2004
Pupils per Housing Unit
062
0 92 177
314 $5184
Number of Students
194 286 556
Expected Number of Households at Build-out with Children COSIIO County per School Age Child
Student Calcuation 1
Type ofStudent Pupils per flousillg Unit Elementary School 005 Middle School 024 High School 033 Total Per Household 062 Northumberland County residents in the parenting age group (Ages 20 - 49) Source Virginia Department ofEducation 2008 Dividing the 3630 parent age population by the average household size of 224
results in an estimated 1621 households in the County with children Dividing the Fxpected Number of Households at Build-out with Children 314 1474 school children by the 1621 households with children results in an average of Total Number of School Children at Build-out 194 91 children per household that has children
Total Cost to County at Buildout
Student Calculation 2
Northumberland County Schools Composition (2010-2011)
$1005608 Although the majority of households in the BRSD are expected to have children it was assumed that 25 of residences will not have any children Based on this assumption the subdvision is expected to have 286 children at buildout at an annual cost of $1482472 to the County
Type ofSchool Students
High School lvliddle School
Elementary School
431 338 705
TOTAL 1474 Source Virginia Department ofEducation hupsllplpedoe virginiagoWrep0rcardl 2010-20 I J
Demographics by Age Group
Age Rallge Residellts
20 - 24 386 25 - 29 385 30 - 34 564 35 - 39 729 40 - 44 803 45 - 49 763
The number of students residing in the By-Right Subdivision Development has a material impact on the estimated cost of the plan to the County There is no straight forward and simple calcualtion to estimate the number of school children that might reside in the subdivision For this reason three different Pupils per Home calculations were examined providing a range of student counts and costs to the County Calculations 1 and 3 resulted in the lowest and highest student counts and cost respectively Calculation 2 is a mid range estimate and is deemed the most realistic Below is a narrative of Calcuation 2
The BSRD is designed as a lower to middle income housing development with amenities to attract families with children Thus it is expected that mostly families with children will live in this community Using the VA Dept of Education 2010-2011 data there were 1474 school children in Northumberland County with 3630
TOTAL 3630
Northumberland County Households with Children 3630
Northumberland County School-age Children 14 79 Northumberland Counry Residents per Household 224 Northumberland Residences with Children 1621
School-age Children pe r H ousehold Northu mberland County 091 Source Virginia Empoyment Commission 2010 Page 5 hllpAlIwwalex vec virginiagovlnnlpdfslcommunitJprojilesl5 J04000 133pdf
Expected Number of Households at Build-OUl with Children 314 Total Number of School Children at Build-out 286
Total Cost to County at Buildout $1348421
Student Calculation 3
School-Age Children Per Housthold 177
Source US Bureau ofthe Census Study Release 2004 httpwww censusgovlpopulalionsocdemolhh-f am1tabST-Fl-2000pdf
Ex pected Number of Households at Build-out with Children 314 Total Number of School Children at Build-out 556
Totsl Cost to County at Buildout $5106156

By-Right Subdivision Development - Fiscal and Economic Impact Analysis Northumberland County
Table BRSD-6 Net Fiscal Impact
Real Property Taxes $
0 1011
S 2015
$
2 2016
1000 $
3 20J~
18332 S
~
2018 35663 S
5 2019
63128 S
6 2020
97110 S
7 2021
135539 S
8 2022
177566 S
9 2023
219592 S
10 202
258021 S
l 2025
285317 S
12 2026
312613
13 2027
323577 $
-I 2028
328023 S
15 2029
328 O~3
Car and Boat Property Taxes S $ $ ISO S 3 108 S 6066 $ 9369 S 13 730 ~ 18855 $ 24521 30186 S 35312 S 39942 S 44 573 S 46395 $ 47160 S ~7 160
Retail and Commercial Taxes $ S S S 500 $ 3625 S 3625 $ 19625 S 32125 64625 S 64 625 $ 64 625 $ 641)25 S 64625 S 64l25 $ 64 625 S 64625
Subtotal S $ $ 1150 S 21 940 S 45354 S 761 22 $ 130465 $ 186l19 S 266711 314403 S 357958 S 3892884 $ 421810 S 434~97 $ 439808 5 439808
Sales Tax Reve Due to County $ $ $ 1865 $ 34990 S 34990 S 3312 5 S 50 152 S 60245 S 70040 S 71 590 $ 65 245 S 66 395 S 66395 $ 33 271 18843 $ 9750
Total Project Tax Revenuei __ S S $ 3015 $ 56929 $ 80344 S _ j09246 $ 180617 $ 246765 S 336752 $ 3115994 t 423203 _$- 456279 ~ 488205 467867 $ 458651 $ 449558
Total Public Service Costs s s 5169 $ 207097 S 309082 $ 422898 62 8724 $ 805 568 $ 1001505 1251 729 $ 1428346 1587905 S 1747465 S 1865265 $ 1891 626 S 1891 626
Net Fiscal Impact ~ ~ ~ (I SJI) (lIb~~l51 (IU 41)
SOlJra Nhwnbcrland COfllly lJoold ofSj~~()rs f37U RIHlm~middot~ AnaJyu JOCM b(oUSA l OUlJ mlll lllC 0)7raJuponalWII J~gcrrs RujJoim LLC Hart HtJwcn o AhLOM 2009
By-Right Subdivision Development - Fisca l Economic Impact Analysis Table BRSD-7 Student Generation Calculations
Study
I 2
3
Study Type
AECOM Fiscal Impact Analysis - 2009 Method Allocation based on 20tO Northumberland COllllty SllIdent and 2010 Census Data US Bureau ofthe Census Study - 2004
Pupils per Housing Unit
062
0 92 177
314 $5184
Number of Students
194 286 556
Expected Number of Households at Build-out with Children COSIIO County per School Age Child
Student Calcuation 1
Type ofStudent Pupils per flousillg Unit Elementary School 005 Middle School 024 High School 033 Total Per Household 062 Northumberland County residents in the parenting age group (Ages 20 - 49) Source Virginia Department ofEducation 2008 Dividing the 3630 parent age population by the average household size of 224
results in an estimated 1621 households in the County with children Dividing the Fxpected Number of Households at Build-out with Children 314 1474 school children by the 1621 households with children results in an average of Total Number of School Children at Build-out 194 91 children per household that has children
Total Cost to County at Buildout
Student Calculation 2
Northumberland County Schools Composition (2010-2011)
$1005608 Although the majority of households in the BRSD are expected to have children it was assumed that 25 of residences will not have any children Based on this assumption the subdvision is expected to have 286 children at buildout at an annual cost of $1482472 to the County
Type ofSchool Students
High School lvliddle School
Elementary School
431 338 705
TOTAL 1474 Source Virginia Department ofEducation hupsllplpedoe virginiagoWrep0rcardl 2010-20 I J
Demographics by Age Group
Age Rallge Residellts
20 - 24 386 25 - 29 385 30 - 34 564 35 - 39 729 40 - 44 803 45 - 49 763
The number of students residing in the By-Right Subdivision Development has a material impact on the estimated cost of the plan to the County There is no straight forward and simple calcualtion to estimate the number of school children that might reside in the subdivision For this reason three different Pupils per Home calculations were examined providing a range of student counts and costs to the County Calculations 1 and 3 resulted in the lowest and highest student counts and cost respectively Calculation 2 is a mid range estimate and is deemed the most realistic Below is a narrative of Calcuation 2
The BSRD is designed as a lower to middle income housing development with amenities to attract families with children Thus it is expected that mostly families with children will live in this community Using the VA Dept of Education 2010-2011 data there were 1474 school children in Northumberland County with 3630
TOTAL 3630
Northumberland County Households with Children 3630
Northumberland County School-age Children 14 79 Northumberland Counry Residents per Household 224 Northumberland Residences with Children 1621
School-age Children pe r H ousehold Northu mberland County 091 Source Virginia Empoyment Commission 2010 Page 5 hllpAlIwwalex vec virginiagovlnnlpdfslcommunitJprojilesl5 J04000 133pdf
Expected Number of Households at Build-OUl with Children 314 Total Number of School Children at Build-out 286
Total Cost to County at Buildout $1348421
Student Calculation 3
School-Age Children Per Housthold 177
Source US Bureau ofthe Census Study Release 2004 httpwww censusgovlpopulalionsocdemolhh-f am1tabST-Fl-2000pdf
Ex pected Number of Households at Build-out with Children 314 Total Number of School Children at Build-out 556
Totsl Cost to County at Buildout $5106156