By Osadebamwen Anthony Ogbeide BSc, MSc Agribusiness. MBA · 2014. 7. 10. · Organic Wine and the...
259
Consumer Willingness to Pay Premiums for the Benefits of Organic Wine and the Expert Service of Wine Retailers By Osadebamwen Anthony Ogbeide BSc, MSc Agribusiness. MBA A thesis submitted in fulfilment of the requirements for the Degree of Doctor of Philosophy School of Agriculture, Food and Wine Faculty of Science The University of Adelaide December 2013
Transcript of By Osadebamwen Anthony Ogbeide BSc, MSc Agribusiness. MBA · 2014. 7. 10. · Organic Wine and the...

Consumer Willingness to Pay Premiums for the Benefits of
Organic Wine and the Expert Service of Wine Retailers
By
Osadebamwen Anthony Ogbeide
BSc, MSc Agribusiness. MBA
A thesis submitted in fulfilment of the requirements for the
Degree of Doctor of Philosophy
School of Agriculture, Food and Wine
Faculty of Science
The University of Adelaide
December 2013

ii
Dedication
This doctoral research effort is dedicated to my late father, Anointed Elder Jacob
Omoruyi Ogbeide, who paved the way for me to take hold of every opportunity that has come
my way and to my family, who have endured sacrifice and hardship over time to ensure this
successful outcome.

iii
Acknowledgement
I thank my God and Lord, Jesus Christ from whom all good things come, for keeping
me alive, giving me the wisdom and health to go through the PhD candidature. To God alone
I ascribe all the glory.
I am grateful to my supervisors Associate Professor Christopher Ford and Professor
Randy Stringer, for their expertise, guidance, encouragement and support throughout the
challenging period of the PhD candidature. Words are not enough to express my heartfelt
gratitude to them. Special thanks to Dr Cameron Grant for the moral and administrative
support he provided in the challenging days of my candidature. My thanks also go to Dr
Simone Mueller Loose, Adjunct Associate Professor Tony Spawton and Professor Aron
O’Cass and his research group for their comments, remarks and feedback on my
methodology and other processes in the study. To Dr Lynne Giles I owe a great debt of
appreciation for all the assistance she provided for my data analysis. Not forgotten are my
research group members Tey Yeong Sheng, Le Dang, Poppy Arsil and Tri Nugroho for moral
and academic support along with intellectual idea sharing and contribution to discussions in
the study room, seminars and presentations. I also thank my colleague Ervin Sim for the
support he provided me in transferring the questionnaire into an online platform.
This work owes a profound debt of appreciation to the experts who made available
their time and knowledge in the course of writing this thesis through monthly workshops on
research writing. Special thanks to Dr Ron Smernik and Dr Margaret Cargill. Finally I
acknowledge Mr Adam Jarvis and Ms Skye Greig for editing this thesis, Ms Maria Pasin and
Mr David Livingston for the administrative support they provided to this study.

iv
Declaration
I certify that this work contains no material which has been accepted for the award of any
other degree or diploma in my name, in any university or other tertiary institution and, to the
best of my knowledge and belief, contains no material previously published or written by
another person, except where due reference has been made in the text. In addition, I certify
that no part of this work will, in the future, be used in a submission in my name, for any other
degree or diploma in any university or other tertiary institution without the prior approval of
the University of Adelaide and where applicable, any partner institution responsible for the
joint-award of this degree.
I give consent to this copy of my thesis, when deposited in the University Library, being
made available for loan and photocopying, subject to the provisions of the Copyright Act
1968.
I also give permission for the digital version of my thesis to be made available on the web,
via the University’s digital research repository, the Library Search and also through web
search engines, unless permission has been granted by the University to restrict access for a
period of time.
Waite Campus, November 2013
Osadebamwen A. Ogbeide

v
Abstract
This thesis investigates two major topics independently with outcomes that stand
alone but can have influence on each other. Australian consumers’ interest in the
consumption of organic products is increasing as they are receptive to the perceived health
and environmental benefits that are linked to them. However, producers and consumers face
challenges understanding the value of the health and environmental attributes. While
consumers and producers express interest in organics, gaps exist in their common interest.
Producers require premiums for their products to compensate for potential higher production
costs or lower yields. Understanding how much consumers are willing to pay (WTP) for the
benefits related to organic products is a challenge.
The role of expert service in wine retailing is important. Many studies document the
value information provision creates in purchase situations. This service provision to
consumers is a key factor encouraging purchase decisions and gaining interest and
engagement. It can be important for retailers to provide an environment that extends this
service to consumers. Training employees in wine knowledge is vital as they form the
frontline between the wine purchase and the consumers. This service comes with a cost that
is usually passed on to consumers and it is of interest to determine consumer willingness to
absorb this cost.
The primary objectives of the study are twofold: (1) to determine which factors affect
consumers’ willingness to pay an additional ‘premium’ price for organic wines benefits, and
(2) to determine which factors affect consumers’ willingness to pay a premium for the expert
services that retail wine stores provide in increasing consumer wine knowledge generally
including the health and environmental considerations of organic wines. An online survey
was carried out in all the states and territories of Australia. Respondents were obtained from

vi
IMPACTLIST mailing list by random selection of list members that met the pre-requisite
criteria. The potential respondents were emailed a questionnaire through the Adelaide
Qualtrics online data collection software. The Stata 12 statistical software was used to
analyse the sample and variable frequency statistics, factor analysis of the variables used for
the regression model and the ordered probit regression and marginal effect analyses.
On average, the premiums or willingness to pay (WTP) respondents indicated were
approximately 23% for both environmental (WTPe) and health (WTPh) benefits. The expert
service provision is usually free or nonexistent in retail stores; therefore no price reference
exists for the base price and was assumed to be $0.00. For the expert service of the sales
outlets (WTPs), respondents indicated WTP of $0.60. The proposed hypotheses were tested
using the ordered probit model and all except two were accepted. The social demographic
variables presented a mixed outcome.
Overall for WTPe, consumers’ knowledge of organic wine was found to be
significant, and will determine the WTPe of organic wines. The marginal effect of knowledge
indicated that the probability of paying $0.00 premium for environmental benefit decreased
as the knowledge of consumers about organic wine increased. For WTPh, the relationship
between knowledge and WTP was similar in direction to WTPe but different in magnitude.
The consumers’ motive indicated negative significance to WTPe and was not significant but
positive for WTPh.
The consumer attitude was positive and significant in WTPe and WTPh and an
increase in the consumers’ attitude decreases the unwillingness to pay premium for both
environmental and health benefits. However, the consumer perceived risk was negative and
significant in WTPe and WTPh. The consumers’ perceived risk was not significant in
determining WTPs. For WTPe, WTPh and WTPs, risk reduction strategy was positive and
significant in determining WTP.

vii
The study further shows that 66.0% of respondents had purchased organic wine prior
to the survey. However, questions about their knowledge of the environmental and health
considerations associated with organic wines indicated that most consumers were lacking in
organic product knowledge. This implies that sensitisation and enlightenment programs that
are geared toward these factors may be effective in helping consumers move toward more
organic wine consumption.
From this study, it is of note that the environmental and health attributes weigh
differently in the consumers’ mind, and this influences their willingness and the amount of
premium to be paid. The study acknowledges this and measured the WTP a premium for
these attributes instead of the product itself. It was found that more consumers are willing to
pay for the health attribute than an environmental one, and would pay somewhat higher
premium for the former. It is the study recommendation that the distinctive attributes of the
organic product should be used to measure consumer WTP rather than the present situation,
in which organic wines are considered a commodity. Another contribution is the investigation
of the WTP a premium for expert service provided by retail sale outlets. Previous studies
emphasise the importance of service in differentiating retail sale outlets and creating
customers’ relationships. This study investigates and measures consumers’ WTP for expert
service provision in Australia and the factors that impact on consumers’ need for expert
service.
Keywords: Consumer; Environmental; Expert service; Health; Organic; Premium; Wine; WTP.

viii
Table of Contents
Dedication ............................................................................................................................................. ii
Acknowledgement ................................................................................................................................iii
Declaration ........................................................................................................................................... iv
Abstract................................................................................................................................................. v
Table of Contents ................................................................................................................................ viii
List of Figures ...................................................................................................................................... xv
List of Appendices ............................................................................................................................. xvii
List of Symbols and Abbreviations .................................................................................................... xvii
Chapter One .......................................................................................................................................... 1
1. Introduction ...................................................................................................................................... 1
1.1 The aim and objectives of the study............................................................................................ 7
1.2 Background and Overview ......................................................................................................... 7
1.2.1 Snapshot of disciplines and concepts relevant to the study .................................................... 8
1.2.2 The effects of conventional production chemicals on consumers .......................................... 9
1.2.3 Sustainable production of food and drinks............................................................................. 9
1.2.4 Global wine consumption and perception ............................................................................ 11
1.3 Contributions of the study......................................................................................................... 13
1.4 Outline of the Thesis ................................................................................................................. 14
Chapter Two ....................................................................................................................................... 16
Literature Review ............................................................................................................................... 16
2.1 Introduction .............................................................................................................................. 16
2.2 Product in the context of the study............................................................................................ 16
2.2.1. Products communicate desirability to consumer ................................................................. 17
2.3 Wine and its importance ........................................................................................................... 17
2.3.1 How wines are assessed by consumers ................................................................................ 18
2.3.2 Organic production and marketing ...................................................................................... 20
2.3.2.1 A snapshot of the organic movement ......................................................................... 20
2.3.2.2 The organic market and its complexity ...................................................................... 21
2.3.2.2.1 Organic: the definitions and claims are confusing ................................................ 23
2.3.2.2.1.1 Sustainability is important to the future of organic wine consumption .............. 25
2.3.2.2.1.2 Organic: the health claims are diverse and often conflicting ............................. 26
2.3.2.2.1.3 Organic: the perception of the environmental claims is also diverse ................ 27
2.3.2.2.2 Attributes of organic wines are valued differently ................................................ 28
ix
2.3.2.2.3 The certification processes of organic product are concerning ............................. 28
2.4 Consumers’ behaviour in products and services acquisition are different ................................. 29
2.5 Importance of social demographics on willingness to pay premiums for products and service 30
2.6 Consumer needs and motivation ............................................................................................... 32
2.7 The role of product knowledge in the acquisition process ........................................................ 34
2.8 Attitudes of consumers towards a product ................................................................................ 34
2.9 Risk and its importance ............................................................................................................ 36
2.9.1 The concept of risk perception............................................................................................. 36
2.9.1.1 Consumer perception of risk ...................................................................................... 37
2.9.1.2 The importance of perceived risk ............................................................................... 38
2.9.1.3 The importance of perceived risk in wine .................................................................. 38
2.9.1.4 The measurement models for perceived risk .............................................................. 38
2.9.2 Management of perceived risk: Risk reduction strategy ...................................................... 39
2.9.2.1 Risk reduction in wine ............................................................................................... 40
2.10 Retail transformation and values delivery ............................................................................... 42
2.11 Introduction to willingness to pay ........................................................................................... 45
2.11.1 Price in relation to payment for purchase .......................................................................... 45
2.11.2 Determining willingness to pay ......................................................................................... 46
2.11.2.1 Consumer willingness to pay ................................................................................... 47
2.11.3 Determining WTP for organic product and store service ................................................... 49
2.11.3.1 Revealed preference ................................................................................................. 49
2.11.3.2 Stated preference ...................................................................................................... 50
2.11.3.2.1 Conjoint analysis ................................................................................................ 50
2.11.3.2.2 Contingent valuation method (CVM) ................................................................. 51
2.11.3.2.3 Offers of products ............................................................................................... 52
2.12 Theoretical framework ............................................................................................................ 54
2.13 Statement of research objectives and questions ...................................................................... 60
2.13.1 Hypotheses ........................................................................................................................ 61
Chapter Three ..................................................................................................................................... 66
Methodology ....................................................................................................................................... 66
3.1 Introduction .............................................................................................................................. 66
3.2 Questionnaire design ................................................................................................................ 66
3.2.1 The Structure of the questionnaire (Sources of variables) ................................................... 68
3.2.2 The design layout of the questionnaire ................................................................................ 69

x
3.3 Research area ............................................................................................................................ 75
3.4 Procedure for data collection .................................................................................................... 76
3.4.1 The Research data................................................................................................................ 76
3.4.2 Survey method ..................................................................................................................... 77
3.4.3 Sampling method ................................................................................................................. 78
3.4.4 The sample frame and size .................................................................................................. 79
3.4.5 Survey pilot ......................................................................................................................... 81
3.4.6 Collection of data and questionnaire administration ............................................................ 82
3.4.7 Data quality and security ..................................................................................................... 83
3.5 Data screening for completeness and consistency .................................................................... 83
3.6 Coding ...................................................................................................................................... 84
3.7 Ethical consideration ................................................................................................................ 84
3.8 Statistical tools, empirical models and procedures for data analysis ......................................... 85
3.8.1 Factors purification using principal components analysis .................................................... 87
3.8.2 Reliability test...................................................................................................................... 88
3.8.3 Summation scale scores ....................................................................................................... 88
3.8.4 Ordered probit model........................................................................................................... 89
3.8.5 Marginal analysis................................................................................................................. 92
3.8.6 Discriminant analysis .......................................................................................................... 92
3.9 Study appraisal ......................................................................................................................... 94
3.9.1 Academic visits ................................................................................................................... 94
3.9.2 Conferences, seminars and workshops Attendance ............................................................. 94
3.10 Conclusion .............................................................................................................................. 95
Chapter Four ....................................................................................................................................... 96
Result and Discussion: Sampling, Sample and Variable Descriptive Statistics ................................... 96
4.1 Introduction .............................................................................................................................. 96
4.2 Result of data screening ............................................................................................................ 96
4.3 Sample description ................................................................................................................... 98
4.4 Descriptive statistics of the variables ...................................................................................... 101
4.4.1. Consumer information and knowledge of health and environment ................................... 101
4.4.2. Consumer information and knowledge of organic wine ................................................... 102
4.4.3 Current wine acquisition practices ..................................................................................... 104
4.4.3.1 How often do consumers drink wine? ...................................................................... 104
4.4.3.2 Factors that influence the purchase decision in wine................................................ 105
xi
4.4.4 Consumer motivation towards organic wine ...................................................................... 108
4.4.5 Respondents’ attitude towards organic wine ...................................................................... 110
4.4.6 Respondents’ perceived risk towards organic wine ........................................................... 111
4.4.6.1 Respondents’ perceived risk towards organic wine: Likelihood .............................. 111
4.4.6.2 Respondents’ perceived risk about organic wine: Seriousness ................................. 113
4.4.7 Respondents’ risk reduction strategy ................................................................................. 114
4.4.7.1 Respondents’ risk reduction strategy (Intrinsic product related) .............................. 114
4.4.7.2 Respondents’ risk reduction strategy (Extrinsic product related) ............................. 115
4.4.7.3 Respondents’ risk reduction strategy (Store related) ................................................ 117
4.5 Respondents’ willingness to pay (WTP) ................................................................................. 119
4.6 Discussion of sample and variables statistics .......................................................................... 121
Chapter Five ..................................................................................................................................... 126
Result and Discussion on Willingness to Pay for the Environmental Benefit of Organic Wine ........ 126
5.1 Introduction ............................................................................................................................ 126
5.2 Willingness to pay for the environmental benefit of organic wine .......................................... 126
5.3 Willingness to pay a premium for the environmental benefit of organic wine - Discriminant
analysis ......................................................................................................................................... 128
5.4 Characteristics of consumers’ willingness and unwillingness to pay a premium for the
environmental benefit of organic wine ......................................................................................... 129
5.5 Ordered probit regression ....................................................................................................... 130
5.5.1 Result of factor analysis and reliability test ....................................................................... 130
5.6 Ordered probit regression and marginal analysis results ......................................................... 132
5.6.1 Ordered probit regression result ........................................................................................ 132
5.6.2 Marginal analysis result ..................................................................................................... 134
5.7 The Hypotheses ...................................................................................................................... 136
5.8 Discussion .............................................................................................................................. 142
Chapter Six ....................................................................................................................................... 144
Willingness to Pay for the Health Benefits of Organic Wine: Results and Discussion ..................... 144
6.1 Introduction ............................................................................................................................ 144
6.2 Ranking of health benefits by respondents ............................................................................. 144
6.3 Willingness to pay for the health benefits of organic wine ..................................................... 145
6.3.1 The Premium respondents are willing to pay for the health benefits of organic wine: Results
................................................................................................................................................... 146
6.4 Willingness to pay premium for health benefit of organic wine - discriminant analysis ......... 147

xii
6.5 Characteristics of respondents willing and those unwilling to pay a premium for the health
benefit of organic wine ................................................................................................................. 148
6.6 Factors that influence consumer willingness to pay for health benefit of organic wine .......... 149
6.7 Effect of marginal change in explanatory variables on WTPh ................................................ 151
6.8 The results of hypotheses testing ............................................................................................ 154
6.9 Discussion of results ............................................................................................................... 159
Chapter Seven ................................................................................................................................... 161
Results and Discussion on Willingness to Pay for the Expert Service of Wine Retailers.................. 161
7.1 Introduction ............................................................................................................................ 161
7.2 Consumers’ preference for wine store .................................................................................... 161
7.3 Respondents’ willingness to pay for the expert service of wine retail stores .......................... 163
7.4 Discriminant analysis of respondents’ willingness to pay a premium for the expert service of
wine retailers ................................................................................................................................ 165
7.5 Factors that affect willingness to pay for the expert service of wine retailers ......................... 167
7.5.1 The Hypotheses ................................................................................................................. 169
7.6 Relationship between willingness to pay of the benefits of organic wine and expert service of
wine retailers ................................................................................................................................ 171
7.7 Discussion of outcomes on WTPs .......................................................................................... 172
Chapter Eight .................................................................................................................................... 175
Conclusion and Implications ............................................................................................................. 175
8.1 Introduction ............................................................................................................................ 175
8.2 Practical implications ............................................................................................................. 177
8.2.1 Managerial implications .................................................................................................... 178
8.2.2 Policy implications ............................................................................................................ 183
8.2.3 Academic Implications ...................................................................................................... 184
8.2.4 Limitations of the study ..................................................................................................... 185
8.2.5 Future research direction ................................................................................................... 186
8.2.5.1 Research refinement ................................................................................................. 186
8.2.5.2 Research extension ................................................................................................... 186
References ........................................................................................................................................ 188
Appendices ....................................................................................................................................... 215

xiii
List of Tables
Table 3.1 Grouping of variables, measurement tools and the number of items in each variable
Table 4.1 Demographic Profile of Sample
Table 4.2 Descriptive Statistics for consumer information and knowledge of health and
environment
Table 4.3 Descriptive Statistics for consumer information and knowledge of organic wine
Table 4.4 Respondents’ ranking of the importance of environmental benefit of wine
Table 4.5 Respondents’ ranking of the importance of health benefit of wine
Table 4.6 Descriptive Statistics for respondents’ motivation towards organic wine
Table 4.7 Respondents’ attitude towards organic wine
Table 4.8 Descriptive Statistics for respondents’ perception of risk (likelihood)
Table 4.9 Descriptive Statistics for respondents’ perception of risk (seriousness)
Table 4.10 Descriptive Statistics for respondents’ risk reduction strategy (intrinsic product
related)
Table 4.11 Descriptive Statistics for respondents’ risk reduction strategy (extrinsic product
related)
Table 4.12 Descriptive Statistics for respondents’ risk reduction strategy (store related)
Table 4.13 Cross-tabulation of Social Demographic variables and Latent variables: Chi
Square Test Result
Table 5.1 Tests of significance of all canonical correlations for WTPe
Table 5.2 Factors that differentiate consumers willing and those unwilling to pay for
environmental benefits of organic wine
Table 5.3 Factor analysis and reliability test
Table 5.4 Results of ordered probit analysis of consumers’ WTP for environmental benefit of
organic wine
xiv
Table 5.5 Summary of outcome of hypotheses testing – WTPe
Table 6.1 Respondents’ ranking of the importance of health benefit of organic wine in their
purchase decision
Table 6.2 Tests of significance of all canonical correlations for WTPh
Table 6.3 Factors that differentiate consumers willing and those unwilling to pay for health
benefits of organic wine
Table 6.4 Results of ordered probit analysis of consumers’ WTP for ‘health benefits’ (WINE
B)
Table 6.5 Summary of outcome of hypotheses testing – WTPh
Table 7.1 Respondents’ ranking of the ability of sales outlets to provide assistance during
wine purchase
Table 7.2 Tests of significance of all canonical correlations for WTPs
Table 7.3 Difference between respondents willing to pay and those unwilling to pay premium
for WTPs
Table 7.4 Results of ordered probit analysis of consumers’ WTP for the expert service
rendered by wine sales outlet
Table 7.5 Summary of outcome of hypotheses testing – WTPs
Table 7.6 Chi Square test of relationship between WTPs and WTPs and, WTPh and WTPs
Table 8.1 Important Findings relating to the Hypotheses
List of Figures
Figure 1.1 Top 10 Wine consuming countries
Figure 2.1 Conceptual framework showing factors influencing willingness to pay for the
attributes of organic wine

xv
Figure 2.2 Conceptual framework showing factors influencing willingness to pay for the
expert service rendered by wine retail sales outlets
Figure 3.1 Maps of Australian wine regions
Figure 3.2 Causal relationships between each of the independent variable and the
corresponding dependent variable
Figure 3.3 Causal relationships between each of the independent variable and WTPs
Figure 4.1 Respondents' frequency of wine consumption
Figure 4.1a Cross tabulation of educational qualification and frequency of wine consumption
Figure 4.2 Ranking of decision factors in wine purchase
Figure 4.3 Percentage of respondents that have made previous purchases of organic wine
Figure 4.4 Cross tabulation: Respondents' educational qualification and past purchase of
organic wine
Figure 5.1 Willingness to pay for the environmental benefit of organic wine
Figure 5.2 Result of Premium respondents are willing to pay for the environmental benefit of
organic wine
Figure 5.3 Marginal effects of attitude on WTPe
Figure 5.4 Marginal Effects of Perceived Risk and Risk Reduction Strategy on WTPe
Figure 5.5 Marginal effects of knowledge of organic wine on WTPe
Figure 6.1 Willingness to pay for health benefit of organic wine
Figure 6.2 Premium consumers are willing to pay for health benefit of organic wine
Figure 6.3 Marginal effects of attitude on WTPh
Figure 6.4 Marginal effects of knowledge of organic wine and consumer's motivation on
WTPh
Figure 6.5 Marginal effects of perceived risk and risk reduction strategy on WTPh
Figure 7.1 Ranking of stores’ ability to provide assistance to wine shoppers

xvi
Figure 7.2 Respondents willingness to pay for the expert service of wine retailers
Figure 7.3 The amount respondents are willing to pay for the expert service rendered by wine
retail store
List of Appendices
Appendix 1 Letter of introduction and consent
Appendix 2 Survey Questionnaire
Appendix 3 Ranking of factors that influence wine purchase decision
Appendix 4 Ranking of retail store where purchase is made based on ability to provide useful
assistance to consumers
Appendix 5 Respondents’ frequency of wine consumption
Appendix 6 Respondents’ willingness to pay (WTPe, WTPh and WTPs)
Appendix 7 Premium respondents are willing to pay
Appendix 8 Scale items and their sources
Appendix 9 Ordered probit model using summated RRS (RRS_A) to determine WTP for
expert service provided by retail store
Appendix 10 Gender delimited demographic profile of sample
Appendix 11 Number of certified client by supply chain and year 2002-2011
Appendix 12 Estimated number of certified organic operators by state 2002-2011
Appendix 13 Total area certified in Australia 2002-2011
Appendix 14 The theoretical model, hypotheses outcome and the direction for WTPe and
WTPh
Appendix 14a The theoretical model, hypotheses outcome and the direction for WTPs
Appendix 15 Cross-tabulation of Social Demographic variables and Latent variables: Chi
Square Test Result
Appendix 16 Organic Agriculture: Key Indicators and Leading Countries
Appendix 17 Retail value growth of organic products in Australia

xvii
List of Symbols and Abbreviations
ATTITUDE Summated score for attitude
PACIV_RK Summated score for perceived risk
RRS_A Summated score for risk reduction strategy
MOTI Summated score for motivation (three scale items)
MOTIV Summated score for motivation (four scale items)
KNOWOW Summated score for knowledge of organic wine
AUD, $ Australian dollar
BFA Biological Farmers of Australia
Bach Bachelor degree
CSM Canonical structure matrix
CVM Contingent Valuation Method
DA Discriminant analysis
DAFF Department of Agriculture, Fisheries and Forestry
DC-CVM Dichotomous Choice Contingent Valuation Method
EU European Union
FSANZ Food Standards Australia New Zealand
GMO Genetically modified organism
HSC Higher school certificate
IFOAM International Federation of Organic Agriculture Movements
INC Importance of consequences of negative occurrence
ITR Item response theory
Mhl Million hectolitres
mhl Thousand hectolitres
MSA Measure of sample adequacy
Mast Master Degree

xviii
NOAA National Ocean and Atmospheric Association
NR Number right
OM Organic Movement
OIV International Organisation of Vine and Wine
PGd Post graduate diploma
PhD Doctor of philosophy
PR Potential respondents
PNC Probability of negative consequences occurrence
RRS Risk Reduction Strategy
SA South Australia
SI Situational Involvement
SS Summated scale or score
SLC School leaving certificate
TAFE Technical and further education
UK United Kingdom
USD United State dollar
USDA United State Department of Agriculture
USP unique selling proposition
WHO World Health Organisation
WTP Willingness to pay
WTPe Willingness to pay a premium for the environmental benefit
WTPh Willingness to pay a premium for the health benefit
WTPs Willingness to pay a premium for store (expert service provided by sales outlet)

1
Chapter One
1. Introduction
The research described in this PhD thesis explores the willingness to pay (WTP) for two
products at their attributes level – WTP for the environmental and health benefits of organic
wine; and the expert service of wine retail store. In this study, two products and their
attributes are introduced side by side with the results presented independently. The likelihood
exists for a relationship between the willingess to pay for the expert service of wine retailers
and willingness to pay for the environmental and health benefits of organic wine.
Research and industry reports indicate growth in the world organic market. According
to World Organic Agriculture Report 2012, the world organic agricultural land has increased
from 11.0 million hectares in 1999 to 37.0 million hectares. Australia’s agricultural land area
was 12.0 million hectares in 2009. The report estimates the size of the organic market size to
be $59.1 billion USD in 2009, compared to $15.2 billion USD in 1999. The United States is
the market leader – $26.7 billion USD in 2010. The per capita consumption indicator shows
Switzerland, Denmark and Luxemburg as the leaders with $213 USD, $198 USD and $177
USD respectively. Appendix 16 shows a snapshot of key indicators of world organic market.
Growth in the organic industry in Australia, and the rest of the Oceania continent has
been strongly influenced by rapidly growing overseas demand (Willer & Kilcher 2012).
However the domestic market is also expanding (BFA 2012), it is not at the same rate as the
conventional product (BFA 2012; DAFF 2004; Remaud & Sirieix 2010). The trend in the
retail value of Australias’ organic market suggest a gradual increase from $28.0 million AUD
in 1990 to $1150.0 million AUD in 2012. Refer to Appendix 11-13 and 17 for more
information about Australia’s organic market.

2
According to Savage, (2009), sustainability is now an important component for
driving competition within and between producer and consumer markets. Issues such as
carbon foot print and perceived health benefits of product represent a concern for consumers
that value the environment and their health seriously. Generally, Australian consumers’
interest in the consumption of organic products is also increasing (Bezawada & Pauwels
2012) as they are receptive to the perceived health and environmental benefits that are linked
to them (BFA 2012; Bhaskaran et al. 2006; Brugarolas et al. 2005; Gil, Gracia & Sanchez
2000; Magnusson et al. 2003). However, producers and consumers face challenges with price
levels.
From the producer perspective, organic production has issues that include limited
chemical use; full production takes longer to achieve; production levels seldom reach those of
conventional vineyards; labour intensive; small economy of scale and high certification costs.
Some organic systems have quite low input costs, but generally the flexibility to use a wide
range of inputs is limited. The result is higher cost in terms of production losses from weed
pressure and diseases (Brugarolas et al. 2005; Jonis et al. 2008; Wright & Grant 2011; Wynen
2002).
Under an organic system, a vineyard is slower to yield, and the grape yield is lower.
Over time, growers can pick significantly fewer tonnes of product than their conventional
competitors (de Ponti, Rijk & van Ittersum 2012; Jonis et al. 2008; Seufert, Ramankutty &
Foley 2012; Wright & Grant 2011).
Labour for the production of organic crops in a mono crop system such as viticulture
is relatively high compared with conventional production practices. The benefit of low labour
usage for the chemical weeding is lost. Though economies of scale are increasing, organic
production is still small scale. Post-harvest handling, marketing, distribution and certification

3
costs of relatively small volumes of organic products from small farm units usually translate
into higher average costs for the producers (Jonis et al. 2008).
From the consumers’ perspective, the desire for organic products is based on the
perceived benefits for the environment and health of consumers. Consumers’ awareness of
these benefits is increasing; so also is their knowledge of some of the factors that affect
human health and the environment (Bhaskaran et al. 2006).
Some of the factors include the use of synthetic chemicals – fertilizers, herbicide and
stimulants and other unsustainable production systems. These chemicals, some untested
(Lantz 2008) are used in the production of food and drinks and can have adverse effects such
as cancer and other chronic cardiovascular diseases on consumers and the community (Youl,
Baade & Meng 2012).
Aside from the direct effects of these chemicals on humans, their impact on the
environment is also evident. Their production, distribution, use and disposal result in the
emission of green house gases and the pollution of the ecosystem (Wine Australia 2011).
While consumers and the producers have shown interest in organics, there exist gaps
in their common interest. Producers require premiums for their products based on the
peculiarity of their production circumstances and the perceived benefits inherent in their
products. Predicting how much consumers are willingness to pay (WTP) for the benefits of
organics is a challenge (Gribben & Gitsham 2007).
Although consumers have generally positive attitudes towards organic products, the
actual dollar amount spent is quite small (Oberholtzer, Dimitri & Greene 2005; Remaud et al.
2008). However, at the wine retail points, there are doubts whether consumers pay more per
bottle of organic wines versus conventional ones that are directly comparable. It has been
suggested that one reason organic wines are not commanding the desired price relative to
conventional ones is that many wine consumers are not concerned about wine’s organic

4
status, since the quality of a conventional wine is similar to good organic wine (Oberholtzer,
Dimitri & Greene 2005; Wright & Grant 2011).
The role of “Expert service” in wine retailing: This study defines a wine expert as
any person that has sufficient intrinsic and extrinsic wine knowledge - taste, aroma, colour,
feel, use and use occasion, country or region of origin, grape varieties and any other
information that consumers seek in purchase situations. The expert service of a wine retailer
therefore goes beyond assistance in selecting wines or provision of wine leaflets. It includes
such service as extension of product and retail knowledge, hospitality and sales that enable
the creation of value for both the retailers and the consumers (Priem 2007; Pullman & Gross
2004).
Knowledge of wine can be overwhelming for many consumers, particularly when
they encounter different occasions or when the consumers are inexperienced. The most
knowledgeable wine consumers are still faced with the issue of choosing wine because of the
thousands of wine brands on the shelf from which they have to make a choice (Lockshin &
Kahrimanis 1998). This situation is worse for the large consuming population that have little
knowledge about the product.
Many studies demonstrate the importance of values such as product assortments, location
convenience, and on-site information, including services that reduce consumers' costs in time
and transportation, and enhanced information provision in purchase situation
(Csikszentmihalyi 1997; Kozinets et al. 2002; Lockshin & Kahrimanis 1998; Lusk 2003;
Lusk & Hudson 2004; Priem 2007; Pullman & Gross 2004; Shapiro 1983). This value of
service provision to consumers is a key expectation that encourages and wins their interest
and engagement (Kozinets et al. 2002). To meet this expectation, experiential services that
comprise the aspects that relate to emotions are useful; that drive loyalty and manage service
practices that positively affect those emotions (Pullman & Gross 2004). The implication for

5
retailers is to develop relational context through hiring and training of employees that can
interact with the consumers technically in a friendly customer service environment (Lockshin
& Kahrimanis 1998; Pullman & Gross 2004).
The store service as proposed by Lockshin and Kahrimanis (1998); Pullman and
Gross (2004) and Priem (2007) comes with absorbable cost to the marketer or consumers.
However, experience has shown that such costs are usually passed to the consumers, and it is
of interest to determine consumer willingness to absorb this cost.
Consumers’ willingness to pay (WTP) for service depends on the utility they can
derive from it. A change in utility is evoked by a change in the level of one or several
attributes of the service (Lusk et al. 2001) Therefore WTP for a service is an indicator of the
value consumers assign to it (Unnevehr, Villamil & Hasler 1999). A large body of research
abounds on retailing e.g. (Csikszentmihalyi 1997; Kozinets et al. 2002; Lockshin &
Kahrimanis 1998; Lusk 2003; Lusk & Hudson 2004; Shapiro 1983). However few studies (if
any) exist on WTP for the expert service of wine retail stores, an area worth investigating
considering the usage and complexity of wines.
Reviewing the research gaps relating to willingness to pay for the environmental and
health benefits of organic wine and the expert service provided by retail stores, this study
attempts to investigate the gaps and the associated consumer behaviours and build a
comprehensive model to explain the relationships.
This study is important from empirical, methodological and theoretical perspectives
because:
It presents empirical evidence of the importance of the theories and concepts used to
determine WTP. The models are developed to link consumer behaviours and WTP by
identifying relevant behavioural factors and their effects. This provides a framework for
better understanding of how theories and concepts like attitude, motivation, perceived

6
risk, knowledge and socio-demography affect consumer willingness to pay for organic
wine benefits and the expert service of wine retailers.
By addressing the financial consequences like WTP in this emerging sub sector of the
wine industry in Australia, organic wines might constitute a huge market opportunity
for wineries and retailers.
WTP can be used to form organic wine market segments. This can provide the
marketers an opportunity to extend to the various consumer segments the appropriate
communication strategy, targeting and positioning the viable segments differently.
By determining the factors that influence WTP, the industry is able to obtain insight
into the behaviour and attitude of organic wine consumers and tailor appropriate
marketing strategies and programs to reach them.
By determining the willingness to pay for organic wine at the attributes level, enables
a measure of the value wine consumers place on the attributes rather than the whole
product. This method provides information about what attributes in organic wine
consumers value most and what they are willing to pay for them.
Previous studies provide no clear conclusion on Australian wine consumers’ WTP a
premium for the benefits of organic wine or the factors influencing it. Remaud et al. (2008)
reported that consumers do not especially value organic wine and are not willing to pay
premiums for it. The consumer’s segmentation study by Mueller and Remaud (2010) indicate
that the influence of environmental and organic claims on wine choice in Australia has
increased slightly to 2.0% in 2009 compared to the 0.2% in 2007 valuation, but their study
found a segment that strongly rejected the environmental claims and the study in general did
not investigate consumer willingness to pay for the benefits of these claims. Therefore, it
becomes more relevant to address the issue of consumer willingness to pay for these attribute
as it holds the key to commercial sustainability and profitability.

7
However, this study found some evidence of consumer WTP a premium for the
benefits of organic wine. There has been no previous study that determined the WTP for the
expert service provided by wine retail outlets in Australia, this thesis contains some evidence
of consumers’ WTP for expert service of the retail store. These outcomes are complementary
to the development of the wine industry. Expert service provision by retail stores will create
more awareness and provide the knowledge required to reduce perceived risk and increase
consumer confidence in purchase process and increase revenue for retailers in a symbiotic
manner.
1.1 The aim and objectives of the study
This thesis examines the opportunities, challenges and prospects of the organic market
in general and the organic wine market in particular. This is important as it helps to better
understand the consumers and how to develop the organic sector of the wine industry and the
retail marketing. This doctoral study has four main research objectives:
1. to determine consumer willingness to pay a premium for the benefits of organic wine;
2. to identify and analyse the determinants that influence consumer willingness to pay a
premium for the benefits of organic wine;
3. to determine consumer willingness to pay for the expert service provided by wine retail
outlets; and
4. to identify and analyse the determinants that influence consumer willingness to pay for the
expert service provided by wine retail outlets.
1.2 Background and Overview
The growth potential of consumer demand for organic products and their limits is
identified in previous studies (e.g. Bhaskaran et al. 2006; 1995; Munene 2006; Steenkamp,
Van Heerde & Geyskens 2010; Wine Australia 2011), and some studies suggested that
motivations for buying organic products show a positive picture of strong demand potentials.

8
For example, according to a Biological Farmers of Australia (2012) report, the Australian
organic wine sector is skewed to South Australia, which produces about 85% ($4.12 million)
of country’s total organic wine. Australian organic wine is valued at $4.8 million per annum
and organic wine grape production has increased by 107% in the last two years (2010 -
2012), mostly due to expansions by Angove Family Wines and Yalumba, as well as
established organic brands and producers like Temple Bruer Wines (BFA 2012).
For the expansion of the organic wine market to continue, it is important to
understand the consumers, as they are the live wire of any business organisation (Gligorijevic
& Leong 2011). The question remains—how does one know the factors that impact
consumers’ choice of products? Several pathways and disciplines have been engaged to
provide answers.
Bootzin, Loftus and Zajonc (1983); Guay et al. (2010); Schiffman and Kanuk (2006)
recognised the potential contribution of the behavioural sciences in understanding consumer
behaviours. They noted that even the simplest purchasing decision is a combination of
behavioural forces: factors of which even the purchaser might not be aware.
1.2.1 Snapshot of disciplines and concepts relevant to the study
Cognitive psychology provides the insight that perceptions are formed by common-
sense reasoning, personal experience, social communication and cultural traditions. This in
turn links human endeavours to certain expectations, ideas, hopes, fears and emotions
(Drottz-Sjöberg 1991; Pidgeon et al. 1992). Consumer risk theory investigates the outcomes
of consumers in product and services acquisition in terms of uncertainty and consequences
(Bauer 1960; Cox & Rich 1964) and management of the perceived risk (Cox & Rich 1964).
Motivation theory has been used to examine why motives are based on physiological
and psychological needs (Maslow 1954) and how these are sources of influence on
demonstrated behaviours (Bootzin, Loftus & Zajonc 1983; Watchravesringkan, Hodges &

9
Kim 2010). Consumer psychology has also explored how individuals process and use
information about a product, build their beliefs and attitudes towards it, and form their buying
intentions and actions (Fishbein 1967; Fishbein & Ajzen 1975; Lutz 1991). All these theories
have been and are still being used to investigate the relationship that exists between
consumers and the product or service that they consume.
1.2.2 The effects of conventional production chemicals on consumers
Furthermore, to understand some of the reasons consumers are patronising organic
products, it is important to examine the use of chemicals in traditional production activities.
More than 80,000 chemicals, some used for crop and animal production, are now registered
for use in Australia, including 38,000 industrial chemicals; 75% of these have never been
tested for their toxicity on the human body or the environment (Lantz 2008).
According to Youl et al. (2012), in Australia, cancer and other chronic diseases such
as cardiovascular diseases are recognised common public health threats, and a number of
these health issues may be linked to some chemical compounds that consumers are exposed
to in products usage. It is imperative that product contents and production processes be
reviewed to consist of lesser or zero use of chemicals, as the negative effects on the health
and general wellbeing of consumers are increasingly gaining more attention from the media
and public (WHO 2009).
1.2.3 Sustainable production of food and drinks
The two principal organic practices in Australia are organics and biodynamic. The former
prohibits the use of synthetic chemicals and the latter allow certain amount, less than the
requirement for conventional production (Remaud & Sirieix 2010; Wine Australia 2011). The
health of the soil and of the farm ecosystem has been the foundation of organic practices. In
addition to environmental benefits, in some instances they have been shown to provide great
health benefits to humans. The products have higher levels of Vitamin C, minerals, trace

10
elements and anti-oxidants, and also lower levels of chemical residues. They are better
quality—brighter, fresher fruit, tannins and flavour (Benbrook et al. 2008; Kaffka, Bryant &
Denison 2005; Wine Australia 2011).
It is necessary to understand the distinctiveness of an organic product versus a
conventional one. Specifically, the term “organic” refers to the way agricultural products are
grown and processed, without the use of various synthetic chemicals that are used in
conventional agriculture. The underlying premise of organic production is to meet and sustain
the appropriate environment management practices aimed to ecologically achieve a balance
in the ecosystem (Seufert, Ramankutty & Foley 2012; Wine Australia 2011).
Organic food and drink products are being promoted for health and environmental
benefits and in some instance for social status (Haesman & Mellentin 2001; Hughner et al.
2007; Krystallis, Fotopoulos & Zotos 2006). The presence of health promoting substances
like antigenic factors, antioxidants, anti-inflammatory and anti-tumour compounds on one
hand, and the reduction of green-house gases emission into the atmosphere on the other,
make the organic product much desired in an ideal world. These compounds in organic
products can help maintain good health, improve well-being, and create the conditions for
reducing risk of diseases (Haesman & Mellentin 2001).
Consumers’ concerns about health and environment are increasingly evident in food
and wine markets, particularly in Europe and North America (Munene 2006). Over the years,
producers’ awareness of the negative effects of the use of inorganic agrochemicals has
grown, leading consumers to adjust their purchasing behaviour to reflect these concerns about
effects on human health and environment (Barber, Taylor & Deale 2010; Biénabe,
Vermeulen & Bramley 2011; Forbes et al. 2009).
In Australia, the organic market has been reported to be growing (BFA 2012) and the
growth has prompted governments at state and federal levels to legislate for managing the

11
market. It is mandatory for Australian organic wine to be labelled as such and must be
certified by the Australian Quarantine and Inspection Service through their surrogate
agencies such as Australian Certified Organic, an arm of Australia’s largest organic farmers
association, the Biological Farmers’ Association (BFA 2010).
At the vineyard level for example, the core principle of organic viticulture is the non-
use of any genetically modified organisms or synthetic chemicals, e.g. fertilizers, pesticides
and fungicides (Wright & Grant 2011). Instead, producers adopt creative natural methods to
enhance soils, vine health and grape quality. With this approach, organic farming is capable
of substantially reducing many of the key impacts of agriculture on the climate “mainly
because it avoids the large greenhouse gas emissions from the manufacture of nitrogen
fertilizer and helps maintain the soil carbon bank” (Singh, Cowie & Chan 2011).
At the secondary (wine making) level, winemakers adopt minimal intervention
techniques in the winery, aiming for a pure expression of fruit and terroir. The Australian
standards for organic farming do not prescribe many restrictions on winemaking inputs,
except for the fining agent Polyvinylpolypyrrolidone (PVPP), which is prohibited. The use of
Sulphur is restricted to a maximum total limit of 125ppm (Wine Australia 2011).
1.2.4 Global wine consumption and perception
Figure 1.1 Top 10 Wine Consuming Countries
Source: Statistical report on world vitiviniculture 2012, International Organisation of Vine and Wine

12
Wine consumption is widespread, often associated with social activities and
celebration of business progress or successful deals. World consumption for 2010 was
241,808 mhl. The International Organisation of Vine and Wine (OIV) statistical report in
2012 shows France as still the biggest consumer of wine by total volume of global
production: 12.0%, followed by the United States 11.4%, Italy 10.2%, Germany 8.4%, China
6.6%, United Kingdom 5.5%, Russian Federation 4.8%, Spain 4.3%, Argentina 4.0% and
Romania 1.6%, all these constituting the top ten wine consuming countries in the world.
Wine consumers drink conventional and/or organic wine. However, organic products
often cost a few cents to several dollars more than their comparative conventional ones
(Bezawada & Pauwels 2012), creating an ‘expensive’ stigma that can hinder the organic
industry from growing more quickly than it has. Sangkumchaliang and Huang (2012) found
that the stigma is not an issue that some organic consumers consider strongly; for example
56% of Thailand organic products buyers are not overly concern by the price differential.
Attempts have been made to investigate this WTP a premium for organic products
and in some cases, organic wine. A number of studies have been delimited by geography,
product type and processing method. Also, organic products such as wine can represent an
every-day use product and can also be a luxury good or a mix of both. This means that
consumers will place different values on the product in line with the purpose or occasion they
are to serve, with a ramification on purchase decisions to be made (Tsakiridou, Mattas &
Tzimitra-Kalogianni 2006).
Organic wine as an innovative product must be propagated to the larger wine
consumer audience. Although product awareness is increasing (Bhaskaran et al. 2006), it
must be continually created and product knowledge extended to potential consumers by
qualified reputable sources to allay suspicions and to improve consumers’ confidence about
the benefits of organic wine. A retail outlet that is able to provide the expert service will not

13
only differentiate itself, but can also earn a premium (Rao & Bergen 1992) as emphasis can
shift from selling a product to building relationships and make people's lives better by
product usage.
1.3 Contributions of the study
The work described in this study makes several important contributions. It tested,
measured and provided insight into the awareness and knowledge level of Australian wine
consumers about health, environment and organic wine. This insight can be used to develop
appropriate market segmentation, communication messaging, method and strategy by the
wine industry.
There are few studies in Australia directly or indirectly related to WTP a premium for
organic wine benefits. Previous studies have presented and measured consumers’ WTP for
organic products defined as eco-friendly, functional food, green produce or naturally
produced. The characteristics mainly used to differentiate organic from conventional wine are
the health and environmental attributes or benefits. This thesis notes these two attributes
weigh differently in the consumers’ mind and this influences their willingness and the
amount of premium to pay. This study acknowledges this deficiency and measured the WTP
a premium for these attributes instead of the product itself. It was found that more consumers
are willing to pay a premium for the health benefit than environmental benefit of organic
wine.
Another contribution is the investigation of the WTP for expert service provided by
wine retail sales outlets. This study is the first to investigate consumers’ WTP for expert
service of wine retail stores and the factors that impact on consumers’ need for expert service
in Australia. The popular notion is that consumers rely on the use of Risk Reduction Strategy
(RRS) because of their perception of risk; the study found that perception of risk is not
mainly the reason and that consumers are more than ever willing and ready to acquire

14
knowledge even at a cost. This is challenge for the retail industry to be able to provide the
necessary resources and communication strategies to explore and exploit the scenario as
consumers show their willingness.
1.4 Outline of the Thesis
This study focuses on the willingness to pay for the attributes of organic wine and the
expert service provided by the wine sales outlets using Australia as the research area. This
thesis is structured into eight chapters. The first introduces the thesis and mainly describes
the study objectives, background and contributions of the study. Chapter Two reviews
literature relevant to this study such as on product, product communication of desirability,
wine and its attributes, organic, consumer, motivation and knowledge acquisition. Others
include reviews on perceived risk management and consumer willingness to pay for novel
products. Finally, a statement of research objectives is discussed and questions— the
hypotheses—proposed.
Chapter Three describes in detail the methodology, description of the theoretical and
empirical frameworks for the study, survey design, data collection procedure, description of
the survey, explanation of data collection procedure to meet the objectives of the study,
statistical models and tools for analysis.
Chapter Four reports the findings of the study and result analysis. The chapter
presents outcomes on data management, data screening, sample and variable statistics. Also,
Chapter Five presents the results on factor analysis, reliability test, willingness to pay a
premium for the environmental benefit of organic wine, the hypotheses and the discussion.
The empirical results of willingness to pay a premium for the health benefit of organic wine
including the hypotheses and discussion are presented in Chapter Six while Chapter Seven
reports willingness to pay a premium for expert service of wine retailer, the associated
hypotheses and discussion.

15
Finally, conclusion, implication, limitation and future research directions are
presented in Chapter Eight. This chapter summarises the results of this study and the thesis. It
discusses the theoretical contribution of the thesis in terms of gaps in the research,
implications of the study’s findings are described and discussion of the limitations of the
research and future research directions are suggested.
In summary, this study assesses consumers’ WTP a premium for organic wines
benefits and the expert service of wine retailers. Consumers’ personality, social status,
education, income, family and peer relationships (and pressure), lifestyle and self-image,
amongst others, would shape and project the behaviour the consumers display in wine
purchase situations. All these characteristics are important and can play some vital roles in
the relationships consumers have with products and the benefits marketers derive from this
relationship. These characteristics in their aggregate sense will be explored to determine their
influence on consumers’ WTP for organic wine.

16
Chapter Two
Literature Review
2.1 Introduction
This chapter presents a review of theories and concepts relevant to the study,
exploring: organic products and why the attributes are desirable, wine and its importance,
organic production, marketing and related issues, consumer behaviour in acquisition of
products and services and the factors that affect them – social demographics, motivation,
attitude, knowledge acquisition, perceived risk and risk reduction strategy and store service.
This chapter provides a review of the empirical and theoretical literature on consumer
willingness to pay for environmental and health benefits of organic wine and the expert
service provided by wine retailers. These topics for review were chosen to enable the gaining
of understanding of this study’s research space in relation to the previous works that have
been done in this study area. It enabled the identification and exploration of the gaps in the
literature to form the rationale for this study.
2.2 Product in the context of the study
According to Maslow, (1954) products often involve emotion. The products used to
meet needs must satisfy the arousal of emotion (Andrews, Durvasula & Akhter 1990) and
consumers often communicate the emotional relevance of these needs to others.
Consequently, consumers try to adopt “a round peg in a round hole” approach to all aspects
of the purchasing and consumption processes—this includes using the right products to meet
the appropriate need within or between needs’ hierarchies. Some products are difficult to
assess until they are consumed. As a result, common product categorization as “search” and
“experience” has been used to describe types of product (Nelson 1974).

17
2.2.1. Products communicate desirability to consumer
The existing literature indicates products contain and communicate physical, social
and psychological meanings to both the consumer and other members of the community.
Ogilvie (1987) reports consumers purchase products that they think will make them appear
more appealing, or choose what not to buy. Some consumers have been found to label
products as ‘me’ or ‘not me’ and tend to reject those that are viewed as ‘not me’ (Kleine, Iii
& Allen 1995). Consumers have also been reported to easily express their dislikes (Wilk
1997) and avoid certain brands in order to distance themselves from what they do not like
(Englis & Solomon 1995; Freitas et al. 1997).
2.3 Wine and its importance
Throughout history, wine has been an essential part of culture; the Greek and Romans even
had gods of wine, Dionysus and Bacchus respectively. Even in the most primitive culture,
wine plays a significant role in social events. It has multiple uses with a long history of
application dating back before the birth of Jesus Christ. Today, wine is the beverage of choice
for many cultures across the globe and a serious challenger of beer as adult beverage in many
countries (Dougherty 2012).
Wine has been used as an aphrodisiac, anaesthetic, for relief from thirst and for
toasting to successful business agreements (Koewn & Casey 1995); it is of great relevance at
many private social occasions (Bruwer, Li & Reid 2001).
A global review of wine use indicated a fall in consumption that began in 2007, which
seemed to have reached its lowest level between 2009 and 2010. Recovery has also been
impacted by changing consumption habits. This continues to delay full recovery in the
principal producing countries, such as those in the EU where consumption fell by almost one
million hectolitres (Mhl) in 2011 (OIV 2012). In 2011 EU wine production (excluding juice
and musts) was estimated to amount to 156.9 Mhl as against 156.4 Mhl in 2010, while

18
production outside the EU amounted to 72.4 Mhl (United States – 18.7 Mhl; down 10.3% on
2010 production, South America – 29.6Mhl, South Africa – 9.7 Mhl, Australia – 11.0Mhl and
New Zealand 2.35Mhl).
The importance of these country statistics highlights the fragility of recovery in the
wine industry since the 2007 fall in world consumption and the 2008 financial and economic
crisis. The domestic wine market provides and should remain the hub within which to conceive
product ideas, develop them into successful brands, and most importantly, develop a thorough
understanding of consumer needs and lifestyles (Bruwer 2002). However, as export has risen, the
Australian domestic wine market has shrunk from 58% by volume in 1999 to 37% in 2009 (Wine
Institute 2010).
2.3.1 How wines are assessed by consumers
Wines from different grapes, vineyards, or countries have peculiar attributes that
make them different. For the most part, this individual difference results in unique
characteristics imparted to the wine by geographic conditions, viticulture methods, and the
winemaking process. To determine the uniqueness of attributes of wine (particularly taste),
sensory evaluation is needed, making it an experience product (Chaney 2000; Ward 1996).
Some wine attributes can be subjective making it dependent on the consumer’s degree
of knowledge. Hence, consumers experience difficulties in processing the quality cues
(intrinsic and extrinsic) relevant for determining good quality wine (Charters & Pettigrew
2006). While consumers can use intrinsic or extrinsic cues individually or collectively to
facilitate the purchase decision process, extrinsic cues are considered lesser value cues, as
altering these does not alter the product itself (Charters & Pettigrew 2006). The use of
intrinsic – (or higher-level) cues has a strong link to product knowledge (Dodd et al. 2005).
Therefore the use of intrinsic clues is dependent on the consumers’ product knowledge which

19
in turn determines the perceptions of the product itself with the likelihood of perceptual bias
occurring (Charters & Pettigrew 2006).
Previous study indicates that external cues are the best available to a novice to assess
wine quality. The low-product-knowledge-consumers can, for instance, use wine quality
certificates as quality assurance, which in turn suggests that the consumer trusts their
credibility as risk reliever (Charters & Pettigrew 2006). Furthermore, according to Hershey
and Walsh (2001); Charters and Pettigrew (2006); and Johnson and Bruwer (2004), points of
sales information like price, product label, expert advice from store personnel or other third
parties such as friends and colleagues who have used the product, can be a surrogate for
intrinsic cues.
Wine is classified as a social product (Li & Su 2006). Wine choice for any occasion
can be influenced by the occasions itself and can serve as a medium of social self-expression.
According to Hall, Lockshin and O’Mahony (2001) this attribute makes wine a very complex
and interesting product to study as consumers look for different attributes, or value the same
attributes differently, depending on the circumstances in which the wine is meant to be
consumed.
Koewn and Casey (1995) report taste of wine as the most important attribute
considered by wine consumers. Cohen and Cohen (1993) found that taste has strong
relationship with wine choice and noted that this is to be expected as it is often reported to
influence the attitude of consumers when choosing wine. Also, uncertainty about the attribute
of taste is a major influence on perception of risks (Mitchell & Greatorex 1988).
Remaud and Sirieix (2010) studied the perception of Australian consumers on
conventional and different eco-labelled wines. Their findings are that, conventional wine is
perceived as having “genuine” taste while eco-labelled wine was ascribed the attributes of
good for health, more expensive, harmless for the environment, and good for daily

20
consumption. However, Mann, Ferjani and Reissig (2012) compared the taste of organic wine
and the conventional one and reported that taste is not a concern for organic wine as it is
often not a predictor of choice between organic and conventional wines.
The range of wine available to consumers is extensive and contains many cues. The
multiplicity of cues such as region, sub region, country of origin, the vintage, the grape
variety or blend, the producer or the négociant, wine style, wine maker, and the specific
vineyard (Lockshin 2009), create complexity for purchasers in their decision making process
(Mueller & Umberger 2009).
2.3.2 Organic production and marketing
Early agriculture used organic methods (The Organic Institute 2012); but the need to
boost production to meet the ever-increasing demand for food changed this. The result is the
incorporation of technologies including the use of mechanical hardware, inorganic fertilizers,
herbicides and pesticides.
2.3.2.1 A snapshot of the organic movement
Until the 1920’s, all agriculture was generally organic. Farmers used natural means to
maintain the soil and to control pests; so the organic movement (OM) is more of a
renaissance than a revolution (The Organic Institute 2012). From the 1920s, the modern OM
coexisted with industrialised agriculture and spread from Europe to the Americas, Asia and
Australia, with Europe arguably taking the OM lead as groups of farmers and consumers
sought alternatives to the industrialisation of agriculture. Over time, it has grown from what
was just a movement into a viable and sustainable market domestically and internationally
(Wheeler & Crisp 2010).
The Australian organic story began in the middle of the 20th century as enthusiasts
migrated with the organic techniques from Europe to Australia. With a similar under current
to the wave in Europe, consumers’ interest in how and where food is produced grew and

21
organic food has become popular (DAFF 2004; Johnson 2011). The organic product offering
was initially restricted and only available through health food stores or food cooperatives in
the 1970s and 1980s; but due to growing popularity organic products are now widely
available in supermarkets from the 1990s to date.
The organic industry in Australia is reported to be much more than the sum of its
farms with complex processing facilities, logistics operations, wholesalers, retailers,
exporters and certification organisations (DAFF 2004). However, production units are small
with a diverse range of products including wine, fruit, nuts and vegetables, meat from various
animals, dairy products, cereals, oilseeds, plant and animal fibres, and health and body care
products (DAFF 2004; Johnson 2011).
2.3.2.2 The organic market and its complexity
A review of the spread of organic production in many countries such as Germany,
France, Britain, Spain, Italy, the United States, Australia and New Zealand, indicates a
commonality in the reasons for adoption, despite the differences of approach to definition and
regulations (Bhaskaran et al. 2006; Childs 2006; Geier 2006). The industry has huge
prospects in domestic and international markets. According to the Organic Trade Association
(2010), organic food and beverage sales represented approximately 4.0% of all food and
beverage sales in 2010 globally. The United States’ sales of organic food and beverages have
grown from $1 billion in 1990 to $26.7 billion in 2010 and sales in 2010 increased by 7.7%
over 2009. The highest growth category in sales of organic product during 2010 was fruit and
vegetables, up 11.8% over 2009.
The organic market is described as a child of necessity that resulted from a backlash
against industrialised agriculture, which is seen as responsible for environmental problems
such as soil erosion, land degradation, spray drift, waste and polluted ground water and
reduced biodiversity environment (Organic Research Centre 2008; Winemaker's Federation
22
of Australia 2002). Such problems have led to the development and application of
Environmental Best Practices for regional and national adoption to improve the image of
industries and their relationship with the environment (Pretty 2008; Seufert, Ramankutty &
Foley 2012; Winemaker's Federation of Australia 2002).
The reasons why consumers chose organic products are notably consistent across
products, cultures and time (Hughner et al. 2007) i.e. for the perceived environmental and
health benefits. The major platform upon which organic products are promoted to consumers
is reported to be health and environmental benefits (Organic Research Centre 2008), but the
support for these benefits claim is not even. The perceived superior health claim attracts more
consumers to organic products than the environmental benefit, which is a lower order priority
(Aertsens et al. 2011; Mondelaers, Verbeke & Van Huylenbroeck 2009). However these
attributes play a critical role in consumer preference for most organic products (Crisp et al.
2006; Loureiro 2003; Organic Research Centre 2008). There are some consumers whose
primary reason for purchase/consumption is not for the health or environmental benefit.
Organic wine is reported to be purchased for prestige and social image and this has been
recommended as a strategy for marketing organic wine to female consumers segment (Mann,
Ferjani & Reissig 2012).
Increasing awareness about health and the environment has profound effects on
consumer behaviour towards organic products, with the market expanding globally at a
remarkable rate (Bhaskaran et al. 2006; Childs 2006; Geier 2006). Childs (2006) reported that
the concept of the organic market in the early organic movement was tied to small-scale
sustainable environmentalism. However in the past decades there has been expansion in the
organic market beyond the imagination of its early founders, with increased production and
consumption of varieties of organically produced foods and drinks.

23
According to Siderer, et al. (2005); Organic Research Centre (2008), the increasing
worldwide demand for organic products is in part the result of food crises which occurred due
to the foot and mouth disease epidemic, bovine spongiform encephalopathy and the dioxin
contamination scandal in Belgium. Consequently consumers, especially in Europe where
such diseases were most severe, lost their confidence in conventional product and farming
practices. These situations clearly illustrate the link between consumers’ concerns with their
health and the growing demand for organic products. Interestingly the scientific evidence to
support the health claims is contested (e.g. Benbrook et al. 2008; Kaffka, Bryant & Denison
2005; Smith-Spangler et al. 2012).
2.3.2.2.1 Organic: the definitions and claims are confusing
According to Food Standards Australia New Zealand (FSANZ 2010), the term
‘organic’ refers to the practices of agriculture and its related secondary processes that
emphasise renewable resources usage that leads to sustainability in soil, water, and energy
with the consequences of environment maintenance and improvement, a better attitude
towards animal welfare needs and optimum production of products without the use of
synthetic chemicals and non-essential food additives. Relating the definition to the wine
market, the term ‘organic’ means wine produced from organically grown grapes, indicating
that only the cultivation of vineyards forms the basis for organic classification. However, this
definition has expanded with some organic wine producers applying specific oenological
processing methods in line with organic farming principles (Trioli & Hofmann 2009).
In terms of what is organic and what is not, there still exists confusion surrounding the
term. The proliferation of environmental claims, terminologies and eco-labels has confused
many consumers, thus creating uncertainty about which claims to trust and how best to make

24
environmentally friendly products accessible for purchase (Crescimanno, Ficani & Guccion
2002; Thøgersen 2006).
The meaning of ‘organic’ is noted to vary despite similarities between countries and
so are the associated regulations. According to Gil et al., (2000), ‘organic’ describes the
farming practices that produce products with the use of organic manure to the exclusion of
synthetic fertilizers, pesticides, chemicals or growth promoters of any type, including
hormones and antibiotics. This definition and that of FSANZ (2010) is noted not to hold true
to type for all organic wines and some other products that undergo secondary production
stages.
The United States Department of Agriculture (USDA) defined organic wine as wine
made with organic grapes with the provisos that: (1) wine made from grapes grown under
100% organic conditions with no added sulphites is ‘100% organic’, (2) when it contains 100
parts per million of added sulphites and the grape grown in 95% organic conditions, the wine
is classed ‘organic’ and (3) when it contains more than 100 parts per million of added
sulphites made from grapes grown in 70% organic condition it is classified as ‘made with
organic grape’. The classifications above and similar ones arguably cause confusion and
further cloud consumer’s understanding of what actually is organic wine and what is not.
From consumer perspective, Fotopoulos and Krystallis (2002) report the low
penetration of organic products in Greece is a combination of constraints that include
consumer’s low real awareness, low product availability, lack of educational/communication
actions, conflicting perceptions, and high price. The producers of organic wine however are
faced with limited chemical use; longer gestation for grapes that will not yield to its
maximum potential; labour intensive; small economy of scale and high certification cost. The
result is higher cost in terms of production losses from weed pressure and diseases (Jonis et
al. 2008; Wright & Grant 2011; Wynen 2002).
25
Organic product marketing is affected by consumers’ trust of health and environment
claims, as well as trust in regulatory bodies. As the organic markets grow, infractions that
involve fraudulent behaviour in the market have also grown. These infractions have negative
effects upon consumer confidence in organic produce, and also make consumers doubt the
health, environmental and other claims made (Endres 2007).
2.3.2.2.1.1 Sustainability is important to the future of organic wine consumption
Sustainability of organic production defines the “resilience” of production systems to buffer
shocks and stresses and the “persistence” to withstand the shocks and stresses over long
periods in the cause of creating positive economic, social and environmental outcomes
(Pretty 2008; Seufert, Ramankutty & Foley 2012). Sustainable production therefore must
encompass the use of technologies and methods that: (i) do not have adverse effects on the
environment (ii) are accessible to and effective for producers, and (iii) lead to both
improvements in food productivity and have positive side effects on environmental goods and
services (Pretty 2008).
Sustainability can be seen as a key strength of organic production to provide
livelihood to producers, healthy lifestyle for consumers and better living environment for all;
nevertheless, this claim has varied outcomes in previous studies. Organic production
sustainability has shown promising results. Some studies suggest that yield will be
continually low (de Ponti, Rijk & van Ittersum 2012; Remaud & Sirieix 2010; Seufert,
Ramankutty & Foley 2012; Wright & Grant 2011). Wheeler and Crisp (2010), evaluating a
range of benefits and costs of organic and conventional production in a Clare Valley vineyard
in South Australia, found that there is some evidence that organic viticulture is a sustainable
system and can produce higher quality produce. They note that though yields are overall

26
lower on the organic blocks, there is no significant yield penalty when identical grape
varieties were compared.
Jonis et al. (2008) reported four important hindrances to the organic market
sustainability to include low product knowledge among consumers, high product price, strong
competition with conventional wine and poor business and marketing strategies. These
hindrances vary across products and countries depending on levels of awareness, consumer
demand and regulations.
2.3.2.2.1.2 Organic: the health claims are diverse and often conflicting
Several studies have presented diverse findings about the health claims of organic
products. Benbrook et al. (2008) matched 236 valid pairs of organic and conventional
products across 11 different nutrients. They found that 61.0% of organic products matched
had more nutrients than the conventional products. Also, they noted that the organic samples
had higher concentrations of polyphenols and antioxidants in about 75% of 59 matched pairs.
They conclude that increasing the consumption of these nutrients through the consumption of
organic product rich in them is vital to improving human and animal health.
Kaffka, Bryant and Denison (2005) reported that the concentration of two types of
flavonoids - quercetin and kaempferol, were respectively 79% and 97% higher in organic
tomatoes than conventional ones; their presence almost doubled as a result of the application
of organic manure based nitrogen to the plants. These flavonoids are antioxidants which have
been proven to fight aging and prevent some chronic diseases.
Some studies have not supported the health claims of organic products. According to
Hollingsworth (2001), consumers are slow to embrace organic food and wine as a result of
health claims, many of which have little visible or quantifiable effect. Smith-Spangler et al.
(2012), used 200 peer-reviewed studies to examine differences between organic and
conventional food and concluded that organic foods may reduce exposure to pesticide
27
residues and antibiotic-resistant bacteria, but there is a lack of concrete evidence that organic
foods are significantly more nutritious than conventional foods. This is an important factor
that has the capacity to negatively moderate consumer attitude and behaviours towards
organic product, and influence consumer’s WTP a premium for any perceived benefit from
organic products.
2.3.2.2.1.3 Organic: the perception of the environmental claims is also diverse
According to DAFF (2004), the strongest case for organic production is the
environmental claim. The key to increasing consumption of organic products is to promote
the perceived environmental benefits and natural methods of organic production. According
to Saher, Lindeman and Hursti (2006), consumers embrace the environmental benefits of
organic products from scientific proofs point and, also rely on personal experience,
conviction and beliefs in the products providing the benefits to make purchase. In Australia,
despite gradual acceptance of this claim, there is a segment of the market that does not
believe organic wine has any environmental usefulness (Mueller & Remaud 2010).
The finding of Bazoche, Deola and Soler (2008) about French wine consumers
indicates that wines with perceived environmental benefit and conventional wines are valued
to be no different, while Loureiro (2003) reports that Colorado wines consumers put more
value on the environmental status of organic wine and are willing to pay more for the
environmentally friendly wine if they can perceive the quality difference from the
conventional wine.
According to DAFF (2004), most consumers who are favourably disposed to the
environmental and health benefits of organic product are unwilling to pay as much for the
benefit as the price premiums often attached to products.

28
2.3.2.2.2 Attributes of organic wines are valued differently
Mann, Ferjani and Reissig (2012) in their Europe study and Tsourgiannis, Karasavvoglou and
Nikolaidis (2013) reported two important attributes that determine whether a consumer will
choose organic wine: (1) the perceived health effects of organic wine, and (2) perceived
status image attached to organic wine consumption. The social value of organic wine as a
high-status drink in Europe represents the reason for this latter preference.
The taste attribute of organic wine received some criticism in the time past. ORWINE
(2007) argue that the negative perception of the taste of organic wine stems from the early
stages of organic wine production, when production know-how was inadequate. The
perception is not true anymore but its poor image remains, particularly in non European
countries. Thøgersen (2007) reported Danish consumers’ attitudes toward organic product
consumption was consequent on the beliefs that organic products are better for the
environment, taste better and are healthier. Remaud and Sirieix (2010) using a sample of 151
respondents, found that consumers’ perception of conventional, organic and biodynamic wine
is the same regarding the environmental and health claims.
2.3.2.2.3 The certification processes of organic product are concerning
Credibility of the certification processes is a concern for both consumers and
producers. The plethora of certification bodies and their diverse criteria are confusing,
impacting on consumer trust and their WTP (Herberg 2007). The constant debate about what
the certification process and interpretation should be, the many conflicting regulations, and
how standards should be communicated on the labels of organic products only serve to
confuse the market and increase consumers’ perception of risk.
Organic Trade Association (2010) reports the difficulties in the implementation of
certification agreements. The association noted that 15 member countries of the European
Union enacted regulations for marketing organic products applicable to each member

29
country. The expectation is that regulations will apply uniformly throughout EU countries
and thus create a level playing field. While it is expected that these regulations would
improve exports, the opposite has been the case, as individual country tinkered the
implementation thereby recreating the inconsistency that the regulation is to solve (Jonis et al.
2008; Organic Trade Association 2010).
One consequence of inconsistency in regulation of the market, particularly to the
small organic farmers, is confusion around the organic certification process and regulation
caused by using similar and largely undefined terms such as ‘green’, ‘natural’, ‘eco-friendly’
and ‘locally grown’ to indicate organic produce (Wheeler & Crisp 2010). This inconsistency
not only causes confusion, but can also lead to unsuspecting consumers unwittingly
purchasing non-organic produce.
Eco-certification should provide consumers with some assurances for the premium
price paid for organic products purchases. However, despite the general association of a price
premium with certified products, the lack of consumers’ understanding of eco-certification
has led to negative impact on price premium for eco-labelled wine (Delmas & Grant 2008).
2.4 Consumers’ behaviour in products and services acquisition are different
Gutman (1982) reports consumer purchase behaviour can be understood by
identifying the relationships between the product and the consumer’s personal values.
Consumers who value and have interest in the environment purchase organic foods and
beverages (Hughner et al. 2007; Mueller, Sirieix & Remaud 2011; Storstad & Bjorkhaug
2003).
Several studies have found that consumers are influenced internally and externally,
and that external influences—firm marketing communication, socio-cultural, environmental
and situational factors—also affect purchasing behaviour (Kotler & Armstrong 2010;
Lancaster & Massingham 2011; Schiffman & Kanuk 2006). Consumers also have influences

30
that are individually determined— demographic, psychological, lifestyle and their economic
situation. Both internal and external influences are carried in the memory consciously or
subconsciously. Consequently, the consumers’ internal and external influences manifest in
the decision-making process they go through when purchasing products (Kotler & Armstrong
2010; Lancaster & Massingham 2011).
The organic consumer population is a relatively small one that is growing (Ehrenberg,
Uncles & Goodhardt 2004) and it is therefore likely that not many consumers exclusively
consume organic products, including wine. For the majority of consumers, organic product is
a part of the mix of their purchased products (Remaud et al. 2008). Factors such as social
demographics, information and knowledge, motivation, attitude, perception of risk and risk
reduction strategy have been studied to affect the behaviour of consumers towards products.
2.5 Importance of social demographics on willingness to pay premiums for products and
service
Attempts have been made to differentiate the organic consumer from the non-organic
consumer by their socio-demographic characteristics such as age, gender, education,
household size and income (Thompson 1998; Thompson & Kidwell 1998). Higher income
consumers have a greater propensity to buy organic products (Chinnici, D'Amico & Pecorino
2002; Hawkins, Del & Best 2003; Kiesel & Villas-Boas 2007). The results of studies on age
and consumption of organic product have not been consistent. According to Gil et al. (2000)
and Tsakiridou, Mattas and Tzimitra-Kalogianni (2006), younger consumers are unlikely to
consume organic products. Grunert and Juhl, (1995) argue that young consumers are more
likely to buy organic food, while Lockie, (2006) found indifference about organic food
consumption across all ages. While these outcomes are conflicting, they may have been
influenced by other socio-cultural dynamics of the study areas.

31
Peters et al. (2007a) and Peters et al. (2007b) report age affects how information is processed,
especially in decisions that are unfamiliar or seldom encountered. Age-related declines in
deliberative cognitive processes cause consumers to make poorer quality decisions as they get
older. Hence older adults prefer sticking to familiar products or use third party assistance
such as the service of qualified sales staff in wine stores (Lambert-Pandraud & Laurent 2007;
Lambert-Pandraud, Laurent & Lapersonne 2005).
Health and the environment concerns tend to preoccupy females more than males
(Mann, Ferjani & Reissig 2012), and females are more inclined to purchase organic products.
Squires, Juric and Cornwell (2001) report that female consumers are more interested in
organic products; Gil et al. (2000) in their segmentation study found that groups with more
females tended to purchase more organic foods and are more likely to be organic product
consumers.
Education influences the purchase of organic products: consumers with tertiary
educational qualifications are more likely to consume organic products compared to those
who have not attained tertiary education (Denver, Christensen & Krarup 2007; Krystallis,
Fotopoulos & Zotos 2006). Household size is also reported to influence consumption of
organic products, particularly where there are children in the household. Households with
young children are more conscious of health; therefore will purchase more organic food
(Chryssohoidis & Krystallis 2005; Tsakiridou, Mattas & Tzimitra-Kalogianni 2006).
Govindasamy and Italia (1999) found some socio-demographic characteristics affect WTP
premium for organic produce. They constructed a profile of household likely to purchase
organically grown produce at a premium price and conclude that smaller and high-income
households are the most likely willing to pay premium on organic fresh produce.
The reasons why different consumers buy the same or different products can be hard
to identify. Without knowing their motivations and the social concepts that define and mould
32
them as individuals and members of various social groupings, one can never truly understand
consumers (Dunn 2008).
2.6 Consumer needs and motivation
Consumers’ motivation has been reported as the attribute that encourages action to be
taken in any circumstance (Broussard & Garrison 2004). Motive according to Guay et al.,
(2010) and McCarthy, et al., (1994) is the property that organises behaviour and defines its
end state. Human behaviour therefore creates patterns and is best understood through
inference that is guided by a purpose or goal.
Motivation is not observed, but its representative behaviours are. Motive or goal-
directed behaviour serves the vital function of meeting the needs of consumers, and their
behaviours vary with the type of needs and the environment (Douglas & Craig 2011).
Awareness of health, wellbeing and the need for a sustainable environment are
motivators that influence an increasingly organic conscious market place (DAFF 2004;
Bhaskaran et al. 2006; Childs 2006). The expectation is that consumers should start to change
the way they live and adapt behaviour that has positive impacts on society and wellbeing.
Several studies have concluded that health, which is linked to security value, is the strongest
motive for purchasing organic food (Botonaki et al. 2006; Chryssohoidis & Krystallis 2005;
Millock, Wier & Andersen 2004; Padel & Foster 2005).
Need/motive—whether physiological or psychological—also affects WTP for organic
product, either directly or through the mediation of attitude toward products (Kotler &
Armstrong 2010; Schiffman & Kanuk 2006). For instance, a consumer purchasing wine
mainly for socialisation may have a different mindset relative to one purchasing for its health
and environmental benefits. The overall disposition of the consumer towards a need
influences attitude towards the products and can influence WTP for a novel organic product
(Novack 2010).
33
The motive of a consumer towards buying a product affects the involvement of the
consumer with the product. A more contemporary approach to consumer involvement
reinforced the notion that consumers have differing attachments to products (Schiffman &
Kanuk 2006). An individual’s attachments may be quite different from that of his or her
family or friends in intensity and nature. This understanding of consumers’ varying
attachments—how they are formed, how they are maintained and influenced—is of interest in
WTP and other consumer studies. Schiffman & Kanuk (2006) noted that consumers have
different types of involvement for different products. Consumers can be involved not only
with a product but also with the purchasing processes, consumption of the product and the
communications process and their involvement can be influenced by inherent need for the
product or situation driven (O’Cass 2000; Ogbeide & Bruwer 2013).
Pleasure, sensuous indulgence and socialisation are some of the motivations of wine
consumers (Bruwer & Li 2007; Bruwer, Li & Reid 2001; Cohen & Chakravarti 1990).
Magnusson et al. (2001) found that taste was the most important purchase consideration
among Swedish consumers buying edible organic product. Stobbelaar et al. (2007) found that
for the Dutch, as with the Swedish, taste ranks as the most important motive for consuming
organic products, while social value such as prestige has been reported for the consumption
of organic wine in Switzerland (Mann, Ferjani & Reissig 2012). Other research findings have
shown a significant link between consumer’s health-related attitudes and consumption of
organic product (e.g. Kim, Suh & Eves 2010; Magnusson et al. 2003; McEachern & McClean
2002; McEachern & Willock 2004; Stobbelaar et al. 2007).
Though Batte et al. (2007) noted that studies have consistently found consumers
expect to and are willing to pay more for organic products, Penn (2010) findings on organic
wine suggested otherwise. Organic wine consumers are cautious or wary of the benefit
outcome. Orth (2005) found that an inverse relationship between consumers’ inclination to

34
take risks in wine purchases and that their desire for environmental benefits leads to a
negative motivation. This often motivates consumers to avoid mistakes rather than maximise
the benefits in purchasing situations (Arts, Frambach & Bijmolt 2011; Mitchell 1999; Nena
2003).
2.7 The role of product knowledge in the acquisition process
Information search and extension are some of the behaviours displayed by consumers
when they have interest in products. The level of knowledge has been found to influence the
consumer’s ability to perform complex tasks in the purchasing and consumption processes
(Hayes-Roth, Waterman & Lenat 1983).
The study by Hershey and Walsh, (2001) on the ability differences between a
proficient consumer and a novice stressed the importance of accuracy of knowledge. They
reported that novices may or may not comprehend the meaning of all attributes of product,
but certainly do not understand the importance of the attributes. In other words, demonstrable
effort is required in learning processes to gain an understanding of any product’s attributes.
Therefore, the willingness to gain product knowledge in its entirety is a function of
the relevance of the product to the consumer. Consumers who have product knowledge are
competent and better decision-makers; they are more able to control chance events and make
an informed choice (Langer 1983; Rao & Bergen 1992; Rao & Monroe 1988; Rosch et al.
1986).
2.8 Attitudes of consumers towards a product
According to Fishbein and Ajzen, (1980), a person’s attitude towards an object is
positively linked with actions taken towards the object, but can be affected by different
factors that cause learning to take place prior to attitude formation. Attitude mathematically is
the sum of the individual’s evaluative judgments for each attribute of the object multiplied by
the consumer’s belief strength that each attribute is actually in the product, stated as:

35
Ao = Σni=1eibi (1), where Ao is attitude towards the object, ‘i’ is the attribute of the object,
‘n’ is the total number of attributes of the object, ‘ei’ is a person’s evaluative judgment for the
attribute, and ‘bi’ is a person’s belief strength that the attribute is actually in located in the
object. A person’s evaluative judgment for an attribute represents how much he/she cares
about the presence of that attribute, while a person’s belief strength represents how much
he/she believes that this attribute is actually in the product.
Research has focused on examining the effects of motives, beliefs and values on
attitudes towards organic products and WTP reporting varied outcomes. Magnusson et al.
(2003) compared health and environment motive as predictors of attitude towards the
purchase of organic product and found health motive as a stronger predictor. This finding was
not supported by Honkanen, Verplanken and Olsen (2006) who claimed environmental
motive is stronger than health in predicting attitude organic product purchase.
Consumers of organic products build their attitudes based on their own beliefs and
evaluation of any environmental and health benefits perceived (Tsakiridou, Mattas &
Tzimitra-Kalogianni 2006). Consequently, consumers make their purchasing decisions taking
note of other personal and social elements that impact their decision (Fishbein & Ajzen
1980). Against this background, Lutz (1991) suggest marketers must target and manipulate
consumers’ attitudes towards their product for competitive advantage by changing
consumers’ assessment of specific attributes and/or changing their beliefs that the concerned
attribute is really in the product. Hence the state of the consumer’s attitude toward any
perceived beneficial attributes of an organic product will determine their WTP for them
(Barber, Taylor & Strick 2009; Shepherd, Magnusson & Sjoden 2005; Thøgersen 2007).
Hollingsworth (2001) reported that consumers are slow to embrace organic food and
wine as a result of health claims, many of which have little visible or quantifiable effect.
However, beliefs may be formed through lifetime experience, as a result of direct observation

36
or indirectly by accepting information from outside sources (Ajzen and Fishbein 1980).
Therefore, the effect of knowledge and information on the individual’s attitude on WTP for
organic wine may be impacted upon by the individual’s beliefs about the attributes of organic
wine.
2.9 Risk and its importance
In every activity, whether formal or informal, public or private, social or business,
Renn and Schweizer (2009) and Bouder, Slavin and Löfstedt (2007) suggest that there are
some elements of risk, real or apparent. This implies that individuals make decisions in risky
environments all the time, and consequences of their decisions are generally not known at the
time they are made (Renn 2008; Turner et al. 1990).
It is reported that perceived risks are not taken for the fun of it; rather, they are
incurred because they are integral elements in any activity which is aimed towards achieving
human needs or purposes (Bouder, Slavin & Löfstedt 2007). A consumer intending to
purchase unfamiliar product will have many questions about the product such as: Will it meet
my needs? Will I get value for money? What will people say about me buying or using the
product? or Is the product made ethically?.
All these and many more questions constitute uncertainty to consumers which must be
resolved before the decision to buy or not to buy is made. Other risks the consumers face
include whether the product is safe for consumption or use. Therefore consumers try to
ensure a guarantee of product safety such that no hazards are present and threats to the health
of the consumers; this can be the case for wine very high in sulphite (FSANZ 2005).
2.9.1 The concept of risk perception
Different disciplines including marketing have developed specific perspectives on risk
and response to risks according to their own risk constructs and images (Bouder, Slavin &
Löfstedt 2007). The image so formed is referred to as ‘perception’ in the psychological and

37
social sciences (Boholm 1998; Renn & Rohrmann 2000; Slovic 2000). Risk perception can
be said to be the contextual aspect that consumers consider when deciding whether or not the
risk associated with acquisition of products should be taken, as well as what risk reduction
measures are available to ameliorate it.
2.9.1.1 Consumer perception of risk
Several authors have made contributions to the concept of consumer risk perception.
The notion that consumer behaviour in purchase situations involves some risk was first
introduced by Bauer (1960) who posited that any actions of consumers will produce
outcomes which cannot be anticipated with certainty and might be unpleasant. The
uncertainty of outcomes relates not only to the uncertainty inherent in the product itself, but
also uncertainty in place and mode of purchase, degree of financial, social and psychological
consequences, and all the subjective uncertainties experienced by the consumer (Cox & Rich
1964).
Perceived risk comprises inherent and handled risks. Arjun (1998); Bettman (1971);
Wu and Olson (2010) report that inherent risk is a covert risk to the consumer according to
product class and that it is cumbersome because of the perceived difficultly in determining its
level. This results in inconsistent inherent risk scenarios for different consumers.
Handled risk, on the other hand, is operationalised by the amount of conflict a product
or product class causes when the purchaser chooses a brand in a particular buying situation
(Arjun 1998; Bettman 1971; Wu & Olson 2010). Handled risk, therefore, includes the effects
of information, risk reduction processes, and the degree of risk reduction provided by familiar
buying situations.

38
2.9.1.2 The importance of perceived risk
Products whether new or existing, conventional or organic have been studied to have
some elements of risk or perceived risk in the eyes of consumers. This is based on the
premise that consumers do not have complete knowledge of the product attributes,
functionality and societal implications (Lee & Lee 2011; Myers & Sar 2011).
Other importance includes usefulness in explaining consumers’ behaviour in avoiding
mistakes at the expense of maximising utility in purchasing situations (Arts, Frambach &
Bijmolt 2011; Conchar et al. 2004; Mitchell 1999; Nena 2003) and making decision on
financial resource allocation (Mitchell 1999).
2.9.1.3 The importance of perceived risk in wine
Wine is a product for pleasure and social connection; when it is purchased or
consumed there are usually some considerations of perceived risk to consumers. Mitchell and
Greatorex, (1989) stated that the major perceived risks in wine are those of taste, social
approval and whether wine will complement a meal. These risk perception factors have a
psychological undertone regarding social image of consumers (McCarthy et al. 1994).
Greatorex, (1989) reported that price of wine is not considered to be particularly important as
a risk compared with other risks; however, Grewal, Gotlieb and Marmorstein (1994) suggest
that perceived financial risk is a key determinant of a consumer’s willingness to pay for new
or innovative products.
2.9.1.4 The measurement models for perceived risk
To measure perceived risk, Cunningham (1967) proposed a two-component model,
with each dimension—uncertainty and seriousness of consequence—measured on four-point
scales:
Risk = PNC + INC, where ‘PNC’ is the probability of negative consequences occurrence and
‘INC’ is the importance of negative consequences occurrence.

39
This two-component model, or variations of it, has been the mainstay of perceived
risk research over the past decades. Peter and Ryan (1976) opined that the two components
are usually combined multiplicatively to give an overall indication of perceived risk:
Risk = PNC x INC
Although the logic of this multiplicative model is not provided in the literature, its
root may be linked to probability theory, where probabilities are multiplied by monetary
value to determine the expected values of gambles (Peter & Ryan 1976). Supporting the
additive model, Bettman (1973) suggests that an additive model is better for analysing
perceived risk; although the coefficient values were quite close for the two models.
Joag, Mowen and Gentry (1990) using a simulated industrial setting found that when
a decision involves multiple occurrence (e.g. purchasing 100 personal computers), decision
makers combine probabilities and outcomes to form their risk perceptions in a manner
consistent with a multiplicative information integration model. In contrast, when a decision
involves a single trial (e.g. purchasing one large mainframe computer), information is
combined in a manner consistent with a non-multiplicative integration pattern. Given the
research evidence, an additive model would better predict risk perception in most cases than a
multiplicative model.
2.9.2 Management of perceived risk: Risk reduction strategy
The ways consumers perceive risks determine the handling, thus making the
perception of risk as one of the main focus of attention in buying situations, particularly with
new products (Slovic 2000). Communication provision that is better adapted to actual
consumer concerns is reported as essential for handling perceived risk (Renn & Schweizer
2009). This communication is often referred to as risk reduction strategy (RRS).
RRS is a practical information or knowledge impartation measure designed to
increase the ability of consumers to limit perceived risk in buying and consumption situations

40
(Allio 2005). Choo (1996) suggests that the objectives of RRS are for the consumers to
become well informed, mentally perceptive and enlightened through the communication of
concise practical information on the intrinsic and extrinsic cues about a product, purchase
environment, occasions, and other areas of concerns to consumers.
Jansson-Boyd, (2010) found that the risk communication process falls into two major
groups. The first process comprises an interactive, sharing risk reduction strategy and the
second process involves providing guidance to consumers about how they can most
effectively reduce the risks associated with products. The former involves creating awareness
for consumers to make informed judgements about which products to acquire and the latter
emphasising the benefit in the products consumers have chosen to purchase.
According to Kotler and Armstrong (2010), Jansson-Boyd (2010) and Schiffman et al.
(2006), consumers obtain information from any of several sources which can be personal
(information from family, friends, neighbours, acquaintances), commercial (information from
advertising, salespeople, dealers, packaging, displays, websites), public (from mass media,
consumer-rating organisations), and experiential (such as handling, examining, using the
product). Using these sources, consumers gather more information which helps them to make
choice between products being considered.
2.9.2.1 Risk reduction in wine
Since the works of Gluckman (1990) and Ward and Sturrock (1998), more studies
have been done in RRS in wine acquisition but less, compared to other products, in perceived
risk theories and measurement in general. The degree to which consumers perceive risk types
has been studied to be affected by their exposure to RRS, personal value or self-concept and
the consumption situation. Mitchell and Greatorex (1989) suggested that buyers of products
which evoke a certain kind of risk have a variety of ways open to them for relieving their risk
tensions.

41
Wine consumers have been studied to use risk relievers such as: (1) opportunity to
taste (Johnson & Bruwer 2004; Mitchell & Greatorex 1989), (2) personal recommendations
(Nisbet & Kotcher 2009), (3) free samples (Schiffman & Kanuk 2006), (4) store
reputation/image (Lockshin & Kahrimanis 1998; Semeijn, Van Riel & Ambrosini 2004;
Slovic 2000), (5) product knowledge and information search (Arbuthnot, Slama & Sissler
1993; Cox 1967; Ward 1996), (6) product/brand loyalty (Kerstetter & Cho 2004; Lockshin &
Spawton 2001), (7) the bring your own bottle (BYO) of wine phenomenon (Bruwer & Nam
2010) and (8) product price (Benjamin & Podolny 1999; Oczkowski 1994).
The knowledge of a product’s quality make-up is important: this enables price to act
as a surrogate such that perceived product quality may equal a high price which is acceptable
to consumers. The corollary is that the more consistent quality of a product, the lower the
perception of financial risk (McCarthy & Henson 2005); hence it is arguable that higher
prices serve as a financial risk reliever.
To be able to operationalise the study; the RRS attributes are reclassified for
convenience into three groups (though there is no previous literature on the classification
method): (1) intrinsic product-related RRS; (2) extrinsic product-related RRS; and (3)
extrinsic store-related RRS.
For intrinsic product-related RRS, the knowledge of the sensory attributes is used to
explore the consumers’ strategy. The use of knowledge of cues such as price, brand,
packaging, labelling, region or country of origin defines extrinsic product-related RRS while
for store related RRS, classification relates to source of purchase attributes which include
good customer service, a welcoming attitude, expert service provision, store reputation,
awards/ industry recognition and store presentation.

42
2.10 Retail transformation and values delivery
This review (2.10) specifically relates to consumer willingness to pay for the expert
service of wine retailers. It highlights the evolution that has taken place in the retailers, and
the value it has created for both consumers and the retailers. The primary functions of a
retailer will always remain the same; what changes and what will keep changing is how these
functions are performed or delivered. According Rao and Bergen (1992), the 1980s were the
decade of consolidation and growth, with innovative use of information technology, supply
chain logistics and pricing—this approach negated meeting specific needs of certain types of
customers. ‘The Gap’ stores expanded upon innovations by reinventing the specialty store in
the 1990s with a narrow assortment of private-label goods and a novel presentation and store
experience. It is the model that most specialty stores have followed since (Johnson 2011).
The 2000s saw the rise of e-commerce: major global players like Amazon sought to
enhance consumers’ emotional connections to brands and provide a point of difference in a
hyper-competitive environment. In 2001 Apple changed the direction of retailing by offering
the ‘Apple Store Experience’ which allows customers to interact, learn and experience the
values of the brand through in-store design features and staff service. The result was a switch
by rival’s customers to Apple, as well as enhancing relationships with existing consumers
(Johnson 2011).
Past studies indicate that the principal components that attract and engage consumers’
attention in a retail setting are the static design and dynamic elements. Static design elements
are the physical features of the store that facilitate the functional characteristics of products
and are known to create sensory and psychological benefits, such as visual and auditory, as
well as feelings of status, privacy and security (Csikszentmihalyi 1997). Therefore static
design elements are the sum of the aesthetic qualities that include: (1) the goods the store
sells (2) the environment of the store which includes signage, packaging, catalogues and

43
other materials that project the store’s identity and image; (3) the experiential theme/message
which increases consumer’s consumption rate, their customer product evaluations capacity
and also their purchase behaviour. These elements are static, as they are delivered in a pre-
designed state.
Static store design elements are important, but more useful are the interactive
components of retailing that involve the exchange of information, often referred to as the
store dynamic elements. Characteristically, this presents a softer side of retailing that creates
an exchange of dynamic information, which emphasises human interaction through
customer–staff–store interface. Csikszentmihalyi (1997) amplified the definition of the
dynamic elements of a store as the relational milieu between the customer, the store, the staff
and other customers. The advantage here over static design elements is that a relational
milieu allows the customer to identify with the retailer and helps create a sense of belonging.
In addition, dynamic design elements, which can consist of themes and theatre, exploit the
warmer human side of an interactive in-store experience (Winemakers Federation of
Australia 2000).
Despite a few exceptions, existing experiential retail studies have focused mainly on
the isolated testing of atmospherics, ambient conditions and service-scaped architecture,
which are the static design elements of retail stores (Famularo, Bruwer & Li 2010). For
example, current research often examines the effect of different styles of music on store or
product quality perception, rather than how consumers holistically experience music in a
branded space. This narrow approach does not allow for the total determination of its effects.
Priem (2007) initiated the "consumer benefit experience" (CBE) perspective (or
consumer perspective) as a potentially important alternate viewpoint for strategic
management of market. The bases for the initiative include; that consumers are an important
consideration in market strategy formation as they are to experience benefits essential to

44
business success. This means value creation, by offering benefits that induce payments from
willing consumers.
From a store-customer relationship standpoint, Porter (1985) suggests the provision of
customer experience as a tool for increasing business revenue, and Priem (2007) provides
some mechanism for addressing the management issues that can arise from the approach. The
bases of store-customer relationship centres on value – (creation, use and exchange) and
Bowman and Ambrosini (2000) defined use value to mean the subjective evaluation of
benefits derived by a consumer from product usage while exchange value is the amount the
consumer actually pays which represents revenue to a value system.
Aiding consumers in maximizing the use value that is created and experienced during
consumption is a key function of the retailer, irrespective of the exchange value paid. Hence,
wine retailers can be viewed apart from creating value during consumption, as aiding
consumers in the maximisation of value (Madhok 2002; Priem 2007).
According to Hsieh and Stiegert (2012), specialty stores provide consumers with
high-priced upscale product offerings; and a higher level of service that constitutes value to
the consumers. Betancourt and Gautschi (1990) examined what constitutes value to a
consumer in retailers’ services and concluded that the depth and width of product
assortments, location convenience, and on-site information, and such other services that
reduce consumers' costs in time, transportation, and information gathering in purchase
situation are the components of value. These value components provisions to wine consumers
are usually provided as complementary services except in the restaurant situation where
corkage is charged for consuming wine brought into restaurants from other sources (Bruwer
& Nam 2010).
The assessment of value retailers provide to consumers in monetary terms stemmed
from nonmarket valuation system and has transverse marketing allowing the use of expert-

45
based system to provide value. Consumers with low product and purchase information are
more highly rewarded in expert-based systems, in part because experts have reputation-driven
incentives to aid consumers with value in a symbiotic relationship, wherein the benefit to
expert (retailer) is enhanced by the benefit of the consumer (Priem 2007).
According to Csikszentmihalyi (1997) retail experiences consist of a holistic package
of amusement, aesthetic, escapism and information that allows interaction between all static
and human elements within the experiential environment. It is the flow between static and
human elements that encourages and wins the consumer’s interest and engagement within the
retail occasion (Kozinets et al. 2002).
Lockshin and Kahrimanis (1998) and Boatto, Defrancesco and Trestini (2011) found
buyers do not distinguish perceptually between stores that have different names and
managerial control if they have similar attributes. For a store to have a competitive advantage
over others, the store must focus on hiring and training their staff to be friendly and
knowledgeable as front line employees that represent the store and performing a marketing
function.
2.11 Introduction to willingness to pay
Willingness to pay (WTP) is the revealed or stated preference of respondents in
surveys about an outcome in a real or hypothetical situation. It is a measure for presenting the
maximum monetary payment a person is willing to make as a consequence of the derived
utility to be obtained from a (new) product (Lusk et al. 2001). An in-depth review of WTP is
made after a review of price in relation to purchase payment.
2.11.1 Price in relation to payment for purchase
Price plays a dual role in the consumer’s decision-making process. It is what
consumers perceive as the value of a product on sale or the amount of utility that can be
derived from consuming it, symbolised by the monetary amount that has to be sacrificed

46
when the product is bought (Dodds, Monroe & Grewal 1991). Commonly, price is an
important descriptor of quality when there are few available cues, when the product cannot be
evaluated before purchase, and when there is probability of making a wrong choice (Cox
1967b; Zeithaml 1988).
Consumers perceive price as a cost when it represents the component of objective
price of the product and the perceived price. Therefore, perceived price is the price decided
by the consumer as what is thought as the worth of a product (Zeithaml 1988). Based on the
encoded outcome, the purchaser is able to make a judgement whether the product is cheap or
expensive (Zeithaml 1988). Studies have revealed that perceived price differences occur
among individual consumers, whereas objective price variances take place between products
of the same perceived quality and different stores (Gardner 1970; Stafford & Enis 1969;
Zeithaml 1988).
Jonis et al. (2008) found that apart from strong competition between conventional
wines and organic wines, when their quality is perceived as the same, higher prices of organic
wines create constraint to growth of their market. This is not the case for consumers in all
countries; for example, in the Argentinean domestic market, many consumers are willing to
pay higher prices for organic products because of their positive perception of the benefits of
organic products (Rodriguez, Fujimoto & Mayer-Davis 2006).
2.11.2 Determining willingness to pay
WTP for organic wine benefits and expert service of wine retailers is the amount of
money that a consumer is willing to part with to gain an equivalent utility derived from the
concerned product. The WTP function indicates the price an individual is willing to pay for a
given level of quality, ‘q’, given specific levels of price, ‘p’ and utility, ‘u’ (Lusk et al. 2001).
Conventional food and wine are made to meet certain basic consumer requirements.
When a product goes beyond this level to meet functional and environmental needs, it attracts

47
a marginal price increase usually referred to as a premium. According to Rao & Burgen
(1992), price premium is the amount paid above the ‘bench mark’ price that is the true value
of the product.
The price premium for organic products is a consequence of both the higher costs of
production incurred through production loss and the higher perceived utility value these
products provide to consumers, who regard them as healthier and more environmentally
friendly. The variation in premium price is dependent on the type of product and the type and
value of purchase place where it is sold (Unnevehr, Villamil & Hasler 1999). It varies in
percentage terms from 5% to 100% or more. In Greece, for example, Fotopoulos et al. (2003)
noted that the WTP price for organic products fluctuates between 19% and 63%, depending
on the product. Brugarolas et al. (2005) reported 20.9% as the premium environmentally
concerned wine consumers are willing to pay. Remaud, et al. (2008) reported also that in
Australia, occasion driven consumers will pay up to 22.0% premium on organic wine
(Unnevehr, Villamil & Hasler 1999). Penn (2010) report that in America, California wines
consumer WTP is 13.0% higher price for organic and other sustainably produced wine than
conventional one.
2.11.2.1 Consumer willingness to pay
A large body of research abounds on consumers’ WTP for functional and
environmentally friendly products (e.g. Barber, Taylor & Strick 2009; Falguera, Aliguer &
Falguera 2012; Hamzaoui-Essoussi & Zahaf 2012; Kang et al. 2012; Michaud & Llerena
2011) and even more so on this behaviour in the retail store environment (Csikszentmihalyi
1997; Kozinets et al. 2002; Lockshin & Kahrimanis 1998; Lusk 2003; Lusk & Hudson 2004;
Shapiro 1983). Laroche et al., (2000) opined that WTP for perceived healthy and eco-friendly
products is growing as there is mounting and convincing evidence supporting consumer pro-
organic product behaviour.

48
Jolly, (1991) found that the amount consumers are willing to pay for organic products
depended on the type of food, the relative cost of a comparable conventional product and the
absolute price of the product. Williams & Hammitt (2000) in their study found that organic
food or wine consumers are less likely to consider price as important compared to those
consumers who do not and/or have never purchased organic products before.
However, consumer lack of knowledge of organic wine is a hindrance to positive
behaviour towards the product (ORWINE 2007). Thompson & Kidwell (1998) found that the
choice of organic products to purchase and the sales outlet itself are important. They suggest
that when a consumer comes into a store with an intention of buying organic products like
wine, he/she can be confused by the promotion of conventional and organic products side by
side, thus leading to an inability to differentiate between them. They further suggest that
despite this confusion, interaction between consumers with positive beliefs and attitudes, high
market maven-ship and high product availability will lead to favourable purchase behaviour,
strong intention to purchase and WTP premium for organic product benefits.
Consumers as they get older are reported to resist change and are slow to adopt
innovation as a result of decline in deliberative cognitive processes that causes poor quality
decision making (Peters et al. 2007a; Peters et al. 2007b), Jong et al. (2003) note socio-
demographic predictors do not consistently indicate a reliable relationship with WTP due to
the types of product. Urutyan and Ngo (2007) suggest that the unreliability of socio-
demographic predictors in previous studies was due to changes in the growing organic
market, and that more research should be done to obtain a clearer image of the socio-
demographic structure of the organic market. This was also a strong incentive (amongst
others) to include socio-demographic variables as a determinant of WTP premium for organic
wine benefits and the expert service of wine retailers in Australia.

49
2.11.3 Determining WTP for organic product and store service
There are three ways to elicit consumers’ WTP for preferences: personal interviews,
mail surveys and experimental auctions (Umberger et al. 2002). The National Ocean and
Atmospheric Association (1993) recommended that personal interview is best suited to elicit
information on WTP. Three main methods are used to measure WTP, (1) revealed
preference; (2) stated preference; and (3) offers of products.
2.11.3.1 Revealed preference
Revealed preference tests such as discrete choice experiment, hedonic pricing and the
Vickery auction have been used in research to reveal consumers’ preferences or WTP. This
measurement method uses data derived from actual market transactions, such as scanner data
(Ben-Akiva et al. 1994). As revealed preference data are based on actual purchases observed
under realistic marketing mix conditions, it has been assumed to have a high degree of
external validity (Ben-Akiva et al. 1994; Chang, Lusk & Norwood 2009; Hofacker, Gleim &
Lawson 2009).
Discrete choice modelling or discrete choice experiment (DCE) as is popularly
referred is a model that draws upon Lancaster’s economic theory of value (Lancaster 1966).
Its assumption is based on consumers deriving utility from product attributes rather than the
product itself. DCE uses experimental design to create products at different attribute levels,
and respondents are made to choose a product from each set. The benefit of this method is
that it provides the respondents with a task similar to what they face in the real market
situation (McFadden 1974).
Scanner data or simulated markets characteristically captures only those buyers whose WTP
is as high as the posted price, and probably non-buyers whose WTP is lower than that price.
It does not recognise buyers who may be willing to pay above the posted price (Ben-Akiva et

50
al. 1994; Hofacker, Gleim & Lawson 2009). Scanner data cannot be used to assess WTP
where there are no previous sales data, thus making it unsuitable for researching new product.
Apart from the general issues with the revealed preference approach, the hedonic
pricing model (first applied in the automobile industry) is problematic in terms of interpreting
the error term (Wijnberg 1995).
2.11.3.2 Stated preference
Ben-Akiva et al. (1994) described stated preference as behaviour based intentions and
responses to hypothetical choice situations. In stated preference, researchers have used either
conjoint analysis or contingent valuation procedure. Conjoint analysis in past studies is
mainly based on rankings, ratings or choice decisions concerning product profiles which are
described on multiple attributes including price (Fields & Gillespie 2008; Green & Srinivasan
1990; Kalish & Nelson 1991; Sattler & Volckner 2002).
The contingent valuation approach is to ask consumers directly to state their WTP for
entire products or for the attributes (Kalish & Nelson 1991). Similar to contingent valuation
approach are other closely related techniques such as self-explicated models, where survey
participants are asked to rate various product attributes and attribute levels according to their
preference (Green & Srinivasan 1990).
Adamowicz and Louviere (1998); Hoffman et al. (1993); Roe and Just (2009);
Wertenbroch and Skiera (2002) highlight the deficiency of stated preference; external validity
is constrained by lack of incentive for consumers to honestly reveal their WTP as the
responses are hypothetical in nature.
2.11.3.2.1 Conjoint analysis
Conjoint Analysis (CA) is a multivariate technique used to understand how
consumers develop preferences for certain products and is useful in new product development
(Hair et al. 2010). This method evaluates the value of a product by combining the separate

51
amounts of value provided by each attribute. In a conjoint analysis context, consumers are
faced with a choice between alternative products, defined by different attributes such as price
and quality (Lusk & Hudson 2004).
2.11.3.2.2 Contingent valuation method (CVM)
Contingent valuation is primarily used to assign monetary value to environmental and
public goods. It has been extended to the determination of WTP for private goods that do not
yet exist or are not well defined. Maynard and Franklin, (2003) measured WTP for a non-
market good by creating a hypothetical market for such a good.
Brugarolas et al. (2005) applied CVM to measure the premium consumers are willing
to pay for an organic wine. Owusu and Anifori (2013) used it to determine WTP for organic
fruit and vegetable in Ghana. Kandeepan (2008) employed CVM to explore WTP for organic
egg plant in Sri Lanka. In Italy, Boccaletti and Nardella (2000) used it to determine
consumer willingness to pay for pesticide-free fruits and vegetables. Gil, Gracia and Sanchez
(2000) applied the method to explore consumers’ willingness to pay premiums for organic
fruits and vegetables in Spain.
The use of CVM to measure WTP has involved modifications to minimise the main
issues of hypothetical bias and lack of incentive to buy (NOAA 1993). CVM requires the use
of surveys or questionnaires to elicit WTP bids. The questionnaires can be designed with
open-ended or close-ended questions, and/or single-bounded or double-bounded dichotomous
choice questions to estimate the value of non-market goods, and have been extended to the
valuation of innovation products (Lusk & Hudson 2004). Gil et al. (2000) used CVM to
measure consumers’ willingness to pay for organic food products. Their study used close-
ended questions, with follow up questions that consisted of dichotomous choice options and
about maximum willingness to pay question.
52
Campiche, Holcomb and Ward (2004) used the Dichotomous Choice Contingent
Valuation Method (DC-CVM) to examine the impacts of consumer characteristics on
willingness to pay for natural beef. The respondents were asked to choose between low price
regular beef and the higher price natural beef. Those who chose to pay a premium on natural
beef were given higher premium options to choose from, and those who chose regular beef in
the first scenario were also provided an additional scenario in which the natural beef price
was reduced. Their results show that consumers’ perceptions of natural beef are much better
indicators of their willingness to pay for natural beef.
CVM has also been used to estimate willingness to pay for functional staple foods
(Munene 2006). Boccaletti & Nardella (2010) used CVM to determine consumer willingness
to pay for pesticide-free fresh fruits and vegetables in Italy. Kandeepan (2008) in the Jaffna
district of Sri Lanka, used CVM to estimate consumers’ willingness to pay for organic
eggplant. Their results indicated that WTP was significantly and positively related to income
and risk concern.
Despite its wide usage, one of the problems associated with CVM is hypothetical bias.
The method can be made incentive-compatible in market situations since the product being
valued is deliverable (Lusk & Hudson 2004).
2.11.3.2.3 Offers of products
This involves real offers of products which can be bought by respondents. The
standout in this approach is the auction method which has gained much interest. Hoffman et
al. (1993) as well as Skiera & Revenstorff (1999) cited in (Sichtmann & Stingel 2007)
advocated the use of experimental Vickrey auctions because they provide incentive-
compatible estimate of WTP (Hoffman et al. 1993). The Vickrey auction is a second-price,
sealed-bid auction where the winning bidders’ price is determined by the bid of the second-

53
highest bidder (Vickrey 1961). The dominant strategy is to exactly bid one’s WTP (Kagel
1995).
The Vickrey auction is useful but suffers practical limitations as bidders in Vickrey
auctions compete with each other for a limited stock (Hoffman et al. 1993; Sichtmann &
Stingel 2007; Wertenbroch & Skiera 2002). ). As a result, participants in Vickery auctions
tend to bid more than the products are worth. Secondly, because the bidding process and the
dominant bidding strategy appear rather complicated for the respondents, biases in the
derived WTP may arise (Kagel, Harstad & Levin 1987).
Various methods of determining WTP have been explored; important is what method
best suits this study. Sattler and Volckner (2002), evaluating the best approach to measuring
WTP, conclude that in practice stated preference data could be preferred; their reasons
include that it is a more cost-effective way to recruit respondents, as an obligation to buy is
likely to reduce the possibility to win respondents. Stated preference increases the willingness
of respondents to answer questions and reduces the effect of severe liquidity constraints
which can bias WTP downward in the context of a revealed preference procedure.
Sattler and Volckner (2002) also warned that if for these reasons a hypothetical
context is chosen, it has to be taken into account that the resulting WTP is likely to be
overestimated by 15% - 30%. This overestimation bias has been observed in studies by
Wertenbroch and Skiera (2002) and Harrison, Blackburn and Rutström (1994). Wertenbroch
and Skiera (2002) noted that CVM must be properly adjusted to avoid overpricing products
or overstating premiums. Aside from adjusting for the price, the use of cheap talk is
recommended and widely used to mitigate against the bias (Aadland & Caplan 2003;
Cummings & Taylor 1999; Mahieu, Riera & Giergiczny 2012; Murphy, Stevens &
Weatherhead 2005).

54
2.12 Theoretical framework
Following the review, two theoretical frameworks have been developed (see Figures
2.1 and 2.2). Figure 2.1 shows the framework used to determine the willingness to pay for the
environmental benefit (WTPe) and willingness to pay for the health benefit (WTPh), while
Figure 2.2 shows that used to determine willingness to pay for the expert service of wine
retailers (WTPs).
Figure 2.1 encompasses attitudinal and behavioural variables that include knowledge
of organic wine, consumer attitude, motivation, perceived risk, risk reduction strategy and the
social-demographic factors. These components will be tested to identify their effects on
consumer’s WTP for the concerned attributes of organic wine.
Figure 2.2 is designed to specifically explore and use the conceptual undertone of
perceived risk, risk reduction strategy and socio-demographic factors to investigate
consumers’ WTPs. It is worthy of mention that in the two models, some of the behavioural
independent variables despite belonging to different concept groups have the tendency to
mediate or moderate each other in predicting outcome variables. So far the conceptual
frameworks of the study are based on the underlying theories that underpin the concepts.
The complex issues concerning the WTP for organic wine benefits and the expert
service of wine retailers require a broad understanding of consumers and how they make
purchase decisions. Research from diverse disciplines must be woven together to provide a
cohesive explanation for consumers’ WTP for the attributes under investigation.
The attitude an individual displays towards a product is important in determining
intentions to purchase the item or not (Fishbein & Ajzen 1980). It is a learned predisposition
to respond in a consistently favourable or unfavourable manner regarding a given object or
concept. This perspective of attitude reaffirms its central role in analysing and predicting
consumer behaviour as it embeds the individual beliefs, whether positive or negative, about

55
an object. Consumers’ personal values and culture affect their attitudes toward organic
products, the associated benefits (refer to Bech-Larsen and Grunert (2003) and WTP a
premium for them.
However, attitude does not offer insights about key antecedent constructs relevant to
consumer behaviours. Consumers’ attitudes towards health and the environment will
influence the kind of information they seek, where they seek products and the price they are
willing to pay. Stores that are able to provide the services that meet consumers’ attitudes
towards novel products are likely to gain a premium. To link consumers’ demand for organic
wine and WTP, the defining characteristics of the consumers must be evaluated because the
tendency to respond to an object in a particular way is learned. This means that attitudes are
affected by different factors that cause the learning to take place prior to the formation of
attitudes (Bloch & Richins 1983; Fishbein & Ajzen 1980; Shaffer & Sherrell 1997).
Drawing from Alba and Hutchinson (1987) and Langer (1983), product knowledge of
consumers is affected by type and quality of information available to them. When the level of
knowledge is low or there is doubt about the knowledge or information, consumers can
perceive risk in a buying situation and could hinder WTP. The product attributes need to be
known, and consumers’ trust of health and environment claims, as well as trust in regulatory
bodies by the consumers must be established. These create a learning situation that
consumers do contend with because according to Endres (2007), violations that involve
deceptive behaviour in the organic market have negative effects upon consumer confidence in
organic produce. This makes consumers doubt the health, environmental and other claims
made. Therefore, the effect of knowledge and information on the individual’s attitude
towards WTP for organic wine may be impacted upon by the individual’s beliefs about the
attributes of organic wine.

56
Motives for product purchases are based on physiological and psychological needs
and can influence demonstrated behaviours (Maslow 1954; Olsen, Thach & Hemphill 2012;
Watchravesringkan, Hodges & Kim 2010). Nature or type of product affects attitude,
motivation and the follow up activity. Motivating product involves extensive information
search effort; consumers establish feelings regarding their attitude toward the object. These
feelings will then affect the individual’s behaviour (Novack 2010).
Figure 2.1 Conceptual framework showing factors influencing willingness to pay for the attributes of organic wine.
Adapted from Balasubramanian (2004); Ajzen and Fishbein (1980); Munene (2006)
Attitudes toward organic wine and store service will be directly affected by the level
of consumers’ motives and other characteristics associated. Consumer choices regarding
organic product purchases are often elicited as the need to improve health; however this value
is not engaged in for its purpose alone, rather as a precursor to higher goals that relate to
Consumer’s knowledge of
health, environment and
organic wine
Willingness to pay
WTPe and WTPh
Consumer’s attitude towards
organic wine
Consumer’s risk reduction
strategy
Consumer’s perceived risk
Consumer motivation
towards organic wine
Consumer demographics
and socio-economic factors

57
quality of life and well-being (Naspetti & Zanoli 2009).Therefore the value assigned to the
motivation determines the purchase and the amount paid.
Consumers’ perception of risk affects WTP. Consumers are worried about taste
environmental and health claims, unsafe production practices and health care, which are key
factors in organics consumption (Rodriguez & Toca 2006). Specifically, some wine
consumers perceive claims laid to organic product may not be correct. Hollingsworth (2001)
stated that consumers are slow to embrace organic food and wine as a result of health claims,
many of which they perceive as having little visible or quantifiable effects. The presence of
this cloud impacts on consumer decision: first whether to purchase and second how much
should be paid.
Awareness and mainly lack of adequate products information are some of the
problems facing organic products consumers (Gil, Gracia & Sanchez 2000). Naspetti and
Zanoli (2009) found that awareness about organic product has increased (and is still
increasing), however product knowledge has not matched awareness level, particularly for
occasional and regular consumers. They suggest that there is still little knowledge on how
organic products are produced and processed, and which characteristics are fundamental for
the consumer with regard to quality and safety. Convincing consumers to support organic
production and the associated social and cultural adjustments is an ongoing issue. Consumers
can be initially attracted to the organic concept because of personal reasons, but the challenge
is in communicating and cultivating the consumers' primary interest about remote consumer
benefits (IFOAM 2003).
Retail stores present an avenue for person-to-person in-store and online interactive
support in the marketing of products; which allows consumers to inquire about organic
products from the product mix on sale. It requires that the store be staffed by qualified,
knowledgeable staff to answer an array of questions that may be asked. Word of mouth is

58
often argued to be the most effective factor that affects behaviour, as it is based on how the
person feels or what they know about the product. Where the persons are perceived as experts
or opinion leaders in the domain, their recommendation reduces risk perception (Nisbet &
Kotcher 2009) and influences public perception and preference for a product positively, thus
altering their WTP behaviour.
Consumers’ demographics may also affect their attitude toward organic wine and
store service, and ultimately their WTP for organic product attributes and expert service of
the retailers. The studies by Gil, Gracia and Sanchez (2000) and Lockie et al. (2006) show
that some socio-economic factors including age, gender, education level, family size and
income level are important in determining WTP for organic product, which consumers
perceive as healthier and more environmentally friendly than conventional alternatives.
The consumers’ family life cycle creates a string of changes that occur over time in
the life of the individual family members (Loudon & Della 1993; Schiffman & Kanuk 2006).
Depending on the stage of the cycle consumers occupy, the composition of the household
may be a causal factor that influences the consumers’ WTP for wine (Chryssohoidis &
Krystallis 2005; Tsakiridou, Mattas & Tzimitra-Kalogianni 2006) or the expert service of the
retailer.
Consumers with tertiary educational qualification are more likely to buy organic
products than people who have not attained a university education and/or high school level of
learning. (Krystallis, Fotopoulos & Zotos 2006) This evidence suggests that education
influences the purchase of organic product. Also, higher income consumers are found to have
greater propensity to buy organic products due to high disposable income and can influence
WTP (Chinnici, D'Amico & Pecorino 2002; Kiesel & Villas-Boas 2007; Tsakiridou, Mattas
& Tzimitra-Kalogianni 2006).

59
In the theoretical framework for the expert service (Figure 2.2), consumers’
perception of risk is linked with the service of the retailers and how the perception affects
buying behaviours in relation to WTPs. The level of perceived risk and possible negative
consequences is influenced by the quality of the expected benefits (Jansson-Boyd 2010).
Figure 2.2 Conceptual framework showing factors influencing willingness to pay for the expert service rendered by wine
retail sales outlets.
Adapted source (Balasubramanian, 2004; Munene, 2006):
When consumers are able to assess the benefits derivable from the service of retailers as
“worth-it” or “exceed expectation”, the perceived risk is minimal and the WTPs is sustained
or higher (Agarwal & Teas 2001). The reverse will be the case if the service does not meet
expectation.
Consumers, when in doubt of what decision to make in wine purchase environment
can decide to search for information from a third party like the retail stores (Jansson-Boyd
2010; Kotler & Armstrong 2010). The store’s ability to provide guidance for the consumer to
make choice empowers the consumer for future purchase. Therefore the value of the guidance
influences consumers’ behaviour and the WTPs.
The role of social demographics in determining WTPs is theorised and applied in a
similar manner to WTPe and WTPh. It relates to how education, occupation, age, gender,
income, household type influence willingness to pay for the expert service of retail stores.
Consumer’s perceived
risk
Consumer’s risk
reduction strategy
Willingness to
pay for expert
service of retail
store
Consumer’s social
demographics

60
2.13 Statement of research objectives and questions
For the food and wine industries, the motivation behind the organic concept is to create a
niche market to commercialise an innovation claiming beneficial physiological and
environmental effects beyond those ordinarily associated with conventional or genetically
modified products (Pino, Peluso & Guido 2012). Public perception of the claims laid to
organic products ranges from acceptance, to scepticism or rejection; this will determine
whether the organic concept is to become the next success story in product marketing (Van
Loo et al. 2012).
Furthermore, knowing consumers’ attitudes about organic product is important for
wineries so that they can be best positioned to meet consumers at the point where their needs
can be adequately met (Toner & Pitman 2004). The issue here is that the consumers do not
sufficiently value the practice of organic production for processed products, and with the
plethora of organic claims for various agricultural products their enthusiasm has become
clouded with doubts (Remaud et al. 2008).
Unlike many other fast moving consumer products that may have few top
brands in their product category, wine has thousands of brands that are marketed across the
international divides. Lockshin and Kahrimanis (1998) in their wine retail store evaluation
study found that buyers do not distinguish perceptually between stores that have different
identity and managerial control if they have similar attributes. They noted that for a store to
have a competitive advantage over others, the store must focus on recruiting and training
their staff to be friendly and knowledgeable as front line employees that represent the store
and performing a marketing function. The store appearance, its employees and promotional
materials offer visible cues to customers that they use to form perceptions of store image.
Because tangibles often form consumers’ first impressions, it is important for retailers to
create an image for the store that they wish to project (Gagliano & Hathcote 1994). All these,

61
particularly employment of knowledgeable staff, will increase the cost of items at the shelf
level; consumers’ willingness to pay the margin is the critical issue here. Thus, with the
research objectives in mind the study proposes the hypotheses below.
2.13.1 Hypotheses
It has been suggested that consumers assess the outcome of purchase actions before
making the actual purchases (Fishbein & Ajzen 1980). This assessment can be consequent
upon the value to be derived from the purchase, the amount of knowledge available to the
consumers to make decisions and the level of uncertainty entertained. Knowledge can be
gained formally or informally but one benefit it provides is the ability to infuse the consumers
with confidence about making the right choice in buying and consuming situations (Alba &
Hutchinson 1987). In view of these assumptions about consumer’s knowledge of organic
wine, it is hypothesised that:
Hla: the greater the consumer's knowledge of organic wine, the greater the WTP a premium
for the environmental benefit of organic wines.
H1b: the greater the consumer's knowledge of organic wine, the greater the WTP a premium
for the health benefit of organic wines.
A consumer’s hedonistic lifestyle is positively linked to the belief that wine leads to a
more enjoyable life, but this does not lead to organic wine purchases (Olsen, Thach &
Hemphill 2012). The need or motive of socialisation with organic wine consumers is
subsumed by the health and environmental motives, because wine consumers concern is taste
first and foremost, before making a sacrifice for functional needs. Consumers can be willing
to make self-sacrifice in organic food and wine purchases because they believe self-sacrifice
is necessary for protecting the environment and their health (Olsen, Thach & Hemphill 2012).

62
Based on these postulations about consumer’s knowledge of organic wine, the study therefore
hypothesises that:
H2a: The greater the consumer’s motivation to purchase organic wine, the greater the
willingness to pay for the environmental benefit of organic wine.
H2b: The greater the consumer’s motivation to purchase organic wine, the greater the
willingness to pay for the health benefit of organic wine.
There are consumers with ‘green self-perception’ who have a positive relationship
with the intensity of organic food consumption (Squires, Juric & Cornwell 2001). However,
study by Oberholtzer, Dimitri and Greene (2005) found that certain attitudes and beliefs can
influence the likelihood of being an organic consumer. Also noted by Sirieix, Persillet and
Alessandrin (2006) Gil, Gracia and Sanchez (2000) is that most consumers have a positive
attitude towards organic products and perceive them as healthier, better for the environment,
of a higher quality and being tastier than conventional alternatives. On this assumption about
consumer’s attitude, it is hypothesised that:
H3a: The greater the consumer’s positive attitude towards organic wine purchase, the greater
the willingness to pay for the environmental benefit of organic wine.
H3b: The greater the consumer’s positive attitude towards organic wine purchase, the greater
the willingness to pay for the health benefit of organic wine.
Some products appear similar yet vary markedly in price, actual quality and ethical
issues about their production processes. These create some elements of perceived risk in the
mind of consumers. It has been studied that risk influences or transforms individuals,
organisations, and cultures in terms of serving and meeting consumer’s wants and needs
(Castaños & Lomnitz 2009; Turner et al. 1990). For example consumers intending to
purchase products that they are not familiar with or have not purchased previously have many

63
questions that beg for answers. All the many questions can constitute uncertainty to
consumers and must be answered before the decision to buy or not to buy is made. From
these assumptions about consumers’ perceived risk, it is hypothesised that:
H4a: The greater the consumer’s perceived risk in organic wine purchase, the lesser the
willingness to pay for the environmental benefit of organic wine.
H4b: The greater the consumer’s perceived risk in organic wine purchase, the lesser the
willingness to pay for the health benefit of organic wine.
The studies by Celsi and Olson (1988); Espejel, Fandos and Flavian (2009) have
proposed the use of product intrinsic and extrinsic signals as being relevant in the alleviation
of perceived risk. The choice of intrinsic risk reduction strategy, however, is assumed to be
dependent on the level of knowledge the consumer has about the product. Hershey and Walsh
(2001) found that the more knowledgeable the consumer is about the whole acquisition
processes, the more decisive and confident the consumer is, and less the perceived risk.
Consumers, particularly those inexperienced in wine acquisition, may not have the
knowledge about the intrinsic attributes of wine. Instead they use knowledge of peripheral
cues. From these assumptions about intrinsic and extrinsic risk reduction strategy, it is
hypothesised that:
H5a: The greater the consumer’s risk reduction strategy in organic wine purchase, the greater
the willingness to pay for the environmental benefit of organic wine.
H5b: The greater the consumer’s risk reduction strategy in organic wine purchase, the greater
the willingness to pay for the health benefit of organic wine.
H5c: WTP for the expert service consumers receive from wine retailers is dependent on their
perception of risk.
There is a strong need for more market information and education, especially as the
term ‘organic’ does not clearly signal any environmental and health aspects to many
64
prospective consumers (Remaud et al. 2008). Specifically referring to reseller service, Olsen,
Thach and Hemphill (2012) suggest that shelf-talkers, neck tags, web site information,
medals, critic ratings, and other useful information should be made readily available for
organic wine purchasers. According to Lockshin and Kahrimanis (1998), wine sales outlets
must focus on hiring and training their staff to be friendly and knowledgeable as front line
employees that represent them when engaged with consumers in a constructive process by
which they achieve their consumption values. According to Johnson (2011), people come to
the store for the experience, and they are willing to pay a premium for that. There are many
components to that experience, but the most important (which can translate to any retailer) is
that staff are not focused on selling product, rather focused on building relationships and
trying to make people's lives better. Building relationships is entrenched in the application of
knowledge as a problem solving tool, and is valued by all the parties involved. From the
postulations above, it is hypothesised that:
H6: Wine consumers are willing to pay for the expert service they will receive when making
purchase at the store.
There is much research about the influence of socio-demographics on consumer’s
WTP for organic products. Some studies are in support while others are against this variable
as an influencer of WTP. For example, higher income has a positive relationship with the
individual’s tendency to buy organic products (Chinnici, D'Amico & Pecorino 2002; Kiesel
& Villas-Boas 2007; Tsakiridou, Mattas & Tzimitra-Kalogianni 2006). While Crescimanno,
Ficani and Guccion (2002) found that organic consumers constitute medium to high income
group in Italy, Adamsen, Lyons and Winzar (2007) in their studies noted that income does
not really affect a person’s willingness to buy organic product. Information relating to
consumers’ socio-demographics as a determinant of WTP is not consistent and this could be

65
the effect of cross cultural and cross national differences. Relying on these assumptions on
the social demographic characteristics of the consumers, it is hypothesised that:
H7a: The social demographic characteristics of consumers will positively influence their
WTP for the environmental benefit of organic wine.
H7b: The social demographic characteristics of consumers will positively influence their
WTP for the health benefit of organic wine.
H7c: The social demographic characteristics of consumers will positively influence their
WTP for the expert service of wine retailers.
The stated hypotheses conclude this chapter and the next will discuss the
methodology used in the study.

66
Chapter Three
Methodology
3.1 Introduction
This chapter describes the research model and how it was operationalised into a
survey. Secondly, it provides insight into the preparation of the survey and explanation into
how the survey was conducted (data collection processes) and the analysis of the data. The
successful execution of the study followed some prescribed methods that have been proven to
the extent that all the attributes of controllability, rigor, empiricism, criticism, validity and
systematic were built into it (Dawson 2002; Kothari 1985; Kumar 2005). All these attributes
are demonstrated throughout every stage of the research.
3.2 Questionnaire design
The quality of a questionnaire as a data collection tool or instrument is vital to the
credibility of any research outcome; therefore the design and construction of this study’s
questionnaire were rigorous processes. The issues of validity, reliability and sensitivity of the
questionnaire were explored, reflected upon, tested and proven before being administered, as
recommended (Wong, Ong & Kuek 2012). The process involved drawing up the necessary
and relevant questions to be answered by target respondents and designing them as a user-
friendly package. In the design, two main criteria were considered in line with Zikmund,
(2003): the relevancy of the questions and their accuracy.
In the design, considered thought was given to what questions were to be asked, how
they should be phrased, the sequence of questioning and the most appropriate layout
(Zikmund 2003). Following Cooper and Schindler’s (2006) suggestion, the questionnaire was
divided into three main groupings: administrative, classification and target questions. The
administrative grouping contained information pertaining to the respondents’ consent and
67
their physical location. Respondent location was not included in the questionnaire design but
was obtained through the redirect link used to track the questionnaire and the various states
and territories the response came from. Each questionnaire was given a unique identification
number. Respondents usually prefer to be anonymous; the study decided not to include any
identifying details of the respondents.
The ‘classification grouping’ constituted information about the respondents’
demographics. Demographic information solicited included gender, age, marital and
educational status. Others included household types, occupation, income and ethnic
background. Culturally or otherwise, demographic details can be intrusive and sensitive.
Though varying with culture, following Canada Business Network model (2012), which
advised that demographic questions should be placed at the end of the questionnaire, we set
these in the last group of questions asked.
The ‘target questions grouping’ comprised behaviour statements and statements of
intention of WTP. The behavioural statement questions were framed in ways that some
questions were trichotomous, ranked or rated. Though there were questions that required
dichotomous response, Zikmund, (2003) noted that ‘Yes’ and ‘No’ answers would not
capture all the variability in the response. To this end, the trichotomous responses of ’Yes’,
’No’ and ’Not sure’ and the Likert scale were used.
Likert scale is a popular measure of respondents’ attitudes, behaviours and
perceptions and is simple to administer and analyse (Wong, Ong & Kuek 2012). Some of the
items used to represent the explanatory variables were assessed on a seven-point Likert scale.
The choice of a seven-point Likert scale was predicated on its ability to give more variability
than a 5-point scale, while any scale with more levels was considered challenging to the
respondents’ cognitive capacity (Aguiree 2010; Wittink & Bayer 2003).

68
Less invasive questions and those that are not mentally taxing were presented first as
a way of sustaining the respondents’ interest in the response process. Reverse coding was not
used to avoid agreement-bias that can degrade the uni-dimensionality of the scale and causes
the problem of construct validity (Schriescheim & Eisenbach 1995). Without uni-
dimensionality amongst items of the constructs, the items cannot be said to be valid measures
of the latent constructs.
Also, Rennie, (1982) found that a combination of positively and negatively worded
statements does not improve a scale, and that scale quality among other parameters is
dependent upon the direction of wording in the items/statements, and their content. To
overcome the problems of response boredom, agreement bias and dimensionality, the
structure of the questionnaire design followed the patterns recommended in the literature for
rating scale improvement (Rennie 1982; Roszkowski & Soven 2009; Schweizer, Rauch &
Gold 2011; Wong, Ong & Kuek 2012).
3.2.1 The Structure of the questionnaire (Sources of variables)
The collection of data for consumers’ WTP for organic wine benefits and store’s
expert service was important to the study and to achieve the task, the survey questionnaire
was designed using selected explanatory variables. Saunders, Lewis and Thornhill (2003)
suggestions on the adoption and adaptation of questions from tested questionnaires were
considered. Three approaches were used to generate the target questions. Thus some
questions were adopted/adapted from proven and related questionnaires, and the rest were
new questions designed for the study based on literature reviewed. The reason for the use of
adopted or adapted questions from other questionnaires were predicated on the premise that
after repeated use of those questions, coupled with their high Cronbach alpha scores, there
was a high probability the terms used in these questions will be familiar to respondents, easy
to understand and respond to, and ultimately increase the reliability of the survey instrument.

69
The study searched questionnaires, handbooks of marketing scales and target
questions used by other researchers to collect data on the consumers’ WTP and the factors
that influenced it.
The study used the expertise of senior researchers to improve content validity by
capturing all important aspects that together encompass a construct. Many studies abound on
assessing WTP for product and service; the target questions for this study were sourced from
the works of Gil, Gracia and Sanchez (2000); Lusk (2003); Lusk and Hudson (2004);
Munene (2006); Rygel, O’Sullivan and Yarnal (2006) as well as other authors (refer to
Appendix 8). In this study, the hypothetical natures of the scenario (hypothetical bias) were
addressed by using cheap talk. Lusk (2003) found that cheap talk, a process of explaining
hypothetical bias to individuals prior to asking a valuation question, is effective at reducing
bias in stated WTP for less informed respondents. Target questions and sources are contained
in Appendix 8.
3.2.2 The design layout of the questionnaire
The first impression of potential respondents when they access the questionnaire was
considered in its layout and design. Hence the questionnaire layout was designed to be eye
catching and easily completed. The questions were grouped into headings and sub-headings
distinct from one another. For questions in each heading or sub-heading there was a brief
instruction as to how the questions should be answered. The behavioural questions designed
on Likert scale were consistent in terms of choice of scale dimension or rating; a range of 1-7
was used for all scale items. Refer to Table 3.1 for a snapshot of the measurement approach
for the rest of the questions.
Respondents’ privacy concerns were considered in the design of the questionnaire to
ensure anonymity. Questions that are less invasive of privacy but useful to the study and

70
capable of stimulating respondents’ interest were asked first; any that the respondents could
consider invasive of privacy are asked last.
The questions grouped into eight short sections A to H. The first section, knowledge
and information, is grouped into two subsections. Sub-section A1 contained questions used
to determine consumers’ knowledge of health and environment. The second sub-section A2
contained questions used to determine consumers’ knowledge about organic wine. Five
questions using the true, false or not sure measures were used to assess respondents’
knowledge about health and environment (House et al. 2004; Munene 2006). The measure of
consumer knowledge of organic wine was designed as a series of five statements that
required responses on a seven-point Likert scale that ranged from ‘strongly disagree’ to
‘strongly agree’.
Section B was grouped into four subsections relating to wine acquisition practices.
Questions in Sub-section B1 were used to explore consumer’s frequency of consumption of
wine and respondents were to make a single choice about how often they consume wine.
Sub-sections B2 and B3 questions were used to determine the consumers’ most important
influencer of product choice decision and the store where they make a purchase respectively.
Respondents were to rank the attributes from 1-7 for product decision factors and 1-8 for the
store’s ability to provide useful assistance to consumers. 1 represents most important and 7 or
8 represents least important, depending on whether the respondent answered questions in
Subsections B2 or B3.
Sections C and D questions are related to the needs/motivation and attitude of
respondents respectively. These sections measured the needs/motivation and attitude of
respondents towards organic wine and its attributes. The sections were designed as series of
five statements that required responses on a seven-point Likert scale that ranged from
‘strongly disagree’ to ‘strongly agree’.

71
Sub-section E1 and Section F are related to the likelihood a respondent could
perceive risk and the risk reduction strategy at the respondents’ disposal respectively. The
questions in these sections measured the probability of perceived risk and risk reduction
strategy the respondents might adopt when buying or consuming organic wine. The questions
were designed as series of five statements that required responses on a seven-point Likert
scale that ranged from ‘very unlikely’ to ‘very likely’. Sub-section E2 contained questions
related to the seriousness of the perceived risk when encountered by the respondents. This
section’s questions were designed as a series of five statements that required responses on a
seven-point Likert scale that ranged from ‘not at all important’ to ‘extremely important’. All
the questions in Sections A-G except for subsection B1were randomised using the software
validation rule to minimise measurement bias.
In Section G is questions relating to WTP for the attributes of organic wine and retail
store’s expert service. This was designed as a stated choice model that was determined by the
use of contingent valuation. This research used a modified payment card method following
the protocol of Ready et al., (2001) protocol:
Cheap talk was created to provide the respondents with background information
about the product and service for which WTP are to be determined, and also warned them
about the danger of over stating preference (Ready, Navrud & Dubourg 2001). Respondents
are asked to read the cheap talk script before answering the WTP questions in order to
minimise hypothetical bias (Aadland & Caplan 2003; Cummings & Taylor 1999; Mahieu,
Riera & Giergiczny 2012; Murphy, Stevens & Weatherhead 2005). There was an
acknowledgement of the role that preference for brand, country of origin, winery, wine maker
or price plays in decision making and the bias that can creep into any study based on
consumer preference.

72
Studies have shown that some consumers prefer red, white, sweet, dry, Shiraz, Rose,
Chardonnay, Sauvignon Blanc or Merlot wines, certain regions and price points (Dodd,
Kolyesnikova & Wilcox 2010; King et al. 2010). Consumer preference is deemed a potential
source of bias; for example a red wine lover may be willing to pay more for organic wine just
because it is a red organic wine. The same consumer is likely to show a converse WTP more
if the organic wine is white. This bias minimisation approach was extended to the wine retail
stores. To this end, the study decides not to identify the study products by any means by
which consumers defined their wine preferences. Instead “WINE A” was used to represent
wine with environmental benefit; “WINE B” represented wine with health benefit and
“STORE” for the expert service of wine retailers.
To set the initial price of the sample wine, it was assumed that the wine was for every-
day consumption; representative prices were obtained from some retail stores. Literature on
brands by Heath et al. (2000); Sethuraman and Srinivasan (2002), on the extent to which the
effects of price changes are asymmetric across higher priced versus lower priced products
was reviewed. The study by Romaniuk & Dawes (2005) was very useful. They noted that the
competition between price tiers generally follows the duplication of purchase law which also
sets expectations about competition. They suggested that the key determinant of the likely
price tier that purchasers had bought from previously is the size or prevalence of that tier.
They found that the price point of $10-$14 represented 41.0%, which is the largest share of
the wine market. The selling price of wine ($9.95) nominated for the study was also
predicated on the premise from consumers’ responses indicating that a good quality
Australian wine can be purchased for about $10.00.
The payment cards used to determine consumer willingness to pay for the expert
service of wine retailers were denominated as a result of the outcome of in-store survey of 20
wine shoppers as no reference price was able to be determined from literature. They were

73
presented with details of what constitute an expert service and asked to suggest premium they
will pay for the service, relative to the amount of knowledge they already have. The outcome
revealed 65% of the sampled shoppers indicated willingness to pay less than $1.00 and the
rest 35% were willing to pay more than $1.00.
The subsequent questions are constructed for each product and service for which
WTP was determined as:
1. Would you be willing to pay a premium for ‘WINE A’, ‘WINE B’ and ‘STORE’? A
‘Yes’ or ‘No’ response is to first ascertain the respondents WTP.
2. If ‘Yes’, what is your maximum WTP? is the follow up question. Four classes of
payment card with four different price premiums – $4.00, $3.00, $2.00 and $1.00 are
presented to the respondents to choose from for the WTP for organic wine benefits.
Also, payment cards with four classes of price premiums – $2.00, $1.50, $1.00 and
$0.50 are presented to the respondents to choose from for the WTP for store expert
service.
3. A certainty question follows, which measured how certain are the respondents of the
answer they provide to the previous question. A response scale of 100%, 95%, and
less than 95% is provided to choose from. The respondents that answer 95-100% as
yes certainty WTP are deemed to be sure of paying the premium if they are making
actual purchase of the organic wine or receiving the store’s expert service.
4. If a respondent gives a response to the certainty question less than 95% (a sure ‘yes’),
they are then asked to nominate another value that would be the largest amount they
are 95% or more sure to pay if an actual purchase had been made.
The choice of premium options was the outcome of the three visits made to wine sales
outlets. The price of conventional wines and organic wines of the same quality were
compared. The price difference was observed to be in the range of $1.50-$3.00.

74
Section H of the questionnaire relates to the respondents demographic details. This
section is the last section and it elicited information about the respondent’s gender, age,
education, marital status, occupation, income, household type and ethnic background.
Table 3.1 provides a snapshot of the actual questionnaire showing the various latent
variables used in the survey, the measurement tools, the numbers of sub questions used to
represent a latent variable or specific aspects of the investigation, types of variables and the
sections where each question is located in the actual questionnaire which can be found in
Appendix 2.
Table 3.1 shows the grouping of variables, measurement tools and the number of items in each variable.
Latent variable Measurement No. of
questions
(items)
Type of
variables
Section of
questionnaire
Information and knowledge of health and
environment
Trichotomised
question (True,
False and Not sure)
5 Independent A1
Information and knowledge of organic
wine
7 point Likert scale 5 Independent A2
Current acquisition – frequency of
consumption
Closed ended 5 Independent B1
Current acquisition/purchasing factors Ranking 1 Independent B2
Store preference Ranking 1 Independent B3
Need/Motive (consumer's motivation) 7 point Likert scale 5 Independent C
Consumers’ attitude 7 point Likert scale 5 Independent D
Perceived risk (consequent loss) 7 point Likert scale 5 Independent E1
Perceived risk (seriousness of loss) 7 point Likert scale 5 Independent E2
Risk reduction strategy (intrinsic product
related )
7 point Likert scale 5 Independent F1
Risk reduction strategy (extrinsic product
related)
7 point Likert scale 5 Independent F2
Risk reduction strategy (extrinsic store
related )
7 point Likert scale 5 Independent F3
Socio-demographic characteristics Multiple choice 10 Independent H
Willingness to pay (WTP) Contingent
valuation method
(payment card)
(3x4) Dependent G

75
3.3 Research area
The research was carried out in Australia. Good quality wine is made throughout the
country with South Australia the most prolific producer, often referred to as the ‘wine capital’
of Australia (it produced about 44% of Australian wine in 2009-2010 (ABS 2010). The first
Australian vineyards in Sydney were planted with vines imported from Brazil and the Cape
of Good Hope in 1788. After slow commercial growth through much of the 19th century, it
was not until the 1950s that the modern wine industry was born (Beeston 1994). Today the
success story that began in 1788 now contributes $5.5 billion to the nation’s economy,
employing 30,000 Australians (DAFF 2012).
Figure 3.1 Maps of Australian Wine Regions
Source: http://www.realaustraliatravel.com/australia-wine-regions-map.html. The red squares indicate the wine regions of Australia.
By 1850, some Australian states had commenced growing commercial vineyards for
wine production, but small holdings viticulture enabled Adelaide to commence winemaking
in 1841 when the first vintage was recorded in the Adelaide Hills. To date, South Australia
has continued to dominate Australia's wine industry with prominent wine regions as the
Barossa and Eden Valleys, Adelaide Plains, Adelaide Hills, McLaren Vale, Langhorne Creek,
76
Southern Fleurieu, Coonawarra, Limestone Coast and Clare Valley (Spencer 2002). The
Hunter Valley, Mudgee, Riverina regions of New South Wales, the Yarra valley, Swan Hill,
Rutherglen, Mildura, the Grampians/Pyrenees regions of Victoria, Margaret River in Western
Australia, the Granite Belt in Queensland and the Pipers River region of Tasmania constitute
the rest of the wine belt of Australia (Beeston 1994; Osmond & Anderson 1998).
Australia wine industry in just over two centuries has transited from smallholdings to
an industry which is competitive globally through innovation, product quality and price. In
fact, Australia has remained among the top ten wine producing countries in the world with
production across all the major wine styles (Wells 2007).
3.4 Procedure for data collection
This included the protocols and the techniques used to obtain information for the
study.
3.4.1 The Research data
Primary data were used in this research. Experiment is considered to be the best
source of primary data, followed by survey method (Aaker, Vohs & Mogilner 2010).
Experiment option was not selected for this study because apart from the high costs involved,
and the geographical encumbrances associated with this methodology (Sattler & Volckner
2002), it is not effective in measuring WTP for environmental and health attributes of organic
wine at the consumer level in a cross-sectional survey as attributes under investigation cannot
be determined by wine sensory evaluation. As a result the study used the survey method with
a questionnaire as the survey tool.
The choice of a questionnaire as a means of eliciting primary data information from
respondents was intended to achieve standardisation and conversion of research objectives
into specific questions. It was also used to keep the respondents motivated to complete the
questions, serve as a permanent record, facilitate the process of data analysis, for reliability,

77
consistency and to minimise bias. Questionnaires are also very cost effective when compared
to face-to-face interviews (Wong, Ong & Kuek 2012).
3.4.2 Survey method
Traditionally, the use of hard copy survey questionnaires is popular and provides the
respondents and the researcher (or the researcher’s representatives) in some instances with
face-to-face contact. The use of web based methods for market research has increased and
has become a very popular method in academic and other types of research (Farrell &
Petersen 2010; Porter 2004; Rea & Parker 2012). This attribution has been due to increased
technological development in hardware and software components of computer, internet,
sophistication in design and a more user-friendly nature of applications, all of which have
made it possible for the design, conduct and analysis of survey data for literally a fraction of
the cost and time it would have taken in the past working with paper questionnaires (Evans &
Mathur 2005). Furthermore, online questionnaire administration with sophisticated software
eliminates the common occurrence of missing value in paper questionnaire survey (Gmel
2001; Joinson 2001) and encourages high-level self-disclosure by respondents (Tourangeau
2004).
The method selected for this study was the web (online) surveys. Accessibility of
respondents to computers and the internet was a major consideration in online survey. The
use of computer and internet is wide spread in Australia. According to the Australian Online
Consumer Report (2011‐2012), 92% of Australians aged sixteen years and over already have
a home internet service (Nielsen 2012). This ever-expanding online landscape has presented
consumers with a complex environment, one that has infiltrated their lives, habits and
patterns of behaviour in communication, purchasing and consumption.
Several online survey softwares/platforms – Qualtrics, Survey Monkey, Vovici and
Checkbox Survey Solution were considered based on their inbuilt rigour and flexibility.

78
Qualtrics Survey Software was chosen and used in preference to others because it is easy to
use, and has an advanced set of features and capabilities that included a wizard to design a
survey questionnaire without prior training, as well as several questionnaire samples on
diverse topics that can be customised for use. Others included anti-fraud features to monitor
respondents’ activities during completion of questionnaires and prevention of ‘ballot stuffing’
by respondents, effective distribution/integrated sending and tracking of email invitations and
automatically generated reminder emails, integrated graphics and statistical tools, along with
the ability to download data into Excel or SPSS with the full syntax retained. Qualtrics’
capabilities helped to minimise the time respondents spent completing the questionnaire by
skipping non-applicable questions with inbuilt ‘skip logic’, also ensuring no missing
responses by the use of a ‘force response’ feature in the software.
3.4.3 Sampling method
Many wine consumer studies in Australia are conducted using convenient sample; (eg
Ogbeide & Bruwer 2013; Mueller, Francis & Lockshin 2008) as it is practically impossible in
most marketing research for probability sampling methods to be adopted. Under such
circumstance a non-probability sampling method can be used to select the respondents
(Bhattacherjee 2012). It was not the case for this study. Probability sampling method was
used to create an equal chance for the potential respondents to be selected (Aaker, Vohs &
Mogilner 2010). Specifically, stratified random sampling technique was used for the study as
Australian consumers’ involvement with wines across the states and territories is not
homogenous (Mueller & Umberger 2010); and the technique enabled the study to obtain
higher sampling accuracy. The Australian population to study sample ratio was used to derive
a proportionate stratified sample geographically on percentages as they occur in the national
population census. This minimised disproportionate representation in the study. The
percentage distribution of the respondents was based on the general population distribution of

79
the 2010 national census. It was not possible to determine the population of wine drinkers
who were 18 years and above as such data could not be obtained. A sample size of at least
1,050 respondents was targeted as follows:
1. New South Wales – 32.4%
2. Victoria – 25%
3. Queensland – 20.4%
4. Western Australia – 10.5%
5. South Australia – 7.4 %
6. Tasmania – 2.3%
7. Canberra – 1%
8. Northern Territory – 1%.
3.4.4 The sample frame and size
The sampling frame is defined according to Turner (2003) from both source and
purpose perspectives. Sources such as electoral rolls, sales data and mailing lists were
considered for the sample frame. The electoral roll (obviously) could not provide information
on wine drinkers, and sales data did not provide the desired information. Furthermore, it was
thought that this might be misleading, considering that buyers may not necessarily be users or
may just be making a one-off purchase. Mailing lists for consumers who met the pre-
qualification of intended respondents was preferred and used as an alternative.
The sample frame used was a list of wine consumers in the IMPACTLIST database.
IMPACTLIST is a Melbourne based List Management company that provided to this study
access to a database of consumers for a fee. The company also provided the technical support
to integrate the service offered to this study into the Adelaide Qualtrics software used for the
data collection. The database was screened for wine consumers based on predetermined
criteria provided to the list manager. Wine consumers qualified for the study were all 18

80
years and over. This is consistent with the Australian states and territories laws on the legal
age of alcohol consumption. Second, respondents had over the past six months (on average)
consumed or purchased a bottle of wine every month. This is consistent with the
characteristics of basic wine consumers, as posited by Bruwer and Li (2007). Individuals
purchasing or consuming wine for the first time were excluded from the survey, as their
repeat purchase or consumption could not be guaranteed either by the individuals themselves
or the researcher. The list members were assigned a unique number that was drawn at
random. List members selected at random who did not meet the prerequisites were excluded
from participation.
There were two general recommendations in terms of minimum sample size in factor
analysis. One recommendation proffered the use of the absolute number of cases (N) as
important; while the other prescribed that the subject-to-variable ratio (p) is important
(Bentler 1987; Hair et al. 2010). Several rules of thumb were reviewed. For factor analysis, a
sample should preferably be more than 100 for factor analysis to proceed (Hair et al. 2010)
and for structural equation modelling it should be higher than 300 cases (Tabachnick & Fidell
2007). A ratio of ten responses per free parameter was recommended to obtain trustworthy
estimates (Bentler 1987), while ten subjects per item in scale development was thought to be
prudent (Flynn & Pearcy 2001). However, if data is found to violate multivariate normality
assumptions, the number of respondents per estimated parameter increases to 15 or more
(Bentler 1987; Hair et al. 2006).
The recommendations by Bentler (1987) and Hair et al. (2006) on sample size were
followed. The rule of 15 or more respondents to one variable was applied as it was more
robust, increased variability and served to guide against low communalities. A sample size of
at least 1,150 respondents was targeted.

81
3.4.5 Survey pilot
The survey was piloted twice in Adelaide, once at a wine store with the questionnaire
administered face-to-face directly to respondents, and also online using this URL:
(http://adelaide.qualtrics.com/SE/?SID=SV_ai9jVzix4zIWLSk), which was powered by
Adelaide Qualtrics. Fifty respondents participated in the direct survey over two weeks. They
were asked to provide feedback on the survey. The pilot yielded 48 usable surveys and two
uncompleted ones. Forty one respondents provided feedback, of which 21 deemed the
questionnaire as good in content and able to be applied without amendment. Five respondents
considered the words in some questions to be daunting and difficult (in terms of
comprehension) and 15 respondents claimed that the survey was too long and time
consuming.
These comments were reviewed and decisions were made on their merits. This led to
eliminating some questions, which were determined to have no main effect on the hypothesis
or the model. More familiar or common words were used and the review aided reducing the
length of time of survey. The outcome survey questionnaire was also tested online. The
online survey testing was conducted for approximately 96 hours, and 22 responses were
obtained. The pilot participants were asked to comment on the user friendliness of the web
questionnaire and the ease of system navigation. It afforded the opportunity to test the logics
and other validation rules applied in the questionnaire. Only 10 respondents commented on
the web questionnaire that it was easy to complete and the navigation was simple. The other
12 respondents did not provide any comment and no reasons were given. The completed
questionnaires were reviewed; no deficiencies were noticed, except that two respondents
assigned the same measure value to two different items when they were asked to rank those
items. A validation rule was then applied to prevent any such occurrence in the actual survey.

82
3.4.6 Collection of data and questionnaire administration
Prior to the commencement of the data collection, a formal application for ethics
approval for the study was made to the University’s Ethics and Integrity Committee. This is a
legislative requirement for carrying out research in Australia. Details that included research
location, nature of the research, and the kind of people to be involved and handling of
materials and information were provided to the committee before an approval to commence
was granted. A workshop on research ethics and integrity was also attended prior to the
commencement of the data collection.
The data collection was carried out online. Adelaide Qualtrics Online Survey, a
secure, online data collection service available to the University of Adelaide Business School,
staff and students was used. The technical supports for this software were provided by the
Qualtrics technical support team.
The field survey was launched on 3 August, 2012 with a uniform resource locator
(URL) http://adelaide.qualtrics.com/SE/?SID=SV_e8uVKd7VbDzx85m. The URL specified
the global address of the questionnaire and web resource. It provided the channel by which
respondents were able to access the questionnaire from their home or office computers. The
data were collected using the email list of wine consumers in the IMPACT LIST database to
reach the respondents. To choose the sampled respondents, the email addresses on the list
were assigned unique numbers that were drawn at random using the free Stat Trek online
Random Numbers Generator. Drawn list members who did not meet the prequalification for
the survey were not sent an email to participate in the study.
All randomly selected prequalified potential respondents were emailed the
questionnaire link. Instructions for the completion of each section of questions were provided
at the beginning of each section. On completion of the last question an ‘end of survey’ and a
‘thank you’ messages were displayed. The completed surveys were automatically stored by
83
default individually in a report folder in ‘My Library’ in Adelaide Qualtrics. Each response
had its unique characteristics such as an identification number, start and end time for
completing the questionnaire and response type. While the data collection was on, random
checking of the received questionnaires was carried out to ensure that there was no
compromise of the data and the online data collection system due to system fault or errors. At
the completion of the data collection process, the responses were downloaded into a
Microsoft Excel spreadsheet prior to analyses.
3.4.7 Data quality and security
The logic and validation rules set in this online survey minimised the error and
missing value. Also, care was taken in the transfer of the data from the Excel spreadsheet to
Stata 12, which was the software used for analyses of the data.
As the completed questionnaires contained information about individuals, it is a legal
obligation that the information was kept safe and secure from unauthorised access. Data were
stored in password protected electronic storage files away from public access. Backup copies
of electronic files were made to guard against loss, theft and damage.
3.5 Data screening for completeness and consistency
Inaccuracy of data has the potency to ruin good research and can raise some
concerning issues, such as missing data, outliers, linearity, normality and the
homoscedasticity impact on the relationships of variables, or for the outcome of variables,
any of which may be devastating depending on their effects in the relationship made (Wong,
Ong & Kuek 2012). To this end, data were screened to reveal consistency or anomalies that
were inherent in the data set. Data with “hidden” effects (e.g. outliers) that might influence
empirical analysis were investigated and, depending on outcome, were either modified or
eliminated.

84
To minimise or avoid any missing value issues, in the Adelaide Qualtrics online
survey software, the ‘force response’ button was activated. The button prevented respondents
from moving to the next question until the current one was completely answered. At the end
of the survey, there were no missing values. More important too was the transfer process of
data from the collection software to the analysis software. No manual data entry was
performed; instead the data was imported from the former to the latter.
3.6 Coding
For ease of computer analysis, the data were coded. Codes are symbols (often
numerical) used to define the rules of classification, recording, analysis and interpretation of
data. Before the transfer of the data from the downloaded Excel spreadsheet to the analysis
software, the data were pre-coded and the rule for variables aggregation set. The code
information is contained in the variable manager in Stata 12.
3.7 Ethical consideration
This study involved in-depth cooperation and coordination among different
authorities from various disciplines and institutions. Research materials by other (senior)
colleagues used was reference in accordance with standard practice. In this study, all
partners, including my supervisors, Impact List (list supplier), senior colleagues in the School
of Marketing, the University of South Australia, the accounts department of the University of
Adelaide and all other collaborators were dealt with in an atmosphere of mutual trust, respect,
accountability and fairness. These values were extended to other applicable authorities in any
areas of their involvement with the study. Acknowledgement has also been given to all who
contributed to the study indefatigably in non-academic manners.
The research process, materials and the respondents themselves were protected in the
study. The principle of voluntary participation was applied such that participants were not
coerced or manipulated to participate in research. In this regard, there was the requirement of

85
informed consent to be given before information was elicited from respondents. A letter of
introduction/consent was included in the questionnaire. Respondents were advised to read
and give consent by clicking on ‘I agree to participate’ or ‘I do not agree to participate’. Only
when consent was given were they able to gain access to the survey questions. Where consent
was denied, potential respondents could not access the survey questions. The implication here
was that prospective participants were fully informed about the procedures and risks involved
in the study before they gave their consent to participate. Ethical standards also prohibited the
deliberate exposure of participants to any risk of harm as a result of their participation,
whether physically or psychologically. The principles of confidentiality and anonymity were
also applied in order to protect the privacy of study participants (David & Resnik 2011). To
achieve this, it ensured that any identifying information of the respondents was not made
available to the general public and the ‘need to know’ rule was applied to everyone directly
or indirectly involved in the study. All information was treated with strict confidentiality and
participants remained anonymous throughout the study.
3.8 Statistical tools, empirical models and procedures for data analysis
Stata 12 was the integrated statistical package chosen for data analysis in this study; it
provided good data-management features that combine and reshape datasets, manage
variables, and collect statistics across groups or replicates. It had both a point-and-click
interface and a powerful, intuitive command syntax that made it easy to use, fast, and
accurate. Stata software vendor provided free technical supports – online training, and PDF
resource on software navigation, syntax commands and formulas.
To be able test the hypotheses proposed and determine the effects of the independent
variables on the outcome variables, for each box in Figures 3.2 and 3.3, data were collected
and analysed. Refer to Appendix 2 for the details of the exact questions in each of the boxes.

86
Data collection methods was presented earlier in this chapter and now followed by the
analysis procedures.
H: 1a+ & b+
H: 2a+ & b-
H: 3a+ & b-
H: 4a- & b-
H: 5a+ & b+
H: 7a+ & b+
Figure 3.2 Causal relationships between each of the independent variables and the corresponding
dependent variable.
Note: The bolded words in upper case represent the summated composite independent variables. “H” denotes hypothesis, the number assigned to the hypotheses is for identification purpose while the alphabet “a” and “b” link the relationship to WTPe
and WTPh respectively. MOTI (a three item composite variable) and MOTIV (a four item composite variable) were used to
determine WTPe and WTPh respectively. +, – indicate positive and negative direction respectively of the relationship.
H: 5c+
H: 6+
H: 7c+
Figure 3.3 Causal relationships between each of the independent variables and WTPs.
Note: The bolded word in upper case represent composite perceived risk variable. “H” denotes hypothesis, the number assigned to the hypotheses is for identification purpose. +, – indicate positive and negative direction respectively of the
relationship.
Consumer’s knowledge of health,
environment and Organic wine
KNOWOW
Willingness to pay
environmental
(WTPe) and
health (WTPh)
benefits of
Organic wine
Consumer’s attitude towards
organic wine. ATTITUDE
Consumer’s risk reduction
strategy RRS_A
Consumer’s perceived risk
PACIV_RK
Consumer motivation towards
organic wine MOTI, MOTIV
Consumer demographics and
socio-economic factors
Consumer’s perceived risk
PACIV_RK
Consumer’s risk reduction
strategy
Willingness to pay for
expert service of retail
store
WTPs
Consumer’s social demographics

87
Several statistical procedures are performed in this thesis. These methods include:
factor analysis, reliability test, summation analysis, ordered probit regressions, marginal
analysis, and discriminant analysis. Details of each method are described below.
3.8.1 Factors purification using principal components analysis
Different analysis methods were required to process the data into meaningful
information. For studies where Likert scale items are used, it is important that the variables
used to represent a construct are actually representative of the construct in a uni-dimensional
way (Hair et al. 2006). One way to ensure this was to carry out factor analysis to determine
the variables’ correlation and factor loading.
The principal components analysis, which is a type of factor analysis, was used to
purify the scale items. Variables, such as perceived risk, attitude, motivation, risk reduction
strategy and knowledge could not be observed or measured directly, and so are described as
latent variables (Hair et al., 2010). These latent variables were represented by observable
factors that are known supposedly to depict them. However, it was important to ensure that
the observable factors represented their respective latent groups. The uni-dimensionality of
factors representing a latent variable was very important and was upheld to avoid
multicollinearity (Hair et al., 2010).
Hair et al, 2006 noted that the derived correlation in factor analysis can be affected by
homoscedasticity, normality, and linearity which are the underlying assumptions. Therefore
to accept the measure of sample adequacy (MSA) the statistical assumptions were that each
variable and the overall test MSA must be over 0.50. As a rule the average variance extracted
(AVE) was 0.50 (managerial implication) or more, which suggest adequate convergent
validity. Every variable with less than 0.50 was eliminated from analysis one at a time
starting with the one with the lowest value. Bartlett’s test of sphericity was important to
confirm correlation among variables in the matrix at statistical significance of < 0.05 (Hair et

88
al. 2010). The cross loaders were eliminated to avoid multicollinearity (Acock 2012; Hair et
al. 2010).
3.8.2 Reliability test
The internal consistency of the latent variables is very important (Cohen et al. 2003;
Smith-Spangler et al. 2012). Reliability test was carried out to evaluate the internal
consistency of the latent variables after factor analysis using Cronbach’s Alpha. The item-to-
total correlation must be more than 0.50 for the variables. The item-to-total correlation must
be high enough as not to be able to impact the alpha value negatively. The Cronbach’s Alpha
outcome for the variables must be consistent with Nunnally (1979) and Peters (1979)
recommendation that Cronbach’s Alpha of 0.70 or above is accepted as a good measure of
reliability.
3.8.3 Summation scale scores
Scholars have argued for or against different analytical methods in this context.
Thissen and Orlando (2001) argue that item response theory (ITR) estimates should be used
in analyses rather than number right (NR) or summated scale (SS) scores. They postulated
that IRT scaling tends to produce estimates that are linearly related to the underlying
construct being measured. Therefore, IRT construct estimates can be more useful than
summated scores when examining relationships between test scores and external variables.
Xu and Stone (2012) in their study used Monte Carlo methods to compare the performance of
IRT trait estimates and SS scores in predicting outcome variables in the context of health and
behavioural assessment. The use of scores based on the graded-response model versus
summated scores was compared. Their results indicated that IRT-based scores and summated
scores are comparable when evaluating the relationships between test scores and outcome
measures, and concluded that applied researchers could use SS scores in predictive studies

89
and circumvent evaluating the assumptions underlying use of IRT-based scores. Therefore
this study adopted the summated scale score approach.
In this study, five independent variables - perceived risk, attitude, motivation, risk
reduction strategy and knowledge were Likert scale items. These variables when analysed
using their observed variables individually in ordered probit model created redundant output
and inaccurate results. For accurate results, the individual observed variables in each latent
variable were summated using the addition method to form summated scores.
3.8.4 Ordered probit model
In this study, measuring the WTP was done using the ordered probit model. The
model is popular in attitudinal measurements where the use of scale items is prominent
(ORWINE 2007). Attitudinal studies are often measured using a Likert scale that generates
ordinal or ordered responses data which are awkward to handle satistically (Espejel, Fandos
& Flavian 2009; Kandeepan 2008; Munene 2006). The apparent complexity is the existence
of the assumption that ordered response is latent with continuously distributed random
variables that denote a tendency to hold a particular position across a range of positions about
a variable (Acock 2012; Borooah 2002). The distributional parameters of the latent variable
are estimated using maximum likelihood, and these parameters have interpretations that are
uniquely distinct compared to linear regression.
The choice of this model followed Greene (2002) report that researchers using scale
items for investigation prefer ordered probit model to avoid the misleading consequence of
using linear regression model for discrete and ordinal variables. For example, it is assumed
that respondents who give the same answer to a survey have exactly the same attitude in a
linear regression model. This assumption does not hold true; a particular response can be
consistent with a range of attitudes even when the differences in attitude for a given response
are not noticeable (Greene 2002). Ordered probit model captures the non-linearity inherent in

90
the use of scale item data. Thus Mann, Ferjani and Reissig (2012) warned that to overlook
attitudinal variations from a grouped data perspective is misleading, as estimation will be
biased, and the severity of the bias is higher with a lesser number of categories.
In the estimation of parameters therefore, ordered probit model assesses the
underlying distribution, relative to the actual response provided by the survey participants,
and that is why the distances among responses (e.g ‘very likely, ‘likely’ and ‘somewhat
likely’, though often assigned numbers) are logically not the same, it is reflective of the
ordinal nature of categorical variable (Greene 2002).
Three ordered probit models were used. Two of the three models were used to
determine WTP for the environmental and health benefits of organic wine and one for the
expert services rendered by retail wine stores.
The general equation for specifying an ordered probit model is: yi* = Xi β + εi where
yi* is a latent (unobserved) variable ranging from -∞ to ∞, β is a row of vector of observed
explanatory variables, X is an information matrix (vector of unknown parameters) and ε is the
random error term. Although yi* is latent, according to Long (1997), it can be mapped to an
observed variable y which is considered as presenting partial information about an underlying
y*. Therefore the order response model for this study assumes the following relationship
based on the equation yi* = Xi β + εi:
y=0 if y*i≤0;
y =1 if 0 < y*i≤μ1;
y* = y=2 if μ1< y*i≤μ2;
y=3 if μ2< y*i≤μ3;
y=4 if μ3< y*i≤μ4;

91
Where y is the ith respondent’s rating for a particular product and the μs are unknown
thresholds parameters or cut points. The parameters in the model were estimated by using
maximum likelihood.
In this study, respondents were asked to choose a value that they are willing to pay for
the environmental and health benefits of organic wine and the service rendered by the retail
sales outlets. Each respondent’s willingness to pay was represented by the value of variable
yi such that higher values of yi represented higher WTP for the benefits of organic wine in
question and the expert service rendered by the retail sales outlets. Each respondent’s WTP
score was dependent upon a variety of explanatory variables including the consumer’s
attitude, motivation, knowledge, perceived risk and risk reduction strategy.
There were five possible WTP response scores ranging from $0.00 to a maximum of
$4.00 and $2.00 for organic wine benefits and store service respectively. The variable yi was
associated with five levels such that yi = 0 when a person was not willing to pay for the
product and yi = 4 when the individual was willing to pay the highest value on the payment
card. The continuous latent variable y* represented the propensity to pay a certain amount for
the products, and the observed response categories were related to the censored latent
variable using the following measurement model according to Harrison and McLennon
(2004)—therefore the order response model for this study assumes the following
measurement equation: WTP = yi = Σβkxik + εi (1).
The variable yi was a linear function of k factors (“explanatory variables”) whose
values for individual i, were xik, k = 1,….k; βk was the coefficient associated with the kth
variable (k = 1,…k). An increase in the value of the kth
factor for a particular respondent
caused his or her WTP score to rise if βk>0 and fall if βk<0. The error term εi was included
to account for the fact that the relationship between the WTP score and the WTP-inducing

92
factors was not an exact one, as there may be factors left out of the equation or factors not
measured accurately (Borooah 2002). The cut points or threshold values (μ1, μ2, μ3 and μ4)
are unknown parameters to be estimated along with the βk of equation (1).
After the completion of the ordered probit regression analysis, the estimated values of
the coefficients βk allowed an estimated value Σβkxik to be computed for each individual in
the sample. Using this estimated value, in juxtaposition with the estimated values of the
threshold parameters, allowed the probabilities of selecting a particular WTP bid to be
estimated for each individual in the sample.
3.8.5 Marginal analysis
Marginal analysis was utilized to examine WTP probability outcomes when one unit
of any of the explanatory variables – socio-demographic, perceived risk, attitude and
motivation, risk reduction strategy and knowledge changes. The issue explored here relates to
the direction and magnitude of effect. Using the proposition of Wooldridge, (2001), the study
estimated the marginal effect that would result when there are changes in the explanatory
variables. The marginal effect indicated how a change in the explanatory variables affects the
predicted probability that consumers are willing to pay in each of the WTP premium classes.
To determine the marginal effect of the probability, the equation below is used:
Marginal Effect for Xk = Φ(XB) * bk where Φ is a cumulative density function (CDF) that measured
the probability of WTP as less than the respective threshold. The study examines the marginal
analysis using the marginal effects at representative (MERs) values.
3.8.6 Discriminant analysis
Consumers demonstrate actions that vary in a given purchase situation and the
analysis examines of the study the causes or the sources of the variation. The predictive
variables can be used to characterise respondents into different groups. Alternatively
classification tasks can aim to identify the unique attribute of a predefined class (Hair et al.,

93
2010). Under this circumstance, it provides a better understanding of existing data and
possible predictive ability about how new instances will behave.
Several methods such as ANOVA, multiple regression, support vector machines and
cluster analysis have been used for classification (Dodd et al. 2005), but when data violates
the assumptions underlying regression model, there can be serious consequences (Porter
1985). In the face of the shortcomings of the other methods is a more appropriate technique
referred to as discriminant analysis.
The discriminant analysis (DA) was chosen unlike cluster analysis that is a
mathematical approach, because of its discriminative feature transformations in the statistical
pattern and has been successfully used to delimit consumers in marketing studies (Hsu, Chiu
& Lee 2012).
In the first WTP question in the questionnaire to the respondents, they were asked to
indicate their WTP to pay for the environmental and health benefits of organic wine and the
expert service of the wine retailers. The response option was dichotomous (Yes or No).
Therefore the first WTP question naturally classified the respondents a priori into two main
groups; those willing to pay and those not willing to pay premium for organic wine attributes
and the expert service of the retailer.
In this study discriminant analysis was used to attempt to find the best set of
predictors that distinguish between respondents that are willing to pay and those un-willing.
Tests of significance of all canonical correlations for WTP were carried out to test the
difference between the two groups. Drawing further from Hair et al. (2006; 2010), reporting
the loading (canonical structure; canonical loading; structure matrix, structure coefficient, or
discriminant loading–all alternative names for the same thing) was more valid than weight
(standardized canonical discriminant function coefficients) and that loading should be utilized
where possible. As it was also important to validate the groups, there were several approaches

94
to do it however the study reported the canonical structure (loading) as the discriminant
function.
3.9 Study appraisal
In the course of the study, professional and expert colleagues were called upon
(officially and unofficially) to exploit their knowledge to find solutions to some challenges
faced by the study. In this privileged position, research and market issues, methods and
questionnaire design and plots were discussed in detail with some student colleagues, senior
researchers and experts from the wine industry, the University of Tasmania, the University of
South Australia, the University of Adelaide and the Aarhus University Denmark, through
personal interviews and electronic communications as the study progressed.
3.9.1 Academic visits
Academic visits were undertaken in order to review the work of others, to discuss
progress of the study and to present advances of the research. Visits were made to the
University of South Australia’s School of Marketing, (Adelaide) in February and March,
2012. The issues discussed centred around methodology and questionnaire design.
3.9.2 Conferences, seminars and workshops Attendance
Relevant conferences and workshops were attended at the University of Adelaide’ and
outside. The following conferences, seminars and workshops were attended:
a. EndNote for Beginners Workshop, Researcher Education & Development, Adelaide
Graduate Centre, The University of Adelaide, 2 May 2011.
b. Ethics and Integrity in Research with Humans Workshop, Ethics Centre of South
Australia, The university of Adelaide, 20– 21 June 2011.
c. “Using choice modelling and duplication of purchase to predict consumer response to
a wine tax increase”. A seminar presented by Professor Larry Lockshin, Head of

95
School of Marketing, Ehrenberg Bass Institute for Marketing Science, University of
South Australia, Adelaide, 15 July 2011.
d. Margaret Cargill's Workshop – “Literature reviews and review papers: constructing
compelling arguments”, The University of Adelaide, 3 August 2011.
e. Annual School of Agriculture, Food and Wine Postgraduate Symposium, The
University of Adelaide, 5–6 October 2011.
f. Learn Stata Workshops, Centre for Epidemiology and Biostatistics, Flinders
University, Adelaide, 6 July 2012, 9 August 2012 and 6 September 2012.
g. Presentation of this research work to the School of Management, University of
Tasmania, 25 February 2013.
3.10 Conclusion
This chapter has outlined the strategies, procedures and protocols followed in the
implementation of the study. It detailed how the sample size, questionnaire design, pre-
testing, data collection, purification and analysis were carried out in the study. This leads us
to the next chapter of the study – results and discussions.
The results and discussions are presented in three chapters (4 – 6). Chapter Four will present
the sample and variable statistics. This will be followed in Chapter Five by the variable
statistics exclusive to the WTPe, the results of factor analysis, reliability test, ordered probit
regression for WTPe, marginal analysis, hypotheses testing and discussions on WTPe.
Chapter Six will present variable statistics solely related to the WTPh, regression outcomes,
marginal analysis results, hypotheses testing and discussions on WTPh. In the same vein as in
Chapter Six, Chapter Seven will present results of willingness to pay for the expert service of
wine retail store. However, no marginal analysis result will be presented.
96
Chapter Four
Result and Discussion: Sampling, Sample and Variable Descriptive
Statistics
4.1 Introduction
This chapter provides an overview showing the outcome of the sampling, sample and
variables statistics. The study proposed the use of sample ratio rule of 15 respondents to one
parameter (Hair et al. 2006) and there were 70 parameters. A sample ratio of 31 respondents
to one parameter was obtained. The List Manager envisaged approximately 50% response
rate due to the time frame assigned to the data collection. The rollout of the survey targeted
250% potential respondents with a view to obtain 1,050 surveys. However the response rate
achieved was over 200%. The number of respondents obtained, increased the sample size
ratio and possibly the variability in the data set at no extra cost. The sampling and data
screening statistics are presented first, followed by sample descriptive statistics and lastly the
variables statistics.
4.2 Result of data screening
During the data collection process, 3,118 potential respondents (PR) were contacted
for the survey, out of which 3,067 (98%) consented to participate while 41 PR (2.0%)
declined participation. Of the 3,067 potential respondents that gave consent, 2,195 of them
(71.6%) met the screening criteria while 28.4% respondents did not qualify. Therefore a total
of 2,195 completed questionnaires were obtained.
It was important that the data be accurate, complete and consistent (Zikmund & Babin
2007). The data was scrutinised for any possible discrepancies. All questions were completed
and there were no missing values due to the use of the ‘force response’ tool in the survey
software. This did not allow the respondents to move to the next question until the current
one was completed. Despite the sophistication of software used to gather the data, a few

97
inconsistencies were observed. Of the 2,195 completed surveys, 4.0% were not usable and
declared void due to incongruence in the responses, leading to 2,099 (96%) usable surveys.
The responses the respondents provided for WTP, education status, occupation and income
were unable to be reconciled as near normal. For example, a respondent claimed to be on an
annual income of $25,000.00 and was willing to pay $105.00 premium on a bottle of wine
that cost $9.95—this questionnaire was eliminated.
Forty-seven respondents, representing 2.2% of useful surveys were not able to
properly classify their occupation. For example a lawyer, Electronic Engineer and retail truck
driver classified their occupation as ‘other’ instead of ‘Management and professional’,
‘Engineering and design’ and ‘Warehouse and distribution’. These respondents were
reclassified into their proper category as provided for in the questionnaire.
Thirty completed questionnaires (1.4% of useful surveys) were modified based on the
responses provided by the respondents. The modification mainly relates to the WTP
questions. Some respondents in response to the question ‘If YES, indicate the most you
would pay for this wine in addition to the regular price’ had indicated that they will pay, for
example, $2.00 which was among the options available to the respondents. For the question
‘How sure are you about your payment decision?’ Those that had indicated less than 95.0%
sure were requested to indicate a premium that they were at least 95.0% sure to pay, to which
they indicated different values according to their WTP. Some of the values indicated were the
same as the options provided in the questionnaire. Some were lower while others were higher
than the options provided in the questionnaire. For respondents that indicated WTP $3.00 at
less than 95.0% surety, and WTP $1.00 at 95.0% and above, their WTP premium were
modified to reflect their surety because this was among the options provided in the
questionnaire. For respondents that indicated WTP $4.00 at less than 95.0% surety and WTP

98
5.00 at 95.0% and above, their WTP premium were not modified as their surety was not
among the options provided in the questionnaire.
The screening results support the use of the online survey method as a reliable means
of conducting such a survey. Missing values, a common occurrence in offline questionnaire
administration (Gmel 2001; Joinson 2001), were eliminated using the force response button.
It gave high disclosure rate as respondents perceived themselves as really anonymous.
Response bias was minimised as the questions were randomised to the respondents.
4.3 Sample description
Table 4.1. Demographic Profile of Sample (n=2099)
Characteristics # of Respondents % Respondents
Gender Male 1292 61.6
Female 807 38.5
Age Group 18 - 24 years 45 2.1
25 - 28 years 91 4.3
29 - 34 years 221 10.5
35 - 40 years 262 12.5
41 - 45 years 206 9.8
46 - 54 years 408 19.4
55 - 65 years 539 25.7
65 + years 327 15.6
Highest School Leaver’s certificate. 306 14.6 Education Higher school certificate 255 12.2
obtained TAFE certificate/diploma 660 31.4
Bachelor’s degree 418 19.9
Graduate/Postgraduate diploma 237 11.3
Master’s degree 158 7.5
Doctorate degree 28 1.3
Others 37 1.8
Marital Single 305 14.5 Status Married or cohabiting 1462 69.7
Separated 69 3.3
Divorced 194 9.2
Widowed 69 3.3
Occupation Engineering and design 90 4.3
Clerical and administrative 352 16.8
Education 207 9.9
Management and professional 566 27.0
Sales and service 310 14.8
Warehouse and distribution 64 3.1
Others 510 24.3
Income $25,000 221 10.5
$25,001 - $50,000 448 21.3
$50,001 - $75,000 421 20.1
$75,001 - $100,000 444 21.2
$100,001 - $150,000 381 18.2
$150,001 - $200,000 117 5.6
$200,000 plus 67 3.2
Race Caucasian (white) 1794 85.5
Indigenous Australian 48 2.3
American 27 1.3
African 10 0.5
Asian 192 9.2
Others 28 1.3
Household type No dependants 448 21.3
0-24 Months children 169 8.1
Children 3-17 years 565 26.9
Adult 18 years or older 917 43.7
State New South Wales 652 31.1
Victoria 565 26.9
Queensland 405 19.3
Western Australia 215 10.2
South Australia 171 8.2
Tasmania 54 2.6
Australia Capital Territory 25 1.2
Northern Territory 12 0.6
99
Detailed sample description is contained in Table 4.1 and Appendix 10, which show
the general demographic profile of the sample and gender delimited profile respectively.
The sample consisted of 2,099 consumers of which 1,292 (representing 61.6%) were male
and 807 (representing 38.4%) were female. Geographically, the surveyed consumers spread
across 807 postcode areas of Australia and yielded an approximate average of 3 respondents
per postcode. The New South Wale wine consumers represented 31.1% of the sample
followed by Victoria – 26.9% and Queensland – 19.3%. Northern Territory represented 0.6%
of the sampled wine consumers. (Refer to Table 4.1 and Appendix 10 for complete
information on geographic and all other demographic statistics of the respondents).
The age group result showed that consumers in the age group 55 – 65 years
represented 25.7% of the respondents followed by age group 46 – 54 years (19.4%), while the
age group 65 years and over constituted 15.6% of the sample (of which 58.4% were female).
The respondents in the age group 18 – 24 years had the lowest representation, 2.1% (of which
86.7% were male).
Almost 70% of the respondents reported that they are married or cohabiting, 14.5%
reported never being married and 3.3% were widowed. Respondents that were divorced
constituted 9.2% (of which 67.5% were male) and those that claimed to be separated
accounted for 3.3 % (of which 65.2% were male). The modal group in the marital status
characteristic of the sample (married or cohabiting) had 61.3% of the respondents as male.
Regarding the highest educational qualification obtained by respondents, 31.4% of the
sample had a TAFE certificate/diploma, 19.9% had a Bachelor’s degree, 7.5% a Master’s
degree, 14.6% had a School Leaver’s Certificate and 1.3% of the sample had Doctorate
degree. Of the percentages of the respondents that held Master’s and Doctorate degrees,
51.3% and 60.7% respectively were females.

100
The majority of the respondents, representing 27.0% were in management and
professional occupations. Wine consumers involved in clerical and administrative
occupations represented 16.8% of the sample. While those in warehousing and distribution
accounted for only 3.1%, the ‘other group’ represented 22.2%, which was made up of
homemakers, retirees and currently unemployed (as at the time of the survey) respondents.
The distribution of respondents across the occupation groups indicated 27.0% of the
respondents were in the Management and Professional group, of which 56.2% of that group
were male. The respondents in the Clerical and Administrative group accounted for 16.8% of
the sample while respondents in sales and service occupation represented 14.8% of the
sample. Education and Warehouse and Distribution groups represented 9.9% and 3.3% of the
sample respectively, while Engineering and Design only accounted for 4.3% of total
respondents. However, it was noted that in the ‘Engineering and Design’ and ‘Warehouse and
Distribution’ occupations, females constituted over 80.0% of the respondents in each of these
groups. It is also important to point out that these two occupations accounted for only 7.3% of
the total respondents.
Annual household income distribution revealed more than 21% of the respondents
reported annual household incomes of between $75,001 and $100,000. Consumers in the
income group $50,001 - $75,000 constituted 21.3% of the sample. While 18.0% of the
respondents reported incomes in the range of $100,001 - $150,000, only 3.0% reported
incomes of $200,000 and over. More male respondents than female were reported in all the
income groups except for the ‘$200,000 and over’ segment where the female respondents
were slightly more than the males.
About 86% of the respondents were Caucasian (white), which mainly mirrored the
Australian population, the rest 14.0% were Indigenous Australians, Americans, Asians,
Africans and others. All the groups were dominated by male respondents.
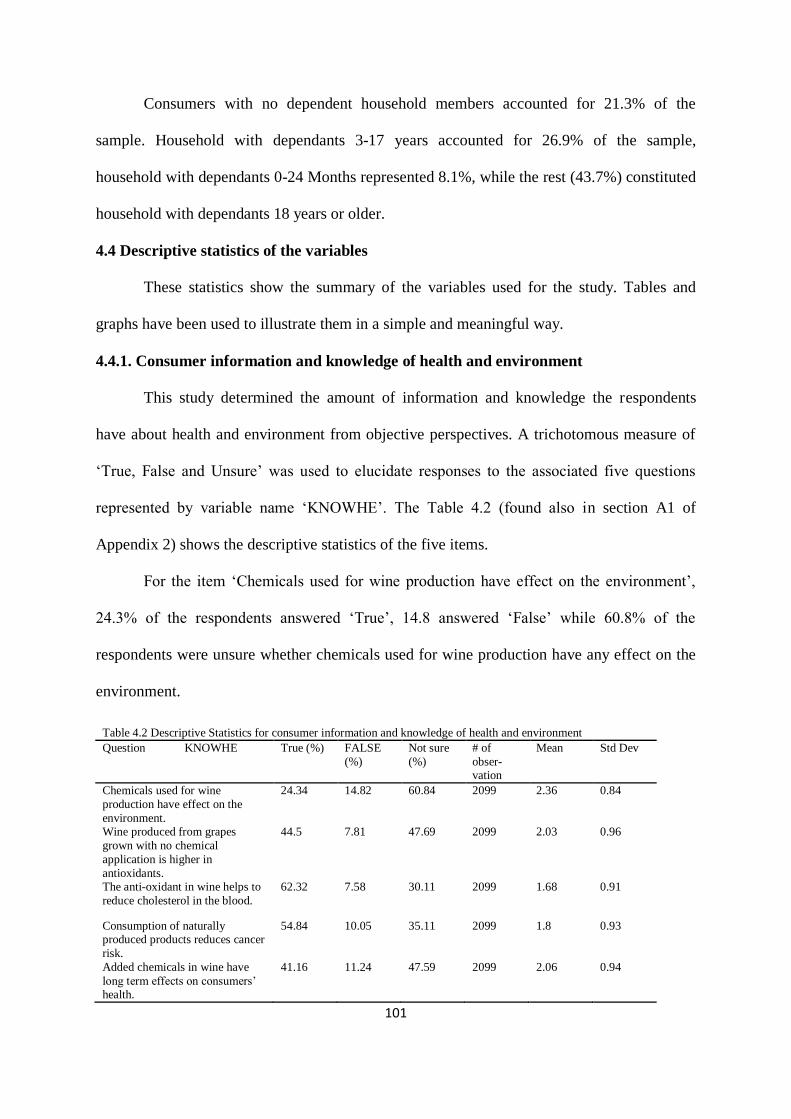
101
Consumers with no dependent household members accounted for 21.3% of the
sample. Household with dependants 3-17 years accounted for 26.9% of the sample,
household with dependants 0-24 Months represented 8.1%, while the rest (43.7%) constituted
household with dependants 18 years or older.
4.4 Descriptive statistics of the variables
These statistics show the summary of the variables used for the study. Tables and
graphs have been used to illustrate them in a simple and meaningful way.
4.4.1. Consumer information and knowledge of health and environment
This study determined the amount of information and knowledge the respondents
have about health and environment from objective perspectives. A trichotomous measure of
‘True, False and Unsure’ was used to elucidate responses to the associated five questions
represented by variable name ‘KNOWHE’. The Table 4.2 (found also in section A1 of
Appendix 2) shows the descriptive statistics of the five items.
For the item ‘Chemicals used for wine production have effect on the environment’,
24.3% of the respondents answered ‘True’, 14.8 answered ‘False’ while 60.8% of the
respondents were unsure whether chemicals used for wine production have any effect on the
environment.
Table 4.2 Descriptive Statistics for consumer information and knowledge of health and environment
Question KNOWHE True (%) FALSE
(%)
Not sure
(%)
# of
obser-vation
Mean Std Dev
Chemicals used for wine
production have effect on the
environment.
24.34 14.82 60.84 2099 2.36 0.84
Wine produced from grapes
grown with no chemical
application is higher in
antioxidants.
44.5 7.81 47.69 2099 2.03 0.96
The anti-oxidant in wine helps to
reduce cholesterol in the blood.
62.32 7.58 30.11 2099 1.68 0.91
Consumption of naturally produced products reduces cancer
risk.
54.84 10.05 35.11 2099 1.8 0.93
Added chemicals in wine have
long term effects on consumers’ health.
41.16 11.24 47.59 2099 2.06 0.94

102
Forty five per cent of the respondents answered ‘true’ to the statement that wine
produced from grapes grown with no chemical application are higher in antioxidants, 7.0% of
the respondents answered ‘false’ and 48.0% of the respondents were unsure. In terms of
whether the antioxidant in wine helps to reduce cholesterol in the blood, 63.3% of the
respondents answered ‘true’, and 7.6% answered ‘false’ and 30.1% of respondents were
unsure. When asked if consumption of naturally produced products reduces cancer risk,
54.8% of the respondents answered ‘true’, 10.1% answered ‘false’ and 35.1% unsure. On the
issue of long-term effect of chemicals in product on consumers’ health, 41.2% of respondents
indicated that it is ‘true’, 11.2% of the sample stated it is ‘false’ while 47.6% of the sample
answered ‘unsure’.
4.4.2. Consumer information and knowledge of organic wine
Consumers’ information and knowledge of organic wine was measured using five
observed variables designated as KNOWOW (found in section A2 of Appendix 2) that
required respondents to select from a response scale ranging from strongly agree to strongly
disagree. A code of 7 was used to indicate the highest level of knowledge represented by
‘strongly agree’ regarding a particular observed variable. A code of 1 representing ‘strongly
disagree’ was used to represent the least knowledge. The ‘undecided’ option was provided for
respondents who were not able to class themselves into any of the two main divides and a
code of 4 was provided for them to register their lack of opinion.
From the descriptive statistics, 46.8% of the respondents expressed a varied degree of
agreement, (5.4% – strongly agree; 15.6% – agree and 25.8 % – somewhat agree) that
organic wine has specific health benefits that reduces the risk of developing heart diseases.

103
Table 4.3 Descriptive Statistics for consumer information and knowledge of organic wine
Question KNOWOW Strongly disagree
(%)
Disagree (%)
Somewhat disagree (%)
Undecided (%)
Somewhat agree (%)
Agree (%)
Strongly agree (%)
# of obser-
vation
Mean Std Dev
Organic wine has specific health benefits that reduce the risk of
developing heart disease
1.9 4.4 5.5 41.4 25.8 15.6 5.4 2099 4.5 1.2
The organic wine market is growing 1.0 1.8 6.0 32.0 29.9 22.9 6.4 2099 4.8 1.1
When you buy organic wine, you help
the environment
2.1 3.4 6.4 31.6 28.5 21.0 6.9 2099 4.7 1.3
Organic wines do not contain artificial
additives
1.2 1.8 5.4 33.5 24.0 25.9 8.5 2099 4.9 1.2
Organic wine costs more than the
conventional type
0.9 0.6 2.8 20.5 25.5 33.3 16.5 2099 5.354 1.2
In terms of respondents who were undecided about knowledge of organic wine, they
represented 41.4% of the sample. Only less than 12.0% of the respondents had varied levels
of disagreement (1.9% – strongly disagree; 4.4% – disagree and 5.6% – somewhat disagree)
that organic wine has specific health benefits that reduce the risk of developing heart
diseases. The growth of the organic wine market was also considered. While 59.2% of the
respondents agreed varyingly that the market is growing, 32.0% of the respondents were
undecided and only 8.0% disagreed that the market is growing. On the question of ‘When
you buy organic wine, you help the environment’, of the 56.4% of respondents who agreed
with this statement only 6.9% strongly agreed with it, with almost 12.0% in disagreement
while 31.6% of the respondents were undecided.
Furthermore, 8.4% of the respondents disagreed that organic wines do not contain
artificial additives, 33.5% were without opinion and 58.1% agreed that organic wines do not
contain artificial additives. Considering the cost of organic wine relative to conventional
wine, 75.2% of respondents showed different levels of agreement with 16.5% strongly
agreeing that organic wine costs more than the conventional types. However, 20.5% of the
sample had no opinion about the cost differential, while only 4.3% of the sample thought
conventional wine to be more expensive.

104
4.4.3 Current wine acquisition practices
It is pertinent to understand the respondents in terms of their purchasing and
consumption behaviours. Therefore we sought to evaluate how often they consume wine, the
factors that influence their purchase decisions, their preference for where they make
purchases and their consumption patterns. The relevant questions relating to consumers’
current wine acquisition practices are contained in Section B of Appendix 2.
4.4.3.1 How often do consumers drink wine?
The study sought to find out the frequency of wine consumption by the respondents
by providing five options from which the respondents were asked to choose. The descriptive
statistics of all the items related to the frequency of wine consumption is presented in bar
chart in Figure 4.1.
Figure 4.1 shows how often respondents consume wine
The question on how frequently respondents drink wine yielded descriptive statistics that
showed 16.5% of respondents consumed wine daily. The mode of the statistics which was
44.4% represented the respondents that consume wine a few times a week. Less than 24.0%
of the respondents consumed wine once a week while 8.5% of the sample do so fortnightly.
The group of respondents that only consume wine once a month represented 7.0% of the
sample.
16.5
44.4
23.7
8.5 7.0
Everyday A few times a week
Once a week Once a fortnight Once a month
Respondents' frequency of wine consumption (%)

105
To test for a relationship between education level of respondents and their frequency
of wine consumption, the two variables were cross-tabulated and Chi square test was used to
determine the relationship.
Figure 4.1a Cross tabulation: educational qualification and frequency of wine consumption. The ‘28’ in parenthesis indicate
the degree of freedom. Chi square value = 40.717, P-v 0.057
The Chi square test shows a weak positive relationship between educational qualification of
the respondents and their frequency of wine consumption. However across all the education
parameters, consumers that drink wine a few times a week represented the highest
consumption group relative to their proportion in the sample. Also of interest is that on
average across all education groups, more than 80% of the respondents drink wine at least
once a week.
4.4.3.2 Factors that influence the purchase decision in wine
In the survey, respondents were asked to rank the factors that influence their purchase
decision on a scale on 1 – 7 where ‘1’ indicates most important and ‘7’ indicates least
0 5
10 15 20 25 30 35 40 45 50
Res
po
nd
ents
(%
)
Chi2 (28) = 40.717 Pr = 0.057
Cross-abulation of educational qualification and frequency of wine consumption
Every day
A few times a week
Once a week
Once a fortnight
Once a month

106
important. The frequency distribution and descriptive statistics of all the items in this section
are contained in Figure 4.2 and Appendix 5.
In this question, respondents were asked to rank convenience, health benefit, price,
taste, safety, environmental benefit and brand name according to the importance of each
factor in influencing purchasing decisions. About 64% of the respondents ranked taste as the
most important factor influencing their purchasing decision while only 1.7% ranked it as the
least important. This was not a surprise because for products that can only be experienced
during consumption, taste provides the best sensory guarantee of satisfaction (Hultén 2012).
Even Jonis et al. (2008) exploring consumers’ set criteria for selecting new organic wine,
found that 81% of the respondents consider the taste as a very important or important
criterion in selecting a wine, followed by the quality/price ratio - 74%. This study impresses
the importance of producing quality wines, and having prices in relation with the quality.
In terms of price, 19.9% of the respondents considered price as the most important
influence in decision making while 41.0% of the sample considered it the least important.
The health benefit of wine was considered by 4.8% of the respondents as the most important
decision factor in their wine purchase and 6.2% of the sample ranked it least important. For
environmental benefit, 1.4% of respondents considered it as most important in influencing
their purchasing decisions while 33.3% ranked it as the least important. Less than 5.0% of the
respondents indicated brand name as the most important factor in influencing their
purchasing decisions while 12.1% indicated otherwise. In summary, taste (63.9%) and price
(19.9%) represent the most important decision factors in the respondents’ acquisition
decision.

107
Figure 4.2 shows the ranking of decision factor in wine purchase.
When the results in Tables 4.4 and 4.5 are considered, environmental and health
benefits are shown to be of generally low to moderate importance in their acquisition
decision.
Table 4.4 Respondents’ ranking of the importance of Environmental benefit of wine
Rank # of Respondent Percentage
Most important 1 30 1.4
2 41 2.0
3 91 4.3
4 202 9.6
5 342 16.3
6 694 33.1
Least important 7 698 33.3
Total 2099 100
The respondents who considered environmental benefit as least important represented
33.3% of the sample while 6.2% indicated health benefit as least important. These figures are
smaller percentages compared to the 41.0% that indicated price as least important in their
choice decision.
0
10
20
30
40
50
60
70
1 2 3 4 5 6 7 Per
cen
tage
of
resp
on
den
ts
Purchase decision factors
Convenience
Health benefit of wine
Price of the wine
Taste of the wine
Safety
Environmental benefit
Brand name
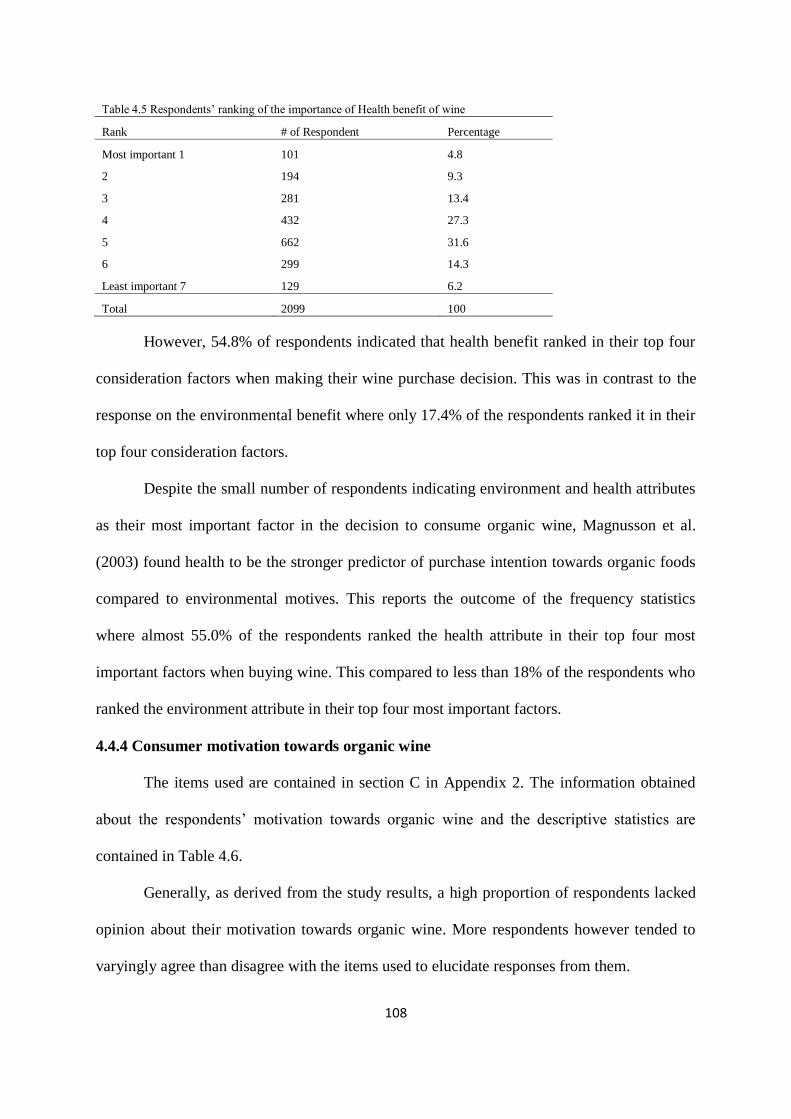
108
Table 4.5 Respondents’ ranking of the importance of Health benefit of wine
Rank # of Respondent Percentage
Most important 1 101 4.8
2 194 9.3
3 281 13.4
4 432 27.3
5 662 31.6
6 299 14.3
Least important 7 129 6.2
Total 2099 100
However, 54.8% of respondents indicated that health benefit ranked in their top four
consideration factors when making their wine purchase decision. This was in contrast to the
response on the environmental benefit where only 17.4% of the respondents ranked it in their
top four consideration factors.
Despite the small number of respondents indicating environment and health attributes
as their most important factor in the decision to consume organic wine, Magnusson et al.
(2003) found health to be the stronger predictor of purchase intention towards organic foods
compared to environmental motives. This reports the outcome of the frequency statistics
where almost 55.0% of the respondents ranked the health attribute in their top four most
important factors when buying wine. This compared to less than 18% of the respondents who
ranked the environment attribute in their top four most important factors.
4.4.4 Consumer motivation towards organic wine
The items used are contained in section C in Appendix 2. The information obtained
about the respondents’ motivation towards organic wine and the descriptive statistics are
contained in Table 4.6.
Generally, as derived from the study results, a high proportion of respondents lacked
opinion about their motivation towards organic wine. More respondents however tended to
varyingly agree than disagree with the items used to elucidate responses from them.
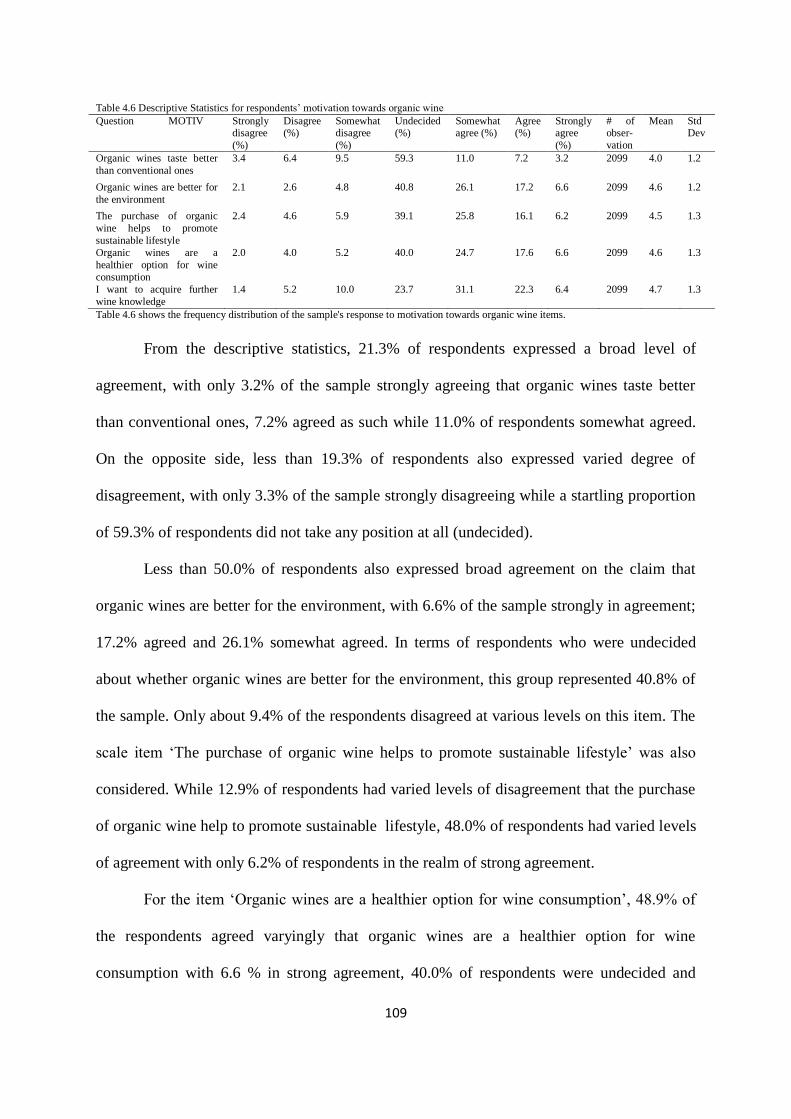
109
Table 4.6 Descriptive Statistics for respondents’ motivation towards organic wine
Question MOTIV Strongly disagree
(%)
Disagree (%)
Somewhat disagree
(%)
Undecided (%)
Somewhat agree (%)
Agree (%)
Strongly agree
(%)
# of obser-
vation
Mean Std Dev
Organic wines taste better
than conventional ones
3.4 6.4 9.5 59.3 11.0 7.2 3.2 2099 4.0 1.2
Organic wines are better for
the environment
2.1 2.6 4.8 40.8 26.1 17.2 6.6 2099 4.6 1.2
The purchase of organic
wine helps to promote
sustainable lifestyle
2.4 4.6 5.9 39.1 25.8 16.1 6.2 2099 4.5 1.3
Organic wines are a
healthier option for wine
consumption
2.0 4.0 5.2 40.0 24.7 17.6 6.6 2099 4.6 1.3
I want to acquire further
wine knowledge
1.4 5.2 10.0 23.7 31.1 22.3 6.4 2099 4.7 1.3
Table 4.6 shows the frequency distribution of the sample's response to motivation towards organic wine items.
From the descriptive statistics, 21.3% of respondents expressed a broad level of
agreement, with only 3.2% of the sample strongly agreeing that organic wines taste better
than conventional ones, 7.2% agreed as such while 11.0% of respondents somewhat agreed.
On the opposite side, less than 19.3% of respondents also expressed varied degree of
disagreement, with only 3.3% of the sample strongly disagreeing while a startling proportion
of 59.3% of respondents did not take any position at all (undecided).
Less than 50.0% of respondents also expressed broad agreement on the claim that
organic wines are better for the environment, with 6.6% of the sample strongly in agreement;
17.2% agreed and 26.1% somewhat agreed. In terms of respondents who were undecided
about whether organic wines are better for the environment, this group represented 40.8% of
the sample. Only about 9.4% of the respondents disagreed at various levels on this item. The
scale item ‘The purchase of organic wine helps to promote sustainable lifestyle’ was also
considered. While 12.9% of respondents had varied levels of disagreement that the purchase
of organic wine help to promote sustainable lifestyle, 48.0% of respondents had varied levels
of agreement with only 6.2% of respondents in the realm of strong agreement.
For the item ‘Organic wines are a healthier option for wine consumption’, 48.9% of
the respondents agreed varyingly that organic wines are a healthier option for wine
consumption with 6.6 % in strong agreement, 40.0% of respondents were undecided and
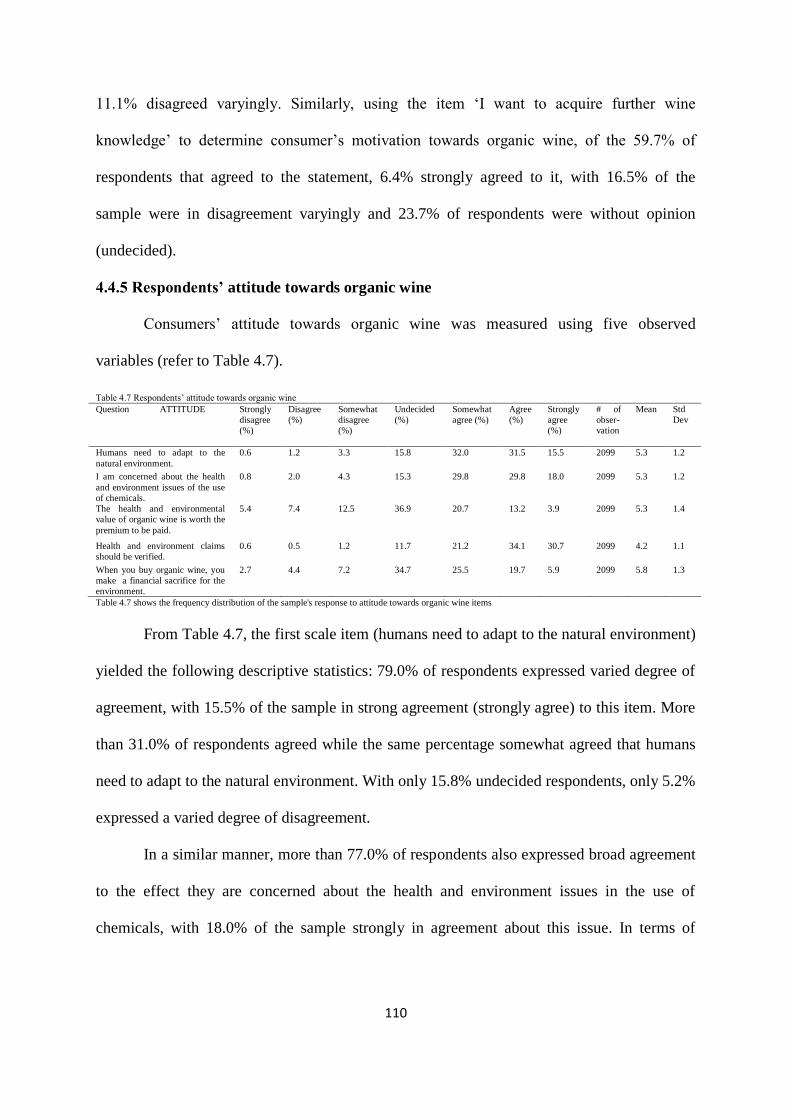
110
11.1% disagreed varyingly. Similarly, using the item ‘I want to acquire further wine
knowledge’ to determine consumer’s motivation towards organic wine, of the 59.7% of
respondents that agreed to the statement, 6.4% strongly agreed to it, with 16.5% of the
sample were in disagreement varyingly and 23.7% of respondents were without opinion
(undecided).
4.4.5 Respondents’ attitude towards organic wine
Consumers’ attitude towards organic wine was measured using five observed
variables (refer to Table 4.7).
Table 4.7 Respondents’ attitude towards organic wine
Question ATTITUDE Strongly
disagree
(%)
Disagree
(%)
Somewhat
disagree
(%)
Undecided
(%)
Somewhat
agree (%)
Agree
(%)
Strongly
agree
(%)
# of
obser-
vation
Mean Std
Dev
Humans need to adapt to the
natural environment.
0.6 1.2 3.3 15.8 32.0 31.5 15.5 2099 5.3 1.2
I am concerned about the health
and environment issues of the use
of chemicals.
0.8 2.0 4.3 15.3 29.8 29.8 18.0 2099 5.3 1.2
The health and environmental
value of organic wine is worth the
premium to be paid.
5.4 7.4 12.5 36.9 20.7 13.2 3.9 2099 5.3 1.4
Health and environment claims
should be verified.
0.6 0.5 1.2 11.7 21.2 34.1 30.7 2099 4.2 1.1
When you buy organic wine, you
make a financial sacrifice for the
environment.
2.7 4.4 7.2 34.7 25.5 19.7 5.9 2099 5.8 1.3
Table 4.7 shows the frequency distribution of the sample's response to attitude towards organic wine items
From Table 4.7, the first scale item (humans need to adapt to the natural environment)
yielded the following descriptive statistics: 79.0% of respondents expressed varied degree of
agreement, with 15.5% of the sample in strong agreement (strongly agree) to this item. More
than 31.0% of respondents agreed while the same percentage somewhat agreed that humans
need to adapt to the natural environment. With only 15.8% undecided respondents, only 5.2%
expressed a varied degree of disagreement.
In a similar manner, more than 77.0% of respondents also expressed broad agreement
to the effect they are concerned about the health and environment issues in the use of
chemicals, with 18.0% of the sample strongly in agreement about this issue. In terms of

111
respondents who were undecided, this group represented 15.3% of the sample. Only about
7.1% of the respondents disagreed with this claim at various levels.
In terms of whether the health and environmental value of organic wine is worth the
premium to be paid, only 37.8% of the respondents agreed varyingly with this statement, with
less than 4.0% of the respondents in strong agreement (strongly agree). More than 36.0% of
the respondents were undecided and 25.3% varyingly disagreed.
Similarly, on the question of whether the health and environment claims of organic
wine should be verified, 86.0% of respondents agreed varyingly with the claim, with less than
3.0% in disagreement and 11.7% without opinion (undecided). Fifty one per cent of
respondents expressed various levels of agreement that when you buy organic wine, you
make a financial sacrifice for the environment and 14.3% varyingly disagreed, while 34.7%
of the sample was undecided.
4.4.6 Respondents’ perceived risk towards organic wine
In this study, perceived risk was operationalised based on the likelihood of the risk
occurring, and the seriousness if it did occur (Cunningham 1967; Joag, Mowen & Gentry
1990).
4.4.6.1 Respondents’ perceived risk towards organic wine: Likelihood
The statistics for the likelihood of consumers’ perception of risk was gathered using
five items (refer to Table 4.8). This descriptive statistics reveals 44.0% of the respondents
expressed varied degrees of perceived risk to the notion that when they buy organic wine, it
may not taste good. More than 5.0% of the sample indicated they are ‘very likely’ to perceive
the risk when they buy wine. Another 12.1% of respondents answered that they are ‘likely’ to
perceive the risk when they buy wine, while 26.7% answered that they are ‘somewhat likely’

112
to perceive the risk when they buy wine. These groups of hesitant respondents that perceived
risk are importantly noted to be of low wine knowledge (Hershey & Walsh 2001).
Table 4.8 Descriptive Statistics for respondents’ perception of risk
(likelihood)
Question
PERRISKL
Very
unlikely
(%)
Unlikely
(%)
Somewhat
unlikely
(%)
Undecided
(%)
Somewhat
likely (%)
Likely
(%)
Very
likely
(%)
# of
obser-
vation
Mean Std
Dev
The wine may not taste
good.
2.1 6.0 12.3 35.6 26.7 12.1 5.2 2099 4.4 1.3
The benefit may not be
commensurate with the
premium paid.
1.2 2.8 4.8 29.9 30.3 19.2 12.0 2099 4.9 1.3
The wine may not meet
friends’ or family’s
expectations.
2.0 5.0 10.3 35.5 27.3 15.0 5.0 2099 4.5 1.3
It may not create any
environmental benefits.
1.901 3.5 9.6 35.2 27.8 15.1 7.0 2099 4.6 1.3
The health benefits claim
may not be true.
1.6 3.1 7.6 33.4 30.3 15.9 8.1 2099 4.7 1.3
Table 4.8 shows the frequency distribution of the sample's response to perception of risk (likelihood) items
The respondents who expressed varied levels of unlikelihood that the wine might not
taste good represented 0.4% of the respondents. For this question, the mean of the response
was 4.36, indicative of the fact that there were more respondents who felt the likelihood that a
wine might not taste good. In the same vein, respondents who expressed varied levels of
likelihood that the benefits of organic wine may not be commensurate to the premium paid
represented 61.4% of the sample, with 8.7% answering varyingly to this claim. The
respondents who were not able to make an opinion about the item comprised 29.9%. The
mean of the response to this item was 4.9, which indicated that there were more respondents
who think it is likely that the benefits of organic wine may not be commensurate to the
premium paid.
Similarly, the proportion of respondents who expressed varied levels of likelihood
that the wine may not meet friends’ or family’s expectations was 47.3%, with 17.2% of the
sample answering varyingly to this. There were 35.5% respondents who were not able to
make an opinion about the item. The mean of the response to this item was 4.5, which
indicated also that there were more respondents who think it likely that the wine may not
meet friends’ or family’s expectations.
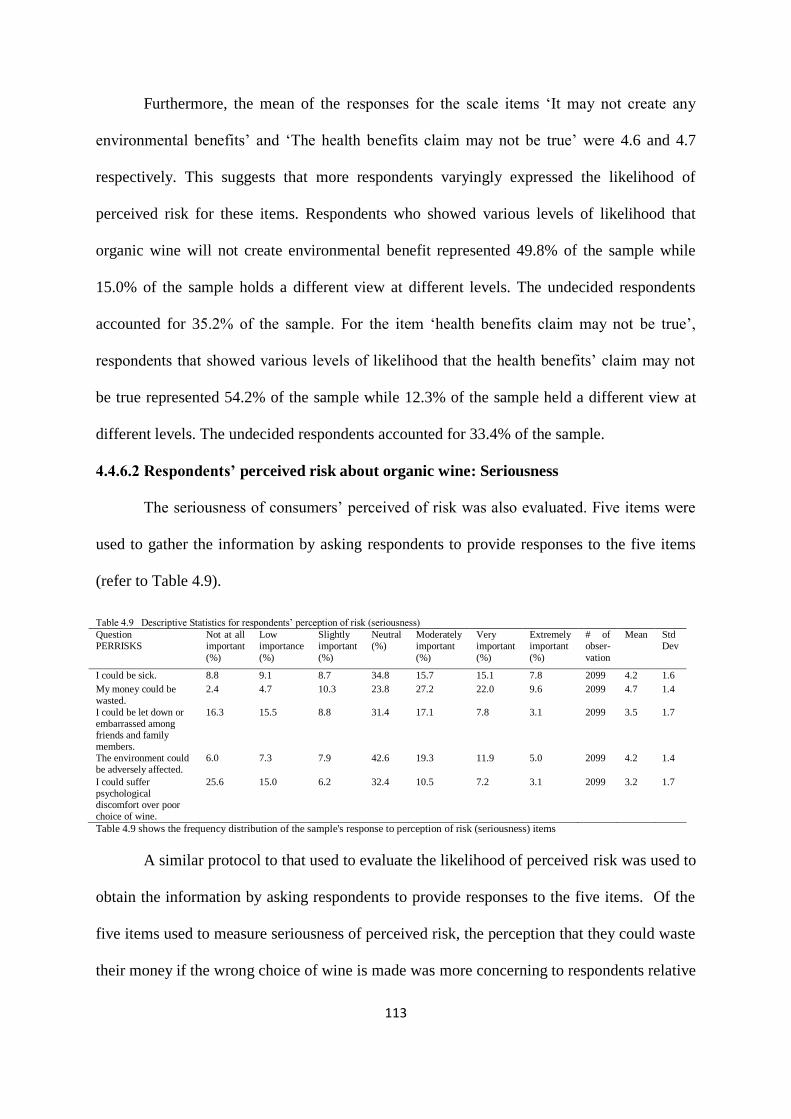
113
Furthermore, the mean of the responses for the scale items ‘It may not create any
environmental benefits’ and ‘The health benefits claim may not be true’ were 4.6 and 4.7
respectively. This suggests that more respondents varyingly expressed the likelihood of
perceived risk for these items. Respondents who showed various levels of likelihood that
organic wine will not create environmental benefit represented 49.8% of the sample while
15.0% of the sample holds a different view at different levels. The undecided respondents
accounted for 35.2% of the sample. For the item ‘health benefits claim may not be true’,
respondents that showed various levels of likelihood that the health benefits’ claim may not
be true represented 54.2% of the sample while 12.3% of the sample held a different view at
different levels. The undecided respondents accounted for 33.4% of the sample.
4.4.6.2 Respondents’ perceived risk about organic wine: Seriousness
The seriousness of consumers’ perceived of risk was also evaluated. Five items were
used to gather the information by asking respondents to provide responses to the five items
(refer to Table 4.9).
Table 4.9 Descriptive Statistics for respondents’ perception of risk (seriousness) Question
PERRISKS Not at all important
(%)
Low importance
(%)
Slightly important
(%)
Neutral (%)
Moderately important
(%)
Very important
(%)
Extremely important
(%)
# of obser-
vation
Mean Std Dev
I could be sick. 8.8 9.1 8.7 34.8 15.7 15.1 7.8 2099 4.2 1.6
My money could be wasted.
2.4 4.7 10.3 23.8 27.2 22.0 9.6 2099 4.7 1.4
I could be let down or embarrassed among friends and family members.
16.3 15.5 8.8 31.4 17.1 7.8 3.1 2099 3.5 1.7
The environment could be adversely affected.
6.0 7.3 7.9 42.6 19.3 11.9 5.0 2099 4.2 1.4
I could suffer psychological discomfort over poor choice of wine.
25.6 15.0 6.2 32.4 10.5 7.2 3.1 2099 3.2 1.7
Table 4.9 shows the frequency distribution of the sample's response to perception of risk (seriousness) items
A similar protocol to that used to evaluate the likelihood of perceived risk was used to
obtain the information by asking respondents to provide responses to the five items. Of the
five items used to measure seriousness of perceived risk, the perception that they could waste
their money if the wrong choice of wine is made was more concerning to respondents relative

114
to any other items. More than 58.0% of respondents expressed different levels of importance
(from moderately important, very important to extremely important) to the effect that money
could be wasted when the wrong choice of wine is made. Less that 24.0% of the sample held
no position on this matter while 17.4% of the sample answered varyingly that it was not
‘important at all’, of ‘low importance’ or ‘slightly important for this item.
4.4.7 Respondents’ risk reduction strategy
To evaluate the RRS consumers adopt, respondents were asked to provide responses
to the items in Tables 4.10 – 4.12.
4.4.7.1 Respondents’ risk reduction strategy (Intrinsic product related)
Table 4.10 Descriptive Statistics for respondents’ risk reduction strategy (intrinsic product related)
Question
RISKREDI
Very
unlikely
(%)
Unlikely
(%)
Somewhat
unlikely
Undecided
(%)
Somewhat
likely (%)
Likely
(%)
Very
likely
# of
obser-
vation
Mean Std
Dev
Relying on the style to
buy an organic wine.
3.8 6.3 10.5 34.6 25.3 15.0 4.48 2099 4.3 1.4
Relying on the vintage
year when choosing
organic wine.
5.0 8.2 14.5 37.9 22.3 9.3 2.76 2099 4.0 1.3
Relying on smell to buy
an organic wine.
3.4 6.1 10.5 29.9 30.2 15.5 4.48 2099 4.4 1.3
Relying on the taste to
buy an organic wine.
1.7 1.7 3.9 19.464 26.3 27.1 19.9 2099 5.3 1.3
Relying on mouth feel
to buy an organic wine.
2.7 3.9 7.5 29.6 29.9 18.3 8.19 2099 4.6 1.4
Table 4.10 shows the frequency distribution of the sample's response to risk reduction strategy (intrinsic product related) items
From the descriptive statistics in Table 4.10, 44.7% of respondents expressed a varied
degree of likelihood of reliance on style to buy an organic wine as an RRS. More than 5.0%
of the sample indicated in their response that they were ‘very likely’ to rely on the style to
buy an organic wine as an RRS. Another 15.0% of the respondents answered that they are
‘likely’ to rely on the style to buy an organic wine as a RRS while 25.3% of the sample
answered that they are ‘somewhat likely’ to rely on this aspect as RRS. The respondents who
expressed varied levels of unlikelihood to rely on the style to buy an organic wine as a RRS
represented 20.6% of the sample (3.8% - Very unlikely; 6.3% – Unlikely and 10.5% -
somewhat unlikely).
In the same vein, the respondents who expressed varied levels of likelihood that they
would rely on the vintage year when choosing organic wine represented 34.4% of

115
respondents, with 27.7% of the sample answering varyingly the unlikelihood. There were
37.9% of respondents who were not able to make an opinion about the item. The respondents
that expressed broad likelihood that they rely on smell to buy an organic wine as an RRS
represented 50.2% of the sample, with 20.0% answering varyingly otherwise. The
respondents who were not able to make an opinion about the item represented 29.9% of the
sample. The mean of the response to this item was 4.4, which indicates also that there were
more respondents who would be likely to rely on smell as an RRS when buying an organic
wine. Furthermore, the mean of the responses for the scale items ‘Relying on taste to buy an
organic wine’ and ‘Relying on mouth feel to buy an organic wine’ were 5.3 and 4.6
respectively. This suggested that more respondents varyingly expressed the likelihood of
these items as an RRS.
Respondents who showed various levels of likelihood that they would rely on taste to
buy an organic wine represented 73.3% of the sample (19.2% - Very likely; 27.1% – Likely
and 26.3% - somewhat likely) while only 7.3% of the sample (1.7% - Very unlikely; 1.7% –
Unlikely and 3.9% - somewhat unlikely) held an opposite view at different levels. The
undecided respondents accounted for 19.4% of the sample. For the scale item ‘Relying on the
mouth feel to buy an organic wine’, respondents who showed various levels of likelihood
represented 56.4% of the sample while 14.0% of the sample held an opposite view at
different levels. The undecided respondents accounted for 29.6% of the sample.
4.4.7.2 Respondents’ risk reduction strategy (Extrinsic product related)
Table 4.11 contains information on the likelihood of consumers applying the extrinsic
product related RRS in a wine occasion. Respondents who showed various levels of
likelihood of choosing organic wine with expert endorsement represented 54.7% of the
sample (5.4% - Very likely; 19.4% – Likely and 29.9% - somewhat likely) while only 17.4%
of the sample (4.0% - Very unlikely; 4.5% – Unlikely and 9.0% - somewhat unlikely) held
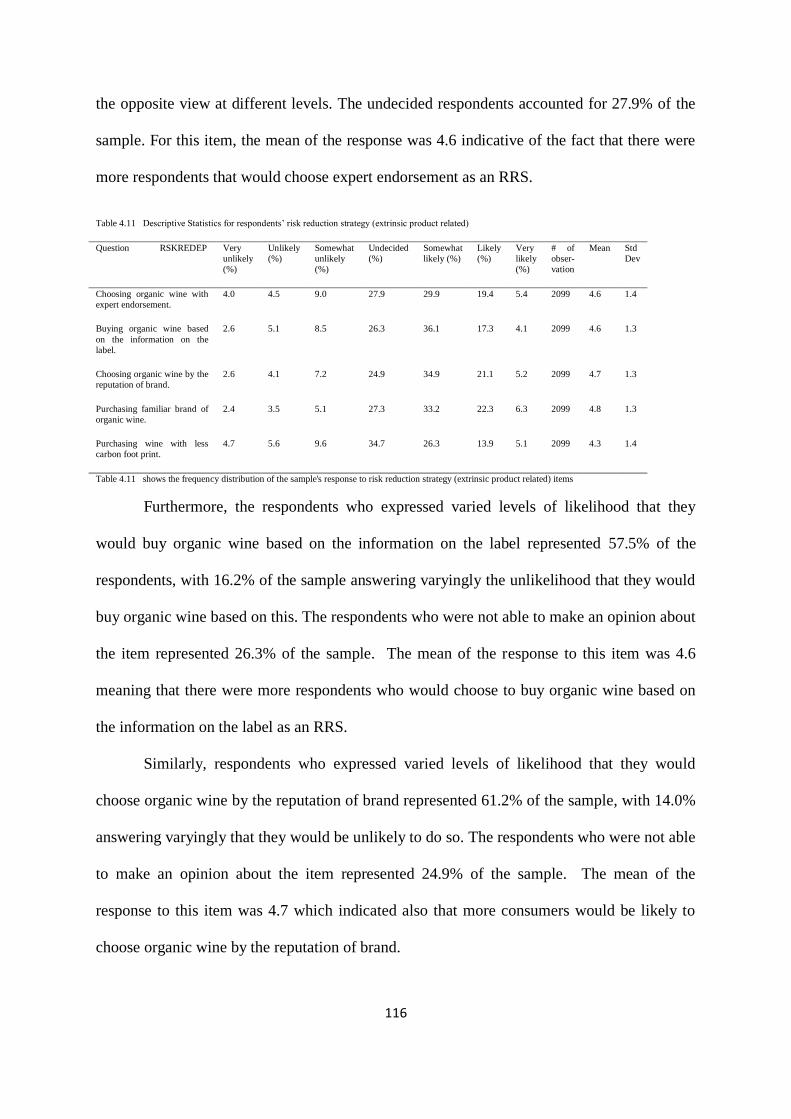
116
the opposite view at different levels. The undecided respondents accounted for 27.9% of the
sample. For this item, the mean of the response was 4.6 indicative of the fact that there were
more respondents that would choose expert endorsement as an RRS.
Table 4.11 Descriptive Statistics for respondents’ risk reduction strategy (extrinsic product related)
Question RSKREDEP Very
unlikely
(%)
Unlikely
(%)
Somewhat
unlikely
(%)
Undecided
(%)
Somewhat
likely (%)
Likely
(%)
Very
likely
(%)
# of
obser-
vation
Mean Std
Dev
Choosing organic wine with
expert endorsement.
4.0 4.5 9.0 27.9 29.9 19.4 5.4 2099 4.6 1.4
Buying organic wine based
on the information on the
label.
2.6 5.1 8.5 26.3 36.1 17.3 4.1 2099 4.6 1.3
Choosing organic wine by the
reputation of brand.
2.6 4.1 7.2 24.9 34.9 21.1 5.2 2099 4.7 1.3
Purchasing familiar brand of
organic wine.
2.4 3.5 5.1 27.3 33.2 22.3 6.3 2099 4.8 1.3
Purchasing wine with less
carbon foot print.
4.7 5.6 9.6 34.7 26.3 13.9 5.1 2099 4.3 1.4
Table 4.11 shows the frequency distribution of the sample's response to risk reduction strategy (extrinsic product related) items
Furthermore, the respondents who expressed varied levels of likelihood that they
would buy organic wine based on the information on the label represented 57.5% of the
respondents, with 16.2% of the sample answering varyingly the unlikelihood that they would
buy organic wine based on this. The respondents who were not able to make an opinion about
the item represented 26.3% of the sample. The mean of the response to this item was 4.6
meaning that there were more respondents who would choose to buy organic wine based on
the information on the label as an RRS.
Similarly, respondents who expressed varied levels of likelihood that they would
choose organic wine by the reputation of brand represented 61.2% of the sample, with 14.0%
answering varyingly that they would be unlikely to do so. The respondents who were not able
to make an opinion about the item represented 24.9% of the sample. The mean of the
response to this item was 4.7 which indicated also that more consumers would be likely to
choose organic wine by the reputation of brand.

117
Additionally, the mean of the responses for the scale items ‘Purchasing familiar brand
of organic wine’ and ‘Purchasing wine with less carbon foot print’ were 4.8 and 4.3
respectively. This suggested that more respondents varyingly expressed the likelihood to use
these items as an RRS. Respondents that showed various levels of likelihood of using
‘Purchasing familiar brand of organic wine’ represented 61.8% of the sample while 10.9% of
the sample held the opposite view at different levels. The undecided respondents accounted
for 27.3% of the sample. For the item ‘Purchasing wine with less carbon foot print’,
respondents who answered to various levels of likelihood represented 45.3% of the sample
while 20.0% of the sample held opposite view at different levels. The undecided respondents
accounted for 34.7% of the sample.
4.4.7.3 Respondents’ risk reduction strategy (Store related)
Table 4.12 contains information on the likelihood of consumers applying the store
related RRS in a wine occasion. From the table, respondents who showed various levels of
likelihood of purchasing wine from a store that has reviews on wine represented 62.8% of the
sample (6.00% - Very likely; 22.3% – Likely and 34.5% - somewhat likely) while only
12.2% of the sample (1.6% - Very unlikely; 3.5% – Unlikely and 7.1% - somewhat unlikely)
held an opposite view at different levels. The undecided respondents accounted for 25.0% of
the sample.
The respondents who expressed varied levels of likelihood that they would use the
reputation of a wine store to make a purchase decision represented 61.3% of the respondents,
with 15.3% of the sample answering varyingly on the unlikelihood. The respondents who
were not able to make an opinion about the item represented 23.3% of the sample. The mean
of the response to this item was 4.7, which indicated that there are more respondents that
likely would use the reputation of a wine store as an RRS.
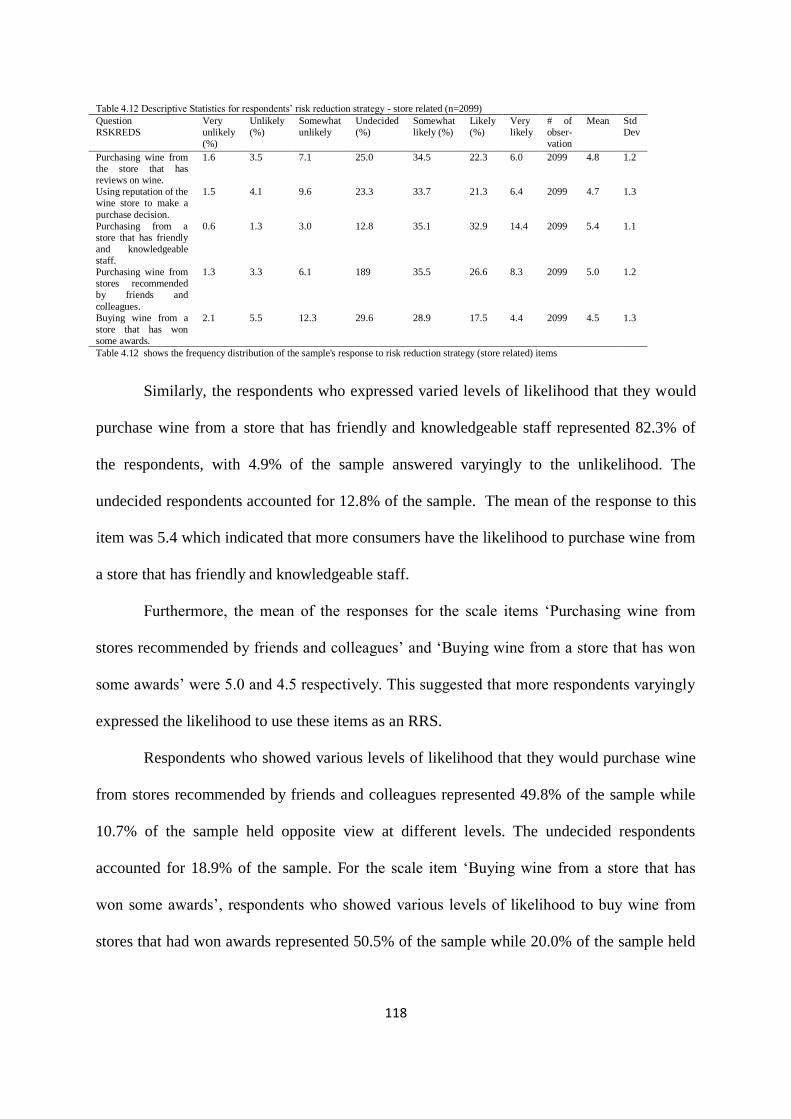
118
Table 4.12 Descriptive Statistics for respondents’ risk reduction strategy - store related (n=2099)
Question RSKREDS
Very unlikely (%)
Unlikely (%)
Somewhat unlikely
Undecided (%)
Somewhat likely (%)
Likely (%)
Very likely
# of obser-vation
Mean Std Dev
Purchasing wine from the store that has reviews on wine.
1.6 3.5 7.1 25.0 34.5 22.3 6.0 2099 4.8 1.2
Using reputation of the wine store to make a
purchase decision.
1.5 4.1 9.6 23.3 33.7 21.3 6.4 2099 4.7 1.3
Purchasing from a store that has friendly and knowledgeable staff.
0.6 1.3 3.0 12.8 35.1 32.9 14.4 2099 5.4 1.1
Purchasing wine from stores recommended by friends and
colleagues.
1.3 3.3 6.1 189 35.5 26.6 8.3 2099 5.0 1.2
Buying wine from a store that has won some awards.
2.1 5.5 12.3 29.6 28.9 17.5 4.4 2099 4.5 1.3
Table 4.12 shows the frequency distribution of the sample's response to risk reduction strategy (store related) items
Similarly, the respondents who expressed varied levels of likelihood that they would
purchase wine from a store that has friendly and knowledgeable staff represented 82.3% of
the respondents, with 4.9% of the sample answered varyingly to the unlikelihood. The
undecided respondents accounted for 12.8% of the sample. The mean of the response to this
item was 5.4 which indicated that more consumers have the likelihood to purchase wine from
a store that has friendly and knowledgeable staff.
Furthermore, the mean of the responses for the scale items ‘Purchasing wine from
stores recommended by friends and colleagues’ and ‘Buying wine from a store that has won
some awards’ were 5.0 and 4.5 respectively. This suggested that more respondents varyingly
expressed the likelihood to use these items as an RRS.
Respondents who showed various levels of likelihood that they would purchase wine
from stores recommended by friends and colleagues represented 49.8% of the sample while
10.7% of the sample held opposite view at different levels. The undecided respondents
accounted for 18.9% of the sample. For the scale item ‘Buying wine from a store that has
won some awards’, respondents who showed various levels of likelihood to buy wine from
stores that had won awards represented 50.5% of the sample while 20.0% of the sample held
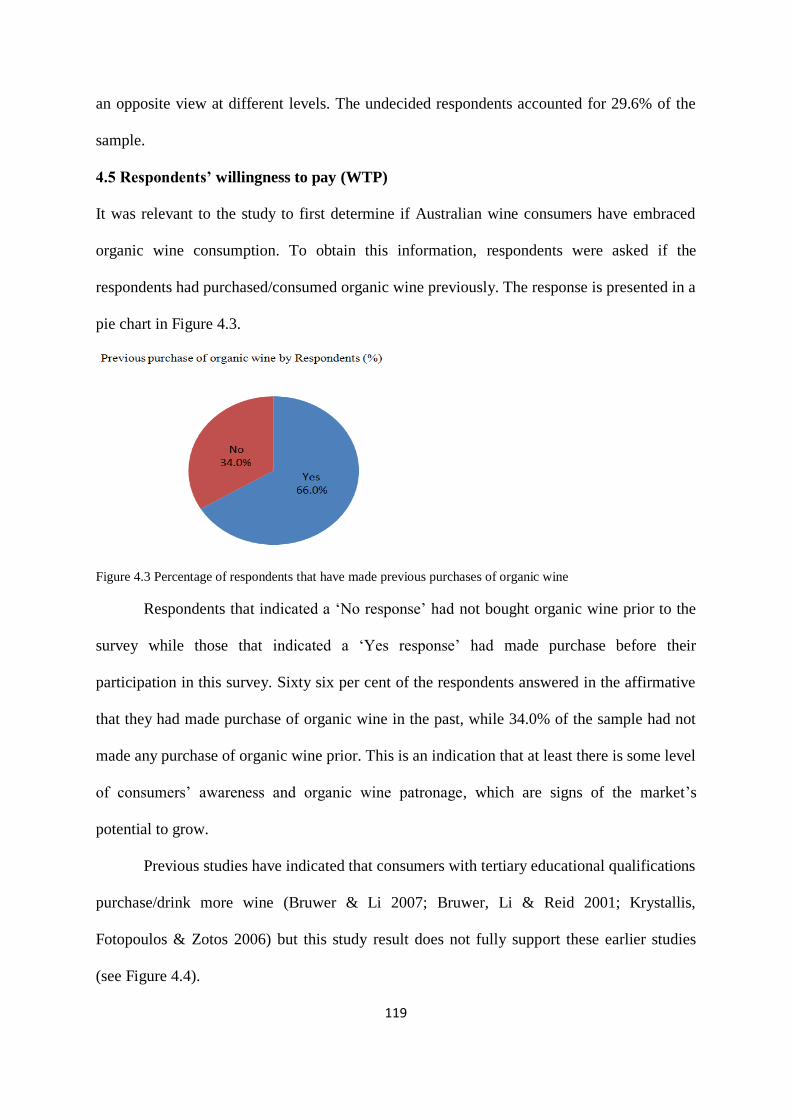
119
an opposite view at different levels. The undecided respondents accounted for 29.6% of the
sample.
4.5 Respondents’ willingness to pay (WTP)
It was relevant to the study to first determine if Australian wine consumers have embraced
organic wine consumption. To obtain this information, respondents were asked if the
respondents had purchased/consumed organic wine previously. The response is presented in a
pie chart in Figure 4.3.
Figure 4.3 Percentage of respondents that have made previous purchases of organic wine
Respondents that indicated a ‘No response’ had not bought organic wine prior to the
survey while those that indicated a ‘Yes response’ had made purchase before their
participation in this survey. Sixty six per cent of the respondents answered in the affirmative
that they had made purchase of organic wine in the past, while 34.0% of the sample had not
made any purchase of organic wine prior. This is an indication that at least there is some level
of consumers’ awareness and organic wine patronage, which are signs of the market’s
potential to grow.
Previous studies have indicated that consumers with tertiary educational qualifications
purchase/drink more wine (Bruwer & Li 2007; Bruwer, Li & Reid 2001; Krystallis,
Fotopoulos & Zotos 2006) but this study result does not fully support these earlier studies
(see Figure 4.4).
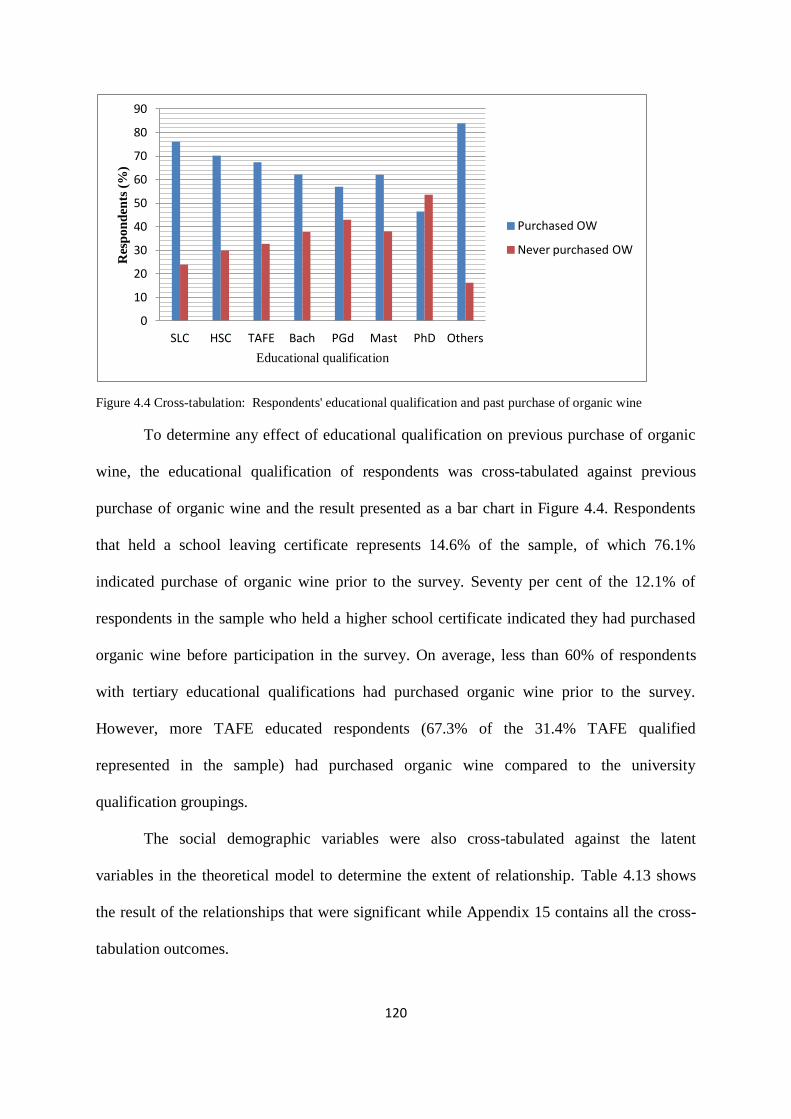
120
Figure 4.4 Cross-tabulation: Respondents' educational qualification and past purchase of organic wine
To determine any effect of educational qualification on previous purchase of organic
wine, the educational qualification of respondents was cross-tabulated against previous
purchase of organic wine and the result presented as a bar chart in Figure 4.4. Respondents
that held a school leaving certificate represents 14.6% of the sample, of which 76.1%
indicated purchase of organic wine prior to the survey. Seventy per cent of the 12.1% of
respondents in the sample who held a higher school certificate indicated they had purchased
organic wine before participation in the survey. On average, less than 60% of respondents
with tertiary educational qualifications had purchased organic wine prior to the survey.
However, more TAFE educated respondents (67.3% of the 31.4% TAFE qualified
represented in the sample) had purchased organic wine compared to the university
qualification groupings.
The social demographic variables were also cross-tabulated against the latent
variables in the theoretical model to determine the extent of relationship. Table 4.13 shows
the result of the relationships that were significant while Appendix 15 contains all the cross-
tabulation outcomes.
0
10
20
30
40
50
60
70
80
90
SLC HSC TAFE Bach PGd Mast PhD Others
Res
pon
den
ts (
%)
Educational qualification
Purchased OW
Never purchased OW

121
Table 4.13 Cross-tabulation of Social Demographic variables and Latent variables: Chi
Square Test Result
Cross-tabulation of Social Demographic variables and Latent variables: Chi Square Test Result (n = 2099)
Social demographic variable cross-tabulated with Latent variables Df Chi2 Value Probability Significance
Income V Knowledge 192 220.3 0.079 *
Education V Motive 42 54.10 0.100 *
Gender V Motive 6 38.37 0.001 ***
Gender V Perceived risk 47 61.83 0.072 *
Gender V Attitude 24 57.32 0.001 ***
Gender V Knowledge 32 65.75 0.001 ***
Occupation V Motive 42 82.00 0.001 ***
Occupation V Risk reduction strategy 504 591.12 0.004 ***
Occupation V Perceived risk 329 371.57 0.053 *
Occupation V Knowledge 224 280.47 0.006 **
Marital status V Risk reduction strategy 288 342.46 0.015 **
Marital status V Perceived risk 188 282.67 0.001 ***
Age V Motive 42 110.52 0.001 ***
Age V Attitude 168 202.21 0.037 **
***, **, * Indicates level of significant at the 0.01 level, 0.05 level, 0.10 level, Df = degree of freedom, V = cross-tabulation,
Non = Non significant
Gender V Perceived risk, Gender V Attitude, Gender V Knowledge,
Occupation V Motive, Marital status V Perceived risk and Age V Motive show strong level
of relationship while Income V Knowledge, Education V Motive, Gender V Perceived risk
shows weak relationship. These no doubt will have impact on consumer’s product assessment
in market situation and the willingness to pay a premium.
4.6 Discussion of sample and variables statistics
Data screening statistics are usually not reported in studies; it is an approach to
measure the efficiency and/or effectiveness of the data collection process and validate the
choice of method used. The sample and variables statistics are also presented in this chapter
and the discussion highlights salient points applicable to all the three attributes in the study –
WTP premium for the environmental and health benefits of organic wine and the expert
service provided by retail wine stores. The sample characteristics are important to this study.
Apart from ensuring that the appropriate respondents are used for the research, they
provide information about them that are relevant to WTP for the environmental and health

122
benefits of organic wine and the expert service of retailer. The spread of the sample and its
proportionate representation across the states and territories of Australia enabled the use of a
sample that is representative in terms of wine involvement (Mueller & Umberger 2010).
South Australian involvement with wine is reportedly higher than the rest of the country and
the use of a localised sample would have presented a biased inference on Australian wine
drinkers.
In the study, descriptive statistics was used to reveal the characteristics of the
respondents. The gender, age, education and income statistics are consistent in pattern with
the outcome of some Australian and other countries studies on conventional wine in terms of
wine consumption frequency, decision factors, and social demographics (e.g. Saliba,
Ovington & Moran 2013; Mueller & Umberger 2009; Barber 2008; Barber, Taylor & Strick
2009; Bruwer & Li 2007; Hughner et al. 2007; Jong et al. 2003; Tsourgiannis, Karasavvoglou
& Nikolaidis 2013; Urutyan & Ngo 2007).
High-income earners have been found to be purchasers of organic products.
Education, occupation and income interact with each other to determine the purchasing
power of consumer and willingness to pay for innovative products. The sample statistics
indicates more than 68% of the respondents are on an annual income of over $50,000.00.
This demonstrates that, barring other hindrances, income is unlikely to be a major limitation
to respondents’ willingness to pay for the study attributes of organic wine and expert service
of wine store (Hawkins, Del & Best 2003).
The study investigated how often consumers drink wine. Our result reveals that about
84.0% of respondents drink wine regularly, at least once a week. Cumulatively only about
16% of the respondents drink wine fortnightly or monthly. This indicates that there is a strong
existing wine market, which consumes both conventional and organic wines. Building an

123
organic appeal to induce current consumers to try a wine that is produced differently will be
of great interest.
The study sample shows 66.0% of respondents had purchased organic wine
previously, and the response provided to enquiry about their knowledge of environment,
health and organic wine (refer to Tables 4.2 and 4.3) indicates that product knowledge is
limited, or that the respondents are not confident enough to be decisive in choosing their
response. This was reasoned based on the large number of respondents who were undecided,
and the number of respondents who broadly disagreed with the questions used to test their
knowledge.
Rationalising the relationship between the previous purchase score and the knowledge
of respondents about environment, health and organic wine, the study suggests that some of
the respondents must have been image seekers or are just curious consumers. This view was
supported by (Havitz & Mannell 2005; Mann, Ferjani & Reissig 2012; Rodrigo, Miranda &
Vergara 2011; Tsourgiannis, Karasavvoglou & Nikolaidis 2013), and can be developed into
strategy for marketing organic wine to connoisseurs and image seeking consumers segments.
The fact that 66.0% of respondents had made a previous purchase of organic wine
attests to the growing awareness of the product, which is consistent with the findings of
Naspetti and Zanoli (2009), Bhaskaran et al. (2006), as well as Siderer, Maquet and Anklam
(2005). The large number of respondents who were undecided and the number of respondents
that varyingly disagreed with the questions used to test their knowledge indicate that a
sizeable proportion did not have product knowledge about organic wine. In this circumstance,
consumers are not able to assess the product and its attributes, therefore cannot put a value on
it or link the product to their personal values. The divergent and most time conflicting views
and information at the consumer domain are difficult to reconcile, create doubt and deplete

124
confidence. This negatively impacts on consumer enthusiasm towards the organic wine and
its benefits and consequently WTP.
Considering the results in Table 4.4 and 4.5, it is tempting to see organic wine from a
different perspective compared to other organic products. Organic foods are consumed
mainly for the functional benefits. Wine consumers primarily are pleasure seekers (Ogbeide
& Bruwer 2013). This core value is the most central element of wine consumers’ cognitive
structure that exerts more influence on behaviour and is more deeply held than peripheral
ones like health benefits (Cohen & Chakravarti 1990).
The analysis of decision factor points to taste and price as the two most important
decisions considered when making wine purchase. Price has been used to measure quality
(Benjamin & Podolny 1999; Charters & Pettigrew 2006; Shapiro 1983) and is known to
influence the level of perceived risk about a product or its attributes (Mitchell 1999).
Taste is a very important attribute of organic products, as previous research has
indicated that organic products are tastier and taste attracts consumers (Hultén 2012;
Stobbelaar et al. 2007). This attribute has not been fully embraced about organic wine.
Organic wine is stereotyped as low quality; earlier producers lacked the winemaking skills to
produce fine organic wine (ORWINE 2007). Therefore the quality (taste) issue about organic
wine relates to the perceived low quality. A public relation strategy that includes word of
mouth, use of online interactive tools, organic wine tasting events and product samples must
be employed to enable wine consumers have a second opinion about the product.
If taste is the primary consideration in wine purchase, this presents a quandary as to
whether organic wine in particular should be marketed principally for its tastiness, while the
environmental and health benefits are treated as subsidiary benefits in the marketing context.
Marketing organic wine from the quality (taste) perspective will end the perceived low image
held by consumers sooner and appeal to them to try the product. This study opinion is that
125
marketing organic wine by its taste attribute will refine or remodel it into people’s
subconsciousness as taste can be instantly assessed by the consumers through simple sensory
evaluation by mouth. Environmental and health benefits can require scientific analyses to
determine; this is above the scope of most consumers thus creating difficulty in convincing
individuals about these benefits. Therefore, taste must be promoted just as vigorously as
environmental and health benefits in the organic equation.
Price is also highly considered as an important decision factor in organic wine
purchase due to the perception of intrinsic and extrinsic risks. More than 44.0% of
respondents expressed broad level of perceived risk likelihood, and the more than 30.0% of
respondents were undecided (not confident) (refer to Table 4.10). Consumers can perceive a
risk of the product not meeting value for money (compromised sensory value) or meeting the
purpose for which the wine is purchased. Consumers generally consider organic products as
expensive and are motivated by value for money. Organic wine should be produced such that
the shelf price is inexpensive and should not necessarily be such a high end product, instead
should be available at all consumer price ranges.
Finally, the claims and counter claims about certification, labelling by organic
producers, the differences within and between countries of organic wine definition, create and
increase uncertainty in the mind of consumers. This affects WTP to pay stated price or
premium as consumers exercise caution to avoid the consequence of wasted money, thus
limiting the use and effectiveness of the word of mouth as a strategic risk reducer.

126
Chapter Five
Result and Discussion on Willingness to Pay for the Environmental Benefit
of Organic Wine
5.1 Introduction
In the previous chapter, the sampling, sample and variable statistics were discussed.
This chapter provides an overview, highlighting the difference in respondents’ WTP. This is
followed by the results of factor analysis, reliability test, the factors that influence the
willingness to pay for the environmental benefit, marginal analysis, the hypotheses outcome
and finally discussion. For the sample and variables description, refer to chapter four and
Appendix 10. The synthesis showing the theoretical model including hypotheses that are
confirmed and the direction is contained in Appendix 14 and 14a
5.2 Willingness to pay for the environmental benefit of organic wine
This study elicited consumers’ WTP for environmental benefit of organic wine (refer
to Figure 5.1).
The wine with environmental benefit was designated “WINE A”, and presented to
respondents as: “The wine is eco-friendly, made from grapes grown without the use of
chemicals which could pollute the air, soil water” (refer to Appendix 2). This wine
represented wine with environmental benefit attributes and the willingness to pay a premium
for it was denoted as WTPe.
56% 44%
Figure 5.1 Result of respondents' WTPe
yes
No

127
The wine was not identified by any conventional nomenclature related to styles,
colours or types to avoid preference bias.
Respondents were asked to indicate their WTP for these attributes. Respondents that
provided a “yes” response showed willingness to pay a premium for the environmental
benefit of organic wine while those that provided “no” response were not willing to pay a
premium for the attribute. The frequency distribution and descriptive statistics of the outcome
are presented in Figure 5.1. Approximately 56% of the respondents expressed WTP for
environmental benefit of organic wine and about 44% of the sample responded otherwise.
5.2.1 Results of premium respondents are willing to pay for the environmental benefits
of organic wine
The proportion of respondents that expressed WTP $1.00 (10.1%) premium for wine with
environmental benefit was approximately 13%, (refer to Figure 5.2). This is a small
proportion compared to 21.6% of the respondents who expressed WTP $2.00 (20.1%)
premium for wine with environmental benefit. Respondents who indicated WTP a premium
of $3.00 (30.2%) for WTPe constituted 12.3% of the sample while 8.4% of respondents
expressed willingness to pay at least a $4.00 (40.2%) premium for wine with environmental
benefits.
On average, respondents indicated WTP a premium of $2.25 (approximately 23%
premium) for the environmental benefit of organic wine.
0
10
20
30
40
50
$0.00 $1.00 $2.00 $3.00 $4.00 $5.00
Res
po
nden
t (%
)
Premium ($)
Figure 5.2 Premium consumers are willing to pay for
environmental benefit of organic wine
128
The average premium was derived by dividing the total premium that (including $0.00 for
those respondents unwilling to pay a premium) respondents indicated WTP by the number of
respondents. Respondents that indicated unwillingness to pay a premium were not excluded
in deriving the average premium as the unwillingness to pay which equate with $0.00 was
considered a premium option by this study.
There were premiums respondents who showed WTP outside the payment card
options provided in the questionnaire; this data was not reflected in Figure 5.2 due to the low
respondent count per premium option chosen (refer to Appendix 7) but was included in
deriving the mean WTP. The average premium respondents are willing to pay is close to the
findings of Brugarolas et al. (2005) who reported 20.9% as the premium environmentally
concerned wine consumers are willing to pay. Remaud, et al. (2008) reported also that
occasion-driven consumers will pay up to 22.0% premium on organic wine. The premium
currently attracted by organic wines in the same price range as the study wine samples in
some of the retail stores where prices were compared is $1-$3 (10-30%).
However Figure 5.2 shows the premium is skewed to the left, implying that there are
more respondents willing to pay $0.00 premium than in any premium options provided to be
chosen from in the attributes investigated.
5.3 Willingness to pay a premium for the environmental benefit of organic wine -
Discriminant analysis
Respondents were asked to indicate their WTPe (refer to Figure 5.1 for a summary of
responses). To explore the distinguishing characteristics of respondents willing and those not
willing to pay a premium for the attribute under investigation, Discriminant Analysis was
used, for its unique capacity to differentiate between groups based on discriminant score.
The study tested for the significance that there is difference between consumers
willing to pay and those unwilling to pay for the organic wine benefits under investigation

129
using canonical correlations. In Stata 12, by default all the canonical dimensions are tested
together, hence this study presents four multivariate test statistics (Wilks' lambda, Pillai's
trace, Lawley-Hotelling trace, and Roy's largest root) and their significance levels.
Table 5.1 Tests of significance of all canonical correlations for WTPe
Multivariate test Statistic D/f 1 D/f 2 F Prob>F
Wilks' lambda 0.84 4 2094 99.57 0.001
Pillai's trace 0.16 4 2094 99.57 0.001
Lawley-Hotelling trace 0.19 4 2094 99.57 0.001
Roy's largest root 0.19 4 2094 99.57 0.001
(D/f 1 = degree of freedom for the variables and D/f 2 = degree of freedom for the respondents) for
determining the F statistics.
The null hypothesis is that the respondents willing to pay a premium and those not
willing for WTPe are not linearly related. The hypothesis was evaluated based on the p-
values associated with the F statistics of the multivariate tests. The null hypothesis is rejected
as the p-values are all less than 0.05. The overall relationships between the predictors and
WTPe are significant, at p < 0.001 indicating that there is difference between respondents
willing to pay and those unwilling to pay premium for environmental benefit of organic wine.
The strength of the overall relationship between the outcome and predictor variables is
provided by the canonical correlation (see Table 5.2).
5.4 Characteristics of consumers’ willingness and unwillingness to pay a premium for
the environmental benefit of organic wine
Four attitudinal and behavioural variables - knowledge of organic wine, consumers’
attitude, perceived risk and risk reduction strategy are used to analyse the difference between
consumers willing and unwilling to pay a premium for the environmental benefit of organic
wine. Table 5.2 shows the result.
The study determined the relative importance of each predictor variable in
discriminating between consumers that are willing and those unwilling to pay for the study
attributes using the canonical structure coefficients (loading). The standardized coefficient

130
(R2) is not considered for interpretation because of its instability and possible variable
correlation (Perreault, Behrman & Armstrong 1979). Canonical structure matrix also shows
the order of importance of the discriminating variables by total correlation.
Table 5.2 Factors that differentiate consumers willing and those unwilling to pay for environmental benefits of
organic wine
Perceived risk Consumers’ attitude
Risk reduction
strategy
Knowledge of
organic wine
WTPe 0.30 -0.88 -0.68 -0.65
Canonical structure matrix (r) 0.3 or more is accepted P < 0.001
Table 5.2 reports the structure matrix that shows the correlations of each predictor
with the discriminant function. Canonical structure matrix (r) 0.30 or more (Significant at p <
.001) is used to interpret the function. Applying this rule, WTPe was discriminated by
perceived risk (r = 0.30), consumers’ attitude (r = -0.88), risk reduction strategy (r = -0.68)
and knowledge of organic wine (r = -0.69. This result indicated that attitude towards the
environment is the main discriminate of consumers’ WTPe as the canonical loading was
highest for this attribute.
5.5 Ordered probit regression
Prior to running the ordered probit regression models for all the attributes – WTPe,
WTPh and WTPs, the scale item variables were purified. The results of factor analysis and
the reliability test were used in the different ordered probit regression models. These factor
analysis and the reliability test results will also be referred to in Chapters Six and Seven of
this thesis.
5.5.1 Result of factor analysis and reliability test
Table 5.3 presents the result of factor analysis and reliability test. The table shows the
factor loading from the factor analysis of the five-variables of consumer attitude and
behaviours: knowledge of organic wine, motivation for the purchase of organic wine,
consumers’ attitude, perceived risk and risk reduction strategy.
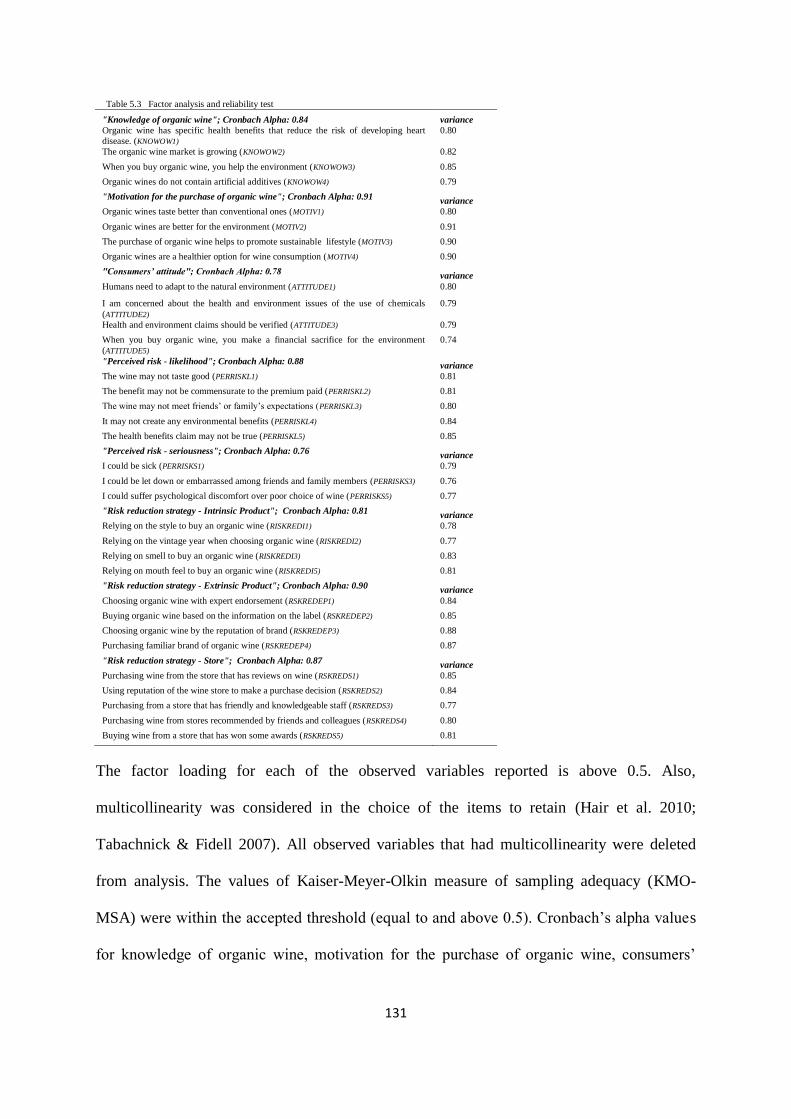
131
Table 5.3 Factor analysis and reliability test
"Knowledge of organic wine"; Cronbach Alpha: 0.84 variance
Organic wine has specific health benefits that reduce the risk of developing heart
disease. (KNOWOW1)
0.80
The organic wine market is growing (KNOWOW2) 0.82
When you buy organic wine, you help the environment (KNOWOW3) 0.85
Organic wines do not contain artificial additives (KNOWOW4) 0.79
"Motivation for the purchase of organic wine"; Cronbach Alpha: 0.91 variance
Organic wines taste better than conventional ones (MOTIV1) 0.80
Organic wines are better for the environment (MOTIV2) 0.91
The purchase of organic wine helps to promote sustainable lifestyle (MOTIV3) 0.90
Organic wines are a healthier option for wine consumption (MOTIV4) 0.90
"Consumers’ attitude"; Cronbach Alpha: 0.78 variance
Humans need to adapt to the natural environment (ATTITUDE1) 0.80
I am concerned about the health and environment issues of the use of chemicals
(ATTITUDE2)
0.79
Health and environment claims should be verified (ATTITUDE3) 0.79
When you buy organic wine, you make a financial sacrifice for the environment
(ATTITUDE5)
0.74
"Perceived risk - likelihood"; Cronbach Alpha: 0.88 variance
The wine may not taste good (PERRISKL1) 0.81
The benefit may not be commensurate to the premium paid (PERRISKL2) 0.81
The wine may not meet friends’ or family’s expectations (PERRISKL3) 0.80
It may not create any environmental benefits (PERRISKL4) 0.84
The health benefits claim may not be true (PERRISKL5) 0.85
"Perceived risk - seriousness"; Cronbach Alpha: 0.76 variance
I could be sick (PERRISKS1) 0.79
I could be let down or embarrassed among friends and family members (PERRISKS3) 0.76
I could suffer psychological discomfort over poor choice of wine (PERRISKS5) 0.77
"Risk reduction strategy - Intrinsic Product"; Cronbach Alpha: 0.81 variance
Relying on the style to buy an organic wine (RISKREDI1) 0.78
Relying on the vintage year when choosing organic wine (RISKREDI2) 0.77
Relying on smell to buy an organic wine (RISKREDI3) 0.83
Relying on mouth feel to buy an organic wine (RISKREDI5) 0.81
"Risk reduction strategy - Extrinsic Product"; Cronbach Alpha: 0.90 variance
Choosing organic wine with expert endorsement (RSKREDEP1) 0.84
Buying organic wine based on the information on the label (RSKREDEP2) 0.85
Choosing organic wine by the reputation of brand (RSKREDEP3) 0.88
Purchasing familiar brand of organic wine (RSKREDEP4) 0.87
"Risk reduction strategy - Store"; Cronbach Alpha: 0.87 variance
Purchasing wine from the store that has reviews on wine (RSKREDS1) 0.85
Using reputation of the wine store to make a purchase decision (RSKREDS2) 0.84
Purchasing from a store that has friendly and knowledgeable staff (RSKREDS3) 0.77
Purchasing wine from stores recommended by friends and colleagues (RSKREDS4) 0.80
Buying wine from a store that has won some awards (RSKREDS5) 0.81
The factor loading for each of the observed variables reported is above 0.5. Also,
multicollinearity was considered in the choice of the items to retain (Hair et al. 2010;
Tabachnick & Fidell 2007). All observed variables that had multicollinearity were deleted
from analysis. The values of Kaiser-Meyer-Olkin measure of sampling adequacy (KMO-
MSA) were within the accepted threshold (equal to and above 0.5). Cronbach’s alpha values
for knowledge of organic wine, motivation for the purchase of organic wine, consumers’

132
attitude, perceived risk and risk reduction strategy were equal to or above 0.7, indicating the
variables are on the recommended threshold (Hair et al. 2010).
5.6 Ordered probit regression and marginal analysis results
The results of the ordered probit regression and marginal analysis show whether there were
relationships between the explanatory variables and the outcome variable. It also provided
information on possible outcomes when one of the explanatory variable changes.
5.6.1 Ordered probit regression result
This study used the outcomes of the ordered probit regression analysis to explain the
effects of the independent variables – social demographics, knowledge of organic wine,
motivation, attitude, perceived risk and risk reduction strategy on consumers’ WTP for the
environmental benefit of organic wine (represented by WINE A). The analysis was done with
all the 2099 observations using the Stata 12 analysis software package.
Table 5.4 shows the results of the ordered probit analysis of respondents’ WTPe. The
model significance for each attribute investigated was verified by calculating the Chi-squared
statistics resulting from the likelihood functions. A likelihood ratio criterion was used to test
the null hypothesis where the coefficient estimated is zero.
For WTPe (WINE A) model, the likelihood ratio statistics are distributed as Chi-
square 647.00 and a p < 0.001. The results indicate the model for WTPe is statistically
significant at 1% or above. The Chi-square test of the null hypothesis revealed that the model
did not have greater explanatory power than an “intercept only” model. The null hypothesis is
rejected for the model estimated. This implies that the overall model is significant at the 1%
level and the relationships that exist between the explanatory variables and the outcome
variable is not a chance effect. A z-test was used to test the null hypothesis and the associated
coefficient is zero.

133
Table 5.4 Results of Ordered Probit Analysis of Consumers’ WTP for ‘environmental Benefits’ – WINE A
Variable Variable name Coefficient Standard Error z P>z
Gender1
Female -0.164** 0.058 -2.83 0.005
Age1
25 - 28 years 0.049 0.207 0.24 0.813
29 - 34 years 0.183 0.189 0.97 0.333
35 - 40 years 0.041 0.188 0.22 0.829
41 - 45 years 0.035 0.194 0.18 0.859
46 - 54 years -0.089 0.187 -0.53 0.599
55 - 65 years -0.060 0.188 -0.32 0.745
65 + years -0.317 0.203 -1.56 0.119
Education1
Higher school certificate -0.004 0.099 -0.00 0.997
TAFE certificate/diploma -0.165** 0.083 -1.99 0.046
Bachelor’s degree -0.152* 0.096 -1.59 0.113
Graduate/Postgraduate diploma -0.134 0.106 -1.26 0.207
Master’s degree 0.006 0.125 0.05 0.963
Doctorate degree 0.270 0.230 1.18 0.240
Others 0.265 0.197 1.34 0.179
Marital Status1
Married or cohabiting -0.036 0.082 -0.44 0.658
Separated -0.124 0.158 -0.79 0.421
Divorced 0.004 0.114 0.03 0.973
Widowed 0.166 0.164 0.01 0.311
Gross annual Income1
$25,001 - $50,000 0.030 0.097 0.31 0.759
$50,001 - $75,000 0.034 0.101 0.33 0.740
$75,001 - $100,000 0.051 0.106 0.48 0.634
$100,001 - $150,000 -0.022 0.111 -0.19 0.846
$150,001 - $200,000 -0.100 0.143 -0.07 0.945
$200,000 plus 0.044 0.176 0.25 0.802
Race1
Indigenous Australian 0.068 0.167 0.41 0.684
American 0.035 0.223 0.15 0.877
African -0.677 0.414 -1.64 0.102
Asian -0.100 0.094 -1.07 0.283
Others -0.475** 0.224 -2.12 0.034
Occupation1
Clerical and administrative 0.029 0.144 0.20 0.841
Education 0.049 0.151 0.33 0.744
Management and professional -0.005 0.136 -0.04 0.970
Sales and service 0.012 0.146 0.08 0.935
Warehouse and distribution 0.345* 0.188 1.84 0.066
Others -0.045 0.147 -0.30 0.762
Household type CHILD2 0.290*** 0.097 2.99 0.003
CHILD17 0.104 0.064 1.62 0.104
CHILD18 0.114** 0.052 2.21 0.027
Knowledge of organic wine KNOWOW 0.017** 0.008 2.07 0.038 Motivation for the purchase of organic wine MOTI -0.067** 0.025 -2.72 0.007 Consumers’ attitude ATTITUDE 0.090*** 0.009 10.03 0.001 Perceived risk PACIV_RK -0.031*** 0.004 -8.71 0.001 Consumers' risk reduction strategy RRS_A 0.023*** 0.003 7.94 0.001
Ordered Probit Thresholds Coefficient (β) Standard Error (SE) (β/SE)
μ 1
2.149*** 0.313
6.866 μ 2
2.567*** 0.314
8.175
μ 3
3.312*** 0.316
10.481 μ 4 3.953*** 0.318 12.431
X2 Log-L -2666.88; Chi-square = 647.00, p-v. 0.001 (n = 2099) ***, **, * Indicates estimated coefficient is significant at the .01 level, 0.05 level, 0.10
level Gender1, Age1, Education1 excludes male gender, 18-24 age group category and
leaving school certificate category as the highest education level obtained.
Marital status1, Gross annual income1, Race1 excludes single marital status, gross annual income $25,000.00, and race Caucasian.
In determining WTPe, (refer to Table 5.4), the coefficients associated with
consumers’ attitude (ATTITUDE, β = .090), perceived risk (PACIV_RK, β = -.031) and risk

134
reduction strategy (RRS_A, β = .023) are significant at the 1% level of confidence and have
positive sign, except for perceived risk with negative sign. The coefficient associated with
motivation for the purchase of organic wine is also significant (MOTI, β = -.067) at the 5%
level of confidence, while that associated with knowledge of organic wine (KNOWOW, β =
.067) is also significant (with positive signs) at the 5% level of confidence. The social
demographics produced mixed outcome.
5.6.2 Marginal analysis result
The marginal analysis shows the probability outcome (WTPe) in terms of magnitude
and direction when there is a unit change in the consumer attitude or behaviour. Wooldridge
(2001) suggests no simple interpretation of the magnitude of the ordered probit coefficient, as
its sign and statistical significance is always zero, and that an increase in the probability of
one variable is offset by a decrease in the probability of another variable(s). Therefore to
determine the effect of one variable on the WTPe, other variables must be held constant.
Figure 5.3 Marginal effects of attitude on WTPe
For attitude (see Figure 5.3) the finding indicates at different points of the
respondents’ level of agreement, the magnitude of the WTP $0.00 premium decreases as the
respondents’ point of agreement increases. At point 7 on the scale, the magnitude of the
-.02
-.01
5-.
01
-.00
5
Effe
cts
on
Pr(
PR
EM
e =
0)
1 2 3 4 5 6 7ATTITUDE
Marginal effects of Attitude on WTPe

135
probability of willingness to pay $0.00 premium (not willing to pay a premium) for the
environmental benefit of organic wine represented decreases by 1.80%.
The marginal effects of perceived risk and the risk reduction strategy in relation to the
WTPe show opposite results. For the two variables, the direction and the magnitude of the
relationship differed.
Figure 5.4 Marginal Effects of Perceived Risk and Risk Reduction Strategy on WTPe
Considering Figure 5.4, at point 4 in the ordinal scale (‘X axis’) which represents
respondents who were undecided about the RRS_A variable, the magnitude of the marginal
effect of risk reduction strategy on WTP $0.00 premium (not willing to pay a premium) for
the environmental benefit of organic wine decreases by 0.20%. At point 7 on the scale, the
magnitude of the probability of WTP $0.00 premium decreases by 0.30%. Therefore this
study reports that the amount of RRS available to consumers decreases their willingness to
pay $0.00 premium and increase willingness to pay $1.00, $2.00, $3.00 or $4.00 premium for
the environmental benefit of organic wine presented as ‘WINE A’. The reverse will be the
case if the perceived risk of consumers increases.
.00
62
.00
64
.00
66
.00
68
.00
7.0
072
Effe
cts
on
Pr(
PR
EM
e =
0)
1 2 3 4 5 6 7Perceived risk
Marginal Effects of Perceived Risk on WTPe
-.00
28
-.00
26
-.00
24
-.00
22
-.00
2-.
00
18
Effe
cts
on
Pr(
PR
EM
e =
0)
1 2 3 4 5 6 7Risk Reduction Strategy
Marginal Effects of Risk Reduction Strategy on WTPe

136
Figure 5.5 Marginal effects of knowledge of organic wine on WTPe
The marginal effect of knowledge of organic wine on consumers’ WTP for
environmental benefit was determined (see Figure 5.5). We found that the probability of
paying $0.00 decreases as the knowledge of consumers about organic wine increases.
Specifically we noted that at point 3 in the ordinal scale (‘X axis’) which represent
respondents who have ‘somewhat’ low level knowledge of organic wine, the magnitude of
the marginal effect of knowledge of organic wine on WTP $0.00 premium (not willing to pay
a premium) for the environmental benefit of organic wine represented by ‘WINE A’
decreased by 1.45%. At point 7 on the scale, the magnitude of probability of WTP $0.00
premium for environmental benefit of organic wine represented by ‘WINE A’ decreases by
2.32%.
5.7 The Hypotheses
From the result in Table 5.4, the hypotheses related to WTPe (H1a, H2a, H3a, H4a
and H5a) are finalised and a summary of outcomes is presented in Table 5.5. The results of
Hypotheses - H1b, H2b, H3b, H4b, H5b H5c, H6 and H7c are not included here, will be
presented and discussed in subsequent chapters.
-.02
5-.
02
-.01
5-.
01
Effe
cts
on
Pr(
PR
EM
e =
0)
1 2 3 4 5 6 7Knowledge of Organic Wine
Marginal Effects of Knowledge of Organic Wine on WTPe

137
Table 5.5 Summary of Outcome of Hypotheses Testing - WTPe
Hypothesis
# Hypothesis Outcome
level/dire
ction
H1a
The greater the consumer's knowledge of organic wine, the greater the WTP a
premium for the environmental benefit of organic wines
Significant
(accepted) **+
H2a
The greater the consumer’s motivation to purchase organic wine, the greater the
willingness to pay for the environmental benefit of organic wine
Significant (not
accepted) ** -
H3a
The greater the consumer’s positive attitude towards organic wine purchase, the
greater the willingness to pay for the environmental benefit of organic wine
Significant
(accepted) *** +
H4a
The greater the consumer’s perceived risk in organic wine purchase, the lesser the
willingness to pay for the environmental benefit of organic wine
Significant
(accepted) *** -
H5a
The greater the consumer’s risk reduction strategy in organic wine purchase, the
greater the willingness to pay for the environmental benefit of organic wine.
Significant
(accepted) *** +
H7a
The social demographic characteristics of consumers will positively influence their
WTP for the environmental benefit of organic wine mixed outcome
‘- and +’ defined the direction of the relationship. ***, **, * indicates estimated coefficient is significant at the .01 level, 0.05
level, 0.10 level. The demographic outcome is a mix of positive and negative significant on one hand and not significant on the
other.
Hypothesis 1a proposed that the greater the consumer's knowledge of organic wine, the
greater the WTP a premium for the environmental benefit of organic wines (represented by
‘WINE A’), The results shows that consumer’s knowledge about an organic wine is
significant at 5% level to impact on the WTPe positively (see Table 5.5) (H1a accepted). This
research found that all things being equal, one unit increase in the consumer’s knowledge
about organic wine increases WTPe by 0.02 while the other variables in the model were held
constant. This outcome highlights the importance of product knowledge in consumers’
willingness to pay for the environmental benefits of organic wine. When consumers gain
information about the environmental attributes of a product, they process the information and
use it to assign a value to the product.
Hypothesis 2a proposed that the greater the consumer’s motivation to purchase organic wine,
the greater the willingness to pay for the environmental benefit of organic wine (represented
by ‘WINE A’). The hypothesis is negatively supported with significant negative relationship
with WTPe at 5% level (H2a not accepted). For organic wine there must be convergence of
motives for consumers to pay premium. The pleasure dimension of wine consumption
(Ogbeide & Bruwer 2013) must align with the environmental benefit of organics in the eye of
the consumers for WTP to be influenced. The finding is at odds to those of Grunert and Juhl

138
(1995), Thøgersen (2002), as well as Hu and Self (2010) who report that consumers are
motivated by their belief that organic products are better for the environment and worth a
premium price. Descriptive statistics on the ranking of factors affecting purchase decision
making (refer to Figure 4.4) indicate that less importance is put on the environmental benefit
compared to taste or price by the respondents. This can influence the relationship between
consumer motivation and WTP, as the lower the importance, the less motivated the
consumers are.
Hypothesis 3a states that the greater the consumer’s positive attitude towards organic
wine purchase, the greater the willingness to pay for the environmental benefit of organic
wine. The result is significant at 1% level. This is consistent with the notion that eco-friendly
attitudes are important when assessing consumers’ willingness to purchase environmentally
friendly products (Barber, Taylor & Strick 2009; Shepherd, Magnusson & Sjoden 2005).
Thøgersen (2007) reports Danish consumers’ attitude toward organic product consumption is
consequent on the beliefs that organic products are better for the environment, taste better and
are healthier. This study supports the findings of Barber, Taylor & Strick (2009); Shepherd,
Magnusson and Sjoden (2005) and Thøgersen (2007).
In Hypothesis 4a, it is stated that the greater the consumer’s perceived risk in organic
wine purchase, the lesser the willingness to pay for the environmental benefit of organic
wine. The result shows that consumer’s perceived risk with organic wine is significant at 1%
level to impact on the WTPe negatively (H4a accepted). Consumers weigh their perception
of risk and the associated potential losses and adverse consequences on different dimensions,
including financial, performance, psychological, and social.
This research did not support in absolute terms the assertion of McEachern and
McClean (2002), that there is a group of consumers who believe that the production of
organic food does not lead to a more sustainable planet. However, when risk perception is

139
high, the level of unwillingness to pay for the environmental benefit of organic wine will be
high also. Hence this study supports the findings of Cox and Rich (1964), Conchar et al.
(2004) as well as Mitchell and Greatorex (1989).
Hypothesis 5a proposes the greater the consumer’s risk reduction strategy in organic wine
purchase, the greater the willingness to pay for the environmental benefit of organic wine,
represented by WINE A. Hypothesis 5a is supported with significant positive relationship
with WTPe, suggesting that at 1% level, ceteris paribus, one unit increase in the consumer’s
risk reduction strategy will increase WTPe by 0.023 while the other variables in the models
are held constant (H5a accepted).
This finding is in agreement with some previous studies on risk reduction strategy in
general (Allio 2005; Conchar et al. 2004; Johnson & Bruwer 2004; Schiffman & Kanuk
2006) and particularly for WTP for organic product (Olsen, Thach & Hemphill 2012;
Rodríguez, Lacaze & Lupín 2007). Consumers with many risk relievers on product use,
attributes and source information perceive risk at a substantially reduced level, and the
confidence to make choice is increased (Allio 2005). The more RRSs consumers have, the
more willing and able they will be to make purchase decisions, including paying premiums
for organic wines’ benefits.
Hypothesis 7a tested the influence of demographics on the WTPe. The socio-
demographic variables included in the model are gender, age, education, marital status,
annual income, race, occupation and household type. The outcome of the variable is mixed.
Jong et al. (2003) note socio-demographic predictors do not consistently indicate a reliable
relationship with WTP. Issues such as product types and consumer’s value and attitude are
responsible for the inconsistency of the social demographic result predicting WTP. Urutyan
and Ngo (2007) suggest the unreliability of socio-demographic predictors in previous studies
is due to changes in the growing organic market, and that more research should be done to
140
obtain a clearer image of the socio-demographic structure of the organic market. This was
also a strong incentive (amongst others) to include socio-demographic variables as a
determinant of WTP premium for organic wine benefits in Australia, as most studies on
organic products have mainly been carried out in Europe and America.
This study found that females not are WTP for the environmental benefits of organic
wine as the variable is significant negatively for the attributes at 5% level of confidence.
Stobbelaar et al. (2007) note that “soft” values (such as eco-friendliness) seem to better fit
female perspectives, this result suggests soft values have not been transferred to organic wine
as the perception is that of low quality (Mann, Ferjani & Reissig 2012).
In regards to age and education, for all groupings there is not a significant predictor of
the WTP for the environmental benefit of organic wine represented by ‘WINE A’ (Table 5.4).
Gil et al. (2000) and Tsakiridou et al. (2006) found that younger consumers are not likely to
consume organic products, but this study found that age does not matter in terms of WTP for
environmental benefit of organic wine.
Age generally is not a statistically significant determinant of the WTP for
environmental benefit. Educational qualification is generally not significant in determining
WTPe except for the TAFE and Bachelor degree that are significant negatively at 0.05 and
0.10 levels respectively. This outcome leads the study to suggest the inability of education of
respondents to influence WTPe is as a result of respondents not being confident that organic
wine is able to deliver environmental benefit or being confident the claim is trustworthy.
This study also found that marital status of the respondents is not statistically
significant to determine the WTPe; this supports Munene (2006). However the financial
resources at the disposal of a consumer have a strong impact on the performance of purchase
behaviour and there have been studies that suggest income as a determinant of WTP.
141
In terms of respondents’ occupation determining WTP, this study found that it is not
statistically significant in determining the WTPe (Table 5.4). However for race as a
determinant of WTP, the result is mixed. Generally race can be said to be not significant in
determining WTPe. The race referred to as ‘others’ (otherwise not classified in the race
options in the questionnaire) is significant negatively at 5% level of confidence for
determining WTPe. The race “other” is suggested to be respondents from cultures that
originally were not wine consuming, or only recently embracing wine consumption and are
unlikely to be willing to try new products. A previous study by Munene (2006) has supported
race as a determinant of WTP positively.
Finally, for the demographic variable, household type also presented mixed result. For
WTPe, household types are significant at 1% and 10% level, for households with dependants
0-24 months old and dependants 18 years and over respectively but not significant for
households with dependants 3-17 years. Studies such as Maynard and Franklin (2003)
indicate household with children influence WTP for organic product. Though the study found
that household with dependants 0-24 months old are WTPe, there is no strong link between
organic wine and dependants 0-24 month in terms of drinking wine except probably to ensure
that pesticide and other synthetic chemical residues are minimal in the environment where
young children are raised.
Households with dependants 18 years and over that have a positive attitude towards
environment can indoctrinate the young adults that organic products and by extension organic
wine are worth the sacrifice made for the increase payment relative to the conventional wine
(Chryssohoidis & Krystallis 2005; Tsakiridou, Mattas & Tzimitra-Kalogianni 2006). For
households with dependants 3-17 years old, it is expected to be a better place to introduce
organic knowledge to the household to prepare the dependant for adulthood. This proposition
has not influenced WTP for environmental and health benefits of organic wine.

142
5.8 Discussion
The framework for this study was conceptually designed. Apart from its suitability for
WTP studies, its explicitness and simplicity makes it more practically adaptable for related
studies in the future. The framework is instrumental to the types of variables used in the WTP
study, and enabled the measurement and analysis of the data to be carried out in a logical and
robust manner.
The forty ordinal observed variables (five variables x eight constructs) used for the
empirical analysis are complex to process in the ordered probit regression model. Firstly the
uni-dimensionality of the observed variables and the management of the data during
empirical analysis are crucial to a good result. Factor analysis was useful in isolating the sets
of underlying factors that best represent the constructs used to determine WTP. This process
reduced the number of variables and purified the constructs (Hair et al. 2010; Hair et al.
2006).
Ordered probit model is very sensitive to redundancy in estimation leading to
incomplete result when many Likert scale items are used. This study used the summated scale
to overcome the problem and the summated score of each determinant contained the multiple
aspects of the determinants of WTP in a single measure (Xu & Stone 2012). Therefore by
summating the scale items, the data quality was not reduced; instead it exploited what is held
in common across the set of determinants (Hair et al. 2010).
Discriminant analysis was used to evaluate the difference that exits in a priori defined
wine consumer groups about their WTPe. Perceived risk, consumers’ attitude, risk reduction
strategy and knowledge of organic wine were the determinate factors. Attitude towards
environmental benefit mainly defined the consumers. Consumers with negative attitude to the
environment are not willing to pay premium for the wine with environmental benefit and
were also noted to have low product knowledge and risk reliever. Attitude consumer shows
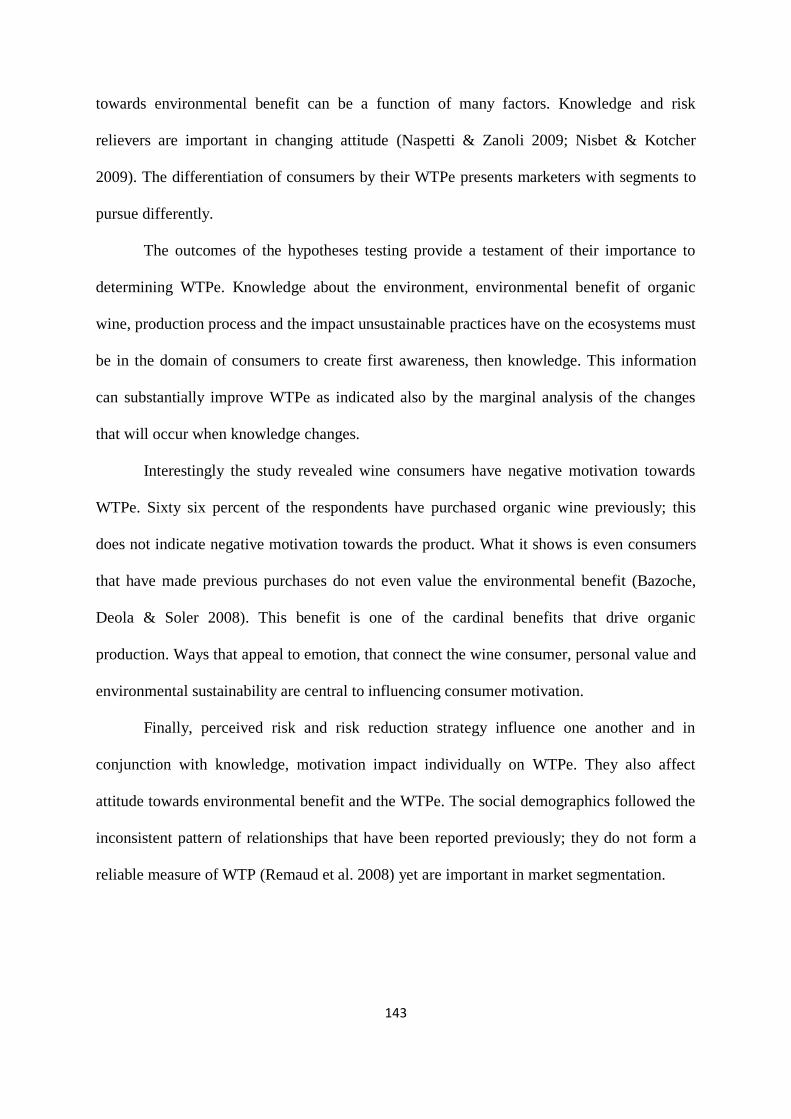
143
towards environmental benefit can be a function of many factors. Knowledge and risk
relievers are important in changing attitude (Naspetti & Zanoli 2009; Nisbet & Kotcher
2009). The differentiation of consumers by their WTPe presents marketers with segments to
pursue differently.
The outcomes of the hypotheses testing provide a testament of their importance to
determining WTPe. Knowledge about the environment, environmental benefit of organic
wine, production process and the impact unsustainable practices have on the ecosystems must
be in the domain of consumers to create first awareness, then knowledge. This information
can substantially improve WTPe as indicated also by the marginal analysis of the changes
that will occur when knowledge changes.
Interestingly the study revealed wine consumers have negative motivation towards
WTPe. Sixty six percent of the respondents have purchased organic wine previously; this
does not indicate negative motivation towards the product. What it shows is even consumers
that have made previous purchases do not even value the environmental benefit (Bazoche,
Deola & Soler 2008). This benefit is one of the cardinal benefits that drive organic
production. Ways that appeal to emotion, that connect the wine consumer, personal value and
environmental sustainability are central to influencing consumer motivation.
Finally, perceived risk and risk reduction strategy influence one another and in
conjunction with knowledge, motivation impact individually on WTPe. They also affect
attitude towards environmental benefit and the WTPe. The social demographics followed the
inconsistent pattern of relationships that have been reported previously; they do not form a
reliable measure of WTP (Remaud et al. 2008) yet are important in market segmentation.

144
Chapter Six
Willingness to Pay for the Health Benefits of Organic Wine: Results and
Discussion
6.1 Introduction
This chapter presents the empirical results of the survey related to consumers’
willingness to pay for the health benefits of organic wine, and the outcome of the hypotheses
relevant to this. The descriptive statistics of the ranking of the importance of health attribute
are also presented here. Variable statistics unique only to WTPh are discussed here; for the
sample and other variables descriptive statistics, refer to Chapter Four and Appendix 10.
6.2 Ranking of health benefits by respondents
The summary presented in Table 6.1 shows how wine consumers rank the health
benefit of organic wine as an influencer of their purchase decision.
Table 6.1 Respondents’ ranking of the importance of health benefit of organic wine in their
purchase decision
Rank # of Respondent Percentage
Most important 1 101 4.80
2 194 9.30
3 281 13.40
4 432 27.30
5 662 31.60
6 299 14.30
Least important 7 129 6.20
Total 2099 100
Of the 2099 survey respondents, 101 (4.8%) considered health benefit as the most
important factor in their decision to purchase wine; 129 (6.2%) reported this as their least
important factor. The mode of the data indicates that 662 (31.6%) of the respondents ranked
it less important when making decision on wine purchase. However, 54.8% of respondents
indicated that health benefit ranked in their top four consideration factors when making their

145
wine purchase decision. It means that wine consumers consider the health implications when
they buy wine generally which may translate into buying organic wine or paying premium for
it.
The reason why 45.2% of the respondents showed broad non-importance of health
benefits of wine as a decision factor is that these consumers are mainly pleasure seekers and
this forms a core value central to their cognition and thus influences their behaviour (Cohen
& Chakravarti 1990).
6.3 Willingness to pay for the health benefits of organic wine
In this study consumers’ WTP for health benefit of organic wine, refer to Figure 6.1.
Wine with health benefit was defined and introduced to respondents as “WINE B”;
refer to Section G of Appendix 2. The code name – “WINE B” was given to the wine with
health benefit to avoid preference bias. Respondents were asked to indicate their WTP for the
health attribute of organic wine. Respondents that provided a “yes” response showed
willingness to pay a premium for the health benefit of organic wine while those that provided
a “no” response were not willing to pay premium for the attribute.
The result shows that approximately 66% of the respondents expressed WTP for
health benefits while 34% of the sample stated unwillingness to pay a premium. The
0
10
20
30
40
50
60
70
Yes No
Res
po
nden
t (%
)
Willingness to pay
Figure 6.1 Willingness to pay for health benefit of organic wine
WTPh

146
percentage of respondents willing to pay a premium for the health benefit almost doubled
those unwilling to pay; an indication of consumer desire to maintain their health even at extra
cost.
6.3.1 The Premium respondents are willing to pay for the health benefits of organic
wine: Results
The price of the ‘base wine’ was approximately $10.00 and the payment card options
provided were $1.00, $2.00, $3.00, and $4.00; respondents were asked to indicate WTPh.
Respondents that indicated WTPh $1.00 premium for health benefit constituted 16% of the
sample, while 23.9% of the respondents expressed a WTPh of at least a $2.00 (20.10%)
premium. Respondents that indicated WTP a premium of $3.00 (30.20%) for WTPh
constituted 13.4% of the sample respectively. More than 13% of respondents expressed a
willingness to pay a $4.00 (40.20%) premium for wine with health benefits.
On average, respondents indicated a WTP a premium of $2.30 (approximately 23%
premium) for health benefit of organic wine.
Premium options low in respondent count are not presented in Figure 6.2 but are
included in deriving the average WTP (refer to Appendix 7). The average premium
respondents were willing to pay is approximately 23%, close to 20.90% reported by
Brugarolas et al. (2005) and the 22.00% organic wine premium reported by Remaud, et al.
0 5
10 15 20 25 30 35 40
$0.00 $1.00 $2.00 $3.00 $4.00 $5.00
% R
esp
on
den
ts
Premium ($)
Figure 6.2 Premium consumers are willing to pay for health
benefit of organic wine

147
(2008). The premium currently attracted by organic wines in the same price range as the
study wine samples in some of the retail stores where prices were compared is $1-$3 (10-
30%). The premiums respondents are willing to pay is skewed to the left, implying that there
are more respondents willing to pay $0.00 premium than in any premium options provided to
be chosen from. Across the entire premium options ($1.00, $2.00, $3.00 and $4.00), more
respondents are willing to pay for the health attribute compared to the environmental
attribute.
6.4 Willingness to pay premium for health benefit of organic wine - discriminant
analysis
To explore the distinguishing characteristics of respondents willing and those not
willing to pay a premium for the attributes under investigation (refer to Table 6.2),
Discriminant Analysis was used for its unique capacity to differentiate between groups based
on discriminant score.
Table 6.2 Tests of significance of all canonical correlations for WTPh
Multivariate test Statistic D/f 1 D/f 2 F Prob>F
Wilks' lambda 0.95 3 2095 40.46 0.001
Pillai's trace 0.06 3 2095 40.46 0.001
Lawley-Hotelling trace 0.06 3 2095 40.46 0.001
Roy's largest root 0.06 3 2095 40.46 0.001
(D/f 1 = degree of freedom for the variables and D/f 2 = degree of freedom for the respondents) for
determining the F statistics.
The canonical correlations were used to test for significance that there is difference
between consumers willing to pay and those unwilling to pay a premium for the organic wine
benefits under investigation using canonical correlations. Stata 12 defaults all the canonical
dimensions tested to produce four multivariate test statistics (Wilks' lambda, Pillai's trace,
Lawley-Hotelling trace, and Roy's largest root).
The null hypothesis is that the respondents willing to pay a premium and those not
willing for WTPh are not linearly related. P-values associated with the F statistics of the

148
multivariate tests were used to evaluate the hypothesis. The null hypothesis was rejected as
the p-values are all less than 0.05. The overall relationship between the explanatory variables
and WTPe is significant, at p < .001. This empirical result indicates difference exists between
respondents willing and those unwilling to pay a premium for health benefit of organic wine.
The strength of the overall relationship between the outcome and predictor variables is
provided by the canonical correlation (see Table 6.3).
6.5 Characteristics of respondents willing and those unwilling to pay a premium for the
health benefit of organic wine
The relative importance of four predictor variables – perceived risk, consumer
attitude, risk reduction strategy and knowledge of organic wine in discriminating between
consumers that are willing and those unwilling to pay for the health benefit of organic wine
using the canonical structure coefficients (loading) are shown in Table 6.3.
Table 6.3 Factors that differentiate consumers willing and those unwilling to pay for health
benefits of organic wine
WTPh
Predictors
Canonical structure Matrix
Perceived risk
0.26a
Consumers’ attitude
-0.86
Risk reduction strategy
-0.75
Knowledge of organic wine
-0.69
“a” = Canonical structure matrix (r) less than 0.3 not accepted, P < 0.001
Canonical structure matrix reveals the order of importance of the discriminating
variables by total correlation. Table 6.3 reports the structure matrix that shows the
correlations of each predictor with the discriminant function (Perreault, Behrman &
Armstrong 1979). Canonical structure matrix (r) 0.30 or more (Significant at p < .001) is used
to interpret the function. For WTPh, consumers’ attitude (r = -0.86), risk reduction strategy (r
= -0.75) and knowledge of organic wine (r = -0.65) are important determinants for
distinguishing respondents.

149
This result indicates that an attitude towards health is the main discriminate of
respondents’ WTPh as it has the highest canonical loading. It can be inferred that consumers
with negative attitude (high negative canonical structure for attitude) toward the health
benefit of organic wine are likely unwilling to pay a premium for the health benefit of organic
wine.
6.6 Factors that influence consumer willingness to pay for health benefit of organic wine
This investigation followed the same protocol used to determine consumer
willingness to pay for the environmental benefits of organic wine. Ordered probit regression
analysis was used to predict the effect of the explanatory variables – social demographics,
knowledge of organic wine, motivation, attitude, perceived risk and risk reduction strategy,
on the outcome variable - consumers’ WTP for the health benefits of organic wine
(represented by WINE B). Two thousand and ninety nine observations were used for the
analysis in the Stata 12 analysis software package.
This model is different from that used to determine willingness to pay for
environmental benefit. The model for WTPe used a three scale item summated score
(Organic wines are a healthier option for wine consumption – excluded) to represent the
aggregate motive variable designated as MOTI while a three scale item summated score
(Organic wines are better for the environment – excluded) was used for the WTPh model.
This approach is consistent with Acock (2012) in that a variable which is not making relevant
contribution to a regression can be dropped.
Table 6.4 shows results of the ordered probit analysis of consumers’ WTPh. The
model significance for each attribute investigated was verified by calculating the Chi-squared
statistics resulting from the likelihood functions. A likelihood ratio criterion was used to test
the null hypothesis where the coefficient estimated is zero for the health benefit under
investigation.
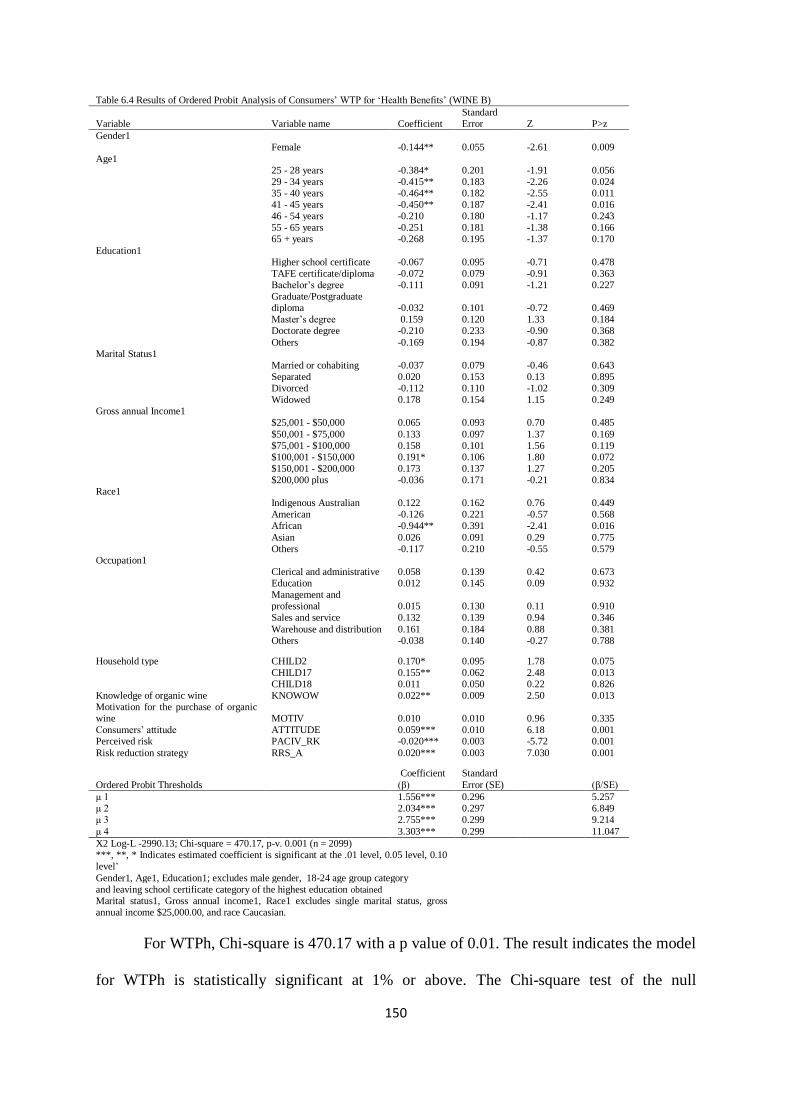
150
Table 6.4 Results of Ordered Probit Analysis of Consumers’ WTP for ‘Health Benefits’ (WINE B)
Variable Variable name Coefficient Standard Error Z P>z
Gender1
Female -0.144** 0.055 -2.61 0.009
Age1
25 - 28 years -0.384* 0.201 -1.91 0.056
29 - 34 years -0.415** 0.183 -2.26 0.024
35 - 40 years -0.464** 0.182 -2.55 0.011
41 - 45 years -0.450** 0.187 -2.41 0.016
46 - 54 years -0.210 0.180 -1.17 0.243
55 - 65 years -0.251 0.181 -1.38 0.166
65 + years -0.268 0.195 -1.37 0.170
Education1
Higher school certificate -0.067 0.095 -0.71 0.478
TAFE certificate/diploma -0.072 0.079 -0.91 0.363
Bachelor’s degree -0.111 0.091 -1.21 0.227
Graduate/Postgraduate diploma -0.032 0.101 -0.72 0.469
Master’s degree 0.159 0.120 1.33 0.184
Doctorate degree -0.210 0.233 -0.90 0.368
Others -0.169 0.194 -0.87 0.382
Marital Status1
Married or cohabiting -0.037 0.079 -0.46 0.643
Separated 0.020 0.153 0.13 0.895
Divorced -0.112 0.110 -1.02 0.309
Widowed 0.178 0.154 1.15 0.249
Gross annual Income1
$25,001 - $50,000 0.065 0.093 0.70 0.485
$50,001 - $75,000 0.133 0.097 1.37 0.169
$75,001 - $100,000 0.158 0.101 1.56 0.119
$100,001 - $150,000 0.191* 0.106 1.80 0.072
$150,001 - $200,000 0.173 0.137 1.27 0.205
$200,000 plus -0.036 0.171 -0.21 0.834
Race1
Indigenous Australian 0.122 0.162 0.76 0.449
American -0.126 0.221 -0.57 0.568
African -0.944** 0.391 -2.41 0.016
Asian 0.026 0.091 0.29 0.775
Others -0.117 0.210 -0.55 0.579
Occupation1
Clerical and administrative 0.058 0.139 0.42 0.673
Education 0.012 0.145 0.09 0.932
Management and professional 0.015 0.130 0.11 0.910
Sales and service 0.132 0.139 0.94 0.346
Warehouse and distribution 0.161 0.184 0.88 0.381
Others -0.038 0.140 -0.27 0.788
Household type CHILD2 0.170* 0.095 1.78 0.075
CHILD17 0.155** 0.062 2.48 0.013
CHILD18 0.011 0.050 0.22 0.826
Knowledge of organic wine KNOWOW 0.022** 0.009 2.50 0.013 Motivation for the purchase of organic wine MOTIV 0.010 0.010 0.96 0.335 Consumers’ attitude ATTITUDE 0.059*** 0.010 6.18 0.001 Perceived risk PACIV_RK -0.020*** 0.003 -5.72 0.001
Risk reduction strategy RRS_A 0.020*** 0.003 7.030 0.001
Ordered Probit Thresholds
Coefficient
(β)
Standard
Error (SE)
(β/SE)
μ 1
1.556*** 0.296
5.257 μ 2
2.034*** 0.297
6.849
μ 3
2.755*** 0.299
9.214
μ 4 3.303*** 0.299
11.047
X2 Log-L -2990.13; Chi-square = 470.17, p-v. 0.001 (n = 2099) ***, **, * Indicates estimated coefficient is significant at the .01 level, 0.05 level, 0.10
level’
Gender1, Age1, Education1; excludes male gender, 18-24 age group category and leaving school certificate category of the highest education obtained
Marital status1, Gross annual income1, Race1 excludes single marital status, gross annual income $25,000.00, and race Caucasian.
For WTPh, Chi-square is 470.17 with a p value of 0.01. The result indicates the model
for WTPh is statistically significant at 1% or above. The Chi-square test of the null

151
hypothesis revealed that the model did not have greater explanatory power than an “intercept
only” model. The null hypothesis is rejected in the model estimated. This implies that the
overall model is significant at the 1% level and the relationships that exist between the
explanatory variables and the outcome variable is not a chance effect. A z-test was used to
test the null hypothesis such that the associated coefficient is zero.
To establish the effect of one independent variable on the WTPh, other independent
variables were held constant. In the model, the coefficients associated with consumers’
attitude (ATTITUDE, β = .06), perceived risk (PACIV_RK, β = -.02) and risk reduction
strategy (RRS_A, β = .02) are significant at the 1% level of confidence. The coefficient of
consumer knowledge of organic wine (KNOWOW, β = .02) is also significant at the 5% level
of confidence while motivation for the purchase of organic wine was not significant in
determining WTPh.
6.7 Effect of marginal change in explanatory variables on WTPh
The study also investigated what marginal change in the explanatory variables would
mean on consumers’ willingness to pay a premium for the health benefits of organic wine.
For attitude, the data (see Figure 6.3) indicates the magnitude of the respondents
WTP $0.00 decreased as the respondents’ point of agreement increased. At point 4 (along the
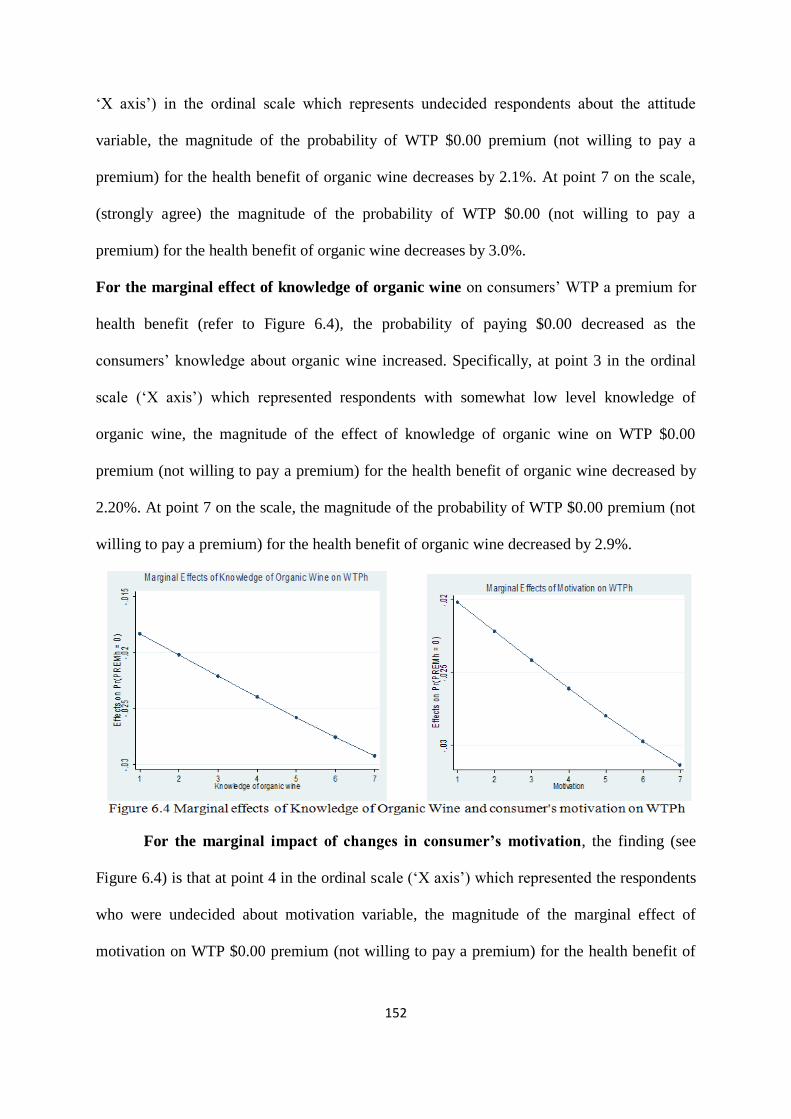
152
‘X axis’) in the ordinal scale which represents undecided respondents about the attitude
variable, the magnitude of the probability of WTP $0.00 premium (not willing to pay a
premium) for the health benefit of organic wine decreases by 2.1%. At point 7 on the scale,
(strongly agree) the magnitude of the probability of WTP $0.00 (not willing to pay a
premium) for the health benefit of organic wine decreases by 3.0%.
For the marginal effect of knowledge of organic wine on consumers’ WTP a premium for
health benefit (refer to Figure 6.4), the probability of paying $0.00 decreased as the
consumers’ knowledge about organic wine increased. Specifically, at point 3 in the ordinal
scale (‘X axis’) which represented respondents with somewhat low level knowledge of
organic wine, the magnitude of the effect of knowledge of organic wine on WTP $0.00
premium (not willing to pay a premium) for the health benefit of organic wine decreased by
2.20%. At point 7 on the scale, the magnitude of the probability of WTP $0.00 premium (not
willing to pay a premium) for the health benefit of organic wine decreased by 2.9%.
For the marginal impact of changes in consumer’s motivation, the finding (see
Figure 6.4) is that at point 4 in the ordinal scale (‘X axis’) which represented the respondents
who were undecided about motivation variable, the magnitude of the marginal effect of
motivation on WTP $0.00 premium (not willing to pay a premium) for the health benefit of

153
organic wine decreased by 2.6% while at point 7 (strongly agree) on the scale, the magnitude
of the probability of WTP $0.00 premium decreased by 3.1%.
The marginal effects of perceived risk and the risk reduction strategy on WTPh
were evaluated: the two variables’ direction and the magnitude of the relationship differed. In
Figure 6.5, the higher the perception of risk, the more the respondents were unwilling to pay
a premium for the health benefit of organic wine. At point 2 of the scale along the ‘x axis’ of
the graph which represents an ‘unlikely’ perception of risk, the magnitude of the WTP $0.00
premium was 0.04%, while at point 7 (which that represents ‘very likely’ level of perceived
risk), the magnitude of the marginal effect for WTP zero dollar premium increased to 0.05%.
Figure 6.5 Marginal Effects of Perceived risk and risk Reduction Strategy on WTPh.
In contrast, the risk reduction strategy (RRS_A) had marginal effects opposite to
those of perceived risk (see Figure 6.5). At point 4 in the ordinal scale (‘X axis’) which
represented respondents who do not know how much RRS_A they have (undecided), the
magnitude of the marginal effect of risk reduction strategy on WTP $0.00 premium (not
willing to pay a premium) for the health benefit of organic wine decreased by 0.04%. At
point 7 on the scale, the magnitude of the probability of WTP $0.00 premium decreased by
0.06%. In summary the amount of RRS available to consumers will decrease willingness to
.00
43
.00
44
.00
45
.00
46
.00
47
.00
48
Effe
cts
on
Pr(
PR
EM
h=
0)
1 2 3 4 5 6 7
Perceived Risk
Marginal Effects of Perceived Risk on WTPh
-.00
55
-.00
5-.
00
45
-.00
4
Effe
cts
on
Pr(
PR
EM
h=
0)
1 2 3 4 5 6 7Risk Reduction Strategy
Marginal Effects of Risk Reduction Strategy on WTPh
154
pay $0.00 premium, and increase their willingness to pay any of $1.00, $2.00, $3.00 or $4.00
premiums for the health benefit of organic wine presented as ‘WINE B’. The reverse will be
the case if the perceived risk of the consumers increases.
6.8 The results of hypotheses testing
From the data in Table 6.4, the hypotheses related to WTPh (H1b, H2b, H3b, H4b and
H5b) were finalised and a summary of outcomes is presented in Table 6.5. Hypotheses 5c, 6
and 7c are not included here, and will be discussed in the next chapter.
Table 6.5 Summary of Outcome of Hypotheses Testing - WTPh
Hypothesis
# Hypothesis Outcome
level/
direction
H1b
The greater the consumer's knowledge of organic wine, the greater the WTP a
premium for the health benefit of organic wines
Significant
(accepted) **+
H2b The greater the consumer’s motivation to purchase organic wine, the greater the willingness to pay for the health benefit of organic wine
Not significant (rejected)
H3b
The greater the consumer’s positive attitude towards organic wine purchase,
the greater the willingness to pay for the health benefit of organic wine
Significant
(accepted) *** +
H4b The greater the consumer’s perceived risk in organic wine purchase, the lesser the willingness to pay for the health benefit of organic wine
Significant (accepted) *** -
H5b
The greater the consumer’s risk reduction strategy in organic wine purchase,
the greater the willingness to pay for the health benefit of organic wine
Significant
(accepted) *** +
H7b The demographic characteristics of consumer may determine his or her willingness to pay a premium for the health benefit of organic wines mixed outcome
‘- and +’ defined the direction of the relationship. ***, **, * indicates estimated coefficient is significant at the .01 level, 0.05 level, 0.10 level. The demographic outcome is a mix of positive and negative significant on one hand and not significant on
the other.
Hypothesis 1b states that the greater the consumer's knowledge of organic wine, the greater
the WTP a premium for the health benefit of organic wines. The result is significant at 5%
level to impact on the WTPh positively (H1b accepted). When consumers are provided with,
or have access to reliable information about the health benefits of organic wine, awareness
and subsequently knowledge is increased or gained to form a perception and finally stimulate
WTPh. A greater organic wine knowledge particularly at the attribute level instils confidence
in consumers during purchase decision process. They are better able to assess the product and
put a value on it (Alba & Hutchinson 1987; Dodd et al. 2005).
Hypothesis 2b proposes that the greater the consumer’s motivation to purchase
organic wine, the greater the willingness to pay for the health benefit of organic wine

155
(represented by ‘WINE B’). The result shows the consumer’s motivation was not significant
statistically to determine WTPh (H2b not accepted). Possible rationale for the outcome is that
consumers may have conflicting insight about organic wine, particularly the taste measure,
the certification and authenticity of the associated claims. Batte et al. (2007) found consumers
are willing to pay more for organic products but this study suggests otherwise and
corroborated Penn (2010) that organic wine consumers are cautious or weary of benefit
claims. The summary of the factors that affect purchase decision (refer to Figure 4.2)
indicates less importance is put on the health attributes compared to taste or price by the
respondents. This can influence the relationship between consumer motivation and WTP, as
the lower the importance; the less motivated the consumers are to pay a premium.
Hypothesis 3b states that the greater the consumer’s positive attitude towards organic
wine purchase, the greater the willingness to pay for the health benefit of organic wine. The
result is significant at 1% level (H3b accepted). Consumers form attitudes towards the health
attributes of organic wine by the interaction of product knowledge, health and lifestyle values
or other values that complement the healthy lifestyle to which consumers want to conform.
When these forces are positive, they generate beliefs and positive attitude towards products
that meet the need thus generating willingness to pay a premium for that benefit. Thøgersen
(2007) reports Danish consumers’ attitude toward organic product consumption is consequent
on the beliefs that organic products are better for the environment, taste better and are
healthier. This study supports the findings of Barber, Taylor & Strick (2009); Thøgersen
(2007) and Tsakiridou, Mattas and Tzimitra-Kalogianni (2006).
Hypothesis 4b: The greater the consumer’s perceived risk in organic wine purchase,
the lesser the willingness to pay for the health benefit of organic wine. The result shows that
consumer’s perceived risk with organic wine is significant at 1% level to impact on the
WTPh negatively (H4 b accepted).

156
This study found that ceteris paribus, one unit increase in the consumer’s perceived
risk with organic wine will decrease WTPh by 0.020. Perceived risk is higher when
consumers do not have knowledge of organic wine and its availability (Lee & Lee 2011;
Myers & Sar 2011). Consumers weigh their perception of risk and the associated potential
losses and adverse conditions on different dimensions, including financial, performance,
psychological, and social to determine their WTPh. This research did not support in absolute
terms the assertion of McEachern and McClean (2002), that some consumers perceive the
production of organic food as not providing any environmental and health benefits. However,
when risk perception is high, consumers are unlikely to pay a premium for health benefits of
organic wine. Hence this study supports the findings of Cox and Rich (1964), Conchar et al.
(2004) as well as Mitchell and Greatorex (1989).
Hypothesis 5b proposes that the greater the consumer’s risk reduction strategy in
organic wine purchase, the greater the willingness to pay for the health benefit of organic
wine. The hypothesis is supported with significant positive relationship with WTPh (H5b
accepted). This finding is in agreement with some previous studies on risk reduction strategy
in general (Allio 2005; Conchar et al. 2004; Johnson & Bruwer 2004; Schiffman & Kanuk
2006) and particularly for WTP for organic product (Olsen, Thach & Hemphill 2012;
Rodríguez, Lacaze & Lupín 2007). For consumers to pay a premium for the health benefit of
organic wine, they must have confidence in the product benefit which is usually acquired
through gaining product and use knowledge. The more risk reduction strategies available to
consumers, the better their capacity to mitigate perceived risks, stimulating willingness to pay
a premium.
Hypothesis 7b tested the effect of gender, age, education, marital status, annual
income, race, occupation and household type on WTPh (see Table 6.4 for detailed empirical
results of the effects of social demographics on WTPh). This study found females are not

157
willing to pay a premium for the health benefits of organic wine as the variable is significant
negatively for the attribute at 5% level of confidence. Stobbelaar et al. (2007); Squires, Juric
and Cornwell (2001) and Gotschi, Vogel and Lindenthal (2007) found that females are more
concerned with health, therefore, are more inclined to purchase organic products over men.
This was not reflected in the present data regarding organic wine purchase, probably because
of lack of conviction about the attribute or due to perception of it as low quality (Mann,
Ferjani & Reissig 2012).
Age was found to be significant amongst age groups 25-28 years, 29-34 years, 35-40
years and 41-45 years to influence WTPh, see Table 6.4. Young adults in employment age
and with fewer family commitments are interested in preventive health practices probably as
part of wine related lifestyle and are willing to pay for healthy product. On the other hand,
senior citizens, mainly retirees, are on fixed or limited income; may not be able to make the
sacrifice of paying a premium for the health benefit of organic wine.
Though findings using age as a determinant of WTP for organic products are not
always consistent, this finding is similar to that of Magnusson et al. (2001) that health
concern increases at all age groups except those aged 55 years and above. Senior citizens
consumers see little association with innovative food/wine and disease prevention. Gilbert
(2000) also reported that consumers aged 50 to 64 years are the most sceptical of any age
group in terms of adaptation to change.
Educational qualification was generally not significant in determining WTPh; but
significant in determining WTPh for consumers with Technical and Further Education
(TAFE) certificates and diplomas, see Table 6.4. Although TAFE qualifications can be
considered as tertiary education, previous studies have found that graduates and post-
graduates are more likely to buy organic products than people who have not attained a

158
university education (Denver, Christensen & Krarup 2007; Krystallis, Fotopoulos & Zotos
2006).
This study also found that the marital status of the respondents is not statistically
significant to determine the WTPh refer to Table 6.4. Marital status plays influential roles in
household income spending and the decisions that are made (Hawkins, Del & Best 2003).
WTP a premium for health benefit of organic wine may be influenced positively if
individuals are health conscious. Similarly, income as a determinant of WTPh is statistically
not significant. However consumers can be able to use organic products when they have the
financial resources to afford them and this impact on the attitude towards healthy products
and WTP for them (Fishbein & Ajzen 1980).
In terms of respondents’ occupation determining WTP, this study found that it was
not statistically significant in determining the WTPh (see Table 6.4), which means that
occupation does not impact on WTPh in the broader sense of it. However, consumers in
different occupations (by virtue of educational attainment and/or acquired skill set) earn
different wages/salaries (Chryssohoidis & Krystallis 2005; Thøgersen 2006); this impacts on
the size of disposable income and ability or willingness to pay for novel products with health
benefits such as organic wine. Table 6.4 shows that though it is not statistically significant,
the effect of occupation on WTPh is positive across all the defined occupation categories.
However for race as a determinant of WTP, the result was mixed. Generally race can
be said to be not significant in determining WTPh but Africans had a negative coefficient of -
0.944 and is significant at a 5% level of confidence in WTPh (refer to Table 6.4). The fact
that consumers of African origin are not willing to pay a premium for the health benefit of
organic wine may stem more from wine perception and be linked culturally. Africans are
primarily beer and local whisky consumers; this may be reflected in those respondents of
African descent in this Australian survey.

159
Finally, household types with dependants 0-24 months old, and 3-17 years old are
significant at 10% and 1% levels respectively to influence WTPh (see Table 6.4). Previous
studies indicated that households with children buy organic food (Chryssohoidis & Krystallis
2005; Tsakiridou, Mattas & Tzimitra-Kalogianni 2006). While this study is unsure about the
motivation for households with dependants 0-24 months old to pay a premium for the health
benefit of organic wine, the study found that there is link with drinking organic wine;
probably to ensure that pesticide residue that may be contained in conventional drinks
consumed by mothers are not passed to the children during their development. This outcome
requires further investigation.
Household with dependants 18 years and over that have positive attitude towards
health can indoctrinate the young adults that organic products and by extension organic wine
are worth the sacrifice made by the increased payment relative to the conventional wine. For
household with dependants 3-17 years old, it is expected to be a better place to introduce
organic knowledge to the household to prepare the dependants for adulthood. This
proposition has not influenced WTP for health benefit of organic wine for respondents in this
group.
6.9 Discussion of results
Most issues that arise for discussion in this chapter are similar to those in Chapter Five
because of the similarity in the explanatory variables and empirical analysis methods. The
results are similar for some relationships and different for others.
Respondent ranking of health benefit of organic wine as a driver of purchase decision
was low; about 9% ranked it as most important. When compared with the environmental
benefit, 55% of respondents ranked health benefit as one of top four drivers of wine purchase
as against 14% that ranked environmental benefit as a top four driver of purchase. This
implies that the respondents value their personal health more than the environment.
160
Consumers’ motive as a determinant of WTPh was not significant but there was a
positive relationship. Health benefit is difficult to access in the product and after
consumption; it takes scientific investigation to evaluate. The divergent opinions about this
benefit have not favoured the consumers in taking strong position about WTP for the benefit.
Under this cloud, WTPh can be limited (Penn 2010). This discussion section concludes the
chapter. The next chapter focuses on the willingness to pay for the expert service of wine
retailers.

161
Chapter Seven
Results and Discussion on Willingness to Pay for the Expert Service of
Wine Retailers
7.1 Introduction
This chapter presents results of consumers’ willingness to pay for the expert service
of retail store (WTPs) and the hypothesis testing outcomes. The Sample and variables
descriptive statistics for perceived risk and risk reduction strategy were presented in Chapter
Four but the variables statistics presented here apply to WTPs alone.
7.2 Consumers’ preference for wine store
Respondents ranked, on a scale of 1 to 8, retail outlets - large national general liquor
stores, independently-owned specialty wine shops, bars or pubs, supermarkets or grocery
stores, mail order/wine clubs and cellar doors at wineries, on the ability or perceived ability
of the stores to provide assistance to consumers. A rating of ‘1’ indicates ‘most able’ and ‘8’
indicates ‘least able’ to provide assistance to consumers in purchase situations. Refer to Table
7.1 for the descriptive statistics.
Table 7.1 Respondents’ ranking of preference for wine stores (on the ability to provide assistance during wine
purchase)
Store choice (%) 1st 2nd 3rd 4th 5th 6th 7th 8th Total
Large national general liquor
store retailer
18.9 16.2 17.0 15.2 12.4 9.4 6.8 4.1 100
Independently-owned specialty
wine shops
24.8 29.4 18.0 10.9 7.2 5.0 2.4 2.4 100
Supermarkets or grocery stores 8.2 8.0 6.3 8.3 9.2 14.3 17.3 28.4 100
Mail order/wine clubs 5 8.9 12.8 16.5 14.6 13.8 15.7 12.7 100
Cellar doors at wineries 33.2 19.7 14.9 10.4 6.9 7.2 4.1 3.5 100
Restaurants 4.3 8.0 15.8 17.6 17.5 14.5 13.6 8.8 100
Bars or pubs 2.0 4.7 8.1 11.4 16.6 19.6 19.6 18.0 100
Internet direct 3.7 5.1 7.1 9.7 15.6 16.1 20.5 22.2 100
Respondents ranking of the wine sales outlets in percentage terms.

162
More than 33% of respondents ranked cellar doors at wineries as the most able sales
outlet to provide assistance to consumers in a buying situation. Only 3.5% of the respondents
ranked this type of outlet as the least able. In regards to independently-owned specialty wine
shops, 24.8% of the respondents considered these as the most able to provide assistance to
consumers in decision making situation, while 2.4% of the sample considered them the least
able. The large national general liquor store was considered by 18.9% of respondents to be
the most able to provide assistance to customers purchasing wine; 4.1% of the sample ranked
it least able.
For supermarkets or grocery stores, 8.2% of respondents considered these as most
able to provide useful inputs in their purchasing decisions while 28.4% ranked them as the
least able. Less than 5.0% of the respondents indicated restaurants as the most able sales
outlet that influenced their purchasing decisions, while 8.8% indicated otherwise. In
summary, cellar doors at wineries (33.2%) and independently-owned specialty wine shops
(24.8%) represented the most able sales outlets to provide assistance to customers. Similarly,
about 83.0% of the respondents indicate that independently-owned specialty wine shops
ranked in their top four sales outlets in term of seeking assistance in a purchase situation. In
the same manner, 78.3% of the respondents ranked cellar doors at wineries in their top four
sales outlets in term of getting assistance in a purchase situation.
Less than 9% of respondents ranked mail order/wine clubs as the most able sales
outlet to provide assistance to consumers in a buying situation. Almost 13% of the
respondents ranked this type of outlet as the least able. In regards to bars or pubs, only 2.0%
of the respondents considered these as the most able to provide assistance to consumers in
decision making situation, while 18.0% of the sample considered them the least able. The
internet was considered by 3.7% of respondents to be the most able to provide assistance to
customers purchasing wine; more than 22% of the sample ranked it least able.
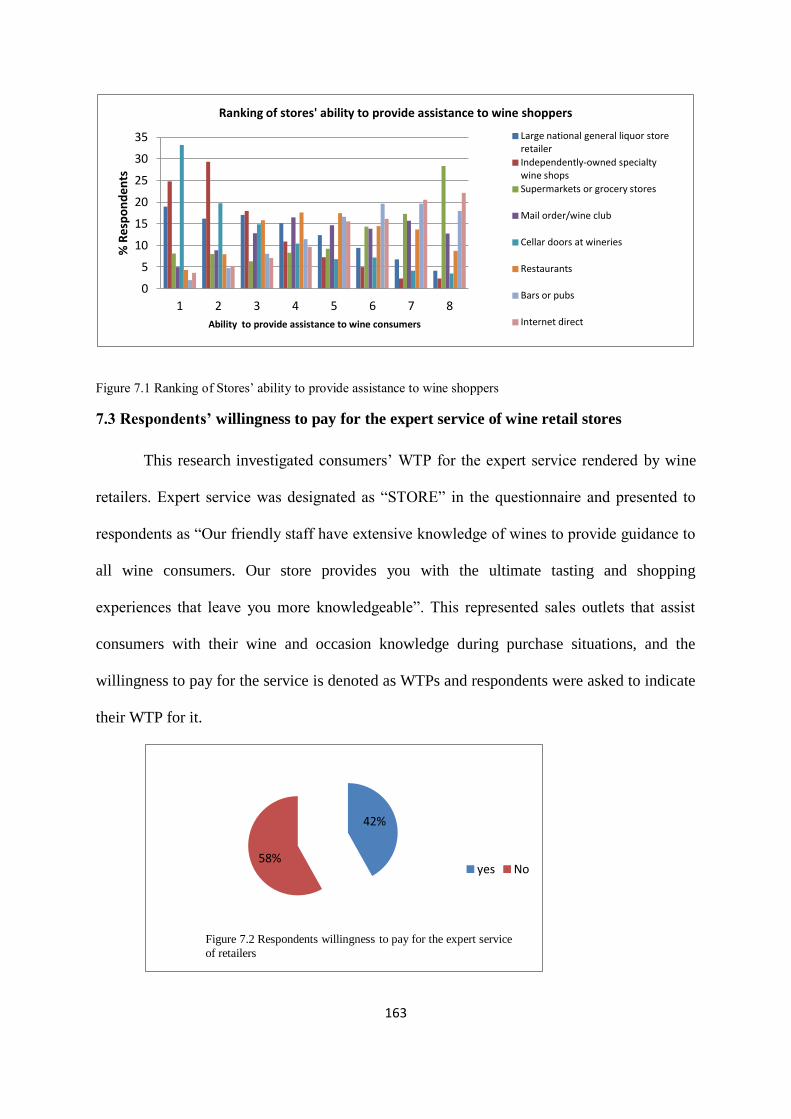
163
Figure 7.1 Ranking of Stores’ ability to provide assistance to wine shoppers
7.3 Respondents’ willingness to pay for the expert service of wine retail stores
This research investigated consumers’ WTP for the expert service rendered by wine
retailers. Expert service was designated as “STORE” in the questionnaire and presented to
respondents as “Our friendly staff have extensive knowledge of wines to provide guidance to
all wine consumers. Our store provides you with the ultimate tasting and shopping
experiences that leave you more knowledgeable”. This represented sales outlets that assist
consumers with their wine and occasion knowledge during purchase situations, and the
willingness to pay for the service is denoted as WTPs and respondents were asked to indicate
their WTP for it.
0
5
10
15
20
25
30
35
1 2 3 4 5 6 7 8
% R
esp
on
den
ts
Ability to provide assistance to wine consumers
Ranking of stores' ability to provide assistance to wine shoppers
Large national general liquor store retailer
Independently-owned specialty wine shops
Supermarkets or grocery stores
Mail order/wine club
Cellar doors at wineries
Restaurants
Bars or pubs
Internet direct
42%
58%
Figure 7.2 Respondents willingness to pay for the expert service
of retailers
yes No

164
A “yes” response from respondents indicated a willingness to pay a premium for the
expert service of wine retailers while a “no” response indicated otherwise. The descriptive
statistics are presented in Figure 7.2. Approximately 42% of the respondents expressed WTP
for the expert service rendered to wine consumers by the sales outlet. This is an interesting
outcome considering that wine consumers in Australia usually do not pay for the expert
service that enables consumers to maximise their wine knowledge and consumption.
Consumers however pay service charges in the hotel and/or restaurant situations (Bruwer &
Nam 2010).
Figure 7.3 shows results of the survey questions that sought to determine the amount
respondents were willing to pay for the expert service rendered by wine sales outlets. There
was no ‘base price’ as there were no prior studies that investigated WTPs. Payment card
options provided were $0.50, $1.00, $1.50, and $2.00 and respondents were asked to indicate
WTPs.
Fifty eight percent of the respondents indicated unwillingness to pay while 6.2% of
the sample indicated they would pay $0.50 for the service. More than 15% of the sample
showed WTPs of $1.00, 4.7% of the sample showed a WTPs of $1.50 and 16.0% of the
sample indicated a WTPs of $2.00. There were other bids not reflected in Figure 7.3 due to
the low respondent count per premium option chosen (refer to Appendix 7); but were

165
however included in deriving the average WTPs. On average respondents will pay $0.60 for
the expert service of the sales outlets. There is no benchmark price for this service. This
service can create an important distinctive attribute for wine retailers by the provision of
superior offerings to consumers (Lockshin & Kahrimanis 1998).
7.4 Discriminant analysis of respondents’ willingness to pay a premium for the expert
service of wine retailers
The distinguishing characteristics of respondents willing and those not willing to pay
premium for the expert service were investigated to determine if there were statistically
significant differences between these two classes of consumer. Discriminant Analysis was
used to differentiate the consumers based on discriminant scores. The Wilks' lambda, Pillai's
trace, Lawley-Hotelling trace, and Roy's largest root tests were carried out simultaneously by
default in Stata 12. Hence four multivariate test statistics are reported with their significance
levels (refer to Table 7.2).
Table 7.2 Tests of significance of all canonical correlations for WTPs
Multivariate test Statistic D/f1 D/f2 F Prob>F
Wilks' lambda 0.9547 2 2096 49.7321 0.001
Pillai's trace 0.0453 2 2096 49.7321 0.001
Lawley-Hotelling trace 0.0475 2 2096 49.7321 0.001
Roy's largest root 0.0475 2 2096 49.7321 0.001
(D/f 1 = degree of freedom for the variables and D/f 2 = degree of freedom for the respondents) for
determining the F statistics.
The null hypothesis is that the respondents willing and those unwilling to pay a
premium for the expert service of wine retailers are not different. The p-values associated
with the F statistics of the multivariate tests were used to test this hypothesis. It was rejected
as the p-values are all less than 0.05. The overall relationships between the predictors and
WTPs is significant, at p < 0.001 indicating the respondents willing to pay and those
unwilling to pay a premium for the expert service of wine retailer are different.

166
This analysis has confirmed two main groups of wine consumers. The strategy for
reaching these groups therefore must be different in terms of targeting, product positioning,
communication and message. The unwilling consumer would need more information that
creates awareness and product knowledge (Bhaskaran et al. 2006). Consumers that are
willing to pay should be provided offerings that enable them to try the varieties within the
organic brands.
The strength of the predictor variables used to differentiate the respondents is
provided by the canonical correlation (see Table 7.3).
Table 7.3 Difference between respondents willing to pay and those unwilling to pay premium for WTPs
Predictors PAVIV_RK RSKREDS3 RSKREDS5
WTPs - Canonical structure Matrix 0.93 -0.94 -0.67 Legend: PAVIV_RK = composite scale items for perceived risk, RSKREDS3 and RSKREDS5 represent scale items;
"Purchasing from a store that has friendly and knowledgeable staff and Buying wine from a store that has won some awards"
respectively.
The relative importance of each predictor variable in discriminating between
consumers willing and those unwilling to pay for the study attributes was determined using
the canonical structure coefficients (loading). The standardized coefficient (R2) was not
considered for interpretation because of its instability and possible variable correlation
(Perreault, Behrman, and Armstrong 1979). Canonical structure matrix also shows the order
of importance of the discriminating variables by total correlation.
Table 7.3 reports the structure matrix showing the correlations of each predictor with
the discriminant function. The structure matrix (or discriminant loading) is based on
identifying the largest loadings for each discriminate function. A canonical structure matrix
(r) of 0.3 or more (Significant at p < .001) is used to interpret the function. Applying this rule,
for WTPs, PAVIV_RK (r = 0.90), RSKREDS3 (r = -0.94) RSKREDS5 (r = -0.67) are
important determinants that distinguished respondents willing and those unwilling to pay for
the expert service. This result premises friendliness and knowledge as more important to the

167
consumer than the perception of risk. Respondents that have been exposed to expert service
of retailers can better put a value on it in relation to WTP a premium. Consumers’ perception
of this value will motivate them to maximise the use of in-store resources rather than
avoiding purchase of the product due to a lack of information.
7.5 Factors that affect willingness to pay for the expert service of wine retailers
The study used ordered probit regression analysis to explain the effect of the
independent variables on consumers’ WTP for the expert service of retailers. The analysis
was done with Stata 12 software package with 2,099 usable surveys.
In an ordered probit model, one of the underlying assumptions is that the relationship
between each pair of outcome groups is the same; i.e. the model assumes that the coefficients
that explain the relationship between the lowest and all higher groups of the response variable
are the same as the ones that explain the relationship between the next lowest group and all
higher groups. This is referred to as parallel regression assumption or the proportional odds
assumption (UCLA Academic Technology Services).
This study attempted several alternative model specifications for the estimation of WTPs, and
used diverse combinations of variables individually and/or as aggregates to obtain the best fit.
Two models were considered, the first with two composite variables -perceived risk
(PACIV_RK) and risk reduction strategy (RRS_A), and the social demographic variable. The
second model used the composite variable of perceived risk (PACIV_RK), with the five
observed variables of risk reduction strategy applied individually and the social demographic
variables. The two models were significant. The reason for the choice of the latter model
(Table 7.4) was to determine which of the observed variables actually influence consumers’
WTPs. For the other model not discussed here, refer to Appendix 9. Parameter estimates and
summary statistics of the ordered probit model are presented in Table 7.4

168
Table 7.4 Results of Ordered Probit Analysis of Consumers’ WTP for the expert service rendered by wine sales outlet.
Variable Variable name Coefficient Standard Error z P>z
Gender1a
Female -0.083 0.060 -1.39 0.166 Age1
25 - 28 years 0.105 0.230 0.46 0.649
29 - 34 years 0.256 0.211 1.21 0.225
35 - 40 years 0.078 0.210 0.37 0.711
41 - 45 years 0.186 0.215 0.87 0.387
46 - 54 years 0.141 0.207 0.68 0.496
55 - 65 years 0.211 0.208 1.01 0.310
65 + years 0.388 * 0.220 1.76 0.078
Education1
Higher school certificate -0.061 0.103 -0.59 0.558
TAFE certificate/diploma -0.061 0.085 -0.71 0.475
Bachelor’s degree 0.037 0.099 0.37 0.711
Graduate/Postgraduate
diploma 0.001 0.109 0.01 0.995
Master’s degree 0.004 0.131 0.03 0.975
Doctorate degree 0.072 0.243 0.30 0.766
Others 0.044 0.208 0.21 0.832
Marital Status1
Married or cohabiting -0.022 0.087 -0.25 0.799
Separated 0.164 0.164 1.00 0.317
Divorced -0.009 0.119 -0.08 0.939
Widowed 0.224 0.166 1.35 0.177
Gross annual Income1
$25,001 - $50,000 -0.052 0.100 -0.52 0.603
$50,001 - $75,000 -0.023 0.105 -0.22 0.823
$75,001 - $100,000 -0.114 0.111 -1.03 0.305
$100,001 - $150,000 -0.030 0.115 -0.26 0.792
$150,001 - $200,000 -0.110 0.151 -0.73 0.467
$200,000 plus 0.131 0.177 0.74 0.456
Race1
Indigenous Australian 0.051 0.175 0.29 0.771
American -0.246 0.238 -1.04 0.300
African -1.076 ** 0.526 -2.05 0.041
Asian 0.015 0.100 0.15 0.883
Others 0.336 0.229 1.47 0.143
Occupation1
Clerical and administrative -0.062 0.150 -0.42 0.677
Education -0.001 0.156 0.00 0.996
Management and
professional -0.061 0.140 -0.44 0.661
Sales and service -0.062 0.151 -0.41 0.683
Warehouse and distribution -0.130 0.201 -0.64 0.519
Others -0.150 0.152 -0.99 0.324
Household type CHILD2 0.029 0.106 0.27 0.785
CHILD17 -0.043 0.068 -0.63 0.528
CHILD18 0.127 ** 0.054 2.34 0.019
Perceived risk PACIV_RK -0.005 0.004 -1.51 0.132
Purchasing wine from the store that has reviews on wine RSKREDS1 0.030 0.033 0.91 0.363 Using reputation of the wine store to make a purchase decision RSKREDS2 0.024 0.031 0.78 0.434
Purchasing from a store that has friendly and knowledgeable staff RSKREDS3 0.195*** 0.034 5.81 0.001
Purchasing wine from stores recommended by friends and colleagues RSKREDS4 0.012 0.030 0.39 0.696
Buying wine from a store that has won some awards RSKREDS5 0.052 * 0.029 1.79 0.074
Ordered Probit Thresholds
Coefficient
(β)
Standard
Error (SE)
(β/SE)
μ 1
1.704 *** 0.308
5.532 μ 2
1.874 *** 0.308
6.083
μ 3
2.352 *** 0.309
7.609 μ 4 2.537 *** 0.310
8.193
X2 Log-L -2452.105; Chi-square = 167.98, p-v. 0.001 (n = 2099)
***, **, * Indicates estimated coefficient is significant at the .01 level, 0.05 level, 0.10 level. Gender1, Age1, Education1; excludes gender male, 18-24 age group category
and leaving school certificate category as highest education obtained. Marital status1, Gross annual income1 and Race1 excludes marital status single,
gross annual income $25,000.00, and race Caucasian.
The model significance was verified by calculating the Chi-squared statistics resulting
from the likelihood functions. A likelihood ratio criterion was used to test the null hypothesis
that the coefficients estimated were zero for each factor. Forty-five coefficients were
estimated; only five were significant. Coefficient for “Purchasing from a store that has
friendly and knowledgeable staff” (RSKREDS3) was significant at 0.001 level. Coefficient

169
for “Buying wine from a store that has won some awards” (RSKREDS5) and ‘Race –
African’ was significant at the 0.05 level while age group 65+ years and household with
dependants 18 years and over (CHILD18) were significant at the 0.10 level. Estimated
threshold levels defining the different WTP premium options were all significant at 0.01
level.
7.5.1 The Hypotheses
Table 7.5 Summary of Outcome of Hypotheses Testing - WTPs
Hypothesis
# Hypothesis Outcome
level/dir
ection
H5c
WTP for the expert service consumers receive from wine retailers is
dependent on the perception of risk
Not
significant
(rejected)
H6
Wine consumers are willing to pay for the expert service they will
receive when making purchase at the store
Significant
(accepted) *** +
H7c
The social demographic characteristics of consumers will positively
influence their WTP for the expert service of wine retailers mixed outcome
‘- and +’ defined the direction of the relationship. ***, **, * indicates estimated coefficient is significant at the .01
level, 0.05 level, 0.10 level. The demographic outcome is a mix of positive and negative significant on one hand
and not significant on the other.
Hypotheses 1a & b, 2a & b, 3a & b, 4a & b, 5a & b and 7a & b have been presented in
the previous chapters. The hypotheses presented in this chapter are H5c, H6 and H7c as they
relate to WTPs.
Hypothesis 5c (refer to Table 7.5), states that the WTP for the expert service consumers
receive from wine retailers is dependent on their perception of risk; but the findings indicated
that this was not a significant determinant of premium payment for this attribute (H5c
rejected). The result indicates consumers are concerned about perceived risk but are more
interested in eliminating the perception. For this reason they like to acquire more product and
market related knowledge instead of being bound with fear of products not meeting
expectation. The finding supports Rosch et al. (1986), who demonstrated that when
consumers have knowledge in advance about a product, they are able to make more product
related judgement within and between product categories. This study also aligned with Rao
and Monroe (1988) and Rao and Bergen (1992), that when consumers have prior knowledge,

170
they are able to use it to moderate the effect of price on perceived quality and the price they
are willing to pay for the product.
Hypothesis 6 proposes that consumers are willing to pay a premium for the expert
service they receive when making purchase at the wine store. The hypothesis holds (H6
accepted) and is significant at 1% level of confidence. The findings indicate that purchasing
from a store that has friendly and knowledgeable staff is significant at 1% level of confidence
and buying wine from a store that has won some awards is significant at 10% level of
confidence (see Table 7.4). The other risk reduction variables used had insignificant positive
effects on WTPs. This result suggests the qualities consumers expect from wine retailers must
lead to satisfaction, trust, interaction and relationship. These qualities are vital in introducing
or reinforcing products to consumers and make friendliness and knowledge impartation to the
consumer easier. So, a strong information provision and relationship building policy is
desired. Hence the findings, particularly on the use of friendly and knowledgeable staff,
support Boatto et al. (2011).
Hypothesis 7c states that the social demographic characteristics of consumers will
positively influence their WTP for the expert service of wine retailers. The outcome of the
analysis of the survey responses suggested that social demographics were not a good
predictor of WTPs. The findings were mixed and mainly insignificant for most of the sub
variables - education, marital status, income and occupation in the social demographics. The
result of the analysis of respondents in the age group 65 years and over supports the
hypothesis positively at 10% level on confidence (see Table 7.4). Aging changes how
information is processed. For example, comprehension of numbers, especially in decisions
that are unfamiliar or seldom encountered tends to decline with age (Peters et al. 2007a;
Peters et al. 2007b). Age-related declines in deliberative cognitive processes cause consumers
to make poorer quality decisions as they get older (Peters et al. 2007a; Peters et al. 2007b).

171
Hence older adults prefer sticking to familiar products or use third party assistance such as
the service of qualified sales staff in wine stores (Lambert-Pandraud & Laurent 2007;
Lambert-Pandraud, Laurent & Lapersonne 2005).
The results of the analysis of respondents in the household with dependants 18 years
and over were significant positively at 5% level to influence WTPs. This study opined that
the complexity of wine knowledge is strong enough for wine consuming parent to invest in
the wine knowledge of their dependants from reputable source.
7.6 Relationship between willingness to pay of the benefits of organic wine and expert
service of wine retailers
The two components of this thesis; willingness to pay for the environmental and
health benefits of organic wine, and the willingness to pay for the expert service of wine
retailers, though studied independently, influenced each other and can create a symbiotic
opportunity in wine marketing. This study found that 43.10% and 50.10% of consumers
willing to pay for the environmental and health benefits of organic wine respectively were
also willing to pay for the expert service of wine retailers. These relationships were tested
using Chi square. The relationship between WTPe and WTPs was denoted by “CA” while
that of WTPh and WTPs was denoted by “CB”.
Table 7.6 Chi Square test of relationship between WTPs and WTPs and , WTPh and WTPs
WTPe and WTPs (CA) WTPh and WTPs (CB)
WTPe WTPs
Total
sample WTPh WTPs
Total
sample
Yes (%) No (%) 2099 Yes (%) No (%) 2099
Yes 43.10 56.90 100 Yes 50.10 49.90 100
No 28.80 71.20 100 No 25.70 74.30 100
Chi2 (1) = 118.58 Pr = 0.001
Chi2 (1) = 114.02 Pr = 0.001
The 1s in parenthesis indicate the degree of freedom. Chi square for "CA" = 118.58 and for "CB" =114.02, P-v 0.001
For “CA” and “CB” models, the Chi-square statistics were 118.58 and 114.02
respectively and p < 0.001. The results indicate the models are statistically significant at 1%
or above, meaning that the test of the null hypothesis revealed that the models did not have
172
greater explanatory power than an “intercept only” model. The null hypotheses for the two
models were rejected for the models estimated. The implications are that the overall models
“CA” and “CB” are significant at the 1% level and the relationship that exist in “CA: and
“CB” is not a chance effect.
7.7 Discussion of outcomes on WTPs
This study also examined where consumers are likely to get assistance when faced
with the decision to purchase wine. Eight different retail store classifications were presented
to the respondents. Respondents indicated cellar doors at wineries and the independent
specialty stores as the two most able to provide assistance to consumers in a buying situation.
The unique abilities of these highly rated sale outlets are the provision of friendly and
knowledgeable sales staff and a wine tasting environment that can influence consumers’
attitude toward wine and its attributes, service and price sensitivity. While frequency of visit
to cellar doors can be poor relative to total wine sales outlet visits, and cannot be every day
(and is never intended as such), it is expected that the experience gained in the cellar door
visit should be translated into product knowledge and possibly brand loyalty.
To give effect to brand loyalty through product knowledge, it is expected that the
services (particularly providing consumers with knowledge to make purchase decisions)
rendered by the cellar door be replicated in the sales outlets that are generally more accessible
to consumers. In this circumstance, consumers can have access to information about the
product and processing methods and the occasions or purpose they serve. They can also
verify information at their disposal and clarify any doubts.
Independent specialty stores, on the other hand, have very similar characteristics to
cellar doors in terms of providing assistance to consumers (see Figure 7.1) but mainly cater
for high-end consumers who purchase expensive product most of time (Hsieh & Stiegert

173
2012). These consumers do not represent a large segment of the market in number terms, but
in dollar terms are relatively influential in the market.
Factors that influence consumers’ WTP for expert service were considered; almost all
were significant, and those not significant showed some effects (refer to Table 7.4). Therefore
the effects of perceived risk and purchasing from a store that has friendly and knowledgeable
staff variables on WTPs were affected by the knowledge level of consumers and the
associated perceived risk.
Interestingly, this study presented and reemphasised the softer side of retailing that
creates the exchange of dynamic information, which emphasises human interaction through
the customer–staff–store interface (Bowman & Ambrosini 2000; Johnson 2011; Madhok
2002; Porter 1985; Priem 2007). This allows the consumers to identify with the retailers and
help create a sense of belonging that extends into the interactive in-store experience.
To improve the knowledge of consumers about the product, reduce the perceived risk
and the associated consequence of wrong choice and create relationship in the long run, it is
important to put effective store strategy in place. Formal expert knowledge about the diverse
attributes, such as region and country of origin, production practices, type and style of wine,
is critical in terms of provision, accessibility and the cost.
One would expect how much consumers are willing to pay will generally depend on
the complexity and consequences of the decision being made. For instance, complex
decisions with heavy social and psychological penalties for mistakes are likely to cause
consumers to solicit advice at a cost. In contrast, for simple choices with no consequences for
errors, the reverse may be the case. This study found consumers require expert advice from
the sales outlet not only because of the perceived risk but for improving their product
knowledge.

174
Paying a premium or a price for the expert service delivery is currently not common
in the Australian wine retail market and there is no benchmark; however the study found
significant WTPs with 42.0% of the respondents willing to pay for the expert service of the
sales outlet. On average, respondents indicated $0.60 WTPs. This willingness is a reflection
of the importance consumers assign to the need for product knowledge. Consumers will be
more enthusiastic and excited about making purchase when the right knowledge to make a
decision about the purchase is available. The availability of the information serves as booster
of confidence and enables consumers to overcome doubts in purchase situations (Schiffman
& Kanuk 2006). Therefore the expert service that delivers knowledge benefits to consumers
must be packaged in diverse manners as will be suited for diverse consumer groups and must
be provided ‘effectively’ with a cost.
175
Chapter Eight
Conclusion and Implications
8.1 Introduction
Several studies of the effects various methods of production have on naturally
occurring food compounds, human health and the environment conclude that human and
animal health and the environment are better off when production practices are modified, and
the use of chemicals limited or eradicated. This has led to some exciting developments in
production methods that limit or exclude the use of synthetic chemicals, and the production
of novel products that provide environmental and health benefits; with this has come the
establishment of niche markets for organic products such as organic wine.
Organic markets must develop products that promote good health and wellbeing for
consumers and which are better for the environment we live in. The wine industry, including
viticulturists and wineries must be positioned to benefit from the increasing opportunities in
the growing organic wine market. The increase in health and environmental consciousness is
impacting consumer behaviour, and aligning them with a healthy eating lifestyle with organic
products. Consequently, understanding the drivers of consumer behaviour is important for
growth in the organic market and for the associated benefits to be realised. Bearing this in
mind, the study objectives were to investigate consumers’ WTP a premium for the
environmental and health benefits organic wine, and the factors that affect the WTP for these
benefits. Also investigated was the consumers’ WTP a premium for the expert service of
wine retailers; and the factors that influence the willingness in Australia.
Achieving these objectives involved the application of a positivist approach
methodology in which a survey questionnaire was used to obtain quantitative data to test the
proposed hypotheses. An online survey questionnaire was directed to pre-qualified potential

176
respondents on a mailing list from which respondents were randomly chosen. Two thousand
and ninety nine usable surveys were collected in all the states and territories of Australia in a
proportional manner relative to the population of these geographical entities.
The theoretical framework was conceptualised on the basis of prior studies. The
econometric model using ordered probit regression analysis method was applied to evaluate
the effect of different explanatory variables, including social demographics, on the
willingness to pay a premium for the three different attributes investigated in this study. All
the analyses were carried out using Stata 12 statistical software.
Results from descriptive statistics for the survey indicated that of the total number of
respondents, 61.6% of the respondents were males, 25.7% are in the age group of 55-65
years, 83.6% had one form or the other of tertiary educational qualification, 69.7% were
either married or co-habiting and 85.5% were Caucasian (white). Almost 85% of the total
respondents reported they consume wine at least once a week, while 63.9% and 19.9% of the
respondents indicated that taste and price respectively are the main (first) influencers of their
choice of wine. This contrasts the 4.8% and 1.4% of the respondents that reported health and
environmental benefits respectively as the most important purchase decision factor. Sixty six
per cent of the respondents affirmed they had made purchase of organic wine previously,
56.0%, 66.0% and 42.0% of the respondents reported a WTP for environmental benefit and
health benefit of organic wine and the expert service rendered to wine consumers by the sales
outlet respectively. On average, the premiums respondents’ indicate willingness to pay
amount were $2.25 (approximately 23%), $2.30 (approximately 23%) and $0.60 (no base
price reference to determine the percentage WTPs) for environmental benefit, health benefit
and expert service of the sales outlets respectively. The base price of a $9.95 bottle of wine
was used for the organic wine; and no base price exists for the expert service of wine

177
retailers. For detailed results on the respondent and variable descriptive statistics and the
tested hypotheses, refer to chapters Four, Five, Six and Seven of the thesis.
The hypotheses proposed were tested using the ordered probit model and all of them
except three were accepted. The social demographic variables presented a mixed outcome
(refer to Tables 5.7, 6.5 and 7.5).
Overall for WTPe, consumer’s knowledge of organic wine was found to be significant
and positively correlated with WTP for the environmental benefit of organic wines, and the
marginal effect of knowledge indicated that the probability of paying $0.00 premium for the
environmental benefit decreases as the knowledge of consumers about organic wine
increases. For WTPh, the relationship between knowledge and WTP was similar in direction
to WTPe but different in magnitude. The consumers’ motive indicated negative significance
to WTPe and was not significant but positive for WTPh.
The consumer attitude was positive and significant in WTPe and WTPh and an
increase in the consumers’ attitude decreased the WTP $0.00 for both environmental and
health benefits. However, the consumer perceived risk was negative and significant for WTPe
and WTPh. The consumers’ perceived risk was not significant in determining WTPs. For
WTPe, WTPh and WTPs, risk reduction strategy was positive and significant in determining
WTP and as it increases, so decreases the WTP $0.00 premium for environmental and health
benefits and the expert service provided by sale outlet.
8.2 Practical implications
In this new era of global food systems, effective communication of product attributes
to final consumers is a managerial task that goes far beyond meeting public and private
standards imposed by governments and retailers. It involves deliberate and careful
understanding of the consumers themselves and those triggers that release or constrain them
to make a purchase. The research investigated the factors that influence consumers’ WTP for
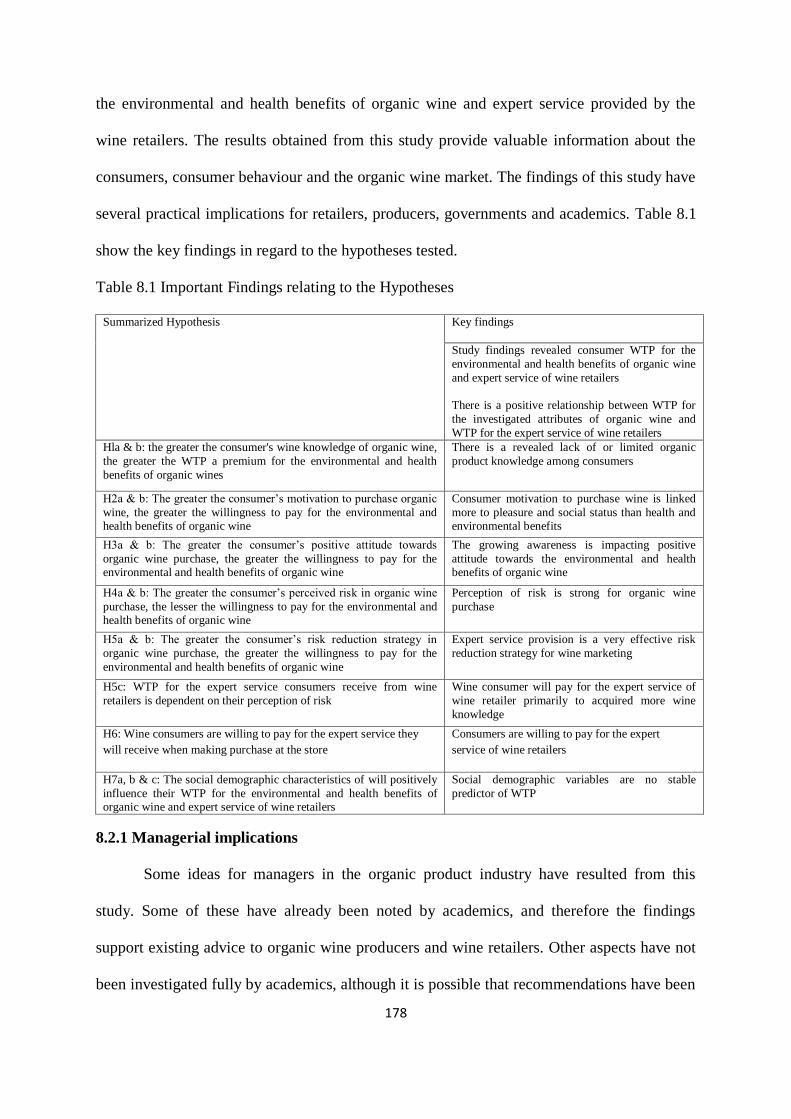
178
the environmental and health benefits of organic wine and expert service provided by the
wine retailers. The results obtained from this study provide valuable information about the
consumers, consumer behaviour and the organic wine market. The findings of this study have
several practical implications for retailers, producers, governments and academics. Table 8.1
show the key findings in regard to the hypotheses tested.
Table 8.1 Important Findings relating to the Hypotheses
Summarized Hypothesis Key findings
Study findings revealed consumer WTP for the
environmental and health benefits of organic wine
and expert service of wine retailers
There is a positive relationship between WTP for
the investigated attributes of organic wine and
WTP for the expert service of wine retailers
Hla & b: the greater the consumer's wine knowledge of organic wine,
the greater the WTP a premium for the environmental and health
benefits of organic wines
There is a revealed lack of or limited organic
product knowledge among consumers
H2a & b: The greater the consumer’s motivation to purchase organic
wine, the greater the willingness to pay for the environmental and health benefits of organic wine
Consumer motivation to purchase wine is linked
more to pleasure and social status than health and environmental benefits
H3a & b: The greater the consumer’s positive attitude towards
organic wine purchase, the greater the willingness to pay for the environmental and health benefits of organic wine
The growing awareness is impacting positive
attitude towards the environmental and health benefits of organic wine
H4a & b: The greater the consumer’s perceived risk in organic wine
purchase, the lesser the willingness to pay for the environmental and health benefits of organic wine
Perception of risk is strong for organic wine
purchase
H5a & b: The greater the consumer’s risk reduction strategy in
organic wine purchase, the greater the willingness to pay for the
environmental and health benefits of organic wine
Expert service provision is a very effective risk
reduction strategy for wine marketing
H5c: WTP for the expert service consumers receive from wine
retailers is dependent on their perception of risk Wine consumer will pay for the expert service of
wine retailer primarily to acquired more wine
knowledge
H6: Wine consumers are willing to pay for the expert service they
will receive when making purchase at the store
Consumers are willing to pay for the expert
service of wine retailers
H7a, b & c: The social demographic characteristics of will positively
influence their WTP for the environmental and health benefits of organic wine and expert service of wine retailers
Social demographic variables are no stable
predictor of WTP
8.2.1 Managerial implications
Some ideas for managers in the organic product industry have resulted from this
study. Some of these have already been noted by academics, and therefore the findings
support existing advice to organic wine producers and wine retailers. Other aspects have not
been investigated fully by academics, although it is possible that recommendations have been

179
adopted by managers as a ‘gut feeling’ about how to market organic produce. The results
obtained from this study indicated that the knowledge of environment, health and organic, the
consumers’ attitude, motive, perceived risk and risk reduction strategy will affect the
consumers’ WTP a premium for organic wine in particular, and any other organic products
being evaluated. Apart from these variables determining WTP, they also influence decisions
on how much premium the consumers are willing to pay for the environmental and health
benefits of organic wine.
The Australian domestic wine market has strong growth potential; this study found
that about 84% of the respondents drank wine regularly, at least once a week. This indicates
that there is an existing wine market that consumes both conventional and organic wines. The
study further shows that 66.0% of respondents have purchased organic wine prior to the
survey. One may be tempted to think the market growth is a given, however the enquiry
about respondents’ knowledge of environment, health and organic wine revealed lack of or
limited organic product knowledge on the part of most survey participants. Consumers’
under-awareness and lack of knowledge obscures their need to be assisted through the
creation of knowledge stimulating environments. This implies that sensitisation and
enlightenment programs that are geared toward perceiving this need must be embarked upon
cautiously due to the contested nature of the scientific evidence, to effectively help
consumers move toward more organic wine consumption. Migrating consumers along the
continuum from ‘rarely’ to ‘frequent’ purchasers will increase their purchases of organic
wine. A wide range of methods to communicate information about ‘organic’ can cut across
the print and electronic media where leaflets, product magazines, cook books, television
shows and other promotional materials and word of mouth can be directed to consumers
emphasising the role and benefits of the organic concept.

180
The study found that product knowledge is low, yet 66.0% of respondents had
purchased organic wine prior to the survey, respondents may have ostentatious buying
behaviour or exhibited curiosity about organic wine. This previous purchase is linked to
social symbols of flamboyancy and/or class definition/distinction as had been reported in
previous studies. It is also probable that respondents that have purchased organic wine prior
to this survey were attracted by the product packaging – eye catching labels, package shape
and size or responded to peers influence. These assumptions imply that marketers need to
investigate the organic wine market to determine the real motives of organic wine consumers
so as to better position the product in the market as there may be links between consumers’
motive and the premium they are willing to pay.
The study outcome produced some segments that are actionable from different
marketing standpoints. Two segmentation criteria evolved from the study – segmentation
based WTP and that based on the actual premium consumers are willing to pay. The various
segments that evolved require different strategies for positioning, targeting, communication
and messaging.
This study found that taste is considered as the most important decision factor by most
respondents when making wine purchase. As with any market setting where consumers have
a range of choices, to achieve sustained market growth, organic wine will need to meet or
surpass consumer’s experiences in relation to regular alternatives. Taste is a very important
attribute of organic products as previous researches have indicated organic products are
tastier and thus this aspect can attract consumers to them. This attribute of organic wine is
less emphasised (probably because of the stereotype perceived low quality stigma associated
with it) compared to the environmental and health benefits. As wine consumption is mainly
social, taste will continue to dominate the reason for wine choice. Producers and retailers of
organic wine must emphasise the taste attributes strongly alongside the environmental and
181
health benefits and consumers will buy more organic wine for its purpose, without doubt of
any compromise to taste. The objectives are to correct the wrong and negative perceptions of
the taste of organic wine and to attract new consumers to it.
The study also found that price is the second most important decision factor
influencing consumers when buying wine. Instead of being perceived to provide value for
money, organic wine is considered to be expensive. As with the conventional wine, wineries
should produce organic wine to cater for all the market segments.
Another finding from the study was that sales outlets such as cellar doors at wineries
and independent specialty stores are the two most trusted outlets to buy wine because they are
best able to provide consumers with the information to improve on their existing knowledge
and a tasting environment when making (new) purchases. The shortcomings with these two
sales outlets are that while cellar doors are not readily accessible for regular purchase
geographically, and independent specialty wine stores can be expensive for most consumers,
as their products usually are high end.
This study also found that the perception of risk is high among consumers with 86.0%
of respondents suggesting that the organic claims should be verified. Apart from lack of
knowledge, this is attributed to the confusion that exists about the status of organic. One of
the findings from the study is that risk reduction strategy will ameliorate consumers’ fear
when they are exposed to it. Another finding from this study was that there is a positive
relationship between willingness to pay for the organic wine attributes and the willingness to
pay for the expert service of wine retailers. However the quality of the expert service offered
is the key to the strength of this relationship; when consumers buy new knowledge they
acquire value that enables them make better market assumptions and purchase decision about
what type of wines they buy, their attributes and how much to pay.
182
Therefore, to better manage the growth of the organic and conventional wine markets,
apart from the previous recommendation of sensitisation and enlightenment programs, retail
stores need to develop a ‘unique selling proposition’ (USP).
A USP according to Lake (2009) as a practice statement sets the retail store apart
from its competitors. It paves the way for the positioning strategy and unique actions to
differentiate the product from its competitors. To this end it is advocated that a requirement
for the employment of qualified staff (wine consultants, not just sale staff) in all the sale
outlets is recognised.
This calibre of staff should be highly educated in wine related disciplines with much
practical experience in wine, wine marketing and customer care. The staff should be able to
provide up-to-date information response to consumers’ enquiries about wine in general,
whether domestic or foreign products. They should be able to liaise with chefs about recipes
and the best food-wine combinations, and make such information available to the consumers
in a manner to induce them to explore and thus enhance their experience. In addition,
providing research and market information to consumers in their simplest form is a good way
to keep them informed and stimulated. Apart from servicing the consumers’ needs for
knowledge and allaying fears, this creates a positive perception and image for the store. The
provision of expert service to consumers can serve as a competitive instrument and basis for
differentiating sales outlets and improving the retail market share.
In these days of economic hardship when employers are reducing their cost of doing
business, employing the calibre of staff recommended may appear wishful thinking due to the
(seemingly) prohibitive cost; hence why part of the study was to determine consumers’
willingness to pay for expert service provided by the wine sales outlets. Several studies have
been done on retail store attributes; prior to this research none has been done on WTPs (to the
best of our knowledge), and the study found employment of friendly and qualified staff

183
would significantly and positively affect the WTPs. Though payment of premium for expert
service had not taken place in their previous purchase situations, 42.0% of the respondents
indicated WTP for expert service provided by wine stores. The implication here is that
consumers value the importance of product knowledge and are interested in improving it
even at a financial cost to themselves. A well developed and managed expert service can
become an extrinsic (store related) attribute of wine just like the country of origin or the
expertise of the wine makers have become extrinsic (product related) attributes of wine.
In summary, this research gap in the retail marketing must go beyond research
recommendations to practice in wine retailing, as the study found consumers (apart from
perceiving risk) are also information hungry and will pay a price to obtain it. The concept of
employing qualified staff in retail outlets has a good future and can represent a major
improvement to the RRS of many stores that can create a ‘win-win’ situation for both
consumers and retailers.
With this information, wine industry marketing managers may find new ways to
promote organic labelled wines and address the issues that create setbacks to wide
acceptance. Sales will increase by better understanding of which factors influence consumers’
willingness to pay for organic wine benefits and the expert service of retailers.
8.2.2 Policy implications
Trust is a very important component of any market, such that when it is in decline or
absent, risk perception increases. There is global diversity in the certification of organic
products, which has created a proliferation of organic products with different certification
criteria. For instance, how does one convince a consumer that two different wines in the
organic section of a store are actually organic when the label information is different? This
problem is magnified by the many different brands claiming organic status on the shelf. This

184
situation causes doubts in the consumers’ mind; and provides an easy avenue for standard and
quality infractions within the organic market by dubious producers and marketers.
The implication here is that there is a compelling and immediate need to harmonise
and standardise the certification processes and regulations around organic products.
Governments, through their surrogate corporations and agencies, should negotiate and
formulate general cross-cultural policy for organic production. As difficult as this could be, a
regional or trading bloc framework approach or inclusion of common organic regulations in
trade agreements among trading partners may serve to aggregately harmonise the certification
process, increase trust and the WTP for the health and environmental benefit of the organic
products. One could argue that this may have not worked as well as expected in some cases,
but it would surely be better than the current proliferation and easier to manage.
A campaign on the benefits of organic wine and other sustainable products as part of
the mitigating strategy against global warming is important, so that even when consumers
feel they are paying more compared to conventional products, they feel content by making a
sacrifice for the environment and their future. This assumption has a positive implication for
behavioural changes that support a more sustainable consumption. Therefore continued
recognition and support for organic growers, processors, retailers and consumers from all
tiers of government is important as it provides a meaningful contribution to their environment
and health policy programmes.
8.2.3 Academic Implications
With respect to methodology, this study has demonstrated the use of ordered probit
model to develop empirical frameworks, which help to predict and explain consumer
purchase behaviour and their WTP a premium for organic wine attributes and expert service
of the retail store. These frameworks help to understand the relationship between product
characteristics and consumer’s knowledge, attitude, motivation, risk perception as well as risk
185
reduction strategy in the study of WTP. These frameworks also provide estimates of total
effects on WTP and individual marginal effects of the causal factors.
Overall, this study has contributed to further understanding of wine consumers,
particularly in Australia, in relation to their awareness and knowledge of organic wine and
especially concerning WTP a premium for its attributes and the expert service of retailers.
The assumption that an organic product with specific health and environment advantages is
likely to draw attention to itself may not automatically hold. Understanding and responding to
the needs of consumers is the ‘key’ to determine whether the organic concept will be
sustainable or achieve intended results. Considering that this study has researched in depth
consumers, their behaviour and WTP, the identified risk characteristics and risk reduction
strategies; the results herein all have the potential to help governments and the relevant
industries develop appropriate risk management strategies and effective risk communication
messages. The use of expert personnel in wine sales outlets will be important to the strategy,
will help improve brands and differentiate the stores as consumers have shown willingness to
pay for this service.
8.2.4 Limitations of the study
Inevitably, there are limitations in any research. The fact that the study is not a
longitudinal survey is a limitation, as attitudinal variables cannot be fully understood in a
snapshot. Also, that the research is exploratory presents a shortcoming in itself as similar
research is required to confirm the results of the study. The sample size of over 2,000
respondents is large, but in terms of generalisation on a population of about 15 million
drinking adults, it may not be enough to reveal the variability in the population. One of the
screening criteria of “must have consumed/purchased at least a bottle of wine every month in
the last six months” may have discriminated against the new wine converts and thus reduced
the total variability.

186
In the case of data analysis, the stringent requirement in using ordered probit
regression model for the statistical analysis required that for managerial implications, scale
items should have extracted a variance of 0.5. Also, to produce a summated scale, all items
must exhibit uni-dimensionality and any items that did not meet these requirements were
eliminated, despite having been supported conceptually. Perceived risk was the most culpable
variable losing two marginal items of the five used to represent it. However, confidence
exists that these limitations did not affect the quality of this study and its recommendations.
8.2.5 Future research direction
Future research direction can be grouped into two main categories, namely: to address
the shortcomings of the current study and to extend this work to other applications.
8.2.5.1 Research refinement
The cross-sectional approach presents a snapshot of the factors that influence
consumers’ WTP for the environmental and health benefits and the expert service provided
by sales outlet. The attitudinal characteristics of consumers used for the study cannot be fully
understood in one survey. Therefore, a longitudinal study is recommended to give a clearer
picture of how these factors and changes in socio-demographics might influence consumers’
WTP over time.
8.2.5.2 Research extension
We conducted the study in Australia. A transnational research, for example of the
Asian Pacific rim or Australia’s major export destination such as USA, United Kingdom and
the Scandinavian countries, is recommended. This will enable a comparison of any cultural
differences that can influence the behaviour variables that affect WTP, and also identify the
best possible way to create effective regional and international frameworks for organic wine
marketing.

187
Apart from the transnational approach, the study found that the reasons why
consumers buy organic wine for consumption varied, and can confound the actual premium
they are willing to pay in percentage terms. A multi-product/attribute approach with the
willingness to pay measured in percentage terms is recommended.
WTP a premium by consumers may not translate into profitability, which is the reason
why business operates. It is important to evaluate at what WTP point are organic wine
business likely to make profit.
188
References
Aadland, D & Caplan, AJ 2003, 'Willingness to Pay for Curbside Recycling with Detection
and Mitigation of Hypothetical Bias', American Journal of Agricultural Economics, vol. 85,
no. 2, pp. 492-502.
Aaker, J, Vohs, K & Mogilner, C 2010, 'Non-profits are seen as warm and for-profits as
competent: First stereotypes matter', Journal of Consumer Research, vol. 37, pp. 277-291.
ABS 2010, 'Australian Wine and Grape Industry',
http://www.abs.gov.au/ausstats/[email protected]/mf/1329.0, vol. Assessed on 5 June 2011.
Acock, AC 2012, A Gentle Introduction to Stata, Revised third 3rd
edition, Stata Press Texas.
Adamowicz, W & Louviere, J 1998, Introduction to Attribute-Based Stated Choice Methods,
National Oceanic and Atmospheric Administration, US Department of Commerce,
Edmonton, Alberta.
Adamsen, JM, Lyons, K & Winzar, H 2007, 'An agenda to construct an improved
understanding of Australian organic consumers', Proceedings from ANZMAC Conference:
3Rs - Reputation, Responsibility & Relevance Dunedin, New-Zealand 3-5 December.
Aertsens, J, Mondelaers, K, Verbeke, W, Buysse, J & Huylenbroeck, GV 2011, 'The
influence of subjective and objective knowledge on attitude, motivations and consumption of
organic food', British Food Journal, vol. 113, no. 11, pp. 1353-1378.
Agarwal, S & Teas, RK 2001, 'Perceived value: Mediating role of perceived risk', Journal of
Marketing Theory and Practice, vol. 9, no. 4, pp. 1-14.
Aguiree, N 2010, 'A Tip-a-Day by and for Evaluators'. http://aea365.org/blog/?p=76.
Assessed on 15 June 2011
Alba, JW & Hutchinson, JW 1987, 'Dimensions of Consumer Expertise', Journal of
Consumer Research, vol. 13, pp. 411-454.
Allio, AK 2005, 'A Short Practical Guide to Implementing Strategy', Journal of Business
Strategy, vol. 46, no. 4, pp. 12-21.
Andrews, JC, Durvasula, S & Akhter, SH 1990, 'A Framework for Conceptualizing and
Measuring the Involvement Construct in Advertising Research', Journal of Advertising, vol.
19, no. 4, pp. 27-40.
Arbuthnot, JJ, Slama, M & Sissler, G 1993, 'Selection criteria and information sources in the
purchase decisions of apparel buyers of small retailing firms', Journal of Small Business
Management, vol. 31, no. 2, pp. 12-23.

189
Arjun, C 1998, 'Product class effects on perceived risk: The role of emotion', International
Journal of Research in Marketing, vol. 15, no. 2, pp. 157-168.
Arts, JWC, Frambach, RT & Bijmolt, THA 2011, 'Generalizations on consumer innovation
adoption: A meta-analysis on drivers of intention and behavior', International Journal of
Research in Marketing, vol. 28, no. 2, pp. 134-144.
Barber, N 2008, 'How self-confidence and knowledge effects the sources of information
selected during purchase situations', Texas Tech University.
Barber, N, Taylor, C & Strick, S 2009, 'Wine consumers’ environmental knowledge and
attitudes: Influence on willingness to purchase', International Journal of Wine Research, vol.
1 pp. 59-72.
Barber, N, Taylor, D & Deale, C 2010, 'Wine packaging: marketing towards consumer
lifestyle to build brand equity and increase revenue', International Journal of Revenue
Management, vol. 4, no. 3, pp. 215-237.
Batte, MT, Hooker, NH, Haab, TC & Beaverson, J 2007, 'Putting their money where their
mouths are: consumer willingness to pay for multi-ingredient processed organic food
products', Food Policy, vol. 32, no. 2, pp. 145-159.
Bauer, RA 1960, 'Consumer Behaviour as Risk Taking in (Stone, R N and Gronhaug, K.,
1993). Perceived risk: Further Considerations for the Marketing Discipline', European
Journal of Marketing, vol. 27, no. 3, pp. 39-50.
Bazoche, P, Deola, C & Soler, L 2008, 'An experimental study of wine consumers’
willingness to pay for environmental characteristics', 12th Congress of the European
Association of Agriculture Economists Accessed on 13 July 2012,
Retrieved from http://www.legrenelle-environment.fr/grenelle-environment.
Bech-Larsen, T & Grunert, KG 2003, 'The perceived healthiness of functional foods: a
conjoint study of Danish, Finnish and American consumers’ perception of functional foods',
Appetite, vol. 40, pp. 9-14.
Beeston, J 1994, A Concise History of Australian Wine, Allen & Unwin, Sydney.
Ben-Akiva, M, Bradley, M, Morikawa, T, Benjamin, J, Novak, T, Oppewal, H & Rao, V
1994, 'Combining revealed and stated preference data', Marketing Letters, vol. 5, no. 4, pp.
335-350.
Benbrook, C, Zhao, X, Yáñez, J, Davies, D & Andrews, P 2008, 'New Evidence Confirms the
Nutritional Superiority of Plant-Based Organic Foods', State of Science Review, pp. The
Organic Center www.organic-center.org Accessed 24 December 2012.
190
Benjamin, BA & Podolny, JM 1999, 'Status, Quality, and Social Order in the California Wine
Industry', Administrative Science Quarterly, vol. 44, pp. 563-589.
Bentler, PM 1987, 'Practical Issues in Structural Modeling', Sociological Methods &
Research, vol. 16, pp. 78-117.
Betancourt, R & Gautschi, D 1990, 'Demand complementa rities, household production, and
retail assortments', Marketing Science, vol. 9, pp. 146-161.
Bettman, JR 1971, 'Methods for Analyzing Consumer Information Processing Models,
Proceedings, 2nd Annual Conference', Association for Consumer Research, pp. 197-207.
—— 1973, 'Perceived risk and its components: a model and empirical test', Journal of
Marketing Research, vol. 10, pp. 184-190.
Bezawada, R & Pauwels, K 2012, 'What is special about marketing organic products? How
organic assortment, price and promotions drive retailer performance', Journal of Marketing,
pp. 1-50.
BFA 2010, 'International acclaim for Australian organic and biodynamic wine helps defy
surplus crisis', Organic News http://www.bfa.com.au/Portals/0/BFAFiles/131-OA.htm
Accessed 20 March 2012.
—— 2012, 'Australian Organic Market Report', vol.
http://www.bfa.com.au/Portals/0/Organic%20market%20report%202012-web.pdf, Accessed
on 10 January 2013.
Bhaskaran, S, Polonsky, M, Cary, J & Fernandez, S 2006, 'Environmentally sustainable food
production and marketing', British Food Journal, vol. 108, no. 8, pp. 677-690.
Bhattacherjee, A 2012, Social Science Research: Principles, Methods, and Practices, Open
Access Textbooks. Book 3., http://scholarcommons.usf.edu/oa_textbooks/3, Accessed 14
March 2012.
Biénabe, E, Vermeulen, H & Bramley, C 2011, 'The food “quality turn” in South Africa: An
initial exploration of its implications for small-scale farmers' market access', Agrekon, vol.
50, no. 1, 2011/03/01, pp. 36-52.
Bloch, PH & Richins, ML 1983, 'A theoretical model for the study of product importance
perceptions', Journal of Marketing, vol. 47 pp. 69-81.
Boatto, V, Defrancesco, E & Trestini, S 2011, 'The price premium for wine quality signals:
does retailers' information provision matter?', British Food Journal, vol. 113, no. 5, pp. 669 -
679.

191
Boccaletti, S & Nardella, M 2000, 'Consumer willingness to pay for pesticide-free fresh fruit
and vegetables in Italy', International Food and Agribusiness Management Review, vol. 3,
pp. 297-310.
Boholm, A 1998, 'Comparative studies of risk perception: A review of twenty years of
research', Journal of Risk Research, vol. 1, no. 2, pp. 135-163.
Bootzin, RR, Loftus, EF & Zajonc, RB 1983, Psychology Today. An Introduction, Random
House, New York.
Borooah, VK 2002, Logit and Probit: Ordered and Multinomial Models, Thousand Oaks,
Sage Publications Inc, California.
Botonaki, A, Polymeros, K, Tsakiridou, E & Mattas, K 2006, 'The role of food quality
certification on consumers’ food choices adequate marketing strategy for the effective
promotion of certified food products', British Food Journal, vol. 108, no. 2, pp. 77-90.
Bouder, F, Slavin, D & Löfstedt, RE 2007, The Tolerability of Risk: A New Framework for
Risk Management, ed. First, Earthscan, London, NW1 0JH, UK.
Bowman, C & Ambrosini, V 2000, 'Value creation versus value capture: Towards a coherent
definition of value in strategy', British Journal of Management, vol. 11, pp. 1-15.
Broussard, SC & Garrison, MEB 2004, 'The relationship between classroom motivation and
academic achievement in elementary school-aged children', Family and Consumer Sciences
Research Journal, vol. 33, no. 2, pp. 106-120.
Brugarolas, M, Martinez-Carrasco, L, Martinez, Poveda, A & Rico, M 2005, 'Determination
of the surplus that consumers are willing to pay for an organic wine', Spanish Journal of
Agricultural Research, vol. 3, no. 1, pp. 43-51.
Bruwer, J 2002, 'Marketing wine to Generation-X consumers through the tasting room', The
Australian & New Zealand Grapegrower & Winemaker, no. 467, pp. 67-70.
Bruwer, J & Li, E 2007, 'Wine-Related Lifestyle (WRL) Market Segmentation: Demographic
and Behavioural Factors', Journal of Wine Research, vol. 18, no. 1, pp. 19-34.
Bruwer, J, Li, E & Reid, M 2001, 'Wine-related lifestyle segmentation of the Australian
domestic wine market', The Australian and New Zealand Wine Industry Journal, vol. Vol 16,
no. 2, pp. 104-108.
Bruwer, J & Nam, KH 2010, 'The BYOB of wine phenomenon of consumers in the
Australian licensed on-premise food service sector', International Journal of Hospitality
Management, vol. 29, pp. 83-91.
192
Campiche, J, Holcomb, RB & Ward, CE 2004, Impacts of Consumer Characteristics and
Perceptions on Willingness to Pay for Natural Beef in the Southern Plains, Food Technology
Research Report Oklahoma Food and Agricultural Products Research and Technology
Center, Oklahoma State University. www.fapc.okstate.edu.
Castaños, H & Lomnitz, C 2009, 'Ortwin Renn, Risk Governance: Coping with Uncertainty
in a Complex World', Natural Hazards, vol. 48, no. 2, pp. 313-314.
CBN 2012, Designing a questionnaire, Government Services for Entrepreneurs.
http://www.canadabusiness.ca/eng/page/2687/ Accessed 1 September 2012
Celsi, RL & Olson, JC 1988, 'The role of involvement in attention and comprehension
processes', Journal of Consumer Research, vol. Vol 15, pp. Pp 210-224.
Chaney, IM 2000, 'External search effort for wine', International Journal of Wine Marketing,
vol. 12, no. 2, pp. 5-21.
Chang, JB, Lusk, JL & Norwood, FB 2009, 'How Closely Do Hypothetical Surveys and
Laboratory Experiments Predict Field Behavior?', American Journal of Agricultural
Economics, vol. 91, no. 2, May 1, 2009, pp. 518-534.
Charters, S & Pettigrew, S 2006, 'Wines; Quality; Quality Concepts; Consumer behaviour;
Australia', An International Qualitative Market Research, vol. 9, no. 2, pp. 181-193.
Childs, D 2006, 'Are Organic Foods Better for You?', vol. ABC Medical News
http://recipes.howstuffworks.com/organic-certification3.htm Accessed 2 November 2012.
Chinnici, G, D'Amico, M & Pecorino, B 2002, 'A multi-variate statistical analysis on the
consumers of organic products', British Food Journal,, vol. 104, no. 3/4/5, pp. 187-199.
Choo, CW 1996, 'The knowing organization: how organizations use information to construct
meaning, create knowledge and make decision', International Journal of Information
Management, vol. 16, no. 5, pp. 23-40.
Chryssohoidis, G & Krystallis, A 2005, 'Organic consumers’ personal values research:
Testing and validating the list of values (LOV) scale and implementing a value-based
segmentation task', Food Quality and Preference, vol. 16, no. 7, pp. 585-599.
Cohen, J, Cohen, P, West, SG & Aiken, LS 2003, Applied multiple regression/correlation
analysis for the behavioural sciences, 3rd edition, Mahwah, NJ Erlbaum.
Cohen, JB & Chakravarti, D 1990, 'Consumer psychology', Annual Review of Psychology,
vol. 41, p. 243-288.
193
Conchar, MP, Zinkhan, GM, Peters, C & Olavarrieta, S 2004, 'An integrated framework for
the conceptualization of consumers' perceived-risk processing', Journal of the Academy of
Marketing Science, vol. 32, pp. 418-436.
Cooper, DR & Schindler, PS 2006, Business Research Methods, 9th
edition, McGraw-Hill,
New York.
Cox, DF 1967b, Risk taking and information handling in consumer behavior. Boston,
University Press, Howard.
Cox, DF & Rich, S 1964, 'Perceived Risk and Consumer Decision Making - The Case of
Telephone Shopping', Journal of Marketing Research, pp. Pp 32-39.
Crescimanno, M, Ficani, GB & Guccion, G 2002, 'The production and marketing of organic
wine in Sicily', British Food Journal, vol. 104, no. 3/4/5, pp. 274-286.
Crisp, P, Wicks, T, Bruer, D & Scott, E 2006, 'An evaluation of biological and abiotic
controls for grapevine powdery mildew 2 Vineyard trials', Australian Journal of Grape and
Wine Research, vol. 12, pp. 203-211.
Csikszentmihalyi, M 1997, Finding Flow: The Psychology of Engagement with Everyday
Life, ed. B Books, New York.
Cummings, RG & Taylor, O 1999, 'Unbiased Value Estimates for Environmental Goods: A
Cheap Talk Design for the Contingent Valuation Method', The American Economic Review,
vol. 89, no. 3, pp. 649-665.
Cunningham, SM 1967, 'The major dimensions of perceived risk', in Cox, D.F. (Ed.), Risk
Taking and Information Handling in Consumer Behaviour, Graduate School of Business
Administration, Harvard University Press, Boston MA.
DAFF 2004, The Australian Organic Industry: A Summary, Commonwealth of Australia.
http://www.daff.gov.au/foodinfo Accessed 15 November 2012, Canberra.
—— 2012, Wine Policy, Commonwealth Government http://www.daff.gov.au/agriculture-
food/wine-policy Accessed 13 November 2012, Canberra ACT.
David, B & Resnik, JD 2011, 'What is Ethics in Research and Why is it Important?' National
Institutes of Health, US Department of Health and Human Services
http://www.niehs.nih.gov/research/resources/bioethics/whatis/ Accessed 13 May 2012
Davies, A, Titterington, AJ & Cochrane, C 1995, 'Who buys organic food? A profile of the
purchasers of organic food in Northern Ireland', British Food Journal, vol. 97, no. 10, pp. 17-
23.
Dawson, C 2002, Practical Research Methods, UBS Publishers’ Distributors, New Delhi.

194
de Ponti, T, Rijk, B & van Ittersum, MK 2012, 'The crop yield gap between organic and
conventional agriculture', Agricultural Systems, vol. 108, no. 0, pp. 1-9.
Delmas, A & Grant, LE 2008, Eco-Labeling Strategies: The Eco-Premium Puzzle in the Wine
Industry, ISBER Publications, Santa Barbara,
<http://www.escholarship.org/uc/item/4qv7c61b>.
Denver, S, Christensen, T & Krarup, S 2007, 'How vulnerable is organic consumption to
information?', paper presented at Nordic Consumer Policy Research Conference, Helsinki.
Dodd, T, Laverie, D, Wilcox, J & Duhan, D 2005, 'Differential effects of experience,
subjective knowledge, and objective knowledge on sources of information used in consumer
wine purchasing', Journal of Hospitality and Tourism Research, vol. 29, pp. 3-19.
Dodd, TH, Kolyesnikova, N & Wilcox, JB 2010, 'A matter of taste: Consumer preferences of
sweet and dry wines', paper presented at 5th International Academy of Wine Business
Research Conference, 8-10 Feb. 2010 Auckland (NZ).
Dodds, WB, Monroe, KB & Grewal, D 1991, 'Effects of Price, Brand, and Store Information
on Buyers' Product Evaluations', Journal of Marketing Research, vol. 28, pp. 307-319.
Dougherty, PH 2012, The Geography of Wine, Springer, New York.
Douglas, SP & Craig, CS 2011, 'The role of context in assessing international marketing
opportunities', International Marketing Review, vol. 28, no. 2, pp. 150 - 162.
Drottz-Sjöberg, BM 1991, 'Risk: How you see it, react and communicate', European
Management Journal, vol. 9, pp. 88-97.
Dunn, RG 2008, Identifying Consumption Subjects and Objects in Consumer Society, Temple
University Press, Philadelphia.
Ehrenberg, ASC, Uncles, MD & Goodhardt, GJ 2004, 'Understanding brand performance
measures: using Dirichlet benchmarks', Journal of Business Research, vol. 57, no. 12, pp.
1307-1325.
Endres, AB 2007, 'An Awkward Adolescence in the Organics Industry: Coming to Terms
with Big Organic and Other Legal Challenges for the Industry's Next Ten Years', Drake
Journal of Agricultural Law, vol. 12, pp. 17-59.
Englis, BG & Solomon, MR 1995, 'To be and not to be: Lifestyle imagery, reference groups,
and the clustering of America', Journal of Advertising, vol. 24, pp. 13-28.
Espejel, J, Fandos, C & Flavian, C 2009, 'The influence of consumer involvement on quality
signals perception, An empirical investigation in the food sector', British Food Journal vol.
111, no. 11, pp. 1212-1236.

195
Evans, JR & Mathur, A 2005, 'The value of online surveys', Internet Research, vol. 15, no. 2,
pp. 195 - 219.
Falguera, V, Aliguer, N & Falguera, M 2012, 'An integrated approach to current trends in
food consumption: Moving toward functional and organic products?', Food Control, vol. 26,
no. 2, pp. 274-281.
Famularo, B, Bruwer, J & Li, E 2010, 'Region of origin as choice factor: wine knowledge and
wine tourism involvement influence', International Journal of Wine Business Research, vol.
22, no. 4, pp. 362-385.
Farrell, D & Petersen, JC 2010, 'The Growth of Internet Research Methods and the Reluctant
Sociologist', Sociological Inquiry, vol. 40, no. 1, pp. 114-125.
Fields, D & Gillespie, J 2008, 'Beef Producer Preferences and Purchase Decisions for
Livestock Price Insurance', Journal of Agricultural and Applied Economics, vol. 40, no. 3,
pp. 789-803.
Fishbein, M 1967, A Behaviour Theory Approach to the Relations Between Beliefs about an
Object and the Attitude Toward the Object. In M. Fishbein (Ed.), Readings in Attitude Theory
and Measurement, John Wiley, New York.
Fishbein, M & Ajzen, I 1975, Belief, Attitude, Intention and Behavior: An Introduction to
Theory and Research Reading, Addison-Wesley, Massachusetts.
Fishbein, M & Ajzen, I 1980, Understanding Attitudes and Predicting Social Behaviour,
Prentice Hall, Englewood Cliffs New Jersey.
Flynn, L & Pearcy, D 2001, 'Four Subtle Sins in Scale Development: Some Suggestions for
Strengthening the Current Paradigm', International Journal of Market Research, vol. 43, no.
4, pp. 409-433.
Forbes, SL, Cohen, DA, Cullen, R, Wratten, SD & Fountain, J 2009, 'Consumer attitudes
regarding environmentally sustainable wine: an exploratory study of the New Zealand
marketplace', Journal of Cleaner Production, vol. 17, no. 13, pp. 1195-1199.
Fotopoulos, C & Krystallis, A 2002, 'Purchasing motives and profile of the Greek organic
consumer: a countrywide survey', British Food Journal, vol. 104, no. 9, pp. 730 - 765.
Fotopoulos, C, Krystallis, A & Ness, M 2003, 'Wine produced by organic grapes in Greece:
using means-end chains analysis to reveal organic buyers purchasing motives in comparison
to the non-buyers', Food Quality and Preference, vol. 14, no. 7, pp. 549-566.
Freitas, A, Kaiser, S, Chandler, J, Hall, C, Jung-Won, K & Hammidi, T 1997, 'Appearance
management as border construction: Least favourite clothing, group distancing, and identity .
. . not!', Sociological Inquiry, vol. 67, pp. 323-335.

196
FSANZ 2005, Benzoates, sulphites and sorbates in the food supply, Food Standards Australia
New Zealand Canberra.
—— 2010, 'Food Standards Australia New Zealand', http://www.foodstandards.gov.au
Accessed 22 September 2012.
Gagliano, KB & Hathcote, J 1994, 'Customer Expectations and Perceptions of Service
Quality in Retail Apparel Specialty Stores', Journal of Services Marketing, vol. 8, no. 1, pp.
60-69.
Gardner, DM 1970, 'An Experimental Investigation of Price/Quality Relationship', Journal of
Retailing, vol. 46, pp. 25-41.
Geier, B 2006, 'Organic grapes - More than Wine and Statistics’ In: Willer, Helga and
Yussefi, Minou (Eds.) The World of Organic Agriculture, International Federation of Organic
Agriculture Movements (IFOAM), Bonn, Germany, chapter 7.4, pp. 62-65
http://orgprints.org/4858/1/geier-2006-wine.pdf'.
Gil, JM, Gracia, A & Sanchez, M 2000, 'Market segmentation and willingness to pay for
organic products in Spain', International Food and Agribusiness Management Review, vol. 3,
pp. 207-226.
Gligorijevic, B & Leong, B 2011, 'Trust, Reputation and the Small Firm: Building Online
Brand Reputation for SMEs', Proceedings of the Fifth International Conference on Weblogs
and Social Media, Barcelona, Catalonia, Spain.
Gluckman, RL 1990, 'A consumer approach to branded wines', International Journal of Wine
Marketing, vol. 2, no. 1, pp. 27-46.
Gmel, G 2001, 'Imputation of missing values in the case of a multiple item instrument
measuring alcohol consumption', Statistics in Medicine, vol. 20, no. 15, pp. 2369-2381.
Gotschi, E, Vogel, S & Lindenthal, T 2007, 'High school students’ attitudes and behaviour
towards organic products: survey results from Vienna', Institute for Sustainable Economic
Development, University of Natural Resources and Applied Life Sciences, Vienna.
Govindasamy, R & Italia, J 1999, 'Predicting Willingness-To-Pay A Premium For
Organically Grown Fresh Produce', Journal of Food Distribution Research, vol. 30, no. 2, pp.
44-53.
Green, PE & Srinivasan, V 1990, 'Conjoint Analysis in Marketing: New Developments With
Implications for Research and Practice', Journal of Marketing, vol. 54, no. 4, pp. 3-19.
Greene, WH 2002, Econometric Analysis, 5th
edition, Prentice HallI, Upper Saddle River,
New Jersey.

197
Grewal, G, Gotlieb, J & Marmorstein, H 1994, 'The Moderating Effects of Message Framing
and Source Credibility on the Price-perceived Risk Relationship', Journal of Consumer
Research, vol. 21, pp. 145-153.
Gribben, C & Gitsham, M 2007, 'Food labelling: understanding consumer attitudes and
behaviour, Berkhamsted: Ashridge Report'.
Grunert, SC & Juhl, HJ 1995, 'Values, environmental attitudes, and buying of organic foods',
Journal of Economic Psychology, vol. 16, no. 1, pp. 39-62.
Guay, F, Chanal, J, Ratelle, CF, Marsh, HW, Larose, S & Boivin, M 2010, 'Intrinsic,
identified, and controlled types of motivation for school subjects in young elementary school
children', British Journal of Educational Psychology, vol. 80, no. 4, pp. 711-735.
Gutman, J 1982, 'A means-end chain model based on consumer categorization processes', The
Journal of Marketing, pp. 60-72.
Haesman, M & Mellentin, J 2001, The Functional Foods Revolution: Healthy People,
Healthy Profits, Earthscan Publications Ltd, London and Sterling, VA.
Hair, JF, Black, WC, Babin, BJ & Anderson, RE 2010, Multivariate Data Analysis, 7th
edition, Pearson Prentice Hall, New Jersey.
Hair, JF, Black, WC, Babin, BJ, Anderson, RE & Tatham, RL 2006, Multivariate data
analysis, 6th
edition, Prentice Hall, New Jersey.
Hall, J, Lockshin, LS & O’Mahony, GB 2001, 'Exploring the links between wine choice and
dining occasions: factors of influence', International Journal of Wine Marketing Science, vol.
13, no. 1, pp. 36-53.
Hamzaoui-Essoussi, L & Zahaf, M 2012, 'Canadian Organic Food Consumers' Profile and
Their Willingness to Pay Premium Prices', Journal of International Food & Agribusiness
Marketing, vol. 24, no. 1, 2012/01/01, pp. 1-21.
Harrison, GW, Blackburn, M & Rutström, EE 1994, 'Statistical Bias Functions and
Informative Hypothetical Surveys', American Journal of Agricultural Economics, vol. 76, no.
5, pp. 1084-1088.
Harrison, RW & Mclennon, E 2004, 'Analysis of Consumer Preferences for Biotech Labeling
Formats', Journal of Agricultural and Applied Economics, vol. 36, no. 1, pp. 159-171.
Havitz, ME & Mannell, RC 2005, 'Enduring involvement, situational involvement and flow
in leisure and non-leisure activities', Journal of Leisure Research, vol. 37, pp. 152-177.
Hawkins, I, Del, RJ & Best, KAC 2003, Consumer Behaviour - Building Marketing Strategy,
9th
edition, Tata McGraw Hill, New Delhi.

198
Hayes-Roth, F, Waterman, DA & Lenat, DB 1983, 'Building Expert Systems', Addison-
Wesley, London, United Kingdom.
Heath, TB, Ryu, G, Chetterjee, S, McCarthy, MS, Mothersbaugh, DL, Milberg, SJ & Gaeth,
GJ 2000, 'Asymmetric competition and the leveraging of competitive disadvantages', Journal
of Consumer Research, vol. 27, no. 3, pp. 291-308.
Herberg, LA 2007, Organic Certification Systems and Farmers’ Livelihoods in New Zealand,
Lincoln University New Zealand, Agribusiness and Economics Research Unit.
Hershey, DA & Walsh, DA 2001, 'Knowledge versus Experience in Financial Problem
Solving Performance', Current Psychology, vol. 19, no. 4, pp. 261-292.
Hofacker, C, Gleim, M & Lawson, S 2009, 'Revealed reader preference for marketing
journals', Journal of the Academy of Marketing Science, vol. 37, no. 2, pp. 238-247.
Hoffman, E, Menkhaus, DJ, Chakravarti, D, Fields, RA & Whipple, GD 1993, 'Using
Laboratory Experimental Auctions in Marketing Research: A Case Study of New Packaging
for Fresh Beef', Marketing Science, vol. 12, pp. 318-338.
Hollingsworth, P 2001, 'Margarine: The Over-the-Top Functional Food', Food Technology,
vol. 55, no. 1, pp. 59-62.
Honkanen, P, Verplanken, B & Olsen, SO 2006, 'Ethical values and motives driving organic
food choice', Journal of Consumer Behaviour, vol. 5, no. 5, pp. 420-431.
House, L, Lusk, J, Jaeger, S, Traill, WB, Moore, M, Valli, C, Morrow, B & Yee, WMS 2004,
'Objective and Subjective Knowledge: Impacts on Consumer Demand for genetically
Modified Foods in the United States and the European Union', AgBioForum, vol. 7, no. 3, pp.
113-123.
Hsieh, MF & Stiegert, KW 2012, 'The Consumption Choice of Organics: Store Formats,
Prices, and Quality Perception – A Case of Dairy Products in the United States',
intechweb.org [PDF] Accessed on 2 January 2013, pp. 1-18.
Hsu, T, Chiu, YH & Lee, Y 2012, 'An Empirical Study of Store Environmental Influence on
Consumer Multi-Perceived Values toward Patronage Intentions', Europeam Retail Research,
vol. 26, no. 11, pp. 19-44.
Hu, HH & Self, J 2010, 'The dynamics of green restaurant patronage', Cornell Hospitality
Quarterly Journal of Economics, vol. 51, no. 3, pp. 344-362.
Hughner, RS, McDonagh, P, Prothero, A, Shultz, CJ & Stanton, J 2007, 'Who are organic
food consumers? A compilation and review of why people purchase organic food', Journal of
Consumer Behaviour, vol. 6, no. 2-3, pp. 94-110.

199
Hultén, B 2012, 'Sensory Cues and Shoppers' touching Behaviour: The Case of IKEA',
International Journal of Retail & Distribution Management, vol. 40, no. 4, pp. 273 - 289.
IFOAM 2003, 'Organic Agriculture Worldwide', IFOAM Directory of Member Organisations
and Associates 2004, IFOAM, Germany.
Jansson-Boyd, CV 2010, 'Consumer Psychology', 1st edn, Open University Press McGraw-
Hill House, Berkshire England.
Joag, SG, Mowen, JC & Gentry, JW 1990, 'Risk perception in a simulated industrial
purchasing task: the effects of single versus multiplay decisions', Journal of Behavioural
Decision Making, vol. 3, pp. 91-108.
Johnson, R 2011, 'Retail Isn't Broken Stores Are', Harvard Business Review.
Johnson, T & Bruwer, J 2004, 'Generic Consumer Risk-Reduction Strategies (RRS) in Wine-
Related Lifestyle Segments of the Australian Wine Market', International Journal of Wine
Marketing, vol. 16, no. 1, pp. 5-35.
Joinson, AN 2001, 'Self-disclosure in computer-mediated communication: The role of self-
awareness and visual anonymity', European Journal of Social Psychology, vol. 31, no. 1, pp.
177-192.
Jolly, DA 1991, 'Determinants of organic horticultural products consumption based on a
sample of California consumers', Acta Horticulture, vol. 295, pp. 141-148.
Jong, H, Geiselmann, J, Hernandez, C & Page, M 2003, 'Genetic Network Analyzer:
Qualitative simulation of genetic regulatory networks', Bioinformatics, vol. 19, no. 3, pp.
336–344.
Jonis, M, Aninat, JB, Hofmann, U, Stolz, H, Schmid, O & Trioli, G 2007, Organic viticulture
and wine processing: Analysis of market needs – preliminary report, Institut Technique de
l'Agriculture Biologique, France.
Jonis, M, Soltz, H, Schmid, O, Hofmann, U & Trioli, G 2008, 'Analysis of organic wine
market needs', paper presented at 16th IFOAM Organic World Congress, June 16-20, 2008,
Modena, Italy http://orgprints.org/view/projects/conference.html Accessed on 1 November
2012.
Kaffka, S, Bryant, D & Denison, F 2005, 'Comparisons of organic and conventional maize
and tomato cropping systems from a long-term experiment in California', First Scientific
Conference of the International Soceity for Organic Agriculture Research, p. 660.
Kagel, JH 1995, 'Auctions: A survey of experimental research' In: Kagel, J.H. and Roth, A.E.
(eds.), The handbook of experimental economics, Princeton University Press, pp. 501-585.

200
Kagel, JH, Harstad, RM & Levin, D 1987, 'Information Impact and Allocation Rules in
Auctions with Affiliated Private Values: A Laboratory Study', Econometrica, vol. 55, no. 6,
pp. 1275-1304.
Kalish, S & Nelson, P 1991, 'A comparison of Ranking, Rating and Reservation Price
Measurement in Conjoint Analysis ', Marketing Letters, vol. 2, no. 4, pp. 327-335.
Kandeepan, V 2008, 'Consumer Willingness to pay for Organic Brenjal (Eggplant) in Jaffna
district, Sri Lanka', Natural Resource and Environmental Management, University of Hawai
Kang, KH, Stein, L, Heo, CY & Lee, S 2012, 'Consumers’ willingness to pay for green
initiatives of the hotel industry', International Journal of Hospitality Management, vol. 31,
no. 2, pp. 564-572.
Kerstetter, D & Cho, MH 2004, 'Prior knowledge, credibility and information search', Annals
of Tourism Research, vol. 31, no. 4, pp. 961-985.
Kiesel, K & Villas-Boas, SB 2007, 'Got Organic Milk? Consumer Valuations of Milk Labels
after the Implementation of the USDA Organic Seal', Journal of Agricultural and Food
Industrial Organization, vol. 5, no. 1, pp.1-37.
Kim, YG, Suh, BW & Eves, A 2010, 'The relationships between food-related personality
traits, satisfaction, and loyalty among visitors attending food events and festivals',
International Journal of Hospitality Management, vol. 29, no. 2, pp. 216-226.
King, ES, Kievit, RL, Curtin, C, Swiegers, JH, Pretorius, IS, Bastian, SEP & Leigh FI 2010,
'The effect of multiple yeasts co-inoculations on Sauvignon Blanc wine aroma composition,
sensory properties and consumer preference', Food Chemistry, vol. 122, no. 3, pp. 618-626.
Kleine, SS, Iii, REK & Allen, CT 1995, 'How is a Possession "Me" or "Not Me"?
Characterizing Types and an Antecedent of Material Possession Attachment', Journal of
Consumer Research, vol. 22, no. 3, pp. 327-343.
Koewn, C & Casey, M 1995, 'Purchasing Behaviour in the Northern Ireland Wine Market',
British Food Journal, vol. 97, no. 1, pp. 17-20.
Kothari, CR 1985, Research Methodology-Methods and Techniques, Wiley Eastern Limited,
New Delhi.
Kotler, P & Armstrong, G 2010, Principles of Marketing, 13th edition, Prentice Hall.
Kozinets, RV, Sherry, JF, DeBerry-Spence, B, Dushachek, A, Nuttavuthisit, K & Storm, D
2002, 'Themed flagship brand stores in the new millennium: theory, practice, and prospects',
Journal of Retailing, vol. 78, no. 1, pp. 17-29.

201
Krystallis, A, Fotopoulos, C & Zotos, Y 2006, 'Organic Products Consumers’ Profile and
Their Willingness To Pay (WTP) for Selected Organic Food Products in Greece', Journal of
International Consumer Marketing, vol. 19, no. 1, pp. 81-106.
Kumar, R 2005, Research Methodology -A Step-by-Step Guide forBeginners, 2nd
edition,
Pearson Education, Singapore.
Lambert-Pandraud, R & Laurent, G 2007, 'Tell me which perfume you wear, I’ll tell how old
you are: Modeling the impact of consumer age on product choice'. Working paper, HEC
Paris.
Lambert-Pandraud, R, Laurent, G & Lapersonne, E 2005, 'Repeat purchasing of new
automobiles by older consumers; Empirical evidence and interpretations', Journal of
Marketing, vol. 69, pp. 97-113.
Lancaster, G & Massingham, L 2011, Essentials of Marketing Management, 1st edition,
Routledge, New York.
Lancaster, KJ 1966, ‘A New Approach to Consumer Theory’, Journal of Political Economy,
vol. 74, pp. 132-157.
Langer, EJ 1983, The Psychology of Control, Sage Publications, London.
Lantz, S 2008, 'Chemical Free Kids', Joshua Books.
Laroche, M, Saad, G, Cleveland, M & Browne, E 2000, 'Gender differences in information
search strategies for a Christmas gift', Journal of Consumer Marketing, vol. 17, no. 6, pp.
500-524.
Lee, BK & Lee, WN 2011, 'The impact of product knowledge on consumer product memory
and evaluation in the competitive ad context: The item-specific-relational perspective',
Psychology and Marketing, vol. 28, no. 4, pp. 360-387.
Li, JJ & Su, S 2006, 'How face influences consumption: A comparative study of American
and Chinese consumers', International Journal of Market Research, vol. 49, pp. 237-256.
Lockie, S, Iyons, K, Lawrence, G & Halpin., D 2006, Going organic : Mobilizing networks
for environmentally responsible food production, ed. S Lockie, CABI, Oxfordshire .
Lockshin, L 2009, 'Consumer purchasing behaviour for wine: What we know and where we
are going', vol. www.academyofwinebusiness.com/wp-content/uploads/2010/05/File-030.pdf
Accessed on 15 August 2010.
Lockshin, L & Kahrimanis, P 1998, 'Consumer Evaluation of Retail Wine Store', Journal of
Wine Research, vol. 9, no. 3, pp. 173-184.

202
Lockshin, L & Spawton, T 2001, 'Using Involvement and Brand Equity to Develop a Wine
Tourism Strategy', International Journal of Wine Marketing, vol. 13, no. 1, pp. 72-81.
Long, JS 1997, Regression Models for Categorical and Limited Dependent Variables, Sage
Publications, Inc, London, United Kingdom.
Loudon, DL & Della, BAJ 1993, Consumer behaviour : concepts and applications, 4th
edition, McGraw-Hill, New York.
Loureiro, ML 2003, 'Rethinking new wines: implications of local and environmentally
friendly labels', Food Policy, vol. 28, pp. 547-560.
Lusk, JL 2003, 'Effects of Cheap Talk on Consumer Willingness-to-Pay for Golden Rice',
American Journal of Agricultural Economics, vol. 85, no. 4, November 1, 2003, pp. 840-856.
Lusk, JL, Fox, JA, Schroeder, TC, Mintert, J & Koohmarraie, M 2001, 'In-store valuation of
Steak Tenderness', American Journal of Agricultural Economics, vol. 83, no. 3, pp. 539-550.
Lusk, JL & Hudson, D 2004, 'Willingness-to-Pay Estimates and Their Relevance to
Agribusiness Decision Making', Applied Economic Perspectives and Policy, vol. 26, no. 2,
June 20, 2004, pp. 152-169.
Lutz, RJ 1991, The Role of Attitude Theory in Marketing, Perspectives in Consumer
Behaviour, 4th
edition, Prentice-Hall, Englewood Cliffs, New Jersey.
Madhok, A 2002, 'Reassessing the fundamentals and beyond: Ronald Coase, the transaction
cost and resource-based theories of the firm and the institutional structure of production',
Strategic Management Journal, vol. 23, pp. 535-550.
Magnusson, M, Arvola, A, Hursti, U, Aberg, L & Sjoden, P 2001, 'Attitudes towards organic
foods among Swedish consumers', British Food Journal, vol. 103, no. 3, pp. 209-226.
Magnusson, M, Avrola, A, K, H-KU, Aberg, L & Sjoden, PO 2003, 'Choice of organic foods
is related to perceived consequences for human health and to environmentally friendly
behaviour', Appetite, vol. 40, pp. 109-117.
Mahieu, P-A, Riera, P & Giergiczny, M 2012, 'The influence of cheap talk on willingness-to-
pay ranges: some empirical evidence from a contingent valuation study', Journal of
Environmental Planning and Management, pp. 1-11.
Mann, S, Ferjani, A & Reissig, L 2012, 'What matters to consumers of organic wine?', British
Food Journal, vol. 114, no. 2, pp. 272 - 284.
Maslow, A 1954, Motivation and personality, Harper, New York.

203
Maynard, LJ & Franklin, ST 2003, 'Functional Foods as a Value-Added Strategy: The
Commercial Potential of “Cancer-Fighting” Dairy Products', Review of Agricultural
Economics, vol. 25, no. 2, September 21, 2003, pp. 316-331.
McCarthy, EJ, Perreault JR, WD, Quester, PG, Wilkinson, JW & Lee, KY 1994, Basic
Marketing, A Managerial Approach, First Australian edition, Richard D Irwin Inc.
McCarthy, M & Henson, S 2005, 'Perceived risk and risk reduction strategies in the choice of
beef by Irish consumers', Food Quality and Preference, vol. 16, pp. 435-445.
McEachern, MG & McClean, P 2002, 'Organic purchasing motivations and attitudes: are they
ethical?', International Journal of Consumer Studies, vol. 26, no. 2, pp. 85-92.
McEachern, MG & Willock, J 2004, 'Producers and consumers of organic meat: A focus on
attitudes and motivations', British Food Journal, vol. 106, no. 7, pp. 534-552.
McFadden, D 1974, ‘Conditional logit Analysis of Qualitative Choice Behaviour,’ in P.
Zarembka (ed.) Frontiers in Econometrics, New York: Academic Press, 105–142.
Michaud, C & Llerena, D 2011, 'Green consumer behaviour: an experimental analysis of
willingness to pay for remanufactured products', Business Strategy and the Environment, vol.
20, no. 6, pp. 408-420.
Millock, K, Wier, M & Andersen, LM 2004, 'Consumer Values and Willingness to Pay for
Organic Foods', paper presented at 13th
Annual EAERE Conference, Budapest.
Mitchell, VW 1999, 'Consumer perceived risk: conceptualisations and models', European
Journal of Marketing,, vol. 33, no. 1/2, pp. 163-195.
Mitchell, VW & Greatorex, M 1988, 'Consumer Risk Perception in the UK Wine Market',
European Journal of Marketing, vol. 22, no. 9, pp. 5-15.
—— 1989, 'Risk reducing strategies used in the purchase of wine in the UK', European
Journal of Marketing, vol. 23, no. 9, pp. 31-46.
Mondelaers, K, Verbeke, W & Van Huylenbroeck, GV 2009, 'Importance of health and
environment as quality traits in the buying decision of organic products', British Food
Journal, vol. 111, no. 10, pp. 1120-1139.
Mueller, S & Remaud, H 2010, 'Are Australian wine consumers becoming more
environmentally conscious? Robustness of latent preference segments over time', a paper
presentated at 5th International Conference of the Academy of Wine Business Research,
Auckland, NewZealand, February 2010.

204
Mueller, S, Sirieix, L & Remaud, H 2011, 'Are personal values related to sustainable attribute
choice?', paper presented at 6th
AWBR International Conference, Bordeaux Management
School, France, 9-10 June 2011.
Mueller, S, Francis, L & Lockshin, L 2008, ‘The relationship between wine liking, subjective
and objective wine knowledge: Does it matter who is in your ‘consumer’ sample?’, paper
presented at 4th International Conference of the Academy of Wine Business Research, Siena
17-19th July 2008.
Mueller, S & Umberger, W 2009, 'Myth Busting: Who is the Australian cask wine
consumer?', The Australian and New Zealand Wine Industry Journal, vol. 24, no. 1, pp. 52-
58.
—— 2010, 'Are Consumers Indeed Misled? Congruency in Consumers' Attitudes towards
Wine Labeling Information versus Revealed Preferences from a Choice Experiment', paper
presented at Agricultural & Applied Economics Association, AAEA,CAES, & WAEA Joint
Annual Meeting, Denver, Colorado, Accessed on 5 December 2012.
Munene, CN 2006, 'Analysis of Consumer Attitude and their Willingness to Pay for
Functional Foods', Department of Agricultural Economics and Agribusiness, MSc thesis,
Louisiana State University and Agricultural and Mechanical College.
Murphy, JJ, Stevens, TH & Weatherhead, D 2005, 'Cheap Talk Effective at Eliminating
Hypothetical Bias in a Provision Point Mechanism', Environmental and Resource Economics,
vol. 30, no. 3, pp. 327-343.
Myers, JR & Sar, S 2011, 'Persuasive social approval cues in print advertising: Exploring
visual and textual strategies and consumer self-monitoring', Journal of Marketing
Communications, pp. 1-14.
Naspetti, S & Zanoli, R 2009, 'Organic Food Quality and Safety Perception Throughout
Europe', Journal of Food Products Marketing, vol. 15, no. 3, pp. 249-266.
Nelson, P 1974, 'Advertising as information', Journal of Political Economy, vol. 82, no. 4, pp.
729-754.
Nena, L 2003, 'Consumers’ perceived risk: sources versus consequences', Electronic
Commerce Research and Applications, vol. 2, no. 3, pp. 216-228.
Nielsen 2012, Australian Online Report 2011-12, The Nielsen Company Media Release
Accessed on 3 July 2012.
Nisbet, MC & Kotcher, JE 2009, 'A Two-Step Flow of Influence? Opinion-Leader
Campaigns on Climate Change', Science Communication, vol. 30, no. 3, pp. 328-354.

205
NOAA 1993, Report of the NOAA Panel on Contingent Valuation, National Ocean and
Atmospheric Association www.darrp.noaa.gov/library/pdf/cvblue.pdf.
Novack, J 2010, 'Internal influences - lifestyle and attitude.',
http://www.marketingteacher.com/lesson-store/lesson-internal-influences-lifestyle-
attitude.html Accessec on 25 October 2010.
Nunnally, JC 1979, Psychometric Theory, 2nd
edition, McGraw-Hill, New York.
Oberholtzer, L, Dimitri, C & Greene, C 2005, 'Price premiums hold on as organic produce
market expands. Outlook Report VGS-308-01', USDA Economic Research Service, p.22.
O’Cass, A 2000, 'An Assessment of Consumers Product, Purchase decision, Advertising and
Consumption in Fashion Clothing', Journal of Psychology, vol. 21, pp. 545-576.
Oczkowski, E 1994, 'A hedonic price function for Australian premium table wine', Australian
Journal of Agricultural Economics, vol. 38, pp. 93-110.
Ogbeide, OA & Bruwer, J 2013, 'Enduring involvement with wine: predictive model and
measurement', Journal of Wine Research DOI:10.1080/09571264.2013.795483.
Ogilvie, D 1987, 'The undesired self: A neglected variable in personality research', Journal of
Personality and Social Psychology, vol. 52, pp. 379-385.
OIV 2012, 'Global Economic Survey, International Organisation of Vine and Wine'
http://www.oiv.int/oiv/info/ennoteconjoncture2012?lang=en Accessed 22 November 2012,
Paris, France.
Olsen, J, Thach, L & Hemphill, L 2012, 'The impact of environmental protection and
hedonistic values on organic wine purchases in the US', International Journal of Wine
Business Research, vol. 24, no. 1, pp. 47-67.
Organic Research Centre 2008, Australian Organic Market Report, Chermside, Queensland
Australia.
Organic Trade Association 2010, 'Export Study: Trade Barriers'. Accessed 2 June 2012
http://www.ota.com/organic/mt/export_chapter6.html.
Orth, U 2005, 'Consumer personality and other factors in situational brand choice variation',
Journal of Brand Management, vol. 13, no. 2, pp. 115-133.
Osmond, R & Anderson, K 1998, Trends and Cycles in the Australian Wine Industry, 1850 to
2000, in CfIE Studies (ed.) Education Technology Unit, University of Adelaide, Adelaide.

206
Owusu, V & Anifori, MO 2013, 'Consumer Willingness to Pay a Premium for Organic Fruit
and Vegetables in Ghana', International Food and Agribusiness Management Review, vol.
16, no. 1, pp. 67-86.
Padel, S & Foster, C 2005, ' Exploring the gap between attitudes and behaviour:
understanding why consumers buy or do not buy organic food', British Food Journal, vol.
107, no. 8, pp. 606-626.
Penn, C 2010, 'Marketing conundrum - research shows organic practices raise wine scores
and prices if the wineries don’t talk about them', Wine Business Monthly, vol. 27, no. 10.
Retrieved from http://www.winebusiness.com/wbm/?go=getArticleSignIn&dataId=81507, p.
42.
Perreault, WD, Behrman, DN & Armstrong, GM 1979, 'Alternative approaches for
interpretation of multiple discriminant analysis in marketing research', Journal of Business
Research, vol. 7, pp. 151-173.
Peter, JP 1979, 'Reliability: a review of psychometric basics and recent marketing practices',
Journal of Marketing Research, vol. 16, pp. 6-7.
Peter, JP & Ryan, MJ 1976, 'An investigation of perceived risk at the brand level', Journal of
Marketing Research, vol. 13, pp. 184-188.
Peters, E, Dieckmann, N, Dixon, A, Hibbard, JH & Mertz, CK 2007a, 'Adult age differences
in dual information processes: Implications for the role of affective and deliberative processes
in older adults’ decision making', Perspectives on Psychological Science and Public Policy,
vol. 2, no. 1, pp. 1-23.
Peters, E, Hibbard, J, Slovic, P & Dieckmann, N 2007b, 'Numeracy skill and the
communication, comprehension, and use of risk and benefit information ', Health Affairs, vol.
26, no. 3, pp. 741-748.
Pidgeon, N, Hood, C, Jones, D, Turner, B & Gibson, R 1992, Risk perception in Risk
Analysis, Perception and Management, ed. ERSS Group, Royal Society, London.
Pino, G, Peluso, AM & Guido, G 2012, 'Determinants of Regular and Occasional Consumers'
Intentions to Buy Organic Food', Journal of Consumer Affairs, vol. 46, no. 1, pp. 157-169.
Porter, ME 1985, Competitive strategy, Free Press, New York.
Porter, SR 2004, 'Raising Response Rates: What Works?', New Direction for Institutional
Research, vol. 121, pp. 5-21.
Pretty, J 2008, 'Agricultural sustainability: concepts, principles and evidence', Philosophical
Transaction of the Royal Society Biological Science, vol. 363, no. 1491, pp. 447-465.

207
Priem, RL 2007, 'A Consumer Perspective on Value Creation', The Academy of Management
Review, vol. 32, no. 1, pp. 219-235.
Pullman, M & Gross, MA 2004, 'Ability of Experience Design Elements to Elicit Emotions
and Loyalty Behaviors', Decision Sciences, vol. 35, no. 3, pp. 551-578.
Rao, A & Bergen, M 1992, 'Price Premium Variations as a Consequence of Buyers Lack of
Information', Journal of Consumer Research, vol. 19, no. 3, pp. 412-423.
Rao, AR & Monroe, KB 1988, 'The moderating effect of prior knowledge on cue utilization
in product evaluations', Journal of Consumer Research, vol. 15. Pp 253-264.
Rea, LM & Parker, RA 2012, Designing and Conducting Survey Research: A Comprehensive
Guide, 3rd
edition, John Wiley & Sons, San Francisco.
Ready, RC, Navrud, S & Dubourg, WR 2001, 'How Do Respondents with Uncertain
Willingness to Pay Answer Contingent Valuation Questions', Land Economics, vol. 77, no. 3,
pp. 315-326.
Remaud, H, Mueller, S, Chvyl, P & Lockshin, L 2008, 'Do Australian Wine Consumers
Value Organic Wine', paper presented at Proceedings of 4th
International Conference of the
Academy of Wine Business Research. Retrieved from
http://academyofwinebusiness.com/wp-content/uploads/2010/04/Do-Australian-wine-
consumers-value-organic-wine_paper.pdf Accessed on 21/3/2012, Siena.
Remaud, H & Sirieix, L 2010, 'Consumer perceptions of eco-friendly vs conventional wines
in Australia', paper presented at 5th
International Conference of the Academy of Wine
Business Research, Auckland.
Renn, O 2008, Risk Governance: Combining Facts and Values in Risk Management,
Risks in Modern Society, H-J Bischoff edition, Springer, Netherlands.
Renn, O & Rohrmann, B 2000, Cross-cultural risk perception research, A survey of
empirical studies, Kluwer Academic Publisher, Dordrecht, Netherlands.
Renn, O & Schweizer, P-J 2009, 'Inclusive Risk Governance, Concepts and Application to
Environmental Policy Making', Environmental Policy and Governance, vol. 19, no. 3, pp.
174-185.
Rennie, LJ 1982, 'Detecting a Response Set to Likert-style Attitude Items with the Rating
Model', Education Research and Perspectives, vol. 9, no. 1, pp. 114-118.
Rodrigo, R, Miranda, A & Vergara, L 2011, 'Modulation of endogenous antioxidant system
by wine polyphenols in human disease', Clinica Chimica Acta, vol. 412, no. 5-6, pp. 410-424.

208
Rodriguez, BL, Fujimoto, WY & Mayer-Davis, EJ 2006, 'Prevalence of cardiovascular
disease risk factors in US children and adolescents with diabetes: the search for Diabetes in
Youth Study', Diabetes Care, vol. 29, no. 8, pp. 1891-1896.
Rodríguez, E, Lacaze, V & Lupín, B 2007, 'Willingness to pay for organic food in Argentina:
Evidence from a consumer survey', paper presented at 105th
EAAE Seminar, International
Marketing and International Trade of Quality Food Products, Bologna, Italy March 8-10.
Rodriguez, S & Toca, JL 2006, 'Industrial and biotechnological applications of laccases: a
review', Biotechnology Advances, vol. 24, no. 5, pp. 500-513.
Roe, BE & Just, DR 2009, 'Internal and External Validity in Economics Research: Tradeoffs
between Experiments, Field Experiments, Natural Experiments, and Field Data', American
Journal of Agricultural Economics, vol. 91, no. 5, December 1, 2009, pp. 1266-1271.
Romaniuk, J & Dawes, J 2005, 'Loyalty to price tiers in purchases of bottled wine', Journal of
Product and Brand Management,, vol. 14, no. 1, pp. 57-64.
Rosch, E, Mervis, CB, Gray, W, Johnson, D & Boyes-Braem, P 1986, 'Basic objects in
natural categories', Cognitive Psychology, vol. 8, pp. 382-439.
Roszkowski, J & Soven, M 2009, 'Shifting gears: consequences of including two negatively
worded items in the middle of a positively worded questionnaire', Assessment & Evaluation
in Higher Education, vol. 35, no. 1, 2010/01/01, pp. 113-130.
Rygel, L, O’Sullivan, D & Yarnal, B 2006, 'A Method for Constructing a Social
Vulnerability Index: An Application to Hurricane Storm Surges in a Developed Country',
Mitigation and Adaptation Strategies for Global Change, vol. 11, no. 3, pp. 741-764.
Saher, M, Lindeman, M & Hursti, UKK 2006, 'Attitudes towards genetically modified and
organic foods', Appetite, vol. 46, no. 3, pp. 324-331.
Saliba, AJ, Ovington, LA & Moran, CC 2013, ‘Consumer demand for low-alcohol wine in an
Australian sample’, International Journal of Wine Research vol. 5, pp 1-8
Sangkumchaliang, P & Huang, W 2012, 'Consumers’ Perceptions and Attitudes of Organic
Food Products in Northern Thailand', International Food and Agribusiness Management
Review, vol. 15, no. 1, pp. 87-101.
Sattler, H & Volckner, F 2002, 'Methods for Measuring Consumers' Willingness to Pay',
Marketing and retailing, PhD thesis, University of Hamburg.
Saunders, M, Lewis, P & Thornhill, A 2003, Research Methods for Business Students, 3rd
edition, Pearson Education, Harlow.

209
Savage, G 2009, ‘Green warning for old world’, The Drink Business, 28.10.2009. Retrieved
from http://www.thedrinksbusiness.com/index.php?option=com_content&task=view&id=1
0512&Itemid=66
Schiffman, LG & Kanuk, LL 2006, Consumer Behaviour, 8th
edition, Prentice Hall
International, Englewood Cliffs, New Jersey.
Schriescheim, CA & Eisenbach, RJ 1995, 'An exploratory and confirmatory factor-analytic
investigation of item wording effects on the obtained factor structures of survey questionnaire
measures', Journal of Management, vol. 21, no. 6, pp. 1171-1194.
Schweizer, K, Rauch, W & Gold, A 2011, 'Bipolar items for the measurement of personal
optimism instead of unipolar items', Psychological Test and Assessment Modeling, vol. 53,
no. 4, pp. 399-413.
Semeijn, J, Van Riel, A & Ambrosini, AB 2004, 'Consumer Evaluations of Store Brands:
Effects of Store Image and Product Attributes', Journal of Retailing and Consumer Services,
vol. 11, pp. 247-258.
Sethuraman, R & Srinivasan, V 2002, 'The asymmetric share effect: an empirical
generalization on cross-price effects', Journal of Marketing Research, vol. 39, pp. 379-386.
Seufert, V, Ramankutty, N & Foley, JA 2012, 'Comparing the yields of organic and
conventional agriculture', Nature, vol. 485, no. 7397, pp. 229-232.
Shaffer, RR & Sherrell, DL 1997, 'Consumer satisfaction with health-care services: The
influence of Involvement', Psychology and Marketing, vol. 14, no. 3, pp. 261-285.
Shapiro, C 1983, 'Premiums for high quality products as returns to reputations', Quarterly
Journal of Economics, vol. 98, no. 4, pp. 659-679.
Shepherd, R, Magnusson, M & Sjoden, PO 2005, 'Determinants of consumer behavior related
to organic foods', Journal of the Human Environment, pp. 352-359.
Sichtmann, C & Stingel, S 2007, 'Limit conjoint analysis and Vickrey auction as methods to
elicit consumers' willingness-to-pay: An empirical comparison', European Journal of
Marketing, vol. 41, no. 11/12, pp. 1359 - 1374.
Siderer, Y, Maquet, A & Anklam, E 2005, 'Need for research to support consumer confidence
in the growing organic food market', Trends in Food Science and Technology, vol. 16, pp.
332-343.
Singh, BP, Cowie, K & Chan, Y 2011, Soil Health and Climate Change, Springer, Verlag,
Berlin.
210
Sirieix, L, Persillet, V & Alessandrin, A 2006, Consumers and organic food in France: a
means-end chain study, in Holt, G.C. and Reed, M.J. (Eds), Sociological Perspectives of
Organic Agriculture, CABI, Wallingford UK.
Slovic, P 2000, The Perception of Risk, Earthscan, London.
Smith-Spangler, C, Brandeau, ML, Hunter, EH, Bavinger, JC, Pearson, M, Eschbach, PJ,
Sundaram, V, Liu, H, Schirmer, P, Stave, C, Olkin, I & Bravata, DM 2012, 'Are Organic
Foods Safer or Healthier Than Conventional Alternatives? : A Systematic Review', Annals of
Internal Medicine, vol. 157, no. 5, pp. 348-366.
Spencer, D 2002, 'Australian wine industry: Market access and industry expansion', paper
presented at South Australia Central Region Outlook Conference, Nuriootpa, 4 September
2002.
Squires, L, Juric, B & Cornwell, BTB 2001, 'Level of market development and intensity of
organic food consumption: Cross cultural study of Denmark and New Zealand customers',
Journal of Consumer Marketing, vol. 18, no. 4-5, pp. 392-409.
Stafford, JE & Enis, BM 1969, 'The Price-Quality Relationship: An Extension', Journal of
Marketing Research, vol. 6, pp. 456-458.
Steenkamp, JBEM, Van Heerde, HJ & Geyskens, I 2010, 'What Makes Consumers Willing to
Pay a Price Premium for National Brands over Private Labels?', Journal of Marketing
Research, vol. 47, no. 6, 2010/12/01, pp. 1011-1024.
Stobbelaar, DJ, Casimir, G, Borghuis, J, Marks, I, Meijer, L & Zebeda, S 2007, 'Adolescents’
attitudes towards organic food: a survey of 15 to 16 year old school children', International
Journal of Consumer Studies, vol. 31, pp. 349-356.
Storstad, O & Bjorkhaug, H 2003, 'Foundations of production and consumption of organic
food in Norway: common attitudes among farmers and consumers', Agriculture and Human
Values, vol. 20, pp. 151-163.
Szolnoki, G 2013, 'A cross-national comparison of sustainability in the wine industry',
Journal of Cleaner Production. Retrieved from
http://dx.doi.org/10.1016/j.jclepro.2013.03.045
Retrieved from http://dx.doi.org/10.1016/j.jclepro.2013.03.045.
Tabachnick, BG & Fidell, LS 2007, Using multivariate statistics, 5th
edition, Pearson
International, Upper Saddle River, New Jersey.
The Organic Institute 2012, History Of The Organic Movement, The Organic Institute
http://theorganicsinstitute.com/organic/history-of-the-organic-movement/ Accessed 16
November 2012, Tasmania.
211
Thissen, D & Orlando, M 2001, Psychology, Sage Publications.
Thøgersen, J 2002, 'Direct experience and the strength of the personal norm-behaviour
relationship', Psychology and Marketing, vol. 19, no. 10, pp. 881-893.
—— 2006, 'Media attention and the market for green consumer products', Business Strategy
and the Environment, vol. 15, pp. 145-156.
—— 2007, 'Consumer decision making with regard to organic food products' in Vaz,
M.T.D.N., Vaz, P., Nijkamp, P. and Rastoin, J.L. (Eds), Traditional Food Production Facing
Sustainability: A European Challenge, Ashgate, Farnham.'.
Thompson, G 1998, 'Consumer Demand for Organic Foods', American Journal of
Agricultural Economics, vol. 80, pp. 1113-1118.
Thompson, GD & Kidwell, J 1998, 'Explaining the Choice of Organic Produce: Cosmetic
Defects, Prices, and Consumer Preferences', American Journal of Agricultural Economics,
vol. 80, no. 2, May 1, 1998, pp. 277-287.
Toner, C & Pitman, S 2004, 'Functional Foods: Educating Consumers About Foods with
Health Promoting Benefits in Today’s Challenging Communications Environment', Topics in
Clinical Nutition, vol. 19, no. 1, pp. 71-78.
Tourangeau, R 2004, 'Survey research and societal change', Annual Review of Psychology,
vol. 55, pp. 775-801.
Trioli, G & Hofmann, U 2009, Code of Good Organic Viticulture and Wine-making,
ECOVIN-Federal Association of Organic Wine-Producer, Worm-serstrasse 162; 55276
Oppenheim, Germany.
Tsakiridou, E, Mattas, K & Tzimitra-Kalogianni, I 2006, 'The Influence of Consumer
Characteristics and Attitudes on the Demand for Organic Olive Oil', Journal of International
Food and Agribusiness Marketing, vol. 18, no. 3-4, 2006/10/19, pp. 23-31.
Tsourgiannis, L, Karasavvoglou, A & Nikolaidis, M 2013, 'Exploring Consumers’
Purchasing Behaviour Regarding Organic Wine in a Convergence E.U. Region: The Case of
East Macedonia and Thrace, Greece', in A Karasavvoglou & P Polychronidou (eds), Balkan
and Eastern European Countries in the Midst of the Global Economic Crisis, Physica-Verlag
HD, pp. 133-155.
Turner, AG 2003, Sampling Frames and Master Samples, United Nation Secretariat
Statistical Division, ESA/STAT/AC.93/3.
http://unstats.un.org/unsd/demographic/meetings/egm/Sampling_1203/docs/no_3.pdf
Accessed on 20 October 2010.

212
Turner, BL, Clark, WC, Kates, RW, Richards, JF, Mathews, JT & Meyer, WB 1990, The
Earth as Transformed by Human Action, University Press, Cambridge.
Umberger, WJ, Feuz, DM, Calkins, CR & Killinger, K 2002, 'U.S. Consumer Preference and
Willingness- to-Pay for Domestic Corn-Fed Beef versus International Grass-Fed Beef
Measured Through an Experimental Auction.', An International Journal of Agribusiness, vol.
18, no. 4, pp. 491-504.
Unnevehr, LJ, Villamil, AP & Hasler, C 1999, 'Measuring Consumer Demand for Functional
Foods and the Impact of Health on Labeling Regulation', paper presented at FAMC
Conference on New Approaches to Consumer Welfare, Alexandria, VA, January 14-15.
Urutyan, V & Ngo, S 2007, 'Market Assessment and Development for Organically Grown
Produce in Armenia', paper presented at Pro-poor development in low income countries:
Food, agriculture, trade, and environment, Montpellier, France.
Van Loo, EJ, Caputo, V, Nayga, RM, Canavari, M & Ricke, SC 2012, 'Organic Meat
Marketing', Organic Meat Production and Processing, Wiley-Blackwell, pp. 67-85.
Vickrey, W 1961, 'Counterspeculation, auctions and competitive sealed tenders', Journal of
Finance, vol. 16, pp. 8-16.
Ward, P & Sturrock, F 1998, 'Consumer behaviour; Decision making; Gender; Purchasing;
Risk; Women', Journal of Marketing Intelligence and Planning, vol. 16, no. 5, pp. 627-336.
Ward, T 1996, 'Consumer’s Acquisition of New Product Knowledge of Complex Service
Products. Results of an Experiment on the Effect of Prior Product Knowledge', Asia Pacific
Advances in Consumer Research, vol. 2, pp. 47-59.
Watchravesringkan, K, Hodges, NN & Kim, Yk 2010, 'Exploring consumers' adoption of
highly technological fashion products: The role of extrinsic and intrinsic motivational
factors', Journal of Fashion Marketing and Management, vol. 14, no. 2, pp. 263-281.
Wells, K 2007, Australia's wine industry, http://australia.gov.au/about-australia/australian-
story/australias-wine-industry, Accessed on 1 November 2012.
Wertenbroch, K & Skiera, B 2002, 'Measuring Consumers’Willingness to Pay at the Point of
Purchase', Journal of Marketing Research, vol. 39, pp. 228-241.
Wheeler, SA & Crisp, P 2010, 'Evaluating a Range of the Benefits and Costs of Organic and
Conventional Production in a Clare Valley Vineyard in South Australia', paper presented at
Pre-AARES conference workshop on The World’s Wine Markets by 2030: Terroir, Climate
Change, R&D and Globalization, Adelaide, South Australia 7-9 February 2010.
WHO 2009, 'Global health risks: mortality and burden of disease attributable to selected
major risks', World Health Organization.

213
Wijnberg, NM 1995, 'Selection processes and appropriability in art, science and technology',
Journal of Cultural Economics, no. 19, pp. 221-235.
Wilk, R 1997, 'A critique of desire: Distaste and dislike in consumer behaviour',
Consumption, Markets & Culture, vol. 1, pp. 175-196.
Willer, H & Kilcher, L 2012, The World of Organic Agriculture - Statistics and Emerging
Trends 2012, Research Institute of Organic Agriculture (FiBL), Frick, and International
Federation of Organic Agriculture Movements (IFOAM), Bonn. http://www.organic-
world.net/yearbook-2012.html.
Williams, PRD & Hammitt, JK 2000, 'A comparison of organic and conventional fresh
produce buyers in Boston Area', Risk Analysis, vol. 20, no. 5, pp. 735-746.
Wine Australia 2011, 'Organics and Biodynamics',
http://www.wineaustralia.com/australia/Default.aspx?tabid=5238 Accessed 20 March 2012.
Wine Institute 2010, World Wine Consumption by Volume Wine Institute, San Francisco,
http://www.wineinstitute.org/resources/worldstatistics/article127. Accessed on 25 October
2011.
Winemaker's Federation of Australia 2002, The Australian Wine Industry’s Environment
Strategy: Sustaining Success, Adelaide.
Winemakers Federation of Australia 2000, 'The Marketing Decade: Setting the Australian
Wine Marketing Agenda 2000-2010',
www.wfa.org.au/files/policy_strategy/Marketing_Decade.pdf. Accessed 21 June 2012.
Wittink, DR & Bayer, LR 2003, 'Measurement Imperative', Marketing Research, vol. 15, no.
3, pp. 19-22.
Wong, Kl, Ong, SF & Kuek, TY 2012, 'Constructing a Survey Questionnaire to Collect Data
on Service Quality of Business Academics', European Journal of Social Sciences, vol. 29, no.
2, pp. 209-221.
Wooldridge, JM 2001, 'Applications of Generalized Method of Moments Estimation', Journal
of Economic Perspectives, vol. 15, pp. 87-100.
Wright, S & Grant, B 2011, 'Niche-Marketing Organic Wines: Ethical Dilemmas and the
Importance of Stewardship as the Foundation of Sustainable Business', Australasian
Agribusiness Perspectives, vol. 19, no. 92, pp. 1-6.
Wu, D & Olson, DL 2010, 'Enterprise risk management: coping with model risk in a large
bank', Journal of the Operational Research Society, vol. 61, no. 2, pp. 179-190.
214
Wynen, E 2002, 'What are the key issues faced by organic producers? In: Organic
Agriculture - Sustainability, Markets and Policies', Proceedings of an OECD Workshop,
Washington DC, United States.
Xu, T & Stone, CA 2012, 'Using IRT Trait Estimates Versus Summated Scores in Predicting
Outcomes', Educational and Psychological Measurement, vol. 72, no. 3, pp. 453-468.
Youl, P, Baade, P & Meng, X 2012, 'Impact of prevention on future cancer incidence in
Australia', Cancer Forum, vol. 36, no. 1.
Zeithaml, VA 1988, 'Consumer Perceptions of Price, Quality, and Value: A Means-End
Model and Synthesis of Evidence', Journal of Marketing, vol. 52, pp. 2-22.
Zikmund, WG 2003, Business Research Methods, 7th
edition, South-Western, Ohio.
Zikmund, WG & Babin, B 2007, Essentials of Marketing Research, Thomson South-
Western, Australia.

215
Appendices
Appendix 1. Letter of introduction and consent
Dear Respondent
We are conducting research to establish certain aspects of your involvement in wine and wine-related
activities. This information is of great value and will enable us to understand the needs of wine
consumers and provide you with an even better experience of wine in the future. This questionnaire
will only take about 10 minutes for you to complete. Please rest assured that all information provided
by you will be treated in the strictest professional confidence and no identifying information about
yourself will be made available to anyone, nor will you receive any unsolicited mailings or sales
pitches as a result of your participation in this survey.
Please note that participation in this survey is voluntary and you can choose not to participate if you
wish. Participation will be implied as voluntary consent to participate in the survey and the use of the
data for this research purpose only.
I agree to participate
I do not agree to participate
Consumer Willingness to Pay Premiums for the
Benefits of Organic Wine and the Expert Service of
Wine Retailers

216
Appendix 2. Questionnaire used for the study
Note: The introduction/consent letter in Appendix 1 is an integral part of the questionnaire in the web
design. Appendix 1 was revealed first to the respondents; whether they agreed or not agreed to
participate determined the download of the other parts of the questionnaire.
Screening question
Over the past six months, on average have you consumed at least a bottle of wine (750ml), or its
equivalent in each month?
Yes
No
Section A Consumer information and knowledge of health, environment and Organic wine
A1. Please respond to these statements by indicating true or false and if not sure, indicate so
True False Not sure
Chemicals used for wine production have effect on the
environment (1)
Wine produced from grapes grown with no chemical
application is higher in antioxidants (2)
The anti-oxidant in wine helps to reduce cholesterol in
the blood (3)
Consumption of naturally produced products reduces
cancer risk (4)
Added chemicals in wine have long term effects on
consumers health (5)
A2. Please indicate your level of support for these statements where 1 = strongly disagree and 7 =
strongly agree
Strongly
disagree
Disagree Disagree
somewhat
Undecided Agree
somewhat
Agree Strongly
agree
Organic wine has specific
health benefits that reduce
the risk of developing heart
disease
The organic wine market is
growing
When you buy organic
wine, you help the environment
Organic wines do not
contain artificial additives

217
Organic wine costs more
than the conventional type
Section B: Wine acquisition practices
B1. How often do you drink wine?
Every day
A few times a week
Once a week
Once a fortnight
Once a month
B2. Please rank the following purchasing decision factors according to their importance to you. (1 =
most important and 7 = least important).
______ Convenience
______ Health benefit of wine
______ Price of the wine
______ Taste of the wine
______ Safety
______ Environmental benefit
______ Brand name
B3. Please rank the following wine sales outlets on their ability or perceived ability to guide you to
make the right purchase choice (1 = most able and 8 = least able)
______ Large national general liquor store retailer
______ Independently-owned specialty wine shops
______ Supermarkets or grocery stores
______ Mail order/wine clubs
______ Cellar doors at wineries
______ Restaurants
______ Bars or pubs
______ Internet direct

218
Section C: Consumer motivation towards organic wine
Please indicate your level of support for these statements where 1 = strongly disagree and 7 = strongly
agree
Strongly disagree
Disagree Somewhat disagree
Undecided Somewhat
agree
Agree (6)
Strongly agree
Organic wines taste
better than conventional ones
Organic wines are
better for the
environment
The purchase of
organic wine helps to
promote sustainable
lifestyle
Organic wines are a
healthier option for
wine consumption
I want to acquire further wine knowledge
Section D: Consumers’ attitude towards organic wine
Please indicate your level of support for these statements where 1 = strongly disagree and 7 = strongly
agree
Strongly
disagree
Disagree) Somewhat
disagree)
Undecided Some
what agree
Agree Strongly
Agree
Humans need to adapt to the
natural environment
I am concerned about the health and environment
issues of the use of chemicals
The health and environmental
value of organic wine is worth the premium to be
paid)
Health and environment
claims should be verified
When you buy organic wine,
you make financial sacrifice
for the environment

219
Section E: Perceived risk
E1. Please indicate the perceived risks you may run when you purchase or consume organic wine?
Where 1 = unlikely and 7 = Very likely
Very unlikely
Unlikely Somewhat Unlikely
Undecided Somewhat
Likely
Likely (6)
Very Likely
The wine may not taste good
The benefit may not be
commensurate to the premium
paid
The wine may not meet friends or
family’s expectations
It may not create any
environmental benefits
The health benefits’ claim may
not be true
E2. Please indicate the importance you would attach to the seriousness of the perceived risks you may
run when you purchase or consume organic wine (1= Not at all important and 7 = Extremely
important)
Not at all
important
Low
importance
Slightly
important
Neutral Moderately
important
Very
important
Extremely
important
I could be sick
My money could be wasted
I could be let down
or embarrassed
among friends and family
The environment
could be adversely
affected
I could suffer
psychological
discomfort over
poor choice of wine
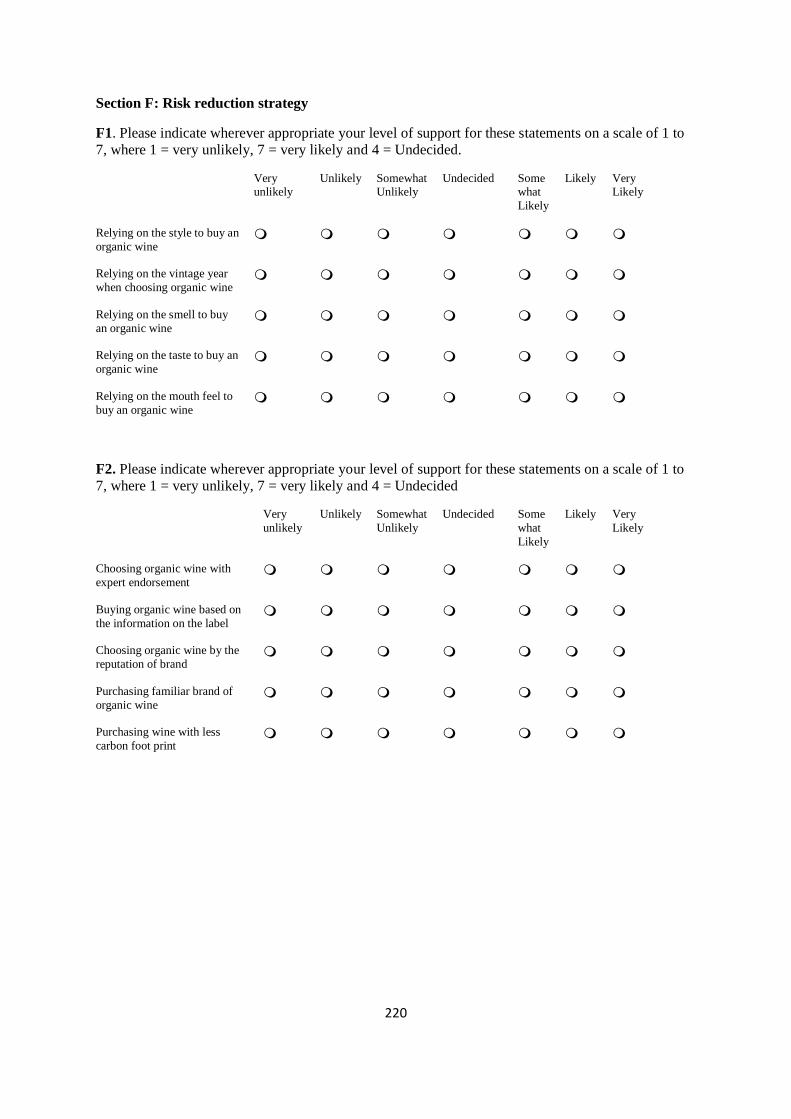
220
Section F: Risk reduction strategy
F1. Please indicate wherever appropriate your level of support for these statements on a scale of 1 to
7, where 1 = very unlikely, 7 = very likely and 4 = Undecided.
Very unlikely
Unlikely Somewhat Unlikely
Undecided Somewhat
Likely
Likely Very Likely
Relying on the style to buy an
organic wine
Relying on the vintage year
when choosing organic wine
Relying on the smell to buy
an organic wine
Relying on the taste to buy an
organic wine
Relying on the mouth feel to
buy an organic wine
F2. Please indicate wherever appropriate your level of support for these statements on a scale of 1 to
7, where 1 = very unlikely, 7 = very likely and 4 = Undecided
Very
unlikely
Unlikely Somewhat
Unlikely
Undecided Some
what
Likely
Likely Very
Likely
Choosing organic wine with
expert endorsement
Buying organic wine based on
the information on the label
Choosing organic wine by the
reputation of brand
Purchasing familiar brand of
organic wine
Purchasing wine with less
carbon foot print

221
F3. Please indicate by ticking (√) wherever appropriate your level of support for these statements on a
scale of 1 to 7, where 1 = very unlikely, 7 = very likely and 4 = Don’t Know
Very
unlikely
Unlikely Somewhat
unlikely
Undecided Some
what
likely
Likely Very
likely
Purchasing wine from the store that has reviews on
wine
Using reputation of the
wine store to make a purchase decision
Purchasing from a store
that has friendly and
knowledgeable staff
Purchasing wine from
stores recommended by
friends and colleagues
Buying wine from a store that has won some awards
Section G: Willingness to pay (Please read this note before responding to the questions in this
section)
It has been suggested that wine can be intimidating because of its complexity (there are many
flavours and aromas, manufacturing methods, regions of origin, brands, prices, and vineyards
for example, each of which has some effect on the final product).
Consumers play a role in influencing producers and sellers of wine to reduce perceived risk
and intimidation when making a wine purchase. The producers and the sellers are constantly
evolving strategies to address these issues. Growing of organic grapes, improved quality
assurance and employment of qualified sales personnel constitute some of these strategies. All
these cost more money in production terms than if not provided. So it is expected that wine
sold under these conditions may cost a bit more than regular wine.
In this section, we present some “hypothetical” wine scenarios. It has been our experience that
people tend to overestimate what they would actually pay for wine. Therefore, we ask that you
please respond exactly as you would if you were doing actual purchase in a wine store.
Assume you are in a real purchase situation and please indicate your decisions below:
Typical price of a regular wine is $9.95.
Would you be willing to pay extra for the
environmental benefit of this wine?
Yes
No

222
Please mark the most you would pay for this product in addition to the regular price
$4.00
$3.00
$2.00
$1.00
How sure are you about your payment decision?
100%
95% (2)
Less than 95%
If you are less than 95% sure, please indicate the most you would be willing to pay for the
environmental benefits of organic wine in addition to the regular price of $9.95
Typical price of a regular wine is $9.95
Would you be willing to pay extra for the health
benefit?
Yes
No
If YES, please mark the most you would pay for this product in addition to the regular price
$4.00
$3.00
$2.00
$1.00
How sure are you about your payment decision?
100%
95%
Less than 95%
$

223
If you are less than 95% sure, please indicate the most you would be willing to pay for the health
benefit of a perfect wine with fine taste in addition to the regular price of $ 9.95
You want to buy a bottle of wine and you have no idea
about the quality attributes of the wine and the store.
Would you be willing to pay extra if the store provides
you with useful assistance to make the right purchase?
Yes
No
If YES, please mark the most you would pay for this service in addition to the regular price
$2.00
$1.50
$1.00
$0.50
How sure are you about your payment decision?
100%
95%
Less than 95%
If you are less than 95% sure, please indicate in the space below the most you would be willing to pay
for the store service
Section H: Socio-demographic details
Have you ever purchased organic wines?
Yes
No
Gender
Male
Female
$
$

224
Age Group
18 - 24 years
25 - 28 years
29 - 34 years
35 - 40 years
41 - 45 years
46 - 54 years
55 - 65 years
65 + years
Educational Status (highest level you have achieved to date)
School Leaver’s Certificate
Higher School Certificate
TAFE certificate/diploma
Bachelor’s degree
Graduate/Postgraduate diploma
Master’s degree
Doctorate degree
Others (Please specify). ____________________
What is your current marital status?
Single
Married or cohabiting
Widowed
Separated
Divorced
What is your Occupation?
Engineering and design
Clerical and administrative
Education
Management and professional
Sales and service
225
Warehouse and distribution
Others (please specify) ____________________
Please indicate your (household’s) approximate total annual income (before taxes) category
$25,000
$25,001 - $50,000
$50,001 - $75,000
$75,001 - $100,000
$100,001 - $150,000
$150,001 - $200,000
$200,00 plus
Which of the following best describes your ethnic background?
Indigenous Australian
American
Caucasian (white)
African
Asian
Others (please specify) ____________________
Excluding yourself, how many members of your household are in the following age groups? (Click on
the zero in the response box, delete it and type in your response)
______ Child 0-24 Months
______ Child 3-17 years
______ Dependent adult 18 years or older
Please state the post code of where you are residing

226
Appendix 3. Ranking of factors that influence wine purchase decision
Purchase
decision
factors
Rank 1st 2nd 3rd 4th 5th 6th 7th Total
Convenience Freq. 35 132 527 573 339 250 240 2099
% 1.67 6.29 25.12 27.31 16.16 11.92 11.53 100
Health benefit
of wine
Freq 101 194 281 432 662 299 129 2099
% 4.81 9.25 13.39 20.59 31.55 14.25 6.15 100
Price of the
wine
Freq 418 942 389 153 93 62 41 2099
% 19.92 44.90 18.54 7.29 4.43 2.96 1.95 100
Taste of the
wine
Freq 1341 435 163 56 36 31 36 2099
% 63.92 20.73 7.77 2.67 1.72 1.48 1.72 100
Safety Freq 73 73 134 204 364 552 698 2099
% 3.48 3.48 6.39 9.72 17.35 26.31 33.27 100
Environmental
benefit
Freq 30 41 91 202 342 694 698 2099
% 1.43 1.95 4.34 9.63 16.30 33.08 33.27 100
Brand name Freq 100 281 513 478 262 201 254 2099
% 4.77 13.39 24.45 22.78 12.49 10.01 12.11 100
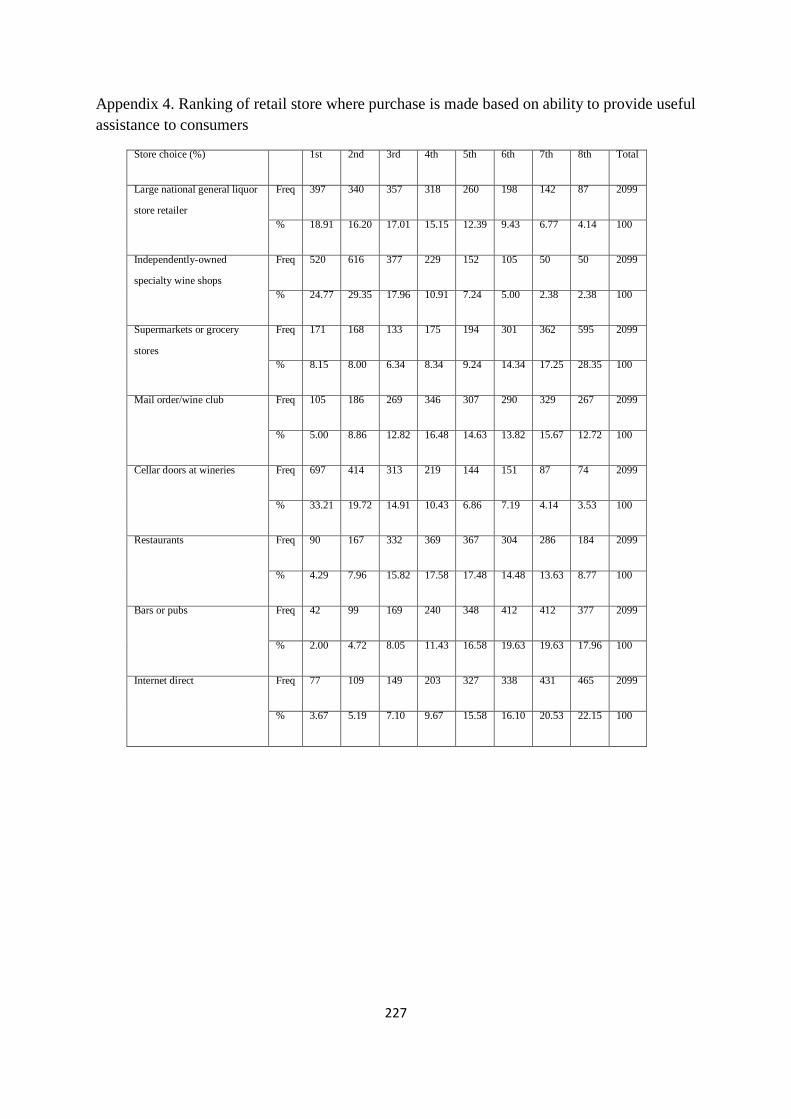
227
Appendix 4. Ranking of retail store where purchase is made based on ability to provide useful
assistance to consumers
Store choice (%) 1st 2nd 3rd 4th 5th 6th 7th 8th Total
Large national general liquor
store retailer
Freq 397 340 357 318 260 198 142 87 2099
% 18.91 16.20 17.01 15.15 12.39 9.43 6.77 4.14 100
Independently-owned
specialty wine shops
Freq 520 616 377 229 152 105 50 50 2099
% 24.77 29.35 17.96 10.91 7.24 5.00 2.38 2.38 100
Supermarkets or grocery
stores
Freq 171 168 133 175 194 301 362 595 2099
% 8.15 8.00 6.34 8.34 9.24 14.34 17.25 28.35 100
Mail order/wine club Freq 105 186 269 346 307 290 329 267 2099
% 5.00 8.86 12.82 16.48 14.63 13.82 15.67 12.72 100
Cellar doors at wineries Freq 697 414 313 219 144 151 87 74 2099
% 33.21 19.72 14.91 10.43 6.86 7.19 4.14 3.53 100
Restaurants Freq 90 167 332 369 367 304 286 184 2099
% 4.29 7.96 15.82 17.58 17.48 14.48 13.63 8.77 100
Bars or pubs Freq 42 99 169 240 348 412 412 377 2099
% 2.00 4.72 8.05 11.43 16.58 19.63 19.63 17.96 100
Internet direct Freq 77 109 149 203 327 338 431 465 2099
% 3.67 5.19 7.10 9.67 15.58 16.10 20.53 22.15 100

228
Appendix 5. Respondents’ frequency of wine consumption
Appendix 6. Respondents’ willingness to pay (WTPe, WTPh and WTPs)
WTP Yes
(%)
No (%) Total # of respondents
Willingness to pay for the
environmental benefit of organic
wine (WTPe)
55.6 44.4 2099
Willingness to pay for the health
benefit of organic wine (WTPh)
66.32 33.68 2099
Willingness to pay for the
service provided by wine store
(WTPs)
41.88 58.12 2099
Frequency of consumption No of
Respondents
Percent
Everyday 346 16.48
A few times a week 931 44.35
Once a week 498 23.73
Once a fortnight 178 8.48
Once a month 146 6.96

229
Appendix 7. Premium respondents are willing to pay for environmental attribute of organic
wine
Premium in Dollar
amount ($)
Number of Respondents
WTPe
$0.00 932
$1.00 279
$2.00 453
$3.00 258
$4.00 177
$0.05 3
$0.10 1
$0.20 1
$0.50 12
$0.55 4
$0.60 2
$0.65 1
0.80 2
0.90 1
1.05 2
1.25 1
1.50 14
2.05 2
2.50 5
3.05 1
3.50 1
5.00 5
5.05 1
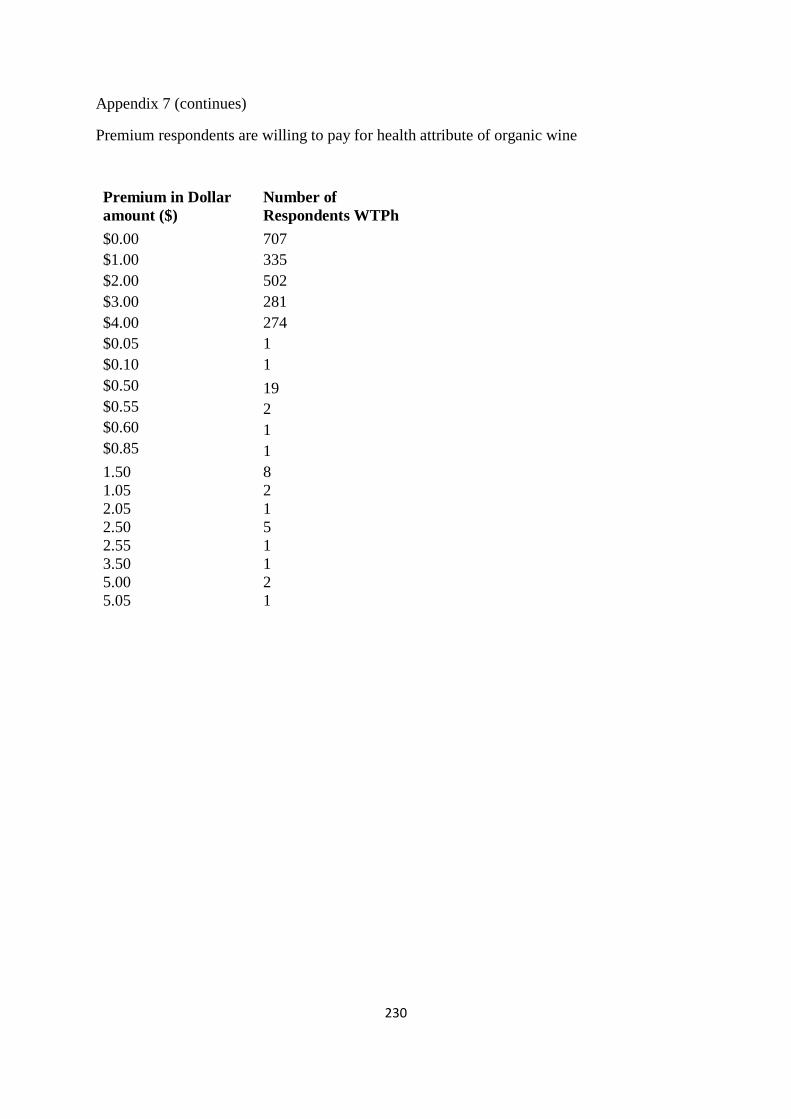
230
Appendix 7 (continues)
Premium respondents are willing to pay for health attribute of organic wine
Premium in Dollar
amount ($)
Number of
Respondents WTPh
$0.00 707
$1.00 335
$2.00 502
$3.00 281
$4.00 274
$0.05 1
$0.10 1
$0.50 19
$0.55 2
$0.60 1
$0.85 1
1.50 8
1.05 2
2.05 1
2.50 5
2.55 1
3.50 1
5.00 2
5.05 1

231
Appendix 7 (continues)
Premium respondents are willing to pay for expert service of retail sales outlet
Premium in Dollar
amount ($)
Number of
Respondents
WTPs
$0.00 1220
$0.50 129
$1.00 317
$1.50 98
$2.00 335
$0.10 2
$0.12 1
$0.20 3
$0.25 4
$0.35 1
$0.40 1
$0.45 1
$0.60 1
$0.65 1
$0.70 1
$0.75 2
$0.80 3
$0.85 1
$0.90 1
$0.95 2
$1.20 1
$1.30 1
$3.00 1

232
Appendix 8. Scale items and their sources
Statement Source
Knowledge of organic wine:
Organic wine has specific health benefits that reduce
the risk of developing heart disease
Developed from Literature reviewed
The organic wine market is growing Developed from Literature reviewed
When you buy organic wine, you help the environment Developed from Literature reviewed
Organic wines do not contain artificial additives Adapted from (Gil et al., 2000)
Organic wine costs more than the conventional type Adapted from (Fotopoulos et al., 2003
Statement Source
Consumer motivation towards organic wine:
Organic wines taste better than conventional ones Developed from Literature reviewed
Organic wines are better for the environment Developed from Literature reviewed
The purchase of organic wine helps to promote
eco-friendly lifestyle
Developed from Literature reviewed
Organic wines are a healthier option for wine
consumption
Developed from Literature reviewed
I want to acquire further wine knowledge Adapted from (Guay et al., 2010; McCarthy, et
al., 199
Statement Source
Consumers’ attitude:
Humans need to adapt to the natural environment Adapted from (Kim et al., 2010; Magnusson et
al., 2003; Stobbelaar et al., 2007; Munene; 2006;
Barber et al., 2009)
I am concerned about the health and environment
issues of the use of chemicals
Adapted from (Kim et al., 2010; Magnusson et
al., 2003; Stobbelaar et al., 2007; Munene; 2006)
The health and environmental value of organic
wine is worth the premium to be paid
Developed from Literature reviewed (
Health and environment claims should be verified Developed from Literature reviewed
When you buy organic wine, you make financial
sacrifice for the environment
Developed from Literature reviewed
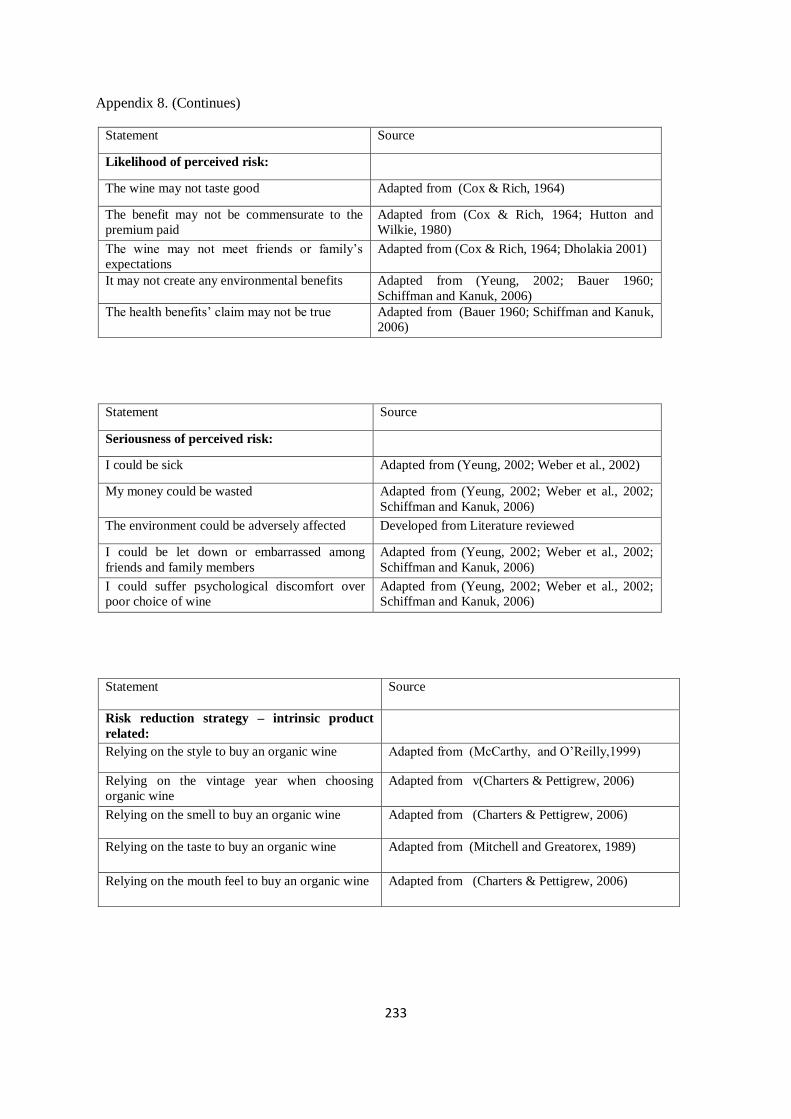
233
Appendix 8. (Continues)
Statement Source
Likelihood of perceived risk:
The wine may not taste good Adapted from (Cox & Rich, 1964)
The benefit may not be commensurate to the
premium paid
Adapted from (Cox & Rich, 1964; Hutton and
Wilkie, 1980)
The wine may not meet friends or family’s
expectations
Adapted from (Cox & Rich, 1964; Dholakia 2001)
It may not create any environmental benefits Adapted from (Yeung, 2002; Bauer 1960;
Schiffman and Kanuk, 2006)
The health benefits’ claim may not be true Adapted from (Bauer 1960; Schiffman and Kanuk,
2006)
Statement Source
Seriousness of perceived risk:
I could be sick Adapted from (Yeung, 2002; Weber et al., 2002)
My money could be wasted Adapted from (Yeung, 2002; Weber et al., 2002;
Schiffman and Kanuk, 2006)
The environment could be adversely affected Developed from Literature reviewed
I could be let down or embarrassed among
friends and family members
Adapted from (Yeung, 2002; Weber et al., 2002;
Schiffman and Kanuk, 2006)
I could suffer psychological discomfort over
poor choice of wine
Adapted from (Yeung, 2002; Weber et al., 2002;
Schiffman and Kanuk, 2006)
Statement Source
Risk reduction strategy – intrinsic product
related:
Relying on the style to buy an organic wine Adapted from (McCarthy, and O’Reilly,1999)
Relying on the vintage year when choosing
organic wine
Adapted from v(Charters & Pettigrew, 2006)
Relying on the smell to buy an organic wine Adapted from (Charters & Pettigrew, 2006)
Relying on the taste to buy an organic wine Adapted from (Mitchell and Greatorex, 1989)
Relying on the mouth feel to buy an organic wine Adapted from (Charters & Pettigrew, 2006)

234
Appendix 8. (continues)
Statement Source
Risk reduction strategy - Extrinsic product
related:
Choosing organic wine with expert
endorsement
Adapted from (Tan, SJ, 1999; Roselius, 1971;
McCarthy, and O’Reilly,1999)
Buying organic wine based on the information
on the label
Adapted from (Yeung, 2002; Weber et al., 2002;
Schiffman and Kanuk, 2006)
Choosing organic wine by the reputation of
brand
Adapted from (McCarthy, and O’Reilly,1999,
Mitchell and McGoldrick, 1996)
Purchasing familiar brand of organic wine Adapted from (Roselius, 1971; Schiffman and
Kanuk, 2006)
Purchasing wine with less carbon foot print Developed from Literature reviewed
Statement Source
Risk reduction strategy - Extrinsic store
related:
Purchasing wine from the store that has reviews
on wines
Adapted from (Raju, P., 1980; Rundle-Thiele,
2005; Mitchell and McGoldrick, 1996)
Using reputation of the wine store to make a
purchase decision
Adapted from (Roselius, 1971; Schiffman and
Kanuk, 2006)
Purchasing from a store that has friendly and
knowledgeable staff
Adapted from (Spawton, 1991)
Purchasing wine from stores recommended by
friends and colleagues
Adapted from (Tan, SJ, 1999; Roselius, 1971;
McCarthy, and O’Reilly,1999)
Buying wine from a store that has won some
awards
Adapted from (Mitchell and McGoldrick, 1996)
Statement Source
Willingness to pay: Contingent valuation
method
Adapted from (Gil, et al., 2000; Lusk, 2003;
Munene; 2006; Lusk & Hudson, 2004; Maynard &
Franklin, 2003; Rygel, O’sullivan, & Yarnal, 2006)
Cheap talk Adapted from (Aadland & Caplan, 2003; Cummings
& Taylor, 1999; Mahieu, et al., 2012; Murphy, et al.,
2005)
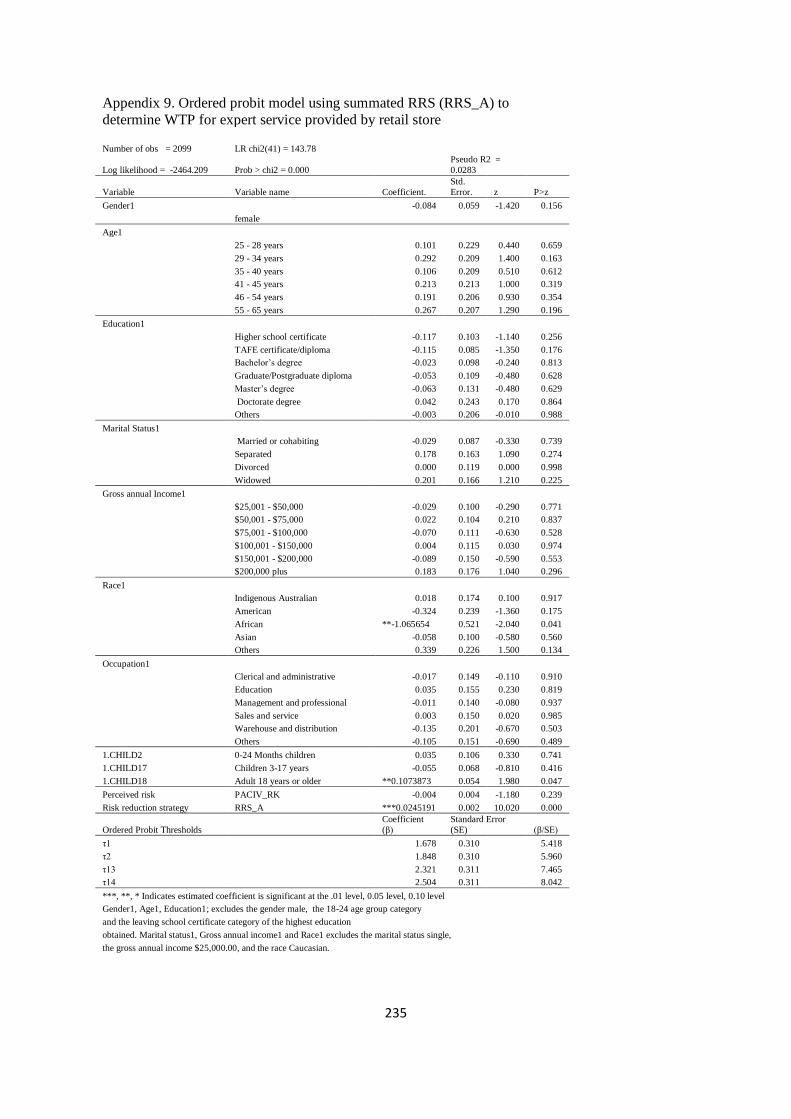
235
Appendix 9. Ordered probit model using summated RRS (RRS_A) to
determine WTP for expert service provided by retail store
Number of obs = 2099 LR chi2(41) = 143.78
Log likelihood = -2464.209 Prob > chi2 = 0.000
Pseudo R2 =
0.0283
Variable Variable name Coefficient.
Std.
Error. z P>z
Gender1
-0.084 0.059 -1.420 0.156
female
Age1
25 - 28 years 0.101 0.229 0.440 0.659
29 - 34 years 0.292 0.209 1.400 0.163
35 - 40 years 0.106 0.209 0.510 0.612
41 - 45 years 0.213 0.213 1.000 0.319
46 - 54 years 0.191 0.206 0.930 0.354
55 - 65 years 0.267 0.207 1.290 0.196
Education1
Higher school certificate -0.117 0.103 -1.140 0.256
TAFE certificate/diploma -0.115 0.085 -1.350 0.176
Bachelor’s degree -0.023 0.098 -0.240 0.813
Graduate/Postgraduate diploma -0.053 0.109 -0.480 0.628
Master’s degree -0.063 0.131 -0.480 0.629
Doctorate degree 0.042 0.243 0.170 0.864
Others -0.003 0.206 -0.010 0.988
Marital Status1
Married or cohabiting -0.029 0.087 -0.330 0.739
Separated 0.178 0.163 1.090 0.274
Divorced 0.000 0.119 0.000 0.998
Widowed 0.201 0.166 1.210 0.225
Gross annual Income1
$25,001 - $50,000 -0.029 0.100 -0.290 0.771
$50,001 - $75,000 0.022 0.104 0.210 0.837
$75,001 - $100,000 -0.070 0.111 -0.630 0.528
$100,001 - $150,000 0.004 0.115 0.030 0.974
$150,001 - $200,000 -0.089 0.150 -0.590 0.553
$200,000 plus 0.183 0.176 1.040 0.296
Race1
Indigenous Australian 0.018 0.174 0.100 0.917
American -0.324 0.239 -1.360 0.175
African **-1.065654 0.521 -2.040 0.041
Asian -0.058 0.100 -0.580 0.560
Others 0.339 0.226 1.500 0.134
Occupation1
Clerical and administrative -0.017 0.149 -0.110 0.910
Education 0.035 0.155 0.230 0.819
Management and professional -0.011 0.140 -0.080 0.937
Sales and service 0.003 0.150 0.020 0.985
Warehouse and distribution -0.135 0.201 -0.670 0.503
Others -0.105 0.151 -0.690 0.489
1.CHILD2 0-24 Months children 0.035 0.106 0.330 0.741
1.CHILD17 Children 3-17 years -0.055 0.068 -0.810 0.416
1.CHILD18 Adult 18 years or older **0.1073873 0.054 1.980 0.047
Perceived risk PACIV_RK -0.004 0.004 -1.180 0.239
Risk reduction strategy RRS_A ***0.0245191 0.002 10.020 0.000
Ordered Probit Thresholds
Coefficient
(β)
Standard Error
(SE) (β/SE)
τ1 1.678 0.310 5.418
τ2
1.848 0.310
5.960
τ13
2.321 0.311
7.465
τ14
2.504 0.311
8.042
***, **, * Indicates estimated coefficient is significant at the .01 level, 0.05 level, 0.10 level
Gender1, Age1, Education1; excludes the gender male, the 18-24 age group category
and the leaving school certificate category of the highest education
obtained. Marital status1, Gross annual income1 and Race1 excludes the marital status single,
the gross annual income $25,000.00, and the race Caucasian.

236
Appendix 10. Gender Delimited Demographic Profile of Sample
Gender Delimited Demographic Profile of Sample (n=2099)
Characteristics
# of
male % male # of female % female
Gender Sex 1292 61.55 807 38.45
Age Group 18 - 24 years 39 86.67 6 13.33
25 - 28 years 65 71.43 26 28.57
29 - 34 years 150 67.87 71 32.13
35 - 40 years 181 69.08 81 30.92
41 - 45 years 144 69.9 62 30.1
46 - 54 years 265 64.95 143 35.05
55 - 65 years 314 58.26 225 41.74
65 + years 136 41.59 191 58.41
Highest education obtained School Leaver’s cert. 197 64.38 109 35.62
High School Certificate 170 66.67 85 33.33
TAFE certificate/diploma 404 61.21 256 38.79
Bachelor’s degree 268 64.11 150 35.89
Graduate/Postgraduate
diploma 146 61.6 91 38.4
Master’s degree 77 48.73 81 51.27
Doctorate degree 11 39.29 17 60.71
Others 19 51.35 18 48.65
Marital status Single 173 56.72 132 43.28
Married or cohabiting 896 61.29 566 38.71
Separated 45 65.22 24 34.78
Divorced 131 67.53 63 32.47
Widowed 47 68.12 22 31.88
Occupation Engineering and design 14 15.56 76 84.44
Clerical and administrative 298 84.66 54 15.34
Education 143 69.08 64 30.92
Management and professional 318 56.18 248 43.82
Sales and service 209 67.42 101 32.58
Warehouse and distribution 12 18.75 52 81.25
Others 298 58.43 212 41.57
Income $25,000 136 61.54 85 38.46
$25,001 - $50,000 284 63.39 164 36.61
$50,001 - $75,000 253 60.1 168 39.9
$75,001 - $100,000 278 62.61 166 37.39
$100,001 - $150,000 236 61.94 145 38.06
$150,001 - $200,000 72 61.54 45 38.46
$200,000 plus 33 49.25 34 50.75
Race Caucasian (white) 1122 62.54 672 37.45
Indigenous Australian 29 60.42 19 39.58
American 15 55.56 12 44.44
African 8 80 2 20
Asian 97 50.52 95 49.48
Others 21 75 7 25
Household type No dependants 259 57.81 189 41.19
0-24 Months children 118 69.82 51 30.18
Children 3-17 years 349 61.77 216 38.23
Adult 18 years or older 566 61.72 351 38.28
State New South Wales 392 60.12 260 39.88
Victoria 346 61.24 219 8.76
Queensland 261 64.44 144 35.56
Western Australia 135 62.79 80 37.21
South Australia 98 57.31 73 42.69
Tasmania 34 62.96 20 37.04
Australia Capital Territory 15 60 10 40
Northern Territory 11 91.67 1 8.33
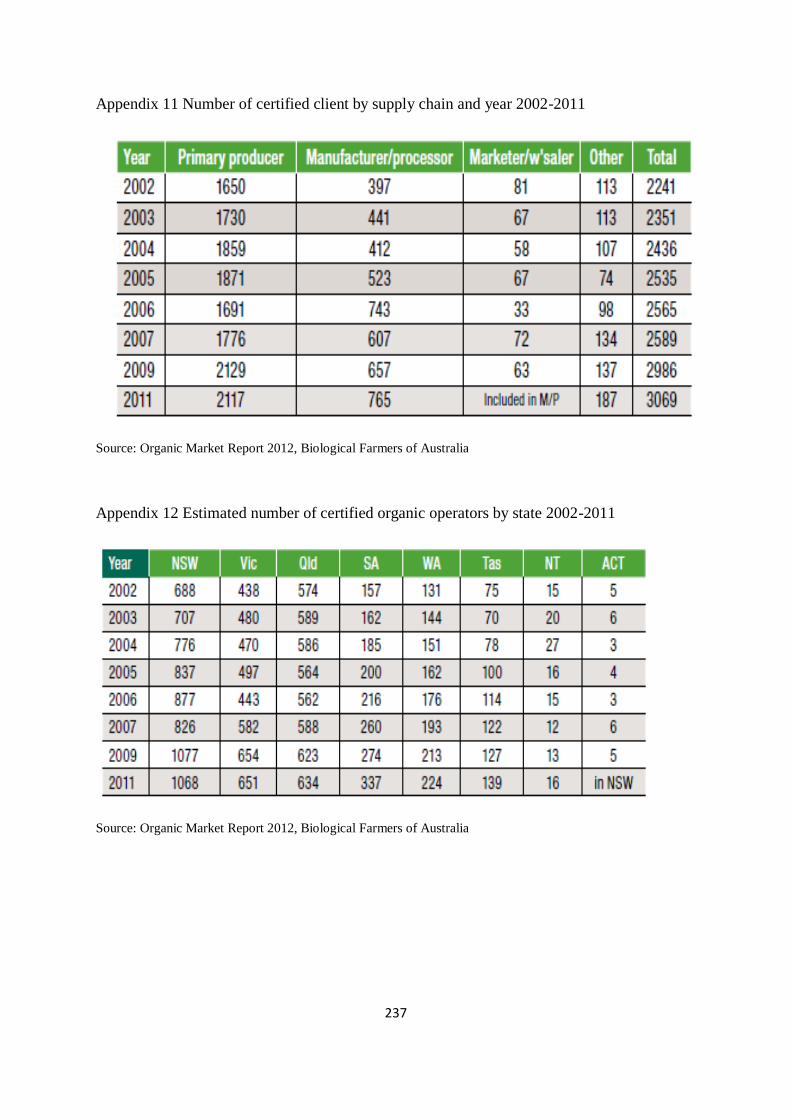
237
Appendix 11 Number of certified client by supply chain and year 2002-2011
Source: Organic Market Report 2012, Biological Farmers of Australia
Appendix 12 Estimated number of certified organic operators by state 2002-2011
Source: Organic Market Report 2012, Biological Farmers of Australia

238
Appendix 13 Total area certified in Australia 2002-2011
Source: Organic Market Report 2012, Biological Farmers of Australia
Appendix 14 The theoretical model, hypotheses outcome and the direction for WTPe and
WTPh
H: 1a & b **+
H: 2a**- (rejected) & b (rejected)
H: 3a & b ***+
H: 4a & b ***-
H: 5a & b ***+
H: 7a & b (inconclusive)
Where to level of significance and the direction signs are at the end of the “a and b” of the hypotheses, it means both have
the same level of significance and direction. When to level of significance and the direction signs are in between “a and b” or after “b” hypotheses, it means they have different level of significance and/or direction. The hypothesis with mixed outcome
was presented as inconclusive.
Consumer’s knowledge of health,
environment and Organic wine
KNOWOW
Willingness to pay
environmental
(WTPe = “a
hypotheses”) and
health (WTPh =
“b hypotheses”)
benefits of
Organic wine
Consumer’s attitude towards
organic wine. ATTITUDE
Consumer’s risk reduction
strategy RRS_A
Consumer’s perceived risk
PACIV_RK
Consumer motivation towards
organic wine MOTI, MOTIV
Consumer demographics and
socio-economic factors

239
Appendix 14a The theoretical model, hypotheses outcome and the direction for WTPs
H: 5c (rejected)
H: 6 ***+
H: 7c (Inconclusive)
The hypothesis with mixed outcome was presented as inconclusive.
Consumer’s perceived risk
PACIV_RK
Consumer’s risk reduction
strategy
Willingness to pay for
expert service of retail
store
WTPs
Consumer’s social demographics

240
Appendix 15. Cross-tabulation of Social Demographic variables and Latent variables: Chi
Square Test Result
Cross-tabulation of Social Demographic variables and Latent variables: Chi Square Test Result
Social demographic variable V Latent variables Df Chi2 Value Probability Significance
Income V Motive 36 39.49 0.317 Non
Income V Risk reduction strategy 432 460.21 0.168 Non
Income V Perceived risk 282 292.79 0.317 Non
Income V Attitude 144 154.42 0.262 Non
Income V Knowledge 192 220.30 0.079 *
Education V motive 42 54.10 0.100 *
Education V Risk reduction strategy 504 450.10 0.959 Non
Education V Perceived risk 329 349.10 0.214 Non
Education V Attitude 168 177.78 0.288 Non
Education V Knowledge 224 234.73 0.298 Non
Gender V Motive 6 38.37 0.001 ***
Gender VRisk reduction strategy 72 67.19 0.638 Non
Gender V Perceived risk 47 61.83 0.072 *
Gender V Attitude 24 57.32 0.001 ***
Gender V Knowledge 32 65.75 0.001 ***
Occupation V motive 42 82.00 0.001 ***
Occupation V Risk reduction strategy 504 591.12 0.001 ***
Occupation V perceived risk 329 371.57 0.053 *
Occupation V Attitude 168 191.45 0.104 Non
Occupation V Knowledge 224 280.47 0.006 **
Marital status V Motive 24 23.11 0.513 Non
Marital status V Risk reduction strategy 288 342.46 0.015 **
Marital status V Perceived risk 188 282.67 0.001 ***
Marital status V Attitude 96 85.35 0.773 Non
Marital status V Knowledge 128 117.85 0.729 Non
Age V Motive 42 110.52 0.001 ***
Age V Risk reduction strategy 504 508.46 0.436 Non
Age V Perceived risk 329 276.77 0.983 Non
Age V Attitude 168 202.21 0.037 *
Age V Knowledge 224 247.23 0.137 Non
***, **, * Indicates level of significant at the .01 level, 0.05 level, 0.10 level, Df = degree of freedom, V = cross-tabulation, Non = Non significant

241
Appendix 16 Organic Agriculture: Key Indicators and Leading Countries
Organic Agriculture: Key Indicators and Leading Countries
Indicator World Leading countries
Organic agricultural land 2010: 37 million hectares
(2009: 37.1 million hectares;
1999: 11 million hectares)
Australia (12 million hectares, 2009)
Argentina (4.2 million hectares, 2010)
US (1.9 million hectares, 2008)
Growth of organic
agricultural land
Year 2010: -50,000 hectares = -0.1%
Year 2009: +1.9 million hectares = +5%;
Year 2008: +2.9 million hectares = +9%
France: +168,000 hectares (+24 %), 2010
Poland: +155,000 hectares (+42 %), 2010 Spain: +126,000 hectares (+9%), 2010
Organic market size
Year 2010: 59.1 billion USD
Year 2009: 54.1 billion USD Year 1999: 15.2 billion USD
US (26.7 billion USD, 2010
Germany (8.4 billion USD), 2010 France (4.7 billion USD), 2010
Per capita consumption Year 2010: 8.6 USD Switzerland (213 USD), 2010
Denmark (198 USD), 2010
Luxemburg (177 USD), 2010
Source: The World of Organic Agriculture Report 2012. http://www.organic-world.net/1690.html
Appendix 17 Retail value growth of organic products in Australia.
Source: Organic Market Report 2012, Biological Farmers of Australia