by Michael Andrew Smith - University of Michigan
237
EXPERIMENTAL AND MODELING STUDIES OF LEAN AND RICH EXHAUST CONDITIONS FOR SELECTIVE CATALYTIC REDUCTION OF NO X WITH NH 3 by Michael Andrew Smith A dissertation submitted in partial fulfillment of the requirements for the degree of Doctor of Philosophy (Mechanical Engineering) in The University of Michigan 2010 Doctoral Committee: Professor Dionissios N. Assanis, Co-Chair Research Scientist Stani V. Bohac, Co-Chair Professor Levi T. Thompson Jr. Professor Zoran S. Filipi Research Scientist John W. Hoard
Transcript of by Michael Andrew Smith - University of Michigan

EXPERIMENTAL AND MODELING STUDIES OF LEAN AND RICH
EXHAUST CONDITIONS FOR SELECTIVE CATALYTIC REDUCTION OF
NOX WITH NH3
by
Michael Andrew Smith
A dissertation submitted in partial fulfillment
of the requirements for the degree of
Doctor of Philosophy
(Mechanical Engineering)
in The University of Michigan
2010
Doctoral Committee:
Professor Dionissios N. Assanis, Co-Chair
Research Scientist Stani V. Bohac, Co-Chair
Professor Levi T. Thompson Jr.
Professor Zoran S. Filipi
Research Scientist John W. Hoard

© Michael Smith
All Rights Reserved 2010

ii
To my Family

iii
ACKNOWLEDGMENTS
I would like to thank my wife, son, and family for their love and support making
this possible for me.
I would like to thank Professor Assanis for giving me the chance to work with
him these last 5 years. I would like to thank Christopher Depcik for all his guidance and
initially getting me started. I would also like to thank Stani Bohac, John Hoard, George
Lavoie, and Jason Martz for additional advising/insights they have provided throughout
my research
I would like to thank Stephan Klinkert, John Hoard, Markus Shmitzberger, and
Doohyun Kim for their work on the reactor bench.
I would like to thank Luke Hagen and Ann Marie Lewis for their valiant effort in
obtaining engine results for me.
I would like to thank the Eaton Corporation for their support. Additionally I
would like to acknowledge that this work was performed under a Contract 06-0624
“Collaborative Development of Clean Diesel Aftertreatment System through Modeling
and Testing” from the Michigan Economic Development Corporation (MEDC) in
collaboration with the Eaton Corporation.
Lastly, I would like to thank all my labmates for their support and various coffee
time discussions

iv
TABLE OF CONTENTS
DEDICATION .................................................................................................. ii
ACKNOWLEDGMENTS ................................................................................ iii
LIST OF FIGURES ....................................................................................... viii
LIST OF TABLES ..........................................................................................xxi
NOMENCLATURE ..................................................................................... xxiii
ABSTRACT .................................................................................................. xxvi
CHAPTER 1 INTRODUCTION .......................................................................1
1.1 CO and HC Emissions Control ...................................................................2
1.2 PM Emissions Control ...............................................................................3
1.3 NOx Emissions Control ..............................................................................3
1.3.1 Hydrocarbon Selective Catalytic Reduction ........................................3
1.3.2 Lean NOx Trap ...................................................................................4
1.3.3 Ammonia Selective Catalytic Reduction .............................................4
1.3.4 Combination Systems .........................................................................5
1.4 Selective Catalytic Reduction of NOx with NH3 .........................................8
1.5 Objectives ................................................................................................ 10
CHAPTER 2 METHODOLOGY .................................................................... 12
2.1 Aftertreatment Modeling .......................................................................... 14
2.1.1 AVL BOOST Conservation Equations Solver ................................... 15
2.2 Experimental Equipment .......................................................................... 21
2.2.1 Bench Top Reactor ........................................................................... 21
2.2.2 Engine Test Cell ............................................................................... 27
2.3 Error Analysis .......................................................................................... 35

v
CHAPTER 3 LEAN SCR KINETIC MECHANISM ..................................... 36
3.1 NO Oxidation .......................................................................................... 36
3.1.1 Experimental Results ........................................................................ 37
3.1.2 NO Oxidation Modeling Results ....................................................... 43
3.2 NH3 Storage ............................................................................................. 47
3.2.1 NH3 Storage Experimental Results.................................................... 48
3.2.2 NH3 Storage Effects with Temperature ............................................. 51
3.2.3 NH3 Storage Kinetic Modeling ......................................................... 52
3.3 Selective Catalytic Oxidation of NH3 ....................................................... 54
3.3.1 NH3 Oxidation Experimental Results ................................................ 57
3.3.2 Selective Catalytic Oxidation of NH3 Modeling Results .................... 59
3.4 NOx Reduction with NH3 ......................................................................... 64
3.4.1 Background ...................................................................................... 64
3.4.2 Experimental Results ........................................................................ 69
3.4.3 NOx Reduction with NH3 Modeling Approach .................................. 80
3.5 Model Validation ..................................................................................... 86
3.5.1 Summary of Global SCR Mechanism ............................................... 87
3.5.2 Engine Validation ............................................................................. 89
3.5.3 Synthetic Gas Bench Validation ........................................................ 92
3.6 Conclusions ............................................................................................. 94
3.6.1 NO Oxidation Conclusions ............................................................... 95
3.6.2 NH3 Storage Conclusions.................................................................. 95
3.6.3 NH3 Oxidation Conclusions .............................................................. 96
3.6.4 NOx Reduction with NH3 Conclusions .............................................. 96
3.6.5 Model Validation Conclusions .......................................................... 97
CHAPTER 4 N2O PRODUCTION AND REACTIONS ................................ 99
4.1 Background.............................................................................................. 99

vi
4.2 Experimental Results ............................................................................. 101
4.2.1 N2O Production .............................................................................. 101
4.2.2 Effect of NH3 to NO2 Ratio on N2O Production .............................. 104
4.2.3 N2O Reaction with NH3 .................................................................. 105
4.2.4 N2O Conversion in Fast SCR Reaction ........................................... 105
4.3 N2O Production Effect on NO2 Reduction with NH3 .............................. 107
4.4 Suggested Modeling Approach .............................................................. 111
4.5 Conclusions ........................................................................................... 112
CHAPTER 5 EFFECT OF NH3 STORAGE ON NOX REDUCTION ......... 114
5.1 Model Validation Results ....................................................................... 114
5.2 Experimental Results ............................................................................. 118
5.3 Analysis and Results of Long Cycling Experiments ............................... 120
5.4 Proposed modifications to the kinetic rate form ...................................... 125
5.5 Conclusions ........................................................................................... 128
CHAPTER 6 EFFECT OF H2O AND CO2 ON SCR REACTIONS............ 130
6.1 NO Oxidation ........................................................................................ 132
6.2 NH3 Storage ........................................................................................... 132
6.2.1 NH3 Storage Modeling Approach for Varying Water Concentrations
135
6.3 NH3 Oxidation ....................................................................................... 143
6.4 NOx Reduction with NH3 ....................................................................... 144
6.5 Conclusions ........................................................................................... 145
6.5.1 NO Oxidation Conclusions ............................................................. 146
6.5.2 NH3 Storage Conclusions................................................................ 146
6.5.3 NH3 Oxidation Conclusions ............................................................ 146
6.5.4 NOx Reduction with NH3 Conclusions ............................................ 147
CHAPTER 7 EFFECT OF CO, H2, AND C3H6 ON SCR REACTIONS ..... 148

vii
7.1 Water Gas Shift...................................................................................... 150
7.2 H2, CO, and C3H6 Oxidation ................................................................... 151
7.2.1 H2 Oxidation ................................................................................... 151
7.2.2 CO Oxidation ................................................................................. 152
7.2.3 C3H6 Oxidation ............................................................................... 154
7.3 NOx Reduction with H2, CO, and C3H6 .................................................. 155
7.3.1 CO NOx Reduction ......................................................................... 159
7.3.2 H2 NOx Reduction .......................................................................... 160
7.3.3 C3H6 NOx Reduction ....................................................................... 164
7.4 NH3 Storage Effects with H2, CO, and C3H6 .......................................... 169
7.5 NH3 Oxidation Effects with H2, CO, and C3H6 ....................................... 171
7.6 NOx Reduction with NH3 Effects with H2, CO, and C3H6 ....................... 172
7.7 C3H6 Poisoning ...................................................................................... 177
7.7.1 Temperature Programmed Desorption with C3H6 ............................ 178
7.7.2 C3H6 / NO2 Lean Rich Switching Experiments................................ 179
7.8 Modeling Approach ............................................................................... 184
7.9 Conclusions ........................................................................................... 188
CHAPTER 8 CONCLUSIONS...................................................................... 189
8.1 NO Oxidation Summary ........................................................................ 192
8.2 Oxidation of H2, CO, and C3H6, and WGS ............................................. 193
8.3 Effect of H2, CO and C3H6 on NO and NO2 ........................................... 193
8.4 NH3 Storage Summary ........................................................................... 194
8.5 NH3 Oxidation Summary ....................................................................... 195
8.6 NOx Reduction with NH3 Summary ....................................................... 195
REFERENCES............................................................................................... 199

viii
LIST OF FIGURES
Figure 1.1 − Layout of the Eaton Aftertreatment System [19, 20]. ...................................7
Figure 1.2 – Contribution of integral NOx conversion of the LNT and SCR catalysts in
the EAS [20] ............................................................................................................7
Figure 2.1 – Shows the flow chart for the methodology of determining chemical reaction
and kinetic rate equations to be used in a validated kinetic mechanism ................... 13
Figure 2.2 − Steps of a Catalytic Reaction where: Cj is concentration of species, P is
products, R is reactants, Surf is on the catalyst surface, and Bulk is part of the bulk
flow [58]. .............................................................................................................. 15
Figure 2.3 − The layout of the synthetic exhaust reactor bench used to obtain
experimental data based on work by Klinkert et al. [66]. ........................................ 22
Figure 2.4 – Multiple measurements were taken to get an average wall thickness and
washcoat thickness of the SCR catalyst. ................................................................. 27
Figure 3.1 − The oxidation of NO to NO2 is a reversible reaction with the onset of
equilibrium chemistry to convert NO2 to NO and O2 at higher temperature. Results
are shown in temperature ramp experiments with stoichiometric ratios of feed gas
with 0% H2O and 0% CO2 in the feed gas. ............................................................. 37
Figure 3.2 − The oxidation of NO to NO2 is dependent on O2 concentration in the feed
gas, all experiments were performed as a temperature ramp with 6% H2O, 6% CO2,
and 1000 ppm NO in the feed gas .......................................................................... 38
Figure 3.3 − Experimental data matches a half order oxygen dependence for the oxidation
of NO to NO2, all experiments were performed as a temperature ramp with 6% H2O,
6% CO2, and 1000 ppm NO in the feed gas. ........................................................... 40
ix
Figure 3.4 − O2 concentration has negligible effects on NO2 conversion to NO. All
experiments were performed as a temperature ramp with 6% H2O, 6% CO2, and
1000 ppm NO2 in the feed gas. ............................................................................... 41
Figure 3.5 − From 0 – 6% water concentration in the feed gas can have large effects on
the oxidation of NO to NO2, while there is little effect on the oxidation of NO to
NO2 when comparing H2O concentration from 6 – 10%, all experiments were
performed with 6% O2, and 1000 ppm NO. ............................................................ 42
Figure 3.6 − From 0 – 6% water concentration in the feed gas can have large effects in
the reduction of NO2 to NO, while there is little effect in the reduction of NO2 to NO
when comparing H2O concentration from 6 – 10%, all experiments were performed
with 6% O2, and 1000 ppm NO. ............................................................................. 43
Figure 3.7 − Negligible amounts of NO2 storage capacity when performing a
Temperature Programmed Desorption (TPD) experiment (left). NO2 that does
adsorb rapidly converts to NO and does not store on the catalyst (right). The TPD
experiment was performed with a background of 8% H2O and 8% CO2. ................ 46
Figure 3.8 − Modeling results show good agreement for oxidation of NO to NO2,
modeling experiments were calibrated against a temperature ramp experiment with
8% H2O, 8% CO2, 6% O2, and 1000 ppm NO. ....................................................... 47
Figure 3.9 − TPD experiment highlighting the Inlet and Outlet NH3 storage area and an
experimentally determined single desorption peak. The TPD experiment was
performed with an inlet flow of 250 ppm NH3, 0% H2O, 0% CO2 in balance N2. ... 51
Figure 3.10 − Shows the integral NH3 storage capacity for the same brick, calculated by
integrating the storage capacity of TPD experiments performed at 225°C, 300°C,
350°C, and 400°C. Each experiment had the same inlet gas concentrations of 250
ppm NH3, 0% H2O, and 0% CO2. ........................................................................... 52
Figure 3.11 − Shows a slight increase in modeling accuracy when using the Tempkin
Isotherm Kinetics listed in equation (5-8). The modeling experiment was performed

x
with an inlet gas feed of 250 ppm NH3, 8% H2O, and 8% CO2 with an initial storage
temperature of 200°C ............................................................................................. 54
Figure 3.12 − NH3 oxidation temperature ramp experiment with an inlet feed gas of 6%
O2, 8% H2O, 8% CO2, and 1150 ppm NH3; yielded only negligible values of NO and
N2O for entire temperature range. .......................................................................... 57
Figure 3.13 − The conversion of NH3 due to oxidation increases as O2 levels in the feed
gas increase, with saturation effects shown when O2 concentration are greater than
2%. ........................................................................................................................ 58
Figure 3.14 – The average dependence of O2 on NH3 oxidation for all cases is 0.33, while
the average oxygen dependence for each individual case varies from 0.2 – 0.4. ...... 61
Figure 3.15 – Shows no discernable difference in modeling results for both kinetic rate
forms when compared with experimental data from a temperature ramp experiment
with a feed gas of 8% H2O, 8% CO2, 6% O2, and 1000 ppm NH3. .......................... 62
Figure 3.16 – Shows variation when comparing the kinetic rate forms with the saturation
kinetic model yielding higher accuracy when compared with experimental data from
a temperature ramp experiment with a feed gas of 8% H2O, 8% CO2, 2% O2, and
1000 ppm NH3. ...................................................................................................... 63
Figure 3.17 – Shows variation when comparing the kinetic rate forms with the saturation
kinetic model yielding higher accuracy when compared with experimental data from
a temperature ramp experiment with a feed gas of 8% H2O, 8% CO2, 0.5% O2, and
1000 ppm NH3. ...................................................................................................... 63
Figure 3.18 – NOx conversion is highly dependent on the NO:NOx ratio in the feed gas
when comparing experiments performed with a feed gas of 6% H2O, 6% CO2, 6%
O2, 400 ppm NH3, 400 ppm NOx. ........................................................................... 65
Figure 3.19 – Increasing the NH3 to NOx ratio increases NOx conversion while lowering
NH3 conversion which increases the amount of NH3 slip. All experiments are
performed as a temperature ramp with a feed gas of 6% H2O, 6% CO2, 6% O2, 400

xi
ppm NOx, varying NH3 concentration (a) NO:NOx = 1.0, (a) NO:NOx = 0.5, (c)
NO:NOx = 0.0. ....................................................................................................... 71
Figure 3.20 – NOx conversion is a strong function of O2 concentration only when the
composition of NOx in the feed gas favors NO. The experiments were performed
with a feed gas composition of 8% H2O, 8% CO2, 1000 ppm NH3, 1000 ppm NOx,
varying O2 concentration (a) NO:NOx = 1.0, (b) NO:NOx = 0.5, (c) NO:NOx = 0.0 72
Figure 3.21 – NOx conversion is a strong function of O2 concentration for all experiments
performed with a feed gas composition of 8% H2O, 8% CO2, 400 ppm NH3, 400
ppm NOx, varying O2 concentration ....................................................................... 73
Figure 3.22 – The dependence on O2 is not constant and therefore is not independent of
temperature. ........................................................................................................... 75
Figure 3.23 – NH3 stores on catalyst during rich pulse, NOx reacts with stored NH3 on
lean pulse. The experiment was performed as a lean rich cycling bench experiment
for 50 sec cycle length at constant temperature of 250°C and a feed gas with 8%
H2O, and 8% CO2. ................................................................................................. 76
Figure 3.24 – Integral NOx conversion decreases as temperature increase above 300°C,
due to the limited ability to store NH3 at high temperatures in switching
experiments. All experiments are performed with a rich pulse of 8% H2O, 8% CO2,
1000 ppm NH3; and a lean pulse of 8% H2O, 8% CO2, 150 ppm NOx, with varying
NO to NOx ratios. .................................................................................................. 77
Figure 3.25 – Upward and downward temperature ramps differ with a small hysteresis
effect between 350–450°C, additionally NOx conversion changes differ at low
temperatures due to the onset of nitrate formation. The experiment was performed
as an upward and then downward temperature ramp with a feed gas of 6% H2O, 6%
CO2, 6% O2, 1000 ppm NH3, and 1000 ppm NO. ................................................... 79

xii
Figure 3.26 – Negligible hysteresis effect on NOx conversion for Fast SCR reaction. The
experiment was performed as an upward and downward temperature ramp with 6%
H2O, 6% CO2, 0% O2, 1000 ppm NH3, 500 ppm NO, 500 ppm NO2. ..................... 79
Figure 3.27 – Large hysteresis effect in NOx conversion for Slow SCR reaction at low
temperatures due to the nitrate formation on the catalyst. The experiment was
performed as an upward and downward temperature ramp with 6% H2O, 6% CO2,
0% O2, 1000 ppm NH3, 750 ppm NO2. ................................................................... 80
Figure 3.28 – The model for the Rich Standard SCR reaction accurately predicts the NH3
and NO concentrations for a temperature ramp experiment with feed gas of 8% H2O,
8% CO2, 0% O2, 1000 ppm NH3, 1000 ppm NO .................................................... 81
Figure 3.29 – NO Conversion is low without O2 present in feed gas, standard Arrhenius
rate kinetics capture this effect well. ...................................................................... 82
Figure 3.30 – The first order kinetic O2 approximation is more accurate for NO
predictions while the saturation kinetic O2 approximation is more accurate for NH3
predictions. Each experiment was performed as a temperature ramp experiment
with feed gas of 8% H2O, 8% CO2, 1000 ppm NH3, 1000 ppm NO, with O2
concentration as listed ............................................................................................ 84
Figure 3.31 – Simulation prediction for NOx conversion and NH3 conversion is within
error for 200°C – 450°C. The experiment was performed as a temperature ramp
with 8% H2O, 8% CO2, 0% O2, 1140 ppm NH3, 540 ppm NO, 268 ppm NO2. ....... 85
Figure 3.32 – Simulation predicts NOx and NH3 conversion within error NO2 conversion
with NH3. The experiment was performed as a temperature ramp with 8% H2O, 8%
CO2, 0% O2, 1110 ppm NH3, 800 ppm NO2. ......................................................... 86
Figure 3.33 – The average SCR catalyst temperature varies from 370°C to 420°C during
regeneration cycling of the EAS. ............................................................................ 89
Figure 3.34 – Experimental and Simulation outlet species show acceptable agreement for
(a) NO, (b) NO2, and (c) NH3. ................................................................................ 91

xiii
Figure 3.35 – Low levels of H2, THC, and CO were present at the inlet of the SCR when
engine validation data was measured. ..................................................................... 92
Figure 3.36 – Simulation data under predicts integral NOx conversion under 400°C when
compared to the Experimental data when (a) NO:NOx = 1.0; while simulation data
over predicts integral NOx conversion under 350°C when compared to the
experimental data for (b) NO:NOx = 0.5 . .............................................................. 93
Figure 3.37 – The amount of stored NH3 on the catalyst plays are large role in NOx
reduction capabilities during lean rich cycling experiments for (a) NO:NOx = 1.0,
Temperature =200°C, (b) NO:NOx = 1.0, Temperature =400°C, (c) NO:NOx = 0.5,
Temperature =200°C, (d) NO:NOx = 1.0, Temperature =400°C ............................. 94
Figure 4.1 – Significant N2O levels are seen when the NO to NOx ratio favors NO2, All
experiments are performed as a temperature ramp with feed gas composition of 6%
H2O, 6% CO2, 6% O2, 400 ppm NH3, 400 ppm NOx, with an NO to NOx ratio equal
to (a) 1.0, (b) 0.75, (c) 0.5 (d) 0.25, and (e) 0.0. .................................................... 103
Figure 4.2 − N2O production is the highest when there is an equal amount of NH3 and
NO2 in the feed gas. The experiments were performed as a temperature ramp with
6% H2O, 6% CO2, 0% O2, 400 ppm NOx, and varying NH3 concentration in the feed
gas. ...................................................................................................................... 104
Figure 4.3 − N2O conversion with NH3 is negligible below 350°C. The experiment was
performed as a temperature ramp with 6% H2O, 6% CO2 and listed NH3 and N2O
concentrations in the feed gas............................................................................... 105
Figure 4.4 − The addition of NO in the feed gas of NH3 and N2O does not increase the
conversion of NOy. The experiments were performed as a temperature ramp with
6% H2O, 6% CO2, and listed values of NH3, NO, and N2O. ................................. 107
Figure 4.5 – Summary of NOx conversion pathways for reactions with NO2 and NH3.
The experiment was performed as a temperature ramp with 6% H2O, 6% CO2, 1000
ppm NH3, and 750 ppm NO2, in the feed gas. ....................................................... 109

xiv
Figure 4.6 − The Slow SCR reaction cannot be neglected due the combination of other
reactions not equaling the conversion of NOx for NO2 reduction with NH3. The
experiment was performed as a temperature ramp with 6% H2O, 6% CO2, 1000 ppm
NH3, and 750 ppm NO2, in the feed gas. .............................................................. 111
Figure 5.1 – Simulation data under predicts integral NOx conversion under 400°C when
compared to the Experimental data when (a) NO:NOx = 1.0; while simulation data
over predicts integral NOx conversion under 350°C when compared to the
experimental data for (b) NO:NOx = 0.5. .............................................................. 116
Figure 5.2 – The amount of stored NH3 on the catalyst plays are large role in NOx
reduction capabilities during lean rich cycling experiments for NO:NOx = 1.0,
Temperature =400°C. ........................................................................................... 117
Figure 5.3 − NH3 stores on catalyst during rich pulse, NOx reacts with stored NH3 on lean
pulse. The experiment was performed as a lean rich cycling bench experiment for
50 sec cycle length at constant temperature of 250°C and a feed gas with 8% H2O,
and 8% CO2. ........................................................................................................ 118
Figure 5.4 − Example of a long switching experiment where the catalyst will saturate
with NH3 during a 2 minute rich pulse, then measure the conversion of NOx from the
feed gas during the 8 minute lean pulse. ............................................................... 120
Figure 5.5 – By non-dimensionalizing NOx conversion vs. the surface coverage fraction
of NH3, all 10 cycles can be collapsed to form one trendline to characterize the
effect of stored NH3 on NOx conversion. Each cycle was performed with a rich
pulse of 2 minutes with 1000 ppm NH3, 6% H2O, and 6% CO2, and a lean pulse of 8
minutes with 400 ppm NO2, 6% O2, 6% H2O, and 6% CO2 in the feed gas at a
constant temperature of 325°C. ............................................................................ 122
Figure 5.6 − NOx conversion is highly dependent on the surface coverage fraction of
NH3. Experiments performed with lean pulse (a) NO:NOx = 0.0, (b) NO:NOx = 0.5,
(c) NO:NOx = 1.0. ................................................................................................ 123

xv
Figure 5.7 − NOx conversion is based on a linear prediction in the current kinetic
mechanism. Modeling predictions are based on a NO:NOx of (a) 1.0, (b) 0.5, (c) 0.0
............................................................................................................................ 125
Figure 5.8 − Determination of the dependence on the surface coverage fraction of NH3
can be determined based on experimental data for (a)NO:NOx = 0.0, (a)NO:NOx =
0.5, (c)NO:NOx = 1.0 ........................................................................................... 127
Figure 6.1 − Shows how H2O and CO2 concentration increase from 6% to 15% as
equivalence ratio increases. .................................................................................. 131
Figure 6.2 − From 0 – 6% water concentration in the feed gas can have large effects on
the oxidation of NO to NO2 and reduction of NO2 to NO and O2, while there is little
effect on the the forward and reverse reaction when the concentration of H2O is
varied from 6 – 10%, all experiments were performed with 6% O2, and 1000 ppm
NO. ...................................................................................................................... 132
Figure 6.3 − Shows H2O concentration has a larger effect on NH3 storage capacity then
CO2 concentration ................................................................................................ 134
Figure 6.4 − Shows a saturation of the catalyst by H2O that will not have major effects on
NH3 storage capacity. ........................................................................................... 135
Figure 6.5 – NH3 storage capacity decreases as temperature increases, and as H2O
concentration increases. ....................................................................................... 135
Figure 6.6 − Comparison of experimental and simulation data for a TPD experiment with
0% H2O and 0% CO2 in the feed gas. ................................................................... 137
Figure 6.7 − Model shows acceptable agreement with experimental data for total NH3
storage capacity under varying storage temperatures for experiments with 0% H2O
and 0% CO2. ........................................................................................................ 138
Figure 6.8 − Storage capacity of NH3 is decreased when CO2 and H2O levels are
increased at each initial storage temperature. ........................................................ 139

xvi
Figure 6.9 – Accuracy is comparable for the two kinetic approaches however the NH3
H2O Competition approach follows catalyst saturation data with more accuracy.
The experiment was performed with 6% H2O, 6% CO2, and 250 ppm NH3 in the
feed gas with an initial storage temperature of 300°C. .......................................... 141
Figure 6.10 – The original Tempkin Isotherm kinetic approach to NH3 storage capacity
only varies with the initial storage temperature, while the NH3 H2O Competition
kinetic approach allows for changes in NH3 storage capacity based on temperature
and H2O concentration. ........................................................................................ 143
Figure 6.11 − Negligible changes in NH3 conversion in oxidation experiments when H2O
and CO2 concentrations are varied from 6% – 10% in the feed gas with 1000 ppm
NH3, and 6% O2. .................................................................................................. 144
Figure 6.12 − NOx conversion does not change with as H2O and CO2 concentrations
increase. Experiments were performed as a temperature ramp with 6% O2, 1000
NH3, and 1000 NO varying H2O and CO2 concentration feed gas (a) NO:NOx = 1.0,
(b) NO:NOx = 0.5, (c) NO:NOx = 0.0 .................................................................. 145
Figure 7.1 − Calculated integral NOx conversion for (a) NO:NOx=0.5 and (b)
NO:NOx=1.0 shows a slight increase in integral NOx conversion when 1% H2 and
1% CO are in rich pulse, and a significant hydrocarbon poisoning effect when 1%
H2, 1% CO, and 1% C3H6 is in rich pulse. Each experiment is run with a 5 sec rich
pulse with 8% H2O, 8% CO2, and 1000 ppm NH3, then a 45 sec lean pulse with 8%
H2O, 8% CO2, 6% O2, and 150 ppm NOx with temperature held constant for 6
cycles. .................................................................................................................. 149
Figure 7.2 – Results from Bohac [154] indicate that large amounts of H2, CO, and
hydrocarbons can be present in the feed gas during a NOx regeneration event at the
inlet of the LNT. .................................................................................................. 150
Figure 7.3 − Experimental data shows no water gas shift reaction in either direct ion
across the Fe based SCR catalyst for entire temperature operation range .............. 151

xvii
Figure 7.4 – The oxidation of hydrogen to water is negligible on the Fe-based SCR
catalyst in the EAS. Results are shown for a temperature ramp experiment with 8%
H2O, 8% CO2, 6% O2, and 1% H2 in the feed gas. ................................................ 152
Figure 7.5 − There is a negligible oxidation effect of CO to CO2 on the Fe-based SCR
catalyst in the EAS. Results are shown for a temperature ramp experiment with 8%
H2O, 8% CO2, 6% O2, and 1% CO in the feed gas. ............................................... 153
Figure 7.6 – The oxidation of C3H6 is a strong function of temperature with a maximum
conversion of C3H6 around 40%. The experiment was performed as a temperature
ramp with a 6% H2O, 6% CO2, 6% O2, and 0.6% C3H6 in the feed gas. ................ 154
Figure 7.7 – The oxidation of C3H6 is a strong function of temperature that yields a large
amount of CO as the temperature increases. The experiment was performed as a
temperature ramp with a 6% H2O, 6% CO2, 6% O2, and 0.6% C3H6 in the feed gas.
............................................................................................................................ 155
Figure 7.8 − NOx conversion for each reductant (H2, CO, and C3H6) is similar when the
feed gas is NO or NO2 as the composition of NOx. The NO2 reduction experiments
were performed with 10% H2O, 10% CO2, 0% O2, 1000 ppm NO2, and varying H2,
CO, and C3H6 concentration; while the NO reduction experiments were performed
with 8% H2O, 8% CO2, 6% O2, and 1000 ppm NO, and varying H2, CO, and C3H6
concentration. ...................................................................................................... 157
Figure 7.9 − All reductants will increase the conversion of NO2 to NO compared to
thermal decomposition alone. The experiments were performed with 10% H2O,
10% CO2, 0% O2, 1000 ppm NO2, and varying H2, CO, and C3H6 concentrations.
............................................................................................................................ 158
Figure 7.10 − NO2 conversion with CO is mostly due to NO2 conversion to NO with less
than 5% of the NO being converted to N2. The experiment was performed with 10%
H2O, 10% CO2, 0% O2, 1000 ppm NO2, and 1% CO. ........................................... 159

xviii
Figure 7.11 − CO increases NO2 conversion to NO as concentration of CO increases. The
experiments were performed with 10% H2O, 10% CO2, 0% O2, 1000 ppm NO2, and
varying CO concentration. ................................................................................... 160
Figure 7.12 − NO2 conversion with H2 primarily due to NO2 conversion to NO with up to
7% of NOx converted to N2. The experiments were performed with 10% H2O, 10%
CO2, 0% O2, 1000 ppm NO2, and 1% H2. ............................................................. 161
Figure 7.13 − H2 increases NO2 conversion as concentration of H2 increases. The
experiments were performed with 10% H2O, 10% CO2, 0% O2, 1000 ppm NO2,
and varying H2 concentration. ............................................................................. 162
Figure 7.14 − H2 and NO will combine to form NH3, which can be used in NOx
conversion. The experiment was performed with 8% H2O, 8% CO2, 0% O2, 1000
ppm NO2, and 1% H2. .......................................................................................... 163
Figure 7.15 − Up to 5% of the NO will combine with H2 to form NH3. The experiment
was performed with 8% H2O, 8% CO2, 0% O2, 1000 ppm NO2, and 1% H2. ....... 164
Figure 7.16 – The conversion of NO by C3H6 is low and highly dependent on the amount
of C3H6 in the feed gas. The experiments were performed as a temperature ramp
with 8% H2O, 8% CO2, 6% O2, 1000 ppm NO, and varying C3H6 concentrations.
............................................................................................................................ 165
Figure 7.17 − C3H6 will be strongly oxidized by NO2 converting significantly more NO2
to NO then thermal decomposition alone. The experiments were performed as a
temperature ramp with a feed gas composition of 10% H2O, 10% CO2, 0% O2, 1000
ppm NO2, and varying C3H6 concentration. .......................................................... 166
Figure 7.18 − C3H6 will convert NOx at lower temperatures when larger concentrations of
C3H6 are present. The experiments were performed as a temperature ramp with a
feed gas composition of 10% H2O, 10% CO2, 0% O2, 1000 ppm NO2, and varying
C3H6 concentration. ............................................................................................. 166

xix
Figure 7.19 − C3H6 is the most reactive species with NO2, where most NO2 will be
converted to NO. The experiments is performed as a temperature ramp with a feed
gas composition of 10% H2O, 10% CO2, 0% O2, 1000 ppm NO2, and 0.6% C3H6.
............................................................................................................................ 167
Figure 7.20 – C3H6 and NO2 will react to form CO; however the concentration does not
increase as C3H6 concentration increases. The experiments were performed as a
temperature ramp with 6% H2O, 6% CO2, 1000 ppm NO2, and varying C3H6
concentration in the feed gas. ............................................................................... 168
Figure 7.21 – NOx conversion with C3H6 is higher at low temperatures when the NOx
composition is all NO2 in the feed gas, but as temperature increases NOx conversion
converges for a NOx composition of all NO in the feed gas with the experiment with
a NOx composition of all NO2 in the feed gas. ...................................................... 169
Figure 7.22 − NH3 storage capacity isn’t affected by H2, CO or C3H6 in the feed gas. All
experiments were performed with 10% H2O and 10% CO2 in the feed gas. .......... 170
Figure 7.23 – H2 and CO in the feed gas do not influence the conversion of NH3 due to
oxidation, however the addition of C3H6 strongly increases the conversion of NH3
due to oxidation. All experiments were performed with a feed gas concentration of
8% H2O, 8% CO2, 6% O2, and 1000 ppm NH3. .................................................... 171
Figure 7.24 – NOx conversion is highly dependent on the NO:NOx ratio in the feed gas
when comparing experiments performed with a feed gas of 6% H2O, 6% CO2, 6%
O2, 400 ppm NH3, 400 ppm NOx. ......................................................................... 173
Figure 7.25 − NOx conversion is strongly affected at high temperatures when H2, CO, and
C3H6 are in the feed gas. All experiments are performed with 6% H2O, 6% CO2, 6%
O2, 1000 ppm NH3, and 1000 ppm NO in the feed gas. ........................................ 174
Figure 7.26 − NOx conversion is strongly affected as temperature increases when H2, CO,
and C3H6 are in the feed gas. All experiments are performed with 6% H2O, 6%
CO2, 0% O2, 1000 ppm NH3, 500 ppm NO, and 500 ppm NO2 in the feed gas. .... 175

xx
Figure 7.27 − NOx conversion is affected by H2, CO, and C3H6 by converting NO2 to NO
which can increase NOx conversion by favoring the Fast SCR reaction when the NO
to NOx ratio favors NO2. All experiments are performed with 6%H2O, 6% CO2, 0%
O2, 1000 ppm NH3, and 1000 ppm NO2 in the feed gas. ....................................... 176
Figure 7.28 − Integral NOx conversion is changes are negligible when H2 and CO are in
the rich pulse, while C3H6 present will decrease the integral NOx conversion when
present in the rich pulse. All experiments are performed with a rich pulse of 8%
H2O, 8% CO2, 1000 ppm NH3; and a lean pulse of 8% H2O, 8% CO2, 150 ppm NOx,
with (a) NO:NOx = 1.0 and (b) NO:NOx = 0.5. ..................................................... 177
Figure 7.29 – Shows an example of (a) catalyst during normal operation, and (b) a
catalyst that has been gone through coking after experiments with high levels of
C3H6. ................................................................................................................... 178
Figure 7.30 − C3H6 storage is low when finding storage capacity with a Temperature
Programmed Desorption (TPD) experiment. The experiment was performed with a
feed gas of 10% H2O, 10% CO2, and 350 ppm C3H6. ........................................... 179
Figure 7.31 − C3H6 will store on the catalyst then oxidize with NO2 to form NO at all
temperatures. All experiments are performed while switching from a lean feed gas
6% H2O, 6% CO2, and 1000 ppm NO2 for 780 seconds; and a rich feed gas of 6%
H2O, 6% CO2, and 0.6% C3H6 for 120 seconds at constant temperature of (a)
T=225°C, (b) T=275°C, (c) T=325°C, (d) T=375°C, (e) T=425°C, and (f) T=475°C.
............................................................................................................................ 180
Figure 7.32 − Stored C3H6 has negligible conversion of NO on the catalyst. ................ 182
Figure 7.33 − Summarizes the increase over thermal decomposition of NO2 to NO, when
compared to the conversion of NO2 to NO when C3H6 is stored on the catalyst. ... 183
Figure 7.34 − Shows calculated values of C3H6 storage on the catalyst, calculated from
the experiments shown in Figure 7.31. ................................................................. 184

xxi
LIST OF TABLES
Table 1.1 − Summary of literature global chemical reactions for the Selective Catalytic
Reduction of NOx with NH3 in lean exhaust conditions. ...........................................9
Table 2.1 − Shows where all gas thermal fluid properties are determined ....................... 19
Table 2.2 – Full flow of each MFC and respective concentration of gas cylinder each
MFC is connected to. ............................................................................................. 23
Table 2.3 – Accuracy of species measureable by the MKS FTIR ................................... 25
Table 2.4 – Shows the Engine Specifications for the 6.4L International V8 engine ........ 28
Table 2.5 − Shows the error associated with the AVL CEB II Emissions bench readings
based on instrument specifications ......................................................................... 32
Table 2.6 – Shows the specifications for the AVL ELIN series 100 APA Asynchronous
Dynamometer ........................................................................................................ 33
Table 2.7 – Shows the error associated with intake air mass flow rate readings .............. 34
Table 3.1 − Summary of chemical reaction and kinetic rates for lean SCR model .......... 87
Table 3.2 − Summary of kinetic parameters used in the lean SCR model kinetic model . 88
Table 5.1 − Summary of chemical reaction and kinetic rates for lean SCR model from
literature and experimental sources. ..................................................................... 115
Table 5.2 − Summary of chemical reaction and kinetic rates for lean SCR model with
new dependence of the surface coverage fraction of NH3. .................................... 129
Table 6.1 − Parameters developed to model the reaction described by equation (6.3) ... 137
Table 6.2 – Test matrix for a total of 8 experiments to calibrate the H2O competition on
catalyst surface .................................................................................................... 139
xxii
Table 6.3 − Parameters developed to model the reaction expression derived from
equation (6.4). ...................................................................................................... 140
Table 7.1 − Summary of chemical reaction and kinetic rates for lean SCR model with
new dependence of the surface coverage fraction of NH3 and H2O competition with
NH3 for storage. ................................................................................................... 185
Table 7.2 − Summary of chemical reaction and kinetic rates for reactions determined
from effects on NO, NO2, O2, and NH3 from H2, CO, and C3H6. .......................... 186
Table 7.3 − Summary of chemical reaction and kinetic rates for lean SCR model with
new dependence of the surface coverage fraction of NH3, H2O competition with
NH3 for storage, and reactions determined from effects on NO, NO2, O2, and NH3
from H2, CO, and C3H6. ....................................................................................... 187
Table 8.1 − Summary of chemical reaction and kinetic rates for lean SCR model with
new dependence of the surface coverage fraction of NH3, H2O competition with
NH3 for storage, and reactions determined from effects on NO, NO2, O2, and NH3
from H2, CO, and C3H6. ....................................................................................... 191

xxiii
NOMENCLATURE
g = density of the gas phase (kg/m3)
gv = velocity of the gas phase (m/s)
t = time (s)
z = spatial coordinate in axial direction (m)
gP = pressure of the system (Pa)
= Fanning friction factor (based on shape of monoliths)
hydd = hydraulic diameter (m)
= friction factor (based on Reynolds number)
,k gw = mass fraction of species k
g = open frontal area (m3/m
3)
effD = effective diffusion coefficient
,i k = stoichiometric coefficients
,L
k sr c T = molar reaction rate of the catalytic surface reactions with (mol/m3*s)
L
kc = concentration of species k at catalyst surface
gT = gas temperature (K)
sT = surface temperature (K)
kh = enthalpy of component k (kJ/kg)
g = thermal conductivity (W/m*K)
transa = total channel surface area per unit substrate volume (1/m)
hk = convective coefficient (W/m2*K)
ih = heat of reaction of catalytic surface reactions (kJ/m2)
radq = heat loss to surroundings (W/m3)

xxiv
s = catalyst thermal conductivity (W/m*K)
,k mk = mass transfer coefficient for species k
,k gc = molar concentration of species k in bulk gas (kmol/m3)
k = surface coverage fraction of species k
= site density
Re = Reynolds Number
Pr = Prandtl Number
Sc =Schmidt Number
kiv = reactants species stoichiometric coefficient
kiv = products species stoichiometric coefficient
k = chemical symbol
kiv = reaction stoichiometric coefficient
ir = rate of production of species k
iq = reaction rate
fiK = forward reaction rate coefficient
riK = reverse reaction rate coefficient
,k gc = concentration of species k
k = Arrhenius pre-exponential (units vary, kmol/m3*s)
T = temperature (K)
b = temperature exponential
E = activation energy (J/kmol)
R = universal gas constant (J/mol*K)
m = mass flow rate (g/s)
DP = different pressure (in H2O)
B = calibration constant
C = calibration constant
std = 191.87 (mp) = standard viscosity

xxv
f = air viscosity at actual air temperature and humidity (mp) [from look up table]
std = 0.07488 (lb/ft3) = standard density
wet
dry
= density ratio determined from air temperature and humidity [from look up table]
fT = actual air temperature (K)
stdT = 294.25 (K) = standard temperature
fP = ambient air pressure (kPa)
stdP = 101.3 (kPa) = standard pressure
Ae = error in measurement A
Resolutione = error in resolution
= standard deviation

xxvi
ABSTRACT
To assist with SCR catalyst sizing and optimization of LNT-SCR aftertreatment
systems, a predictive kinetic model is needed. In this dissertation, an iron based zeolite
SCR catalyst has been used in a reactor bench to simulate cycling between lean rich
exhaust conditions across the catalyst. Steady-state lean SCR kinetic mechanisms were
studied with special attention given to quantifying the effects of oxygen on the lean SCR
reactions. From these studies, a prominent reaction between NH3 and N2O under lean
conditions has been discovered. Additionally it was found that kinetic rate forms from
literature are inadequate due to their inability to capture the strong non-linear relationship
between NOx conversion and the amount of stored NH3 on the catalyst. Due to the
switch from lean to rich exhaust from the regeneration of the LNT, the effects of varying
H2O and CO2 concentrations have been studied for the purposed lean SCR reactions. It
was found that H2O strongly affects the storage capacity of NH3 on the SCR catalyst.
From these results an additional reaction has been proposed to capture the effect of H2O
on NH3 storage. The affects of H2, CO, and C3H6 were studied to understand their roles
in rich exhaust conditions. Experimental results have allowed the water gas shift
reaction, the oxidations of H2 and CO, and reactions between NO and H2, CO, or C3H6 to
be disregarded. It was observed that H2, CO, and C3H6 have strong reactions with NO2
yielding the need to include a reaction for each reductant with NO2 in the kinetic
mechanism. It was determined that these reactions with NO2 can inhibit NOx conversion
on the SCR catalyst by affecting the NO to NOx ratio at the catalyst, which can be
accounted for using NO2 reactions with CO, H2, and C3H6. It was also observed that the
oxidation of C3H6 will strongly increase the oxidation of NH3 which have been accounted

xxvii
for in a global reaction. CO and H2 storage on the catalyst is negligible while C3H6 has
been found to store on the catalyst by a non-traditional method to determine the storage
of C3H6.

1
CHAPTER 1
INTRODUCTION
During our lifetimes we have seen the price of oil continue to rise. This has
created a high demand for more fuel efficient cars. One popular opinion that exists today
has been to move from spark ignition (SI) engines to diesel (CI) engines, especially in
passenger cars [1].
Diesel engines operate using compression ignition and have shown great
advancement in durability and operation during the last decade. In certain Europe
countries, 80% of automobiles contain diesel engines. This is largely due to taxes
imposed on engine displacement and fuel in Europe [2, 3]. Diesel engines offer an
increase in torque when compared to an equal displacement spark ignition engine. This
allows a smaller displacement diesel engine to take the place of a spark ignition engine.
With a smaller displacement, engine fuel economy will be increased. When compared to
spark-ignition engines, diesel engines also increase fuel economy by utilizing higher fuel
conversion efficiencies, higher compression ratios, and by operating under lean
conditions. Due to these enhancements, diesel engines will use approximately two thirds
of the fuel of an equivalent SI will use under normal operating conditions [4].
While there can be significant gains by using diesel engines, emissions have
proven problematic in these engines. Diesel engines utilizes high compression ratios and
lean air-fuel mixtures to increase thermal efficiency; however the combination of these
will lead to an increase in NOx formation [4]. While operating at higher compressions

2
knock is limited by controlling combustion timing, which is done by directly injecting
fuel into the cylinder during the compression stroke. Direct injection of fuel will lead to
stratification of the air-fuel mixture in the cylinder, which typically increases particulate
matter (PM) and hydrocarbon (HC) emissions. Traditional spark-ignition engine are less
efficient, but are widely used due to the ease with which they control emissions. SI
engines utilize combustion strategies to control PM emissions, and operate at a
stoichiometric fuel air mixture which allows the use of a Three-Way Catalyst (TWC) to
simultaneous reduce CO, HC, and NOx emissions by using NOx to oxidize CO and HC
emissions [5, 6]. Due to the lean combustion characteristics of diesel engines, multiple
catalytic devices are required to reduce all problematic species [4, 7, 8].
1.1 CO and HC Emissions Control
Until 2003, emissions standards were met by utilizing in cylinder strategies;
which include adjusting injection timing and adding EGR. In 2004 aftertreatment
devices became the most cost effective way to simultaneously meet CO, HC, NOx, and
PM emissions standards [2]. Initially TWC catalysts were tried, where it was found that
TWC catalysts will only effect HC and CO emissions through oxidation with the excess
oxygen in the exhaust stream. From the initial work using TWC catalysts on diesel
engines, new formulations were proposed commonly referred to as Diesel Oxidation
Catalysts (DOC). DOCs operate by using oxygen in warm diesel engine exhaust to
induce reactions in non-oxidized exhaust species (CO and HC); however it should be
noted that a DOC will not remove any NOx from the exhaust stream but can reduce
volatiles which can reduce PM emissions [9, 10].

3
1.2 PM Emissions Control
Once CO and HC emissions problems were solved with DOCs, efforts started to
reduce NOx and PM emissions. Simultaneous NOx and PM reduction with in cylinder
combustion strategies have proven difficult with limited operating ranges, and complex
control schemes. A Diesel Particulate Filter (DPF) has proven effective and is currently
being used to reduce PM emissions [11-13]. A DPF system works as a filter in the
exhaust stream capturing and storing PM on the surface while letting the flow of gas
phase species continue. As the DPF becomes full the back pressure in the exhaust system
will increase, which will trigger a regeneration cycle where the catalyst temperature is
increased until all the differential pressure of the DPF decreases to an acceptable level.
The common method to increase the temperature of the DPF is to inject fuel into the
exhaust stream. The major concerns when using a DPF are the increase in back pressure
in the exhaust system, the fuel economy penalty or the regeneration cycle, and the
longevity of the DPF due to temperature cycling. Recently DPFs have been combined
with DOC catalysts commonly called a catalyzed DPF (cDPF). This catalyst stores
oxygen on the surface to help with regenerations as well as oxidizes hydrocarbon and CO
emissions in the tailpipe [14].
1.3 NOx Emissions Control
1.3.1 Hydrocarbon Selective Catalytic Reduction
CO, HC, and PM emissions have proven less problematic by utilizing a DOC and
a DPF (or cDPF), however as emissions regulations tighten NOx emissions have proven
to be especially problematic. Three competing technologies have been suggested to
reduce NOx emissions levels. Hydrocarbon Selective Catalytic Reduction (HC SCR)
was the first to be studied due to its ability to simultaneously reduce CO, HC and NOx
emissions. The HC SCR systems works by storing and partially oxidizing the HC in the

4
exhaust and reacting the resulting products with NOx produced by the engine to produce
N2. If more HC is needed in the exhaust additional fuel is injected, which results in a
fuel economy penalty. Most manufacturers are not using HC SCR aftertreatment devices
due to a very limited temperature range, and an increasing fuel economy penalty as
emissions standards become lower [15].
1.3.2 Lean NOx Trap
The Lean NOx Trap (LNT) catalyst system has been investigated as an alternative
to HC SCR technology. The LNT system works by storing NOx molecules on a catalyst
during normal lean engine operation, the stored NOx is then reduced by periodically
switching to rich exhaust reducing conditions. The rich exhaust reducing conditions have
large H2, CO, and small HC concentrations along with low oxygen concentrations which
are generated by fuel reforming or rich engine operation. The reductants formed during
rich exhaust conditions are oxidized by the stored NOx on the catalyst to regenerate the
catalyst by allowing for more storage potential of NOx. This catalyst technology has
been used in smaller diesel engines under 2.5L due to their ability to meet emissions
regulations without carrying additional reductant on board. However, because the LNT
catalysts are precious metal based they have proven cost prohibitive on heavy duty diesel
engines. Additionally, LNTs are also very susceptible to sulfur poisoning and must use
low sulfur fuels, and LNT catalysts also pose a fuel economy penalty to meet emissions
standards.
1.3.3 Ammonia Selective Catalytic Reduction
Selective Catalytic reduction with ammonia (NH3 SCR) is the final option for
catalytic NOx reduction. Due to the potential toxicity concerns of storing NH3 directly on
board a vehicle, an aqueous form of NH3 called urea is commonly used as the onboard

5
reductant. As a standalone system, the reduction of NOx with a NH3 SCR system is a two
step process. The first injects urea into the exhaust system upstream of the SCR catalyst
[16]. While in the exhaust stream the urea will thermally decompose to NH3 and CO2
[17]. As the NH3 molecules reach the SCR catalyst, reactions with the surface will allow
NH3 to reduce NOx to N2 and H2O. One of the main benefits of using a NH3 SCR
system to lower NOx production is that it allows the engine to be optimized for fuel
economy by reducing the amount of in-cylinder NOx control needed. The potential
savings could allow a payback time for the system in a range of one to two years at
current (oil, urea, etc.) prices [2, 18]. The drawbacks to using a NH3 SCR include
creating an infrastructure for refilling urea tanks, the high susceptibility to HC and sulfur
poisoning, the high freezing temperature of urea (11ºC), the large overall size of the
catalyst system needed due to the additional space required to store the reductant onboard
the vehicle, the price of an injection system for urea, for safety concerns urea must be
used as the onboard reductant which will increase of CO2 emissions by 1 – 2% [2, 3].
While the actual catalyst is significantly cheaper then LNT or HC SCR catalysts, due to
the high cost of the urea injection systems and the space requirements of the additional on
board reductant for the NH3 SCR system; it has been found that NH3 SCR systems are
ideal for heavy duty diesel engine applications (engines larger than 10L).
1.3.4 Combination Systems
When examining medium duty engines between 2.5 L and 10 L, LNT and NH3
SCR aftertreatment options are debated since both are cost competitive. It has been
proposed that a combination of an LNT and an NH3 SCR (LNT-SCR) system might
allow for the most cost and space effective solution for NOx control. The LNT-SCR
system operates by increasing the regeneration time on the LNT catalyst where H2 can
combine with stored NOx to form NH3 which can then be stored on the SCR catalyst to
6
be used to reduce any NOx that slips by the LNT. An additional benefit is gained where
the SCR will reduce the ammonia generated by the LNT which can be a concern for
emissions regulations. The LNT-SCR removes the need for a second on board reductant
since onboard fuel can be used to reduce NOx on the LNT or be converted to NH3 where
it can be used to convert NOx on the SCR. The LNT-SCR also provides the ability to
reduce the size of the LNT which saves money due to the high cost of the catalyst.
The Eaton Aftertreatment System (EAS)
An example of a LNT-SCR catalyst system used for this dissertation is the Eaton
Aftertreatment System (EAS), which has been designed to reduce all regulated emissions
for a 2007 compliant engine to make it 2010 compliant for a medium duty diesel engine.
The EAS (Figure 1.1) is a system of four catalysts that uses onboard reductant (fuel) to
reduce NOx and PM emissions. During normal operation the fuel reformer (REF)
catalyst is used to oxidize CO and HC, the LNT is used to store NOx, the DPF is used to
store PM emissions, and the SCR uses stored NH3 to reduce any NOx that slips by the
LNT. Once the LNT catalyst shows significant amount of slip, regeneration of the LNT
is performed. For the LNT regeneration the engine is throttled to operate the engine
under richer conditions to reduce the amount of oxygen in the exhaust stream. Fuel is
then injected before the fuel reformer to increase the temperature to 350°C. Once the fuel
reformer reaches 350°C, additional fuel is injected which is converted to approximately
4.5% H2, 1.5% CO, and 1% HC (on a C1 basis). The H2, CO, and HC are then oxidized
by stored NOx on the LNT reducing the amount of NOx stored on the LNT. NH3 is
generated as a byproduct of the reduction of NOx with H2 on the LNT. The NH3 will
then flow to the SCR catalyst where it will store to reduce any NOx that slips by the LNT
[19, 20].

7
Figure 1.1 − Layout of the Eaton Aftertreatment System [19, 20].
Dykes [20] has studied the average integral NOx conversion of the EAS system,
the LNT, and the SCR, during several NOx regeneration cycles where it can be seen that
the SCR will contribute an additional 10% to the integral NOx conversion as shown in
Figure 1.2. Since catalyst become exponentially bigger as desired NOx conversion
increases, the 10% contribution to the integral NOx conversion of the SCR has allowed a
significant size reduction of the LNT.
Figure 1.2 – Contribution of integral NOx conversion of the LNT and SCR catalysts in
the EAS [20]

8
1.4 Selective Catalytic Reduction of NOx with NH3
The Ammonia Selective Catalytic Reduction process was developed for
powerplant applications as a method for the abatement of NOx [21] with the first
commercial demonstration occurring in the mid 1970s [22]. In this type of application,
ammonia is injected into the exhaust stack reducing the NOx in a homogeneous manner
without catalytic material; which is commonly referred to as Selective Non-Catalytic
Reduction (SNCR) [22-28]. Ammonia is the preferred reducing agent because it
selectively reacts with NOx in the presence of O2, H2O, CO2 and SO2 [29]. Without
catalytic help, the reduction of NOx requires temperatures normally in the range of 850 to
1100°C [24, 26, 27] which is significantly higher than seen in the exhaust of internal
combustion engines ( with a maximum of 600°C) [30], therefore SNCR is not feasible for
automotive applications due to its temperature range.
The first research application into the NH3 SCR process came about in 1957 when
it was discovered that ammonia reacts with NOx over a platinum catalyst even when
oxygen is present [21, 29]. This discovery proved that it was possible to reduce NOx
levels at 150 – 250ºC, which are much lower temperatures than the operation criteria of a
SNCR system in a lean environment [3, 29]. Since this discovery, there have been
numerous development activities to adapt SCR technology for mobile diesel engines [31].
Once it was proven that ammonia could be used to reduce NOx in a lean
environment, research became geared towards finding a catalyst that would facilitate NOx
reduction for internal combustion engines [3, 32-40]. Research initially began with
vanadium based catalysts [15, 17, 39], but has recently moved to zeolite base catalysts,
while not perfect, have shown due to their increased activity for NOx reduction with NH3,
and wider temperature windows [18, 41-43]. The two most common types of zeolite
based catalysts are iron or copper based. Research has shown that iron based zeolites

9
have a larger temperature operating range [15, 29], while copper based zeolites are less
sensitive to the NO to NOx ratio in the feed gas into the SCR catalyst [15].
From vanadium and zeolite base catalysts the same reaction steps (shown in Table
1.1) for Selective Catalytic Reduction of NOx with NH3 in lean exhaust have been
proposed [44-48], although the strength of each reaction steps will differ depending on
the catalyst. It has been found that all of the proposed SCR catalysts show some ability
to oxidize NO to NO2 as seen in (R1). It has also been observed that NH3 has the ability
to store on the catalyst as shown in (R2). The stored NH3 then has the ability to desorb
from the catalyst or react with O2, NO, or NO2 as seen in (R3) – (R8). Since each of the
catalysts have some ability to oxidize NO to NO2 or reduce NO2 to NO and O2, the NOx
reduction reactions shown in (R4) – (R8) are considered to happen simultaneously.
Table 1.1 − Summary of literature global chemical reactions for the Selective Catalytic
Reduction of NOx with NH3 in lean exhaust conditions.
Chemical Reaction
(R1) 2 2
1
2NO O NO
(R2) 3 3Z NH Z NH
(R3) 3 2 2 24 3 4 2 6Z NH O Z N H O
(R4) 3 2 24 6 4 5 6Z NH NO Z N H O
(R5) 3 2 2 24 4 4 4 6Z NH NO O Z N H O
(R6) 3 2 2 22 2 2 3Z NH NO NO Z N H O
(R7) 3 2 2 28 6 8 7 12Z NH NO Z N H O
(R8) 3 2 2 2 22 2 2 3Z NH NO Z N N O H O

10
1.5 Objectives
While Dykes [20] has shown that the SCR will increase the integral NOx
conversion of the EAS, it is still unclear how switching from rich and lean exhaust
conditions will affect the ability of the SCR catalyst to reduce NOx. The SCR catalyst in
the EAS faces unique conditions where NH3 is only available to the SCR catalyst during
the regeneration of the LNT which is done when the engine is throttled to rich exhaust
conditions, while NOx breakthrough from the LNT to the SCR catalyst occurs during
normal lean engine operation. The objective of this work is to propose a global kinetic
model to assist with control strategy development as well as sizing of the SCR in a LNT-
SCR system.
Initially a modeling study was performed by calibrating the reaction rates using
global steady-state lean SCR reactions in literature [45, 49-56] to the experimental
reactor bench data for the SCR catalyst in the EAS. Results from the kinetic model were
then compared to ideal system operation conditions performed on the reactor bench,
where it was discovered that changes to the kinetic mechanism were needed to accurately
capture all effects of the LNT-SCR catalyst system. Therefore four independent
experimental studies have been performed to study changes to the literature steady-state
reaction mechanisms.
The first experimental study was done to test the expected global reactions from
literature sources for steady-state lean operation of the SCR in the EAS. It was found
that not all effects in lean engine exhaust have been completely quantified. The
production of N2O (R8) is not always included in reaction mechanisms but is commonly
thought to occur due to a reaction between NH3 and NO2 [45, 57]. Although this has
been debated by Kim et al. [47] where it is suggested that reactions with NH3 and NO,
O2, or NO2 can yield N2O. Epling et al. [57] has even suggested that the Slow SCR
reaction shown in (R7) is actually a combination of the production of N2O as a

11
combination of NO2 and NH3, then a reduction of N2O with NH3. Due to the unclear
nature of these reaction pathways further experiments have been performed with NH3,
NO2, and N2O in the feed gas to quantify the appropriate reaction pathways.
The second experimental study is done to test how steady-state reactions compare
to the unsteady operation of the SCR in a LNT-SCR catalyst system. Under steady-state
conditions in an SCR, reactions with NH3 and NOx occur almost instantaneously,
therefore very little NH3 is present on the catalyst at all times. To account for the
unsteady nature of the LNT-SCR system, cycling experiments have been performed to
quantify the effect of stored NH3 on NOx conversion.
The third and forth experimental studies were performed to find what happens to
the chemistry of the SCR catalyst when exposed to rich engine conditions. When the
regeneration of the LNT occurs under rich exhaust conditions, H2O and CO2
concentrations will increase in the exhaust stream, as well as the possibility for H2, CO,
and HC breakthrough to the SCR. Therefore the third experimental study was performed
to study how H2O and CO2 concentrations will affect the proposed SCR reactions. The
forth experimental study was performed to quantify the effects H2, CO, and HC will have
on the SCR chemistry.

12
CHAPTER 2
METHODOLOGY
Since the overall goal is to propose the correct chemical reactions and estimate
their corresponding kinetic rate forms, a methodology needs to be established. A flow
chart for the methodology is shown in Figure 2.1. For model development AVL BOOST
is used to solve the conservations equations (mass, species, momentum, energy) with
custom defined chemical reactions and kinetic rate forms written by the user. Initially the
chemical equations and kinetic rates are developed from literature sources. Experimental
data are taken using a bench top reactor, where synthetic gas blends can be made to
isolate proposed reactions and vary catalyst temperature and space velocity. Initial
kinetic rate equations are commonly based on Arrhenius rate forms as shown in equation
(2.1).
1
exp
E KR T
k
k
K k y
(2.1)
Where the pre-exponential k and the activation energy E , are allowed to be varied
using an optimization routine and reapplied to AVL BOOST until the simulations results
match experimental data taken on the bench top reactor.
Once simulation results for the proposed kinetic mechanism are statistically
significant when compared to experimental results for all reactions, additional
simulations are performed and compared to validation data. Validation data can come
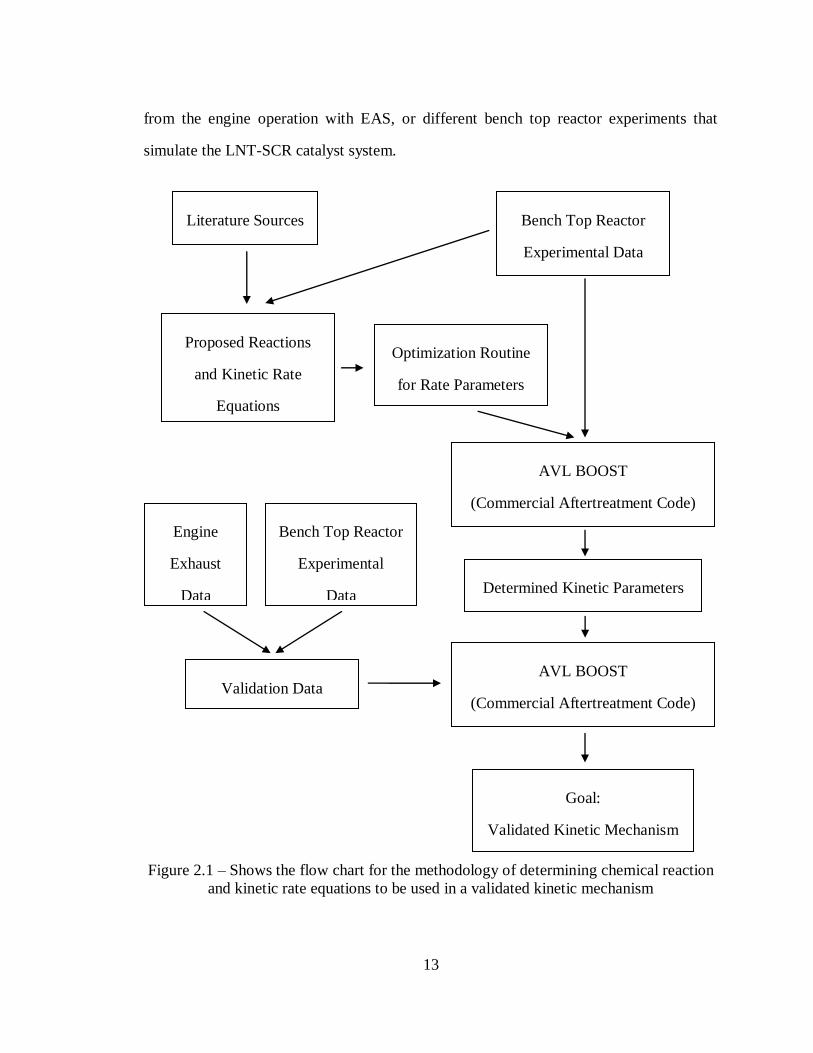
13
from the engine operation with EAS, or different bench top reactor experiments that
simulate the LNT-SCR catalyst system.
Figure 2.1 – Shows the flow chart for the methodology of determining chemical reaction
and kinetic rate equations to be used in a validated kinetic mechanism
Proposed Reactions
and Kinetic Rate
Equations
AVL BOOST
(Commercial Aftertreatment Code)
Bench Top Reactor
Experimental Data
Validation Data
Determined Kinetic Parameters
Literature Sources
Optimization Routine
for Rate Parameters
AVL BOOST
(Commercial Aftertreatment Code)
Goal:
Validated Kinetic Mechanism
Bench Top Reactor
Experimental
Data
Engine
Exhaust
Data

14
2.1 Aftertreatment Modeling
AVL BOOST is used to develop a kinetic mechanism for aftertreatment catalysts.
Aftertreatment modeling is usually done as two parts; the first part is developing a solver
for the conservation equations that occur during this process. Since many aftertreatment
models have been developed, a commercial aftertreatment model (AVL BOOST) is used
to solve the conservation equations (mass, momentum, species, and energy). The second
part of is the development of the appropriate chemical reactions and kinetic rate forms.
AVL BOOST was chosen due to the ability to define chemical reactions with custom
kinetic rate forms.
The use of a global kinetic mechanism is suggested since rate parameters must be
determined for each reaction. The goal of global kinetics is to use the minimum amount
of reactions to characterize the behavior of the catalysts. A simple example of a global
reaction for the oxidation of CO to CO2 is shown in (2.2). It should be noted that the
addition of each species exponential increases the amount of detailed reactions required.
It can be observed that the detailed approach requires two reactions and four rate
constants, while using a global approach requires only one reaction and two rate
constants. Since catalyst formulations are always changing and the activity of each
catalyst formulation is different, global kinetic models are suggested to reduce the
amount of rate parameters to be determined.
2
2
2 2
1 + 2
2
1
2
CO O CO
O O
CO O CO
→
2
2
21
22
exp
exp
exp
CO O
O
GlobalGlobal CO O
Ek y y
RT
Ek y
RT
Ek y y
RT
(2.2)

15
2.1.1 AVL BOOST Conservation Equations Solver
Catalytic combustion reactors are considered heterogeneous reactors because they
contain two phases. (a gas phase (reactants and products) and solid catalyst) Since the
catalytic reactions occur on the catalyst, the reactants have to be transported to the
external gas-solid interface. Modeling the overall reaction process therefore requires the
consideration of both the physical transport and chemical kinetic steps. Figure 2.2 shows
the individual steps taking place during a heterogeneous catalytic reaction.
Figure 2.2 − Steps of a Catalytic Reaction where: Cj is concentration of species, P is
products, R is reactants, Surf is on the catalyst surface, and Bulk is part of the bulk flow
[58].
As discussed by Froment and Bischoff [59] and shown in Figure 2.2, the
following steps can be distinguished:
1. Transport of the reactants from the bulk gas phase to the external solid
surface across the boundary layer.
2. Diffusion of the reactants into the porous catalyst. Since the main part of
the catalyst is located inside the porous material (washcoat) the reactants
must diffuse into it.
3. Adsorption of the reactants onto the surface.
16
4. Catalytic reaction at the surface.
5. Desorption of the products of the reaction.
6. Diffusion of the products to the surface of the catalyst.
7. Transport of the products into the bulk gas phase.
Steps 1, 2, 6 and 7 are mass transport steps while steps 3, 4 and 5 are chemical
kinetic steps.
To accomplish the above steps the catalyst structure first needs to be determined.
The catalyst structure is determined based on the following known catalyst properties:
Amount of monoliths in the catalyst
Length of the catalyst
Radius of the catalyst
Size of each monolith
Monolith Volume
Open frontal area of the monolith
Hydraulic area
Catalyst density
Catalyst thermal conductivity
From these properties the catalyst geometry as well as thermal properties of any
catalyst brick can be determined for use in the conservation equations.
AVL BOOST Conservation Equations
Using the kinetic mechanism created it was assumed that radial transport effects
of a honeycomb-type catalytic converter are small compared to the heat transport in axial
direction which means that the entire catalyst can be represented by one single channel.
The effects taking place in this model are convective, diffusive, and conductive transport
in the gas phase; mass and energy transfer through the boundary layer; diffusion and
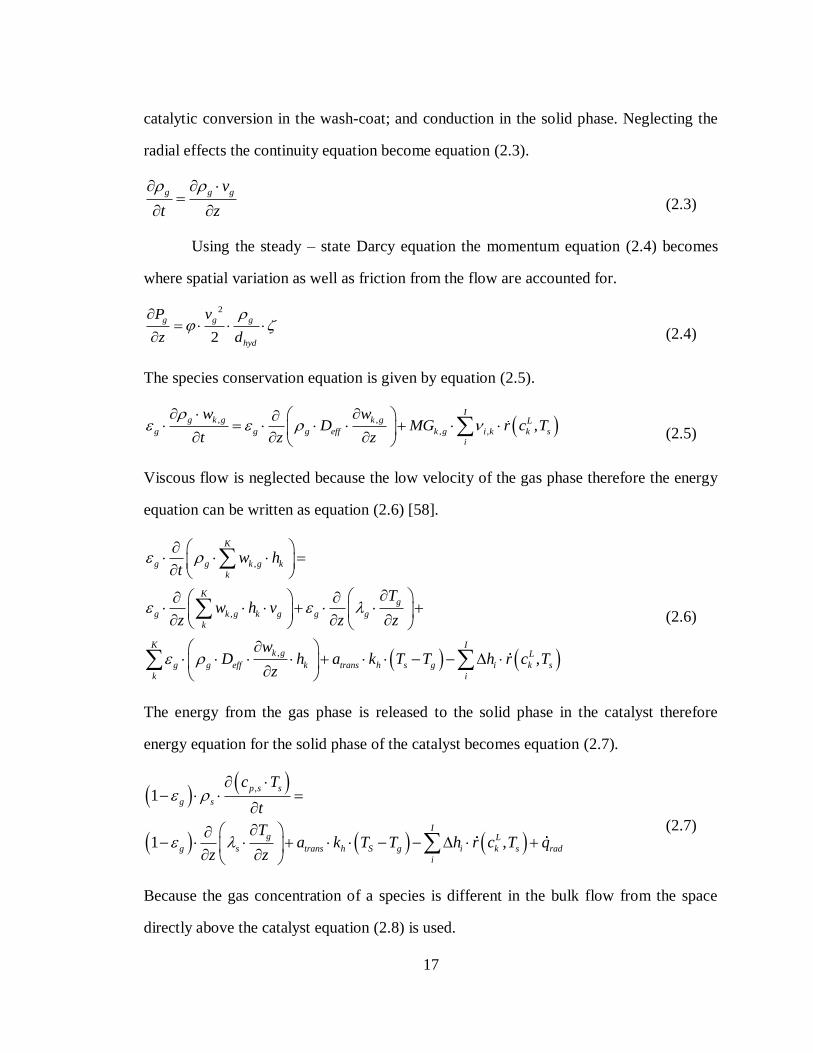
17
catalytic conversion in the wash-coat; and conduction in the solid phase. Neglecting the
radial effects the continuity equation become equation (2.3).
g g gv
t z
(2.3)
Using the steady – state Darcy equation the momentum equation (2.4) becomes
where spatial variation as well as friction from the flow are accounted for.
2
2
g g g
hyd
P v
z d
(2.4)
The species conservation equation is given by equation (2.5).
, ,
, , ,I
g k g k g L
g g g eff k g i k k s
i
w wD MG r c T
t z z
(2.5)
Viscous flow is neglected because the low velocity of the gas phase therefore the energy
equation can be written as equation (2.6) [58].
,
,
,,
K
g g k g k
k
Kg
g k g k g g g
k
K Ik g L
g g eff k trans h s g i k s
k i
w ht
Tw h v
z z z
wD h a k T T h r c T
z
(2.6)
The energy from the gas phase is released to the solid phase in the catalyst therefore
energy equation for the solid phase of the catalyst becomes equation (2.7).
,1
1 ,
p s s
g s
Ig L
g s trans h S g i k s rad
i
c T
t
Ta k T T h r c T q
z z
(2.7)
Because the gas concentration of a species is different in the bulk flow from the space
directly above the catalyst equation (2.8) is used.
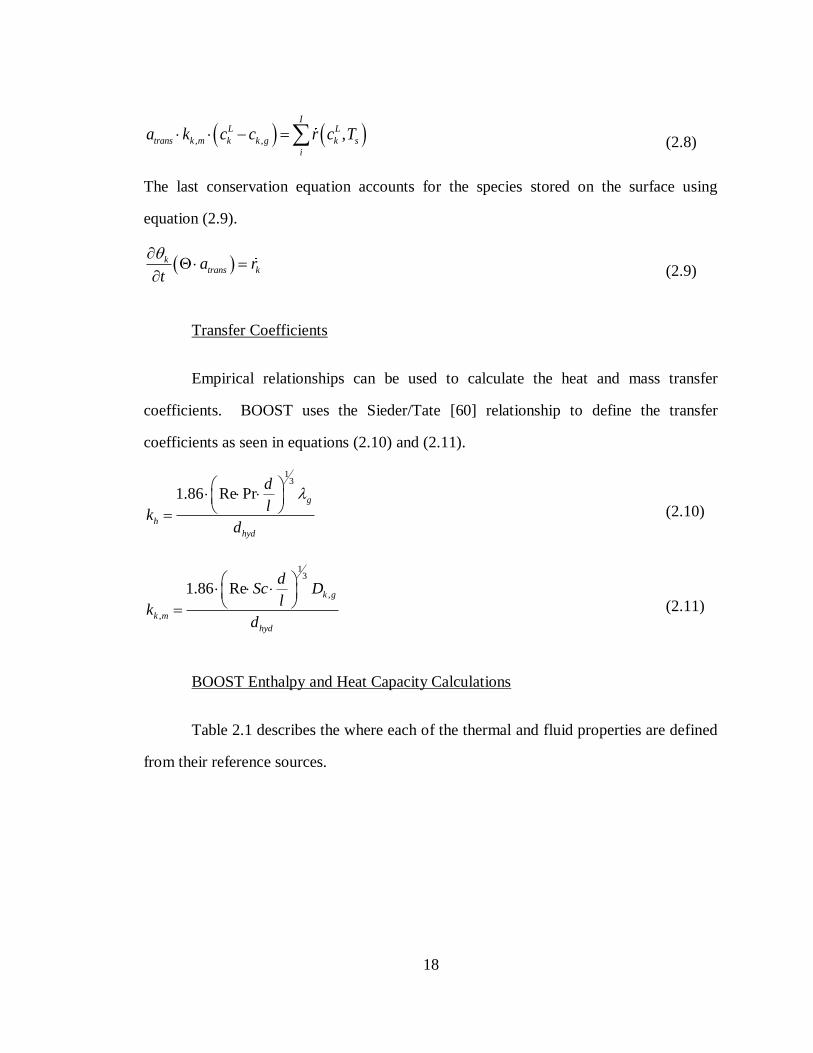
18
, , ,I
L L
trans k m k k g k s
i
a k c c r c T (2.8)
The last conservation equation accounts for the species stored on the surface using
equation (2.9).
ktrans ka r
t
(2.9)
Transfer Coefficients
Empirical relationships can be used to calculate the heat and mass transfer
coefficients. BOOST uses the Sieder/Tate [60] relationship to define the transfer
coefficients as seen in equations (2.10) and (2.11).
13
1.86 Re Pr g
h
hyd
d
lk
d
(2.10)
13
,
,
1.86 Re k g
k m
hyd
dSc D
lk
d
(2.11)
BOOST Enthalpy and Heat Capacity Calculations
Table 2.1 describes the where each of the thermal and fluid properties are defined
from their reference sources.

19
Table 2.1 − Shows where all gas thermal fluid properties are determined
Property Unit Reference
Molecular Weight kmol/kg Tabulated from literature
Specific Heat kJ/kg*K Polynomial fits from Barin [61]
Enthalpy kJ/kg Polynomial fits from Barin [61]
Entropy kJ/kg*K Polynomial fits from Barin [61]
Thermal
Conductivity
W/m*K Polynomial fits from VDI et al [62], and Reid et al [63]
Viscosity Pa*s Polynomial fits from VDI et al [62], and Reid et al [63]
Diffusion
Coefficients
m2/s Binnary acc. To Fuller et al. [64], mixture acc. To Perry
et al. [60](Wilke Method)
Boundary Conditions
Using BOOST to solve the above differential equations requires boundary
conditions need to be applied. For the continuity and momentum equations to be solved
an outlet pressure and an inlet mass flux need to be applied. For the energy and species
equations inlet temperatures and mass fractions need to be applied. Lastly either heat
loss boundary conditions need to be applied or the simulation can be run as assuming the
catalytic converter is adiabatic
Chemical Reaction Rate Calculations
Chemical reactions can be written in the following form shown in equation (2.12).

20
1 1
K K
ki k ki k
k k
v v
(2.12)
The stoichiometric coefficient for a reaction is defined in equation (2.13).
ki ki kiv v v (2.13)
The rate of production of species k is defined by equation (2.14).
1
I
i ki i
i
r v q
(2.14)
The reaction rate is defined by the difference between the forward and backward reaction
rates shown in equation (2.15).
, ,
1 1
ki kiK K
v v
i fi k g ri k g
k k
q K c K c
(2.15)
The reaction rate coefficients are initially defined by the Arrhenius Rate Law [65]
(equation (2.16)) but can be changed as shown later in the document.
expb EK k T
R T
(2.16)
While using equation (2.15) the concentration can come in two forms one form for gas
phase species (equation (2.17)), the second for stored species on a catalyst (equation
(2.18)).
, ,
g
k g k g
g
Pc y
R T
(2.17)
,k g kc (2.18)

21
2.2 Experimental Equipment
A bench top reactor is commonly used for global kinetic model development.
The bench top reactor allows for synthetic gas blends to be created that allow the user to
isolate reactions on a catalyst. The bench top reactor also allows the user to control the
flow rate and temperature of the gas as it reaches the catalysts. This allows the user to
further isolate reactions based on temperature and the space velocity exposed to the
catalyst. Additionally the developed aftertreatment models can be compared to engine
results for validation of the kinetic mechanism. This section will describe the
experimental equipment used to generate the data presented in this document.
2.2.1 Bench Top Reactor
The flow reactor was designed and built by Stefan Klinkert. The flow reactor
consists of the follow major parts as can be seen in the schematic in Figure 2.3 with
further details given in [66].
Various gas bottle (O2, CO2, CO, H2, NO, NO2, NH3, C3H6; in nitrogen
balance) and liquid nitrogen supply with pressure regulators
21 Mass flow Controllers (Brooks)
2 Peristaltic Pumps for H2O delivery(Cole Parmer)
2 H2O Vaporizers (in-house design)
2 Tube Furnaces (Lidenberg)
Heat tapes (Brisk Heat) and solid-state-relay temperature controllers
(Watlow)
Data acquisition (DAQ) hardware and software (NI / Labview)
Various K-Type Thermocouples (Omega)
2 Pressure Transducers (Omega)

22
Figure 2.3 − The layout of the synthetic exhaust reactor bench used to obtain
experimental data based on work by Klinkert et al. [66].
The reactor is designed to have two synthetic gas mixing sections titled the Lean
Branch and the Rich Branch where different gas blends are made. These branches meet
at a four way valve controlled by a fast acting solenoid. The four way valve has two
inlets and two exits. The inlets are connected to the Lean and Rich Branches. One exit is
connected to a vent line, while the other is connected to the tube furnaces where the
catalyst temperature can be controlled. The reactor bench has the ability to select
different gas concentrations from either the Lean Branch or Rich Branch to flow the tube
furnace where the catalyst temperature is being controlled. The outlet of the tube
furnaces is connected to a MKS FTIR for emissions measurements, V&F H-Sense for
hydrogen measurements, and a Horiba O2 analyzer for oxygen measurements. The
reactor bench contains an additional pathway bypass the tube furnaces directly to
emissions analyzers, to measure inlet conditions to the tube furnaces. At the outlet of the
tube furnaces an additional MFC is connected to apply dilution N2 to the reactor flow gas

23
for faster response of the emissions analyzers. The entire reactor bench is wrapped with
heat tapes and controlled to 190°C to avoid H2O condensation.
Mass Flow Controllers
All MFCs were verified within error using an Omega digital volume flow sensor.
The MFC listed error is less than 0.2% of full scale flow. The full scale flow for each
MFC, the maximum concentration values for each gas at 50,000 h-1
SV (6 L/min total
flow for 1 inch catalyst length), and the expected error for each MFC at a 50,000 h-1
SV
are listed in Table 2.2 for the lean and rich branches [66].
Table 2.2 – Full flow of each MFC and respective concentration of gas cylinder each
MFC is connected to.
Gas Lean Branch Rich Branch
Total Flow Max
Conc.
Expected
Error
Total Flow /
Error
Max
Conc.
Expected
Error
(mL min-
1/%)
(ppm) (ppm) (mL min-1
/%) (ppm) (ppm)
N2 8000/100 Balance Balance 8000/100 Balance Balance
CO2 1200/100 200,000 400 1200/100 200,000 400
O2 720/1 120,000 240 2000/10 60,000 120
CO 1200/1 2,000 4 1200/7.5 30,000 60
C3H6 600/2 2,000 4 1200/10 20,000 40
H2 600/1 1,000 2 600/100 40,000 80
NO 600/2 2,000 4 600/2 2,000 4
NO2 600/2 2,000 4 600/2 2,000 4
NH3 600/2 2,000 4 600/2 2,000 4

24
Reactor Bench Emissions Analyzers
MKS FTIR
An FTIR analyzer was used to measure the majority of the composition of
outflow of the Reactor Bench. The specific instrument used was a 2030-HS Multigas
Analyzer manufactured by MKS Instruments Inc. It has the capability to detect species
from ppb levels to percent concentration in a gas stream. Identification of specific
molecules is accomplished by measuring the absorption spectrum emitted by that species
when exposed to an infrared beam in a gas cell. The spectral frequencies and intensities
are unique based on the number and strength of chemical bonds among atoms contained
in a given molecule. Most gases in engine exhaust are infrared detectable with exception
of diatomic gases like O2, H2 and N2. The concentration of gas is determined by
comparison of magnitude of the signal compared with pre-loaded calibrations. During
the testing, a range of calibrations were loaded into the FT-IR software to look for desired
species. The accuracy of MKS FTIR and species measured are shown in Table 2.3 [67].
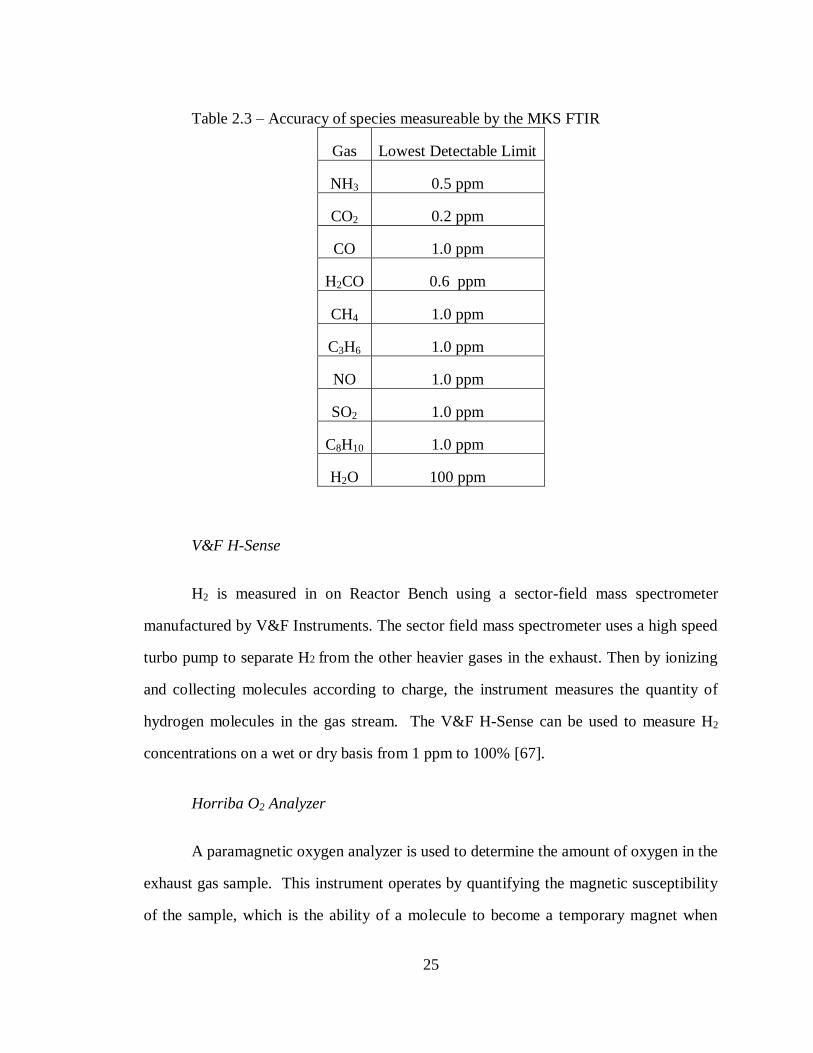
25
Table 2.3 – Accuracy of species measureable by the MKS FTIR
Gas Lowest Detectable Limit
NH3 0.5 ppm
CO2 0.2 ppm
CO 1.0 ppm
H2CO 0.6 ppm
CH4 1.0 ppm
C3H6 1.0 ppm
NO 1.0 ppm
SO2 1.0 ppm
C8H10 1.0 ppm
H2O 100 ppm
V&F H-Sense
H2 is measured in on Reactor Bench using a sector-field mass spectrometer
manufactured by V&F Instruments. The sector field mass spectrometer uses a high speed
turbo pump to separate H2 from the other heavier gases in the exhaust. Then by ionizing
and collecting molecules according to charge, the instrument measures the quantity of
hydrogen molecules in the gas stream. The V&F H-Sense can be used to measure H2
concentrations on a wet or dry basis from 1 ppm to 100% [67].
Horriba O2 Analyzer
A paramagnetic oxygen analyzer is used to determine the amount of oxygen in the
exhaust gas sample. This instrument operates by quantifying the magnetic susceptibility
of the sample, which is the ability of a molecule to become a temporary magnet when

26
placed in an oscillating magnetic field. Since oxygen is the only exhaust gas constituent
that is strongly paramagnetic, its quantity is readily obtained by using this method. A
dumbbell-shaped test body mounted on a quartz fiber is suspended in a nonuniform
magnetic field. As the partial pressure of oxygen in the gas sample surroundings the test
body changes, the body will rotate. An optical system that senses this rotation causes a
voltage to be applied to the test body to maintain it in a stationary position. This voltage
is output signal of the amplifier circuit, and is then correlated to the oxygen concentration
in the gas sample. The range of 0 – 2% is selected on the O2 analyzer due to a common
dilution ratio of four to one. With the dilution ratio the O2 Analyzer can operate on a wet
basis with up to 2% H2O. The accuracy of the O2 analyzer is 1% of the full scale range
which yields a value an error value of 200 ppm.
Validation
Validation of the reactor bench was performed by Klinkert et al. [66]. The reactor
bench was validated by testing the gas preparation, mixing of the feed gas into the
catalyst, and uniform temperature control. The gas preparation was validated by
characterizing the command and output concentrations for each gas along with the
associated time lag for each species. Glassware to increase turbulence was added to
increase mixing of the feed gas, which was validated by commanding concentrations of
multiple species in the feed gas. It was found that the addition of the turbulence inducing
glassware aided in uniform temperature control, which was validated in the second
furnace by finding the temperature distribution in a blank catalyst with seven
thermocouples distributed throughout the catalyst.

27
Catalyst Preparation
The catalyst used in this set of experiments is comprised of 99 channels of a 300
cpsi, Fe-zeolite catalyst core, cut to 19.05 mm diameter and 25.4 mm length. The
catalyst was aged for 20 hours in 10% H2O with a balance of N2 at 550°C. The wall and
washcoat thickness of the catalyst were determined using from digital images taken by a
16-bit Resolution Microscope by the Keyence Corporation (VHX-S50 Serial Num:
5D010002). An example of these images are shown in Figure 2.4
Figure 2.4 – Multiple measurements were taken to get an average wall thickness and
washcoat thickness of the SCR catalyst.
2.2.2 Engine Test Cell
The Eaton Aftertreatment System (EAS) shown in Figure 1.1, was configured to
operate connected to a 6.4L International Diesel Engine. Emissions were measured
before and after the SCR catalyst simultaneously by two MKS FTIRs. Additionally at

28
the inlet hydrogen measurements were taken with the V&F H-Sense, and oxygen
measurements were taken using the AVL CEB II emissions bench. Details of the test cell
configuration are as follows in this section.
Engine
The engine used with the EAS is a 6.4 L V-8 direct-injection diesel engine
manufactured by the International Truck and Engine Corporation. Known as the Power
Stroke, this medium-duty engine is most commonly used in Ford F-series pickup trucks
and incorporates advanced technologies to reduce exhaust emissions while maintaining
engine performance. Primary engine specifications are shown in Table 2.4.
Table 2.4 – Shows the Engine Specifications for the 6.4L International V8 engine
Engine Type Diesel, 4 Cycle
Configuration 4 OHV/1 Cam-in-Crankcase-V*
Displacement 6.4 L (390in3)
Bore and Stroke 98.2 x 105 mm (3.87 x 4.134 in)
Compression Ratio 17.5:1
Aspiration Series Sequential Turbo/Charge Air Cooler
Rated Power @ RPM 261 kW (350 hp) @ 3000 RPM
Rated Torque @ RPM 881 N-m (650 ft-lb) @ 2000 RPM
Combustion System High Pressure Common Rail Direct Injection
Total Engine Weight 499 kg (1130 lb)
Coolant Flow 473 L/min (125 gpm) @ 3000 RPM
Air Flow 21.1 m3/min (744 cfm) @ 3000 RPM
Exhaust Flow 55.6 m3/min (1962 cfm) @ 3000 rpm
Oil Flow 59 L/min (13 gpm) @ 3000 rpm

29
The engine is also equipped with an electronically controlled common rail direct
injection system. This works by maintaining common lines at high pressures with a
central pump. The injectors are then sent an electronic injection signal where fuel is
injected. Using this fuel system the engine is capable of multiple injections strategies,
meaning there is the ability for multiple pilot, main, and a post injections for every
combustion cycle.
AVL Emissions Bench
An AVL Combustion Emissions Bench II (CEB-II) is used to sample condition
and measure exhaust gas concentrations. The CEB-II can quantify the amount of CO,
CO2, O2, total Hydrocarbons (THC), NO and NOx in the exhaust gases and CO2 levels
from the intake manifold.
THC Analyzer
An ABB Advance Optima Milt-Fid 14 EGA is used to measure the total
hydrocarbon emissions. The flame ionization detector (FID) determines the mass
fraction of carbon in the sample which is converted to a hydrocarbon-mass basis by
assuming a specific carbon to hydrogen ratio recommended for diesel exhaust. A FID
uses a burner to combust a stream of hydrogen/helium commonly known as “FID fuel” as
diffusion flame in air releasing ions during combustion. The hydrocarbon-containing
sample gas is premixed with the fuel and is also consumed in the burner which increases
the concentration of ions within the flame. This increase in ionization is directly
proportional to the mass flow rate of carbon atoms into the flame. A DC voltage between
the burner tip and a collector electrode, which surrounds the flame, collects the ions
within the flame causing a current to flow through an electronic circuit which is measured

30
and associated to total hydrocarbon emissions. The THC Analyzer saves data on a wet
basis.
NOx Analyzer
NO and NOx emissions are quantified with an Eco-Physics CLD 700
chemiluminescent detector (CLD). This analyzer can only measure the concentration of
NO, but incorporates a high-efficiency converter to change any NO2 present to NO to
determine the total NOx emissions. Light is emitted from the chemiluminescent reaction
of NO and ozone (O3) and when excess O3 is present, the amount of light emitted is
proportional to the concentration of NO. This light is detected by an optical filter-
photomultiplier combination that produces an output that is linear to the concentration of
NO in the sample. The NOx Analyzer saves data on a wet basis.
CO and CO2 Analyzer
Two ABB Advance Optima URAS 14 EGA non-dispersive infrared analyzers
(NDIR) are used to determine the amount of CO and CO2 in the samples. One will
measures the amount of CO and CO2 in the exhaust stream, and the other is used to
measure the amount of CO2 in the intake manifold which is related to the amount of EGR
in the system.
The NDIR analyzers detect the infrared energy absorption differential between
two gas-filled columns, one sample column and one reference column. Infrared radiation
is passed through the sample and reference columns into a detector that has two cells
which are filled with gas and physically separated by a flexible metal diaphragm. The
infrared radiation collected by each cell heats up its gas and increases the cell pressure.
When a sample gas passes through the sample column, some of the infrared energy is
absorbed by the gas and less energy will arrive at the sample cell side of the detector due

31
to the presence of CO and CO2 in the column resulting in a lower temperature in the
sample column. From the ideal gas law it is seen that when the temperature decreases the
pressure will decrease. The pressure difference causes a deflection in the metal
diaphragm, which is used as one plate of a variable plate capacitor in an electric circuit.
The detector output is generated by measuring the amplitude of the oscillating electric
current caused the diaphragm, which can be correlated to the amount of CO and CO2.
The CO/CO2 Analyzer saves data on a dry basis.
O2 Analyzer
An AB Advance Optima Mangos 16 paramagnetic oxygen analyzer is used to
determine the amount of oxygen in the exhaust gas sample. This instrument operates by
quantifying the magnetic susceptibility of the sample, which is the ability of a molecule
to become a temporary magnet when place in a magnetic field. Since oxygen is the only
exhaust gas constituent that is strongly paramagnetic, its quantity is readily obtained by
using this method. A dumbbell-shaped test body mounted on a quartz fiber is suspended
in a nonuniform magnetic field. As the partial pressure of oxygen in the gas sample
surroundings the test body changes, the body will rotate. An optical system that senses
this rotation causes a voltage to be applied to the test body to maintain it in a stationary
position. This voltage is output signal of the amplifier circuit, and is then correlated to
the oxygen concentration in the gas sample. The O2 Analyzer saves data on a dry basis.
Emissions Error Summary
All analyzers listed above are calibrated with calibration gases. The analyzers are
also linearized yearly with a gas divider to make higher order polynomials for the
analyzers. Below in Table 2.5 is a list of the associated error for the readings for the
above analyzers.

32
Table 2.5 − Shows the error associated with the AVL CEB II Emissions bench readings
based on instrument specifications
Species Range Error From Analyzers
THC 10 ppm – 5% ±1 ppm
CO Low: 50 – 2500
High: 0.5 – 10%
±2 ppm
±100 ppm
CO2 0.5 – 20% ±100 ppm
NO / NOx Low: 30 – 5000 ppm
High: 50 – 10000 ppm
±1 ppm
±2 ppm
Dynamometer
A dynamometer is a device that absorbs the rotational energy from an engine and
determines the output power by measuring the engine’s speed and torque. The
dynamometer used in this experimental effort is an AVL ELIN series 100 APA
Asynchronous Dynamometer. Table 2.6 shows dynamometer performance specifications
[68].

33
Table 2.6 – Shows the specifications for the AVL ELIN series 100 APA Asynchronous
Dynamometer
Speed Range ±8000 RPM
Torque Range -1273 to +1400 N*m
Power (Absorbing) 330 kW
Power (Motoring) 300 kW
Power Consumption 400 Amps @ 400 Volts
The dynamometer is essentially a highly controllable electric motor/generator. It
has a rotor that is connected to the engine via a driveshaft and a stationary stator. When
the rotor turns, an electric field is transmitted from the rotor to the stator resulting in a
torque as mechanical power is transferred into electrical power. This torque is generated
by the moving of magnetic fields between the rotor and stator. The torque on the stator is
equal in magnitude and opposite in direction of the engine torque and is resisted by a
bending beam mechanism that deflects under load. The deflection of the bending beam is
measured with a strain gage and is related to the torque through geometrical and material
properties of the beam. Accuracy of dynamometer torque measurements are within
±0.3% of actual values. Rotational speed is obtained from an encoder mounted on the
dynamometer’s shaft. The encoder measures the frequency of a pulse generated in the
encoder by the rotation of the shaft.
Measurements and Calculations
The following states how measurements were taken for input into the BOOST
aftertreatment model

34
Air Mass Flow Measurement
Air coming into the engine first passes through the intake system, where the air is
filtered, measured, and then directed into the engine. The flow is measured using a
laminar flow element (LFE) that works by slowing the flow through multiple small
channels and measuring the small pressure drop across these channels. Other readings
needed for these calculations are intake temperature, relative humidity, and barometric
pressure. The mass flow rate through the laminar flow element is calculated using
equation (2.19).
2
7.55987fstd std wet
std
f f std dry
PTm B DP C DP
u T P
(2.19)
Table 2.7 shows a list of error for the calculation of air mass flow rate shown in
equation (2.19) with the mass flow rate percentage calculated based on the root mean
square method.
Table 2.7 – Shows the error associated with intake air mass flow rate readings
Parameter Error
DP 0.1 in H2O
fT 0.6°K
fP 0.05 kPa
Relative Humidity 2.5% RH
The error for the mass flow rate was determined by using the root mean square
(RMS) error analysis and is approximately 3% for the range of the engine.
Fuel Mass Flow Measurement
The fuel flow rate is measured by a Micro Motion coriolis flow meter CMF025
model which provides mass flow rate measurements independent of fluid temperature or
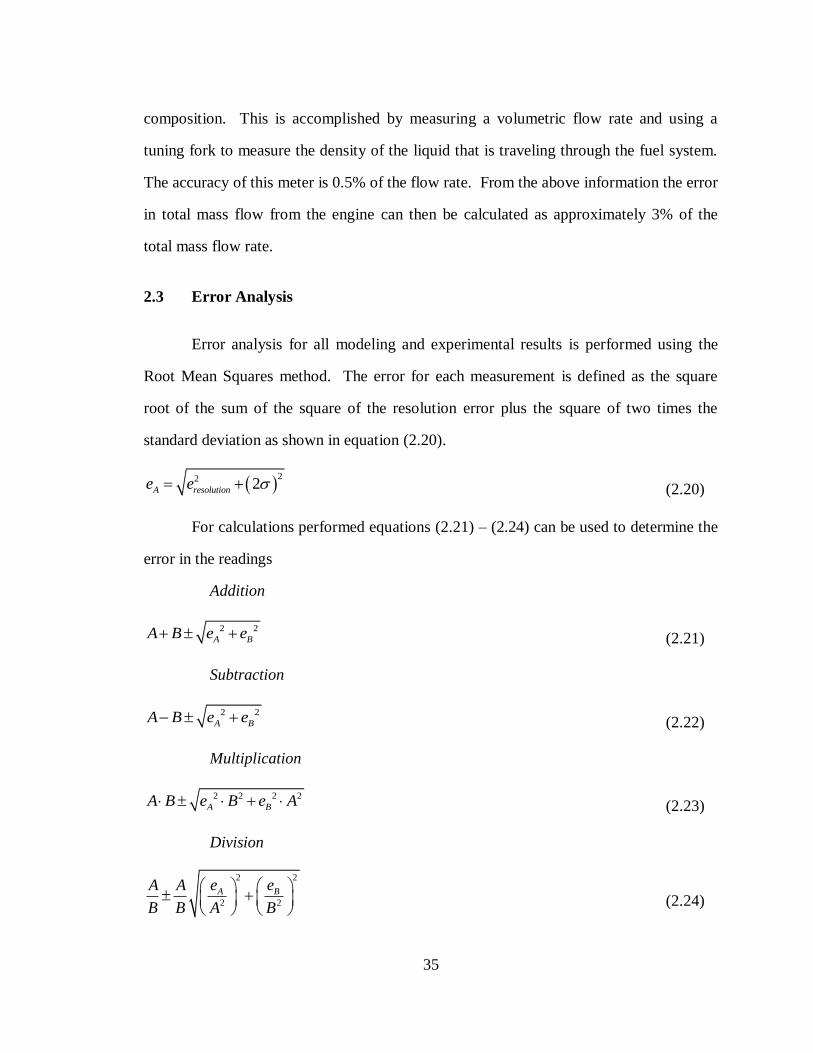
35
composition. This is accomplished by measuring a volumetric flow rate and using a
tuning fork to measure the density of the liquid that is traveling through the fuel system.
The accuracy of this meter is 0.5% of the flow rate. From the above information the error
in total mass flow from the engine can then be calculated as approximately 3% of the
total mass flow rate.
2.3 Error Analysis
Error analysis for all modeling and experimental results is performed using the
Root Mean Squares method. The error for each measurement is defined as the square
root of the sum of the square of the resolution error plus the square of two times the
standard deviation as shown in equation (2.20).
22 2A resolutione e (2.20)
For calculations performed equations (2.21) – (2.24) can be used to determine the
error in the readings
Addition
2 2
A BA B e e (2.21)
Subtraction
2 2
A BA B e e (2.22)
Multiplication
2 2 2 2
A BA B e B e A (2.23)
Division
2 2
2 2
A Be eA A
B B A B
(2.24)

36
CHAPTER 3
LEAN SCR KINETIC MECHANISM
This chapter details the process to generate a lean SCR kinetic mechanism. The
kinetic mechanism is based on literature sources [45, 47, 48] for proposed reaction and
kinetic rate forms. The effect of oxygen concentration is focused on specifically due to
account for NOx regeneration in a LNT-SCR aftertreatment system. The results in this
chapter detail all pertinent reactions from literature resources for steady state conditions
on an iron based SCR catalyst with varying oxygen concentrations. The results were then
applied to validation data from the EAS system on an engine as well as further reactor
bench experiments.
3.1 NO Oxidation
The oxidation of NO to NO2 as shown in equation (3.1) can be found on most
types of aftertreatment catalysts [45, 69-72]. The oxidation of NO to NO2 was first
theorized for the SCR process in 1980 by Kiovsky et al. [73]. In the early work involving
NO decomposition over Zeolite catalysts, it was inferred that the O2 liberated from the
surface during decomposition reacts with the inlet NO to form NO2 [74].
12 22
NO O NO (3.1)
The oxidation of NO is equilibrium limited and subject to the temperature
conditions of the monolith. It was later determined to be an important precursor step to

37
NOx reduction in the ammonia and HC SCR processes over a zeolite material [75-78].
This was because experiments illustrate that the temperature required for total conversion
to nitrogen can be lower when NO2 is present. The equilibrium basis in the NO oxidation
reaction can be seen in Figure 3.1 where the temperature can be determined where the
onset of equilibrium kinetics occurs.
0
20
40
60
80
100
200 250 300 350 400 450
2NO + O2 >> NO
2
2NO2 >> 2NO + O
2
Co
nv
ers
ion
(%
)
Temperature (C)
Onset ofEquilibrium
Kinetics
NO Conv. (%)
NO2 Conv. (%)
Figure 3.1 − The oxidation of NO to NO2 is a reversible reaction with the onset of
equilibrium chemistry to convert NO2 to NO and O2 at higher temperature. Results are
shown in temperature ramp experiments with stoichiometric ratios of feed gas with 0%
H2O and 0% CO2 in the feed gas.
3.1.1 Experimental Results
Experimental data for the NO oxidation reaction when using a bench-top style
reactor is collected using constant inlet concentrations and varying temperature in a
constant upward or downward ramp rate up to 5°C/min. Experimental results are then
compiled to show a conversion percentage vs. temperature profile.

38
NO Oxidation Effect of Varying O2 Concentration
By examining the reaction in equation (3.1), it can be predicted that oxygen
concentration has a large effect when oxidizing NO to NO2. NO conversion is defined as
the disappearance of NO as seen in equation (3.2), similarly NO2 conversion is defined in
equation (3.3).
_ _
_
100NO IN NO OUT
NO
NO IN
c c
c
(3.2)
2 2
2
2
_ _
_
100NO IN NO OUT
NO
NO IN
c c
c
(3.3)
Figure 3.2 shows that increasing oxygen concentration will increase the
conversion of NO to NO2.
0
20
40
60
80
100
200 250 300 350 400 450
2% O2
6% O2
12% O2
NO
Co
nv
ers
ion
(%
)
Temperature (C)
Figure 3.2 − The oxidation of NO to NO2 is dependent on O2 concentration in the feed
gas, all experiments were performed as a temperature ramp with 6% H2O, 6% CO2, and
1000 ppm NO in the feed gas
From the experimental results shown in Figure 3.2 the dependence on oxygen
concentration can be determined by the following method. NO conversion efficiency
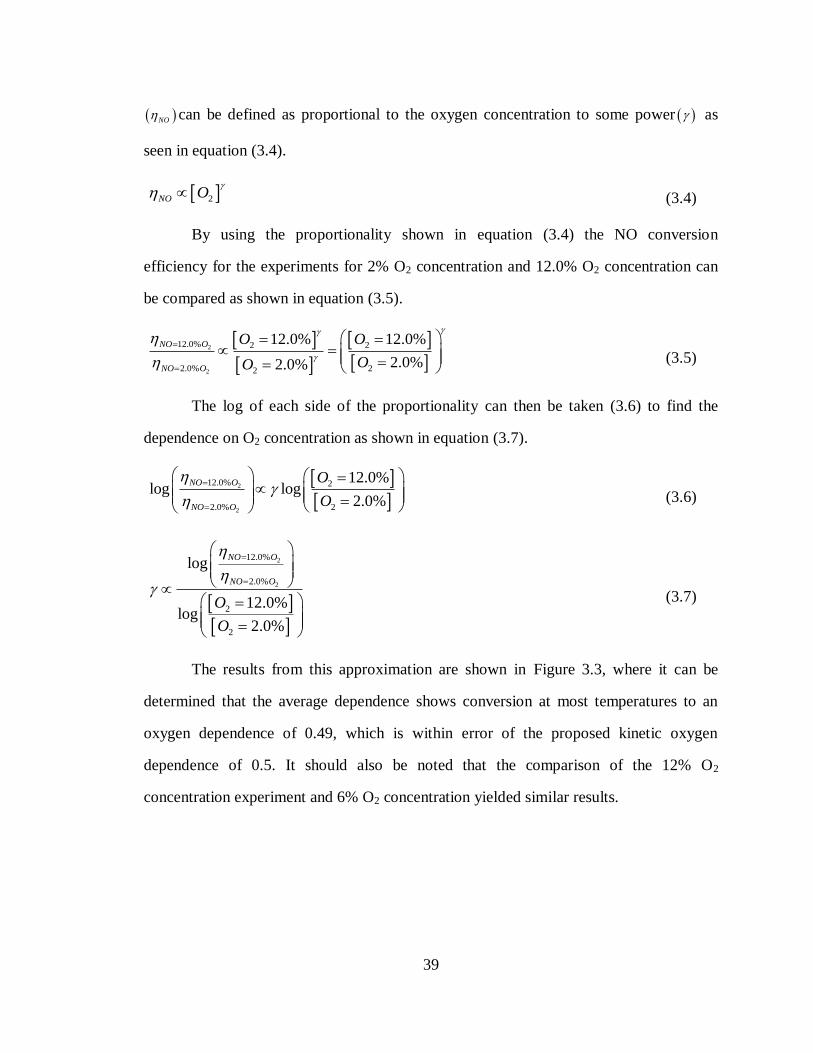
39
NO can be defined as proportional to the oxygen concentration to some power as
seen in equation (3.4).
2NO O
(3.4)
By using the proportionality shown in equation (3.4) the NO conversion
efficiency for the experiments for 2% O2 concentration and 12.0% O2 concentration can
be compared as shown in equation (3.5).
2
2
12.0% 2 2
2.0% 22
12.0% 12.0%
2.0%2.0%
NO O
NO O
O O
OO
(3.5)
The log of each side of the proportionality can then be taken (3.6) to find the
dependence on O2 concentration as shown in equation (3.7).
2
2
12.0% 2
2.0% 2
12.0%log log
2.0%
NO O
NO O
O
O
(3.6)
2
2
12.0%
2.0%
2
2
log
12.0%log
2.0%
NO O
NO O
O
O
(3.7)
The results from this approximation are shown in Figure 3.3, where it can be
determined that the average dependence shows conversion at most temperatures to an
oxygen dependence of 0.49, which is within error of the proposed kinetic oxygen
dependence of 0.5. It should also be noted that the comparison of the 12% O2
concentration experiment and 6% O2 concentration yielded similar results.

40
0
0.2
0.4
0.6
0.8
1
200 250 300 350 400 450
12% O2 / 2% O
2
Average
O2 D
ep
ed
en
ce
(-)
Temperature (C)
Figure 3.3 − Experimental data matches a half order oxygen dependence for the oxidation
of NO to NO2, all experiments were performed as a temperature ramp with 6% H2O, 6%
CO2, and 1000 ppm NO in the feed gas.
Figure 3.4 shows the reverse direction of the NO oxidation reaction in equation
(3.1) will decrease conversion of NO2 to NO as oxygen concentration increases. The
effect of oxygen concentration is negligible for the reverse rate which is dominated by the
equilibrium kinetics shown in Figure 3.1.

41
0
10
20
30
40
50
60
70
250 300 350 400 450 500
0% O2
6% O2
NO
2 C
on
ve
rsio
n (
%)
Temperature (C)
Figure 3.4 − O2 concentration has negligible effects on NO2 conversion to NO. All
experiments were performed as a temperature ramp with 6% H2O, 6% CO2, and 1000
ppm NO2 in the feed gas.
NO Oxidation Effect with varying H2O and CO2 concentration
While it is widely acknowledged that increases in H2O concentration will
decrease NO oxidation to NO2, the magnitude of this effect will differ among types of
SCR catalysts [79, 80]. It was found by Petunchi and Hall [78] that water strongly
inhibits the oxidation of NO to the point of complete suppression, however small
amounts of NO2 can still be stored in the presence of this water. It is assumed that CO2
has very little effect on the NO oxidation process [81]. As a result it was theorized that
nitrogen dioxide is the principal component of the NOx in contact with the catalyst and
available for the SCR process [82]. With respect to zeolite catalysts, copper ion-
exchanged zeolites are more active then iron ion-exchanged zeolite catalysts for
oxidation of NO to NO2 [42]. While there was still some questions with respect to this
being the initial step in the reaction mechanism [83], most authors agree that the copper is
desired to activate the NO to form NO2 to enhance conversion for lean SCR operation

42
[81, 84]. Eventually, it was determined that this NO oxidation reaction is the rate
determining step over a H-ZSM-5 catalyst [85-89]. Recent papers have illustrated that
this result can be generalized to the zeolite materials for the SCR process [90-93].
In the experiments shown in Figure 3.5, the oxidation of NO to NO2 is a
dominant effect when H2O is not present in the feed gas; however in experiments with
H2O present there are only negligible differences in conversion efficiencies. The same
effect is seen in the experiments shown in Figure 3.6 where NO2 conversion to NO is a
more dominant effect when H2O is not present, but when H2O is present there are only
negligible differences. Figure 3.5 and Figure 3.6 show a saturation effect of H2O
inhibition, where saturation effects commonly occur due to species with concentrations
above 1% [80].
0
20
40
60
80
100
200 250 300 350 400 450
0% H2O
6% H2O
8% H2O
10% H2O
NO
Co
nve
rsio
n (
%)
Temperature (C) Figure 3.5 − From 0 – 6% water concentration in the feed gas can have large effects on
the oxidation of NO to NO2, while there is little effect on the oxidation of NO to NO2
when comparing H2O concentration from 6 – 10%, all experiments were performed with
6% O2, and 1000 ppm NO.

43
0
20
40
60
80
100
200 250 300 350 400 450 500
0% H2O
6% H2O
10% H2O
NO
2 C
ov
ers
ion
(%
)
Temperature (C) Figure 3.6 − From 0 – 6% water concentration in the feed gas can have large effects in
the reduction of NO2 to NO, while there is little effect in the reduction of NO2 to NO
when comparing H2O concentration from 6 – 10%, all experiments were performed with
6% O2, and 1000 ppm NO.
3.1.2 NO Oxidation Modeling Results
To determine the kinetic rate expression for the NO oxidation reaction shown in
equation (3.1), a survey of the literature is performed to illustrate a number of important
points regarding the different chemical species and their adsorption properties on the
surface:
Water is weakly adsorbed [80], CO2 is not adsorbed and CO adsorption is
negligible.
Nitrates formed on surface are thermally stable even at conditions in
which SCR proceeds with a high rate [81].
CO adsorption is greater than NO adsorption [81, 94], however there is
little to no NO adsorption [95].
Zeolites absorb mainly NO2 and only a small amount of NO [78, 96].
Ammonia hinders oxidation of NO to NO2 [87].

44
The original kinetic expression for this reaction over a zeolite comes from a paper
based on work by Marangozis [97] and is based on a Langmuir-type isotherm as
illustrated in equation (3.8) . Because of the much weaker adsorption properties of NO
than O2, Marangozis converted the rate equation into a power-law format as shown in
equation (3.9). However, this form of the equation does not account for the equilibrium
limitation of the reaction as shown in Figure 3.1. Recent literature work by Brosius et al.
has formulated a reaction rate expression for this reaction over an iron-zeolite catalyst
[98]. They generated three different Langmuir-Hinshelwood type of mechanisms as
described in equations (3.10), (3.11), and (3.12). In their work, they found that the
kinetic rate used in equation (3.12) was more accurate than equation (3.11), while
predictions of kinetic rate in equation (3.10) appeared to be poor. It is interesting to note
that the Marangozis mechanism in equation (3.8) and the kinetic rate from Brosius et al.
in equations (3.10), (3.11), and (3.12) all include the negative half-order dependence on
oxygen as found for the NO decomposition reaction which can be validated from
experimental data shown in Figure 3.3.
2 2
2 2
0.5 0.5
NO O NO O
20.5 0.5
NO NO O O1
kK K y yR
K y K y
(3.8)
2 2
0.5
NO O NO O
mR kK K y y (3.9)
2
2
2 2
NO0.5
NO O
A NO C NO D H O1
eq
yk y y
KR
K y K y K y
(3.10)
2
2
2 2 2
NO0.5
NO O
2
ANO B O C NO D H O1
eq
yk y y
KR
K K y K y K y
(3.11)

45
2
2
2 2 2
2
NO2 0.5
NO O 2
3
A NO B O C NO D H O1
eq
yk y y
KR
K y K y K y K y
(3.12)
Due to equilibrium effects shown in Figure 3.1, the kinetic rate forms listed in
equations (3.8) and (3.9) can be eliminated. When evaluating the kinetic rate forms in
equations (3.10), (3.11), and (3.12) each contains an equilibrium term for the reverse rate,
and a half order dependence on oxygen concentration. Since pressure changes are
negligible due to the location of the EAS in exhaust stream, the equilibrium constant can
be determined as a function of temperature by fitting equation (3.13) [99] from
experimental data published in the JANAF tables [100].
2
1 2 3 4 5
1000log
1000 1000 1000eq
T T TK C C C C C
T
(3.13)
Additionally while each kinetic rate form contains an inhibition term for NO, O2
and NO2 present in the denominator the dependence on this inhibition changes. Each
inhibition term represents adsorption on the catalyst and can change the reaction rate for
the NO oxidation reaction shown in equation (3.1).
From literature it can be assumed that NO and O2 adsorption is negligible [95].
Experimentally by performing a Temperature Programmed Desorption experiment,
which will be described in greater detail in Section 3.2 (NH3 Storage), with NO2 in the
feed gas as shown in Figure 3.7. It can be determined that only a negligible amount of
NO2 will store on the catalyst, which rapidly thermally decomposes to become NO. The
effect of H2O inhibition can be determined from experiments shown in Figure 3.5 and
Figure 3.6 which are consistent with results by Kijlstra et al. with H2O levels saturating
the catalyst through the entire expected operational range of 6 – 12% H2O [80], it can be
assumed that H2O concentration will have negligible effects on NO oxidation. Due to
low adsorption of NO, O2 and NO2, and the saturation effect of H2O on the catalyst all

46
the inhibition terms can be neglected which became evident from further evaluation of
kinetics, where all inhibition terms optimized to extremely low values and therefore can
be neglected. This yields the kinetic rate form shown in equation (3.14) which is
consistent with kinetic models for copper based zeolite catalysts from Olsson et al. [45]
and Kim et al. [47].
1
2
2
NO0.5
1 NO OexpE
R Tu m
eq
yk y y
K
1R
(3.14)
0
100
200
300
400
500
0 2000 4000 6000 8000 10000 12000
Inlet NO2
Outlet NO2
Outlet NO
Temperature (C)
Co
nce
ntr
ati
on
(p
pm
) o
r T
em
pera
ture
(C
)
Time (s)
0
50
100
150
200
0 100 200 300 400 500
Inlet NO2
Outlet NO2
Outlet NO
Temperature (C)C
on
ce
ntr
ati
on
(p
pm
) o
r T
em
pera
ture
(C
)
Time (s) Figure 3.7 − Negligible amounts of NO2 storage capacity when performing a
Temperature Programmed Desorption (TPD) experiment (left). NO2 that does adsorb
rapidly converts to NO and does not store on the catalyst (right). The TPD experiment
was performed with a background of 8% H2O and 8% CO2.
One issue with the kinetic model shown in equation (3.14) is that it does not take
into account the presence of ammonia hindering the reaction. Due to the ability of NH3
to convert NO to N2 this is difficult to determine experimentally, while Wurzenberger et
al. [48] has proposed the kinetic rate form shown in equation (3.15), which is similar to
the kinetic rate shown in equation (3.14) but includes a surface coverage dependence for
free catalytic sites Z that reduce as NH3 stores on the catalyst.

47
1
2
2
NO0.5
1 NO OexpE
R Tu m
Z
eq
yk y y
K
1R
(3.15)
While equation (3.14) and (3.15) will yield the same modeling results for the
experimental data due to all available sites being free (i.e. 1Z ), there is no proof that
the oxidation of NO to NO2 occurs on the same catalytic site as NH3 storage therefore the
kinetic rate form shown in equation (3.14) is used for the global mechanism. The results
are shown in Figure 3.8 where the average error for the model is less than 2.0 ppm for the
entire experiment, thus the use of the kinetic rate shown in equation (3.14) is
corroborated.
0
200
400
600
800
1000
1200
200 250 300 350 400 450
Exp NO
Sim NO
Exp NO2
Sim NO2
Co
nc
en
tra
tio
n (
pp
m)
Temperature (C)
Figure 3.8 − Modeling results show good agreement for oxidation of NO to NO2,
modeling experiments were calibrated against a temperature ramp experiment with 8%
H2O, 8% CO2, 6% O2, and 1000 ppm NO.
3.2 NH3 Storage
NH3 storage can commonly be written as the difference in NH3 adsorption and
NH3 desorption which is shown as a reversible reaction in equation (3.16). NH3 storage

48
is the rate limiting step in SCR NOx conversion and therefore the most important reaction
when modeling a kinetic mechanism. While there are three possible ammonia storage
sites on a zeolite, this section is concerned primarily with the strongly chemisorbed state
(Brønsted and Lewis acid sites) [46], which literature suggests has a much larger
influence than the weakly adsorbed or chemisorbed states [45, 101]. Experimentally,
multiple storage sites would be seen if there are multiple peaks during desorption or
multiple shoulders during adsorption which correspond to different bonding strengths
from multiple storage sites. These were not present in any TPD experiment performed on
this catalyst. Because of the literature sources stated above and experimental results, a
simplification can be made by writing a generalized storage mechanism with only one
storage site as seen in equation (3.16):
1
13 3
f
r
r
rNH Z Z NH
(3.16)
where Z represents a free storage site that is active for stored ammonia on the zeolite.
This mechanism should perform well during steady-state storage events when there is
time for ammonia to bond to these strong sites due to the strongly bound chemisorbed
site being dominant in NH3 storage [45].
3.2.1 NH3 Storage Experimental Results
Commonly, a Temperature Programmed Desorption (TPD) experiment is
performed when using a bench-top style reactor to study effective storage of a species on
a catalyst.
Temperature Programmed Desorption (TPD)
In the early history of the zeolite catalyst, researchers wanted to know its acidic
properties because it led to a direct understanding of the heterogeneous catalysis that

49
occurs on the surface [102, 103]. One method often used was a Temperature-
Programmed Desorption (TPD) in order to determine the strength of the adsorbate-
adsorbent interaction and hence its “acidity strength” [104-110]. Ammonia was often
used during this process because it is small enough to enter all of the zeolite pores and
react with both Brønsted and Lewis acid sites [108]. During these experiments, up to
three different sites/types of ammonia storage took place with varying levels of potency.
The three types of ammonia storage are weakly adsorbed, chemisorbed, or strongly
chemisorbed states [109]. The strongly chemisorbed state is associated with structural
Brønsted hydroxyl groups and strong Lewis acidic sites [91, 104, 109]. The primary
advantage of zeolite-based catalysts for diesel NOx SCR is its ability to utilize these
Brønsted and Lewis sites [111].
To determine the role of the three different types of storage sites on the iron based
zeolite SCR catalyst in the EAS, multiple TPD experiments were performed to determine
the storage capacity of NH3. In Figure 3.9 it can be seen that there is a single desorption
peak indicating that we are primarily concerned with only the strongly chemisorbed state
for NH3 storage. Therefore, the storage capacity is defined as the total amount of NH3
stored on the entire catalyst in both Brønsted and Lewis sites. Experiments were
conducted in a test matrix with different initial storage temperatures (200°C – 475°C) and
different CO2 and H2O levels (0% – 10%). The space velocity was held constant at 33k
hr-1
, which corresponded to a total flow of 4 L/min. The experimental methodology is as
follows and is illustrated in Figure 3.9:
1. The TPD starts with the SCR inlet flow set at a constant NH3
concentration and temperature and continues until catalyst outlet
concentration rises to equal the inlet concentration. For this experiment,
the inlet NH3 concentration is set at 250 ppm.

50
2. Once the catalyst is filled (i.e. constant outlet NH3 concentration), the
controls shut off the inlet feed of NH3 and hold a constant temperature
until the outlet NH3 concentration coming from the catalyst approaches
zero.
3. Temperature is ramped at 5°C/min until it reaches peak normal operating
temperature for the catalyst system. For this experiment, this value is
500°C and once this temperature is reached, it is held for 5 minutes.
4. Lastly, cleaning of the catalyst follows utilizing an O2 and N2 mixture (not
shown in Figure 3.9). This allows the model to start with the assumption
that the surface is completely clear of absorbed species. At high
temperatures, oxidation of NH3 becomes a more dominant effect, which is
the process that cleans the catalyst [45, 79, 112]. This held the O2 and N2
mixture for 15 minutes above 500°C. Due to repeatability in experiments,
it can be assumed this cleaning process is sufficient.
5. This procedure was repeated for different storage temperatures in order to
obtain a temperature dependence on storage capacity.
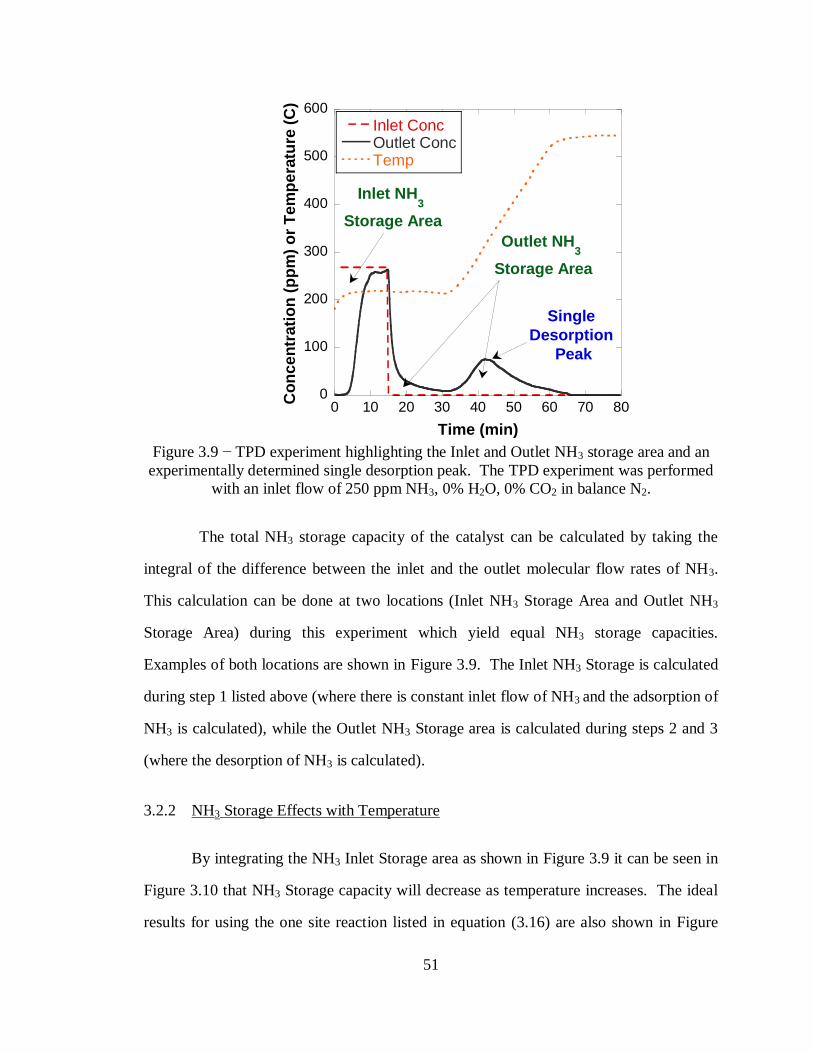
51
0
100
200
300
400
500
600
0 10 20 30 40 50 60 70 80
Inlet ConcOutlet ConcTemp
Co
nc
en
trati
on
(p
pm
) o
r T
em
pe
ratu
re (
C)
Time (min)
Inlet NH3
Storage Area
Outlet NH3
Storage Area
Single
Desorption
Peak
Figure 3.9 − TPD experiment highlighting the Inlet and Outlet NH3 storage area and an
experimentally determined single desorption peak. The TPD experiment was performed
with an inlet flow of 250 ppm NH3, 0% H2O, 0% CO2 in balance N2.
The total NH3 storage capacity of the catalyst can be calculated by taking the
integral of the difference between the inlet and the outlet molecular flow rates of NH3.
This calculation can be done at two locations (Inlet NH3 Storage Area and Outlet NH3
Storage Area) during this experiment which yield equal NH3 storage capacities.
Examples of both locations are shown in Figure 3.9. The Inlet NH3 Storage is calculated
during step 1 listed above (where there is constant inlet flow of NH3 and the adsorption of
NH3 is calculated), while the Outlet NH3 Storage area is calculated during steps 2 and 3
(where the desorption of NH3 is calculated).
3.2.2 NH3 Storage Effects with Temperature
By integrating the NH3 Inlet Storage area as shown in Figure 3.9 it can be seen in
Figure 3.10 that NH3 Storage capacity will decrease as temperature increases. The ideal
results for using the one site reaction listed in equation (3.16) are also shown in Figure

52
3.10. Due to experimental results deviating from the single storage site approximation, it
becomes apparent that there is a possibility of multiple storage sites present on the Fe-
zeolite based SCR catalyst used in the EAS. Since a non-analysis agreement has been
made evaluation of the strength of the different catalytic sites is not possible. However,
as shown in Figure 3.9 all NH3 is released in a single desorption peak which translates to
a similar bonding strength for all active sites, which allows for us to use the single site
approximation (equation (3.16)) in the global SCR kinetic model.
400
600
800
1000
1200
1400
1600
1800
2000
200 250 300 350 400
SimulationExperimental
NH
3 S
tora
ge
(g
/m3)
Temperature (C)
Ideal: Single Active Site
Actual: Multiple Active Sites
Figure 3.10 − Shows the integral NH3 storage capacity for the same brick, calculated by
integrating the storage capacity of TPD experiments performed at 225°C, 300°C, 350°C,
and 400°C. Each experiment had the same inlet gas concentrations of 250 ppm NH3, 0%
H2O, and 0% CO2.
3.2.3 NH3 Storage Kinetic Modeling
Once it has been established that the single storage reaction shown in equation
(3.16) can be used, common Arrhenius rate forms for surface chemistry can be used to
define the reaction with the forward rate expression as shown in equation (3.17).
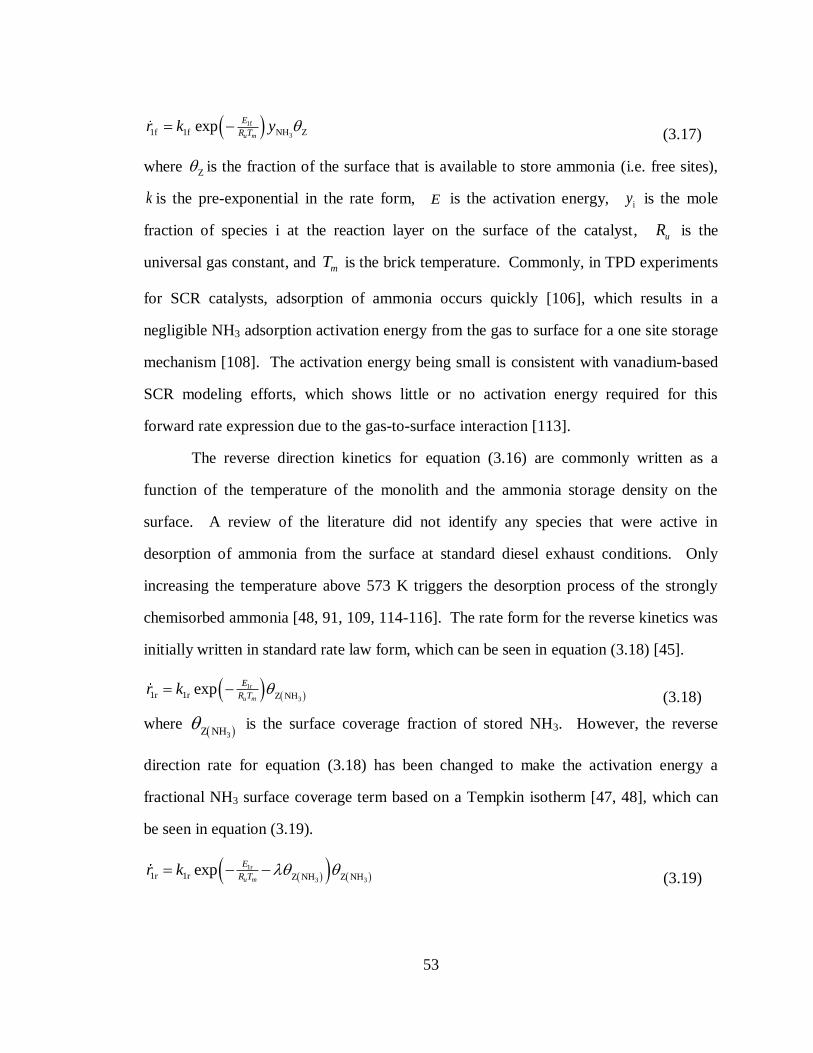
53
1f
31f 1f NH Zexpu m
E
R Tr k y
(3.17)
where Z is the fraction of the surface that is available to store ammonia (i.e. free sites),
k is the pre-exponential in the rate form, E is the activation energy, iy is the mole
fraction of species i at the reaction layer on the surface of the catalyst, uR is the
universal gas constant, and mT is the brick temperature. Commonly, in TPD experiments
for SCR catalysts, adsorption of ammonia occurs quickly [106], which results in a
negligible NH3 adsorption activation energy from the gas to surface for a one site storage
mechanism [108]. The activation energy being small is consistent with vanadium-based
SCR modeling efforts, which shows little or no activation energy required for this
forward rate expression due to the gas-to-surface interaction [113].
The reverse direction kinetics for equation (3.16) are commonly written as a
function of the temperature of the monolith and the ammonia storage density on the
surface. A review of the literature did not identify any species that were active in
desorption of ammonia from the surface at standard diesel exhaust conditions. Only
increasing the temperature above 573 K triggers the desorption process of the strongly
chemisorbed ammonia [48, 91, 109, 114-116]. The rate form for the reverse kinetics was
initially written in standard rate law form, which can be seen in equation (3.18) [45].
1r
31r 1r Z NH
expu m
E
R Tr k
(3.18)
where 3Z NH
is the surface coverage fraction of stored NH3. However, the reverse
direction rate for equation (3.18) has been changed to make the activation energy a
fractional NH3 surface coverage term based on a Tempkin isotherm [47, 48], which can
be seen in equation (3.19).
1r
3 31r 1r Z NH Z NH
expu m
E
R Tr k
(3.19)

54
where is a constant to multiply with the surface coverage of NH3. The Tempkin
isotherm reverse rate form shown in equation (3.19) was used, because the Tempkin
isotherm rate form increased the accuracy of the model for the TPD experiments when
compared to the standard reverse rate form (equation (3.18)). Modeling results showing
the comparison for these two reverse kinetic rate forms are shown in Figure 3.11.
0
100
200
300
400
0 500 1000 1500 2000 2500 3000
Standard Reverse Kinetics eq. (5-7)
Tempkin Isotherm Kinetics eq. (5-8)
Experimental NH3
Temperature (C)
Co
nc
en
tra
tio
n (
pp
m)
or
Te
mp
era
ture
(C
)
Time (s)
Figure 3.11 − Shows a slight increase in modeling accuracy when using the Tempkin
Isotherm Kinetics listed in equation (5-8). The modeling experiment was performed with
an inlet gas feed of 250 ppm NH3, 8% H2O, and 8% CO2 with an initial storage
temperature of 200°C
3.3 Selective Catalytic Oxidation of NH3
One advantage of zeolite catalysts is that they have a wider operating temperature
window than vanadium-based catalysts because of larger conversion rates at the higher
temperatures [15, 92, 116-118]. This conversion relates directly to the selective catalytic
oxidation (SCO) of ammonia which was found by Amiridis et al. over a Fe-Y zeolite
when the excess ammonia consumption during the SCR process corresponded to the
hypothesis that ammonia oxidation was occurring [119]; later corroborated by Stevenson

55
et al. over an H-ZSM-5 catalyst [88]. As a result, the SCO reaction is important to
model, as it becomes the upper bounds of SCR based activity.
Literature research into zeolite catalysts illustrates that Fe-ZSM-5 is a good
catalyst for the SCO process [120]. It can be significant for H-zeolite catalysts [88]
whereas Cu-ZSM-5 had the lowest instance of SCO in comparison [92]. Centi and
Perathoner reasoned that this limitation occurs in catalysts like Cu-ZSM-5 because they
form stronger nitrosyl species which inhibit the dissociative chemisorption of ammonia
which is the first step in oxidation to N2 [42]. The preparation of the catalyst is also
important because it can lead to extra framework cations and metal oxide clusters which
are too active for NH3 oxidation [92].
The oxidation of ammonia is commonly the weak point of global SCR kinetic
models due to a number of theorized ammonia oxidation reactions that can occur [121].
Bodenstein et al. [122] suggested a detailed mechanism listed in equations (3.20) - (3.23)
for the oxidation of NH3 with on a platinum wire.
3 3NH O NH O (3.20)
3 2NH O O HNO H O (3.21)
3 2 2NH O HNO N H O (3.22)
2 2HNO HNO N O H O (3.23)
It was also found that catalysts known to be active for NH3 oxidation (Pt/Pd/Rh-
ZSM-5) producing partial reduction of NH3 yielding NO and N2O as by-products [47, 48,
123] listed in equations (3.24) and (3.25) as well as complete reduction to N2 and H2O
[45, 79] as shown in equation (3.26) . Commonly all ammonia oxidation reactions are
written as surface reactions due to the strong bond of NH3 to the catalyst surface,

56
although Wurzenberger [48] suggests there is a possibility of NH3 oxidizing to complete
reduction in the gas phase as shown in equation (3.27).
3 2 2 24 4 2 6Z NH O Z N NO H O (3.24)
3 2 2 24 5 2 6Z NH O Z N O H O (3.25)
3 2 2 24 3 4 2 6Z NH O Z N H O (3.26)
3 2 2 24 3 2 6NH O N H O (3.27)
Over a Cu-ZSM-5 catalyst, it was found by Komatsu et al. [124] that NO and N2O
yields were less than 1% during ammonia oxidation experiments. In addition, the full
conversion of ammonia to N2 occurs at lower temperatures than the conversion to NO
[125]; which was also found over Cu-FAU catalyst [126]. Over a H-ZSM-5 catalyst [88],
the majority of the ammonia oxidized appears to be converted directly to N2 and not just
to NO. These results were further corroborated by Sjövall et al. [46] on Fe based zeolite
SCR catalysts. Figure 3.12 below shows concentrations on a temperature basis for an
ammonia oxidation experiment performed on the Fe based zeolite used in the EAS. From
these results it can be seen that only negligible values of NO and N2O are present during
the entire temperature range which corroborates Sjövall findings for a different iron based
zeolite SCR catalyst. Based on the experimental data shown in Figure 3.12 and the above
references, only the stoichiometric reaction to complete products is needed in a global
kinetic model.

57
0
200
400
600
800
1000
1200
200 250 300 350 400 450 500
NH3 Command
NH3
NO
NO2
N2O
Co
nce
ntr
ati
on
(p
pm
)
Temperature (C)
Figure 3.12 − NH3 oxidation temperature ramp experiment with an inlet feed gas of 6%
O2, 8% H2O, 8% CO2, and 1150 ppm NH3; yielded only negligible values of NO and
N2O for entire temperature range.
It is important to mention that the SCO of ammonia is not necessarily a negative
reaction as it can abate the ammonia slip after the SCR reactors without introducing other
reactants in the gas mixture and producing further pollutants [125]. This SCO process is
the basis for ammonia slip catalysts present in some SCR aftertreatment systems [127].
3.3.1 NH3 Oxidation Experimental Results
Experimental data for the ammonia oxidation reaction when using a bench-top
style reactor are collected using constant inlet concentrations and varying temperature in
a constant upward or downward ramp rate up to 5°C/min. Experimental results are then
compiled to show a conversion percentage vs. temperature profile.

58
NH3 Oxidation Effect of varying O2 concentration
It is commonly accepted that the SCO reactions are dependent on oxygen
concentrations. Kim et al. [47] suggests that for the oxidation of NH3 on a SCR catalyst
is subject to catalytic saturation of oxygen content. This means that there will be a law of
diminishing returns for the conversion of NH3 as O2 concentration increases. This can be
seen in Figure 3.13 where the NH3 conversion is shown as a function of temperature and
O2 concentration. NH3 conversion is defined in equation (3.28).
3 3
3
3
_ _
_
100NH IN NH OUT
NH
NH IN
c c
c
(3.28)
From Figure 3.13 it can be seen that NH3 conversion increases the most when O2
concentration increases from 0.5% to 2.0%. While there is in increase from 2.0% O2 to
6.0% O2 in the inlet feed gas, it is not as large as the change from 0.5% to 2.0%.
0
5
10
15
20
25
250 300 350 400 450 500
0.5% O2
2.0% O2
6.0% O2
NH
3 C
on
vers
ion
(%
)
Temperature (C)
Figure 3.13 − The conversion of NH3 due to oxidation increases as O2 levels in the feed
gas increase, with saturation effects shown when O2 concentration are greater than 2%.

59
3.3.2 Selective Catalytic Oxidation of NH3 Modeling Results
The SCO of NH3 was originally proposed by Stevenson et al. over a H-ZSM-5
[86, 88] as a Langmuir-Hinshelwood mechanism, where they assumed the rate of
ammonia oxidation is a function of the ammonia coverage and is zero order in oxygen
concentration as shown in equation (3.29).
3
3
NH
1 NH
ox a
a
k KR
K
(3.29)
where ammonia inhibition of the process is accounted by using the ammonia adsorption
constant Ka.
This rate form was determined from experiments with only 0.5% to 2.0% O2 in
the feed gas. This zero order functionality with respect to oxygen is hard to reason
considering that the stoichiometric reaction is a function of oxygen; it may be the result
of a relatively small sample of oxygen concentrations. As a result Olsson et al. [45],
Sjövall et al. [46], and Wurzenberger [48] all proposed a kinetic rate form as a first order
function of oxygen as shown in equation. As a result, the reaction mechanism includes
first-order dependence in the local coverage fraction of ammonia and oxygen levels:
2
232 2 OZ NH
expE
R Tu mk y
R (3.30)
While the kinetic rate form shown in equation (3.31), is commonly used when
describing the stoichiometric NH3 oxidation reaction shown in equation (3.26), Kim et al.
[47] suggests using a saturation effect which changes the kinetic rate equation from a first
order function of oxygen to a kinetic function based on a saturation effect of oxygen as
shown in equation (3.31).
2
232 2 OZ NH
expE
R Tu mk y
R (3.31)
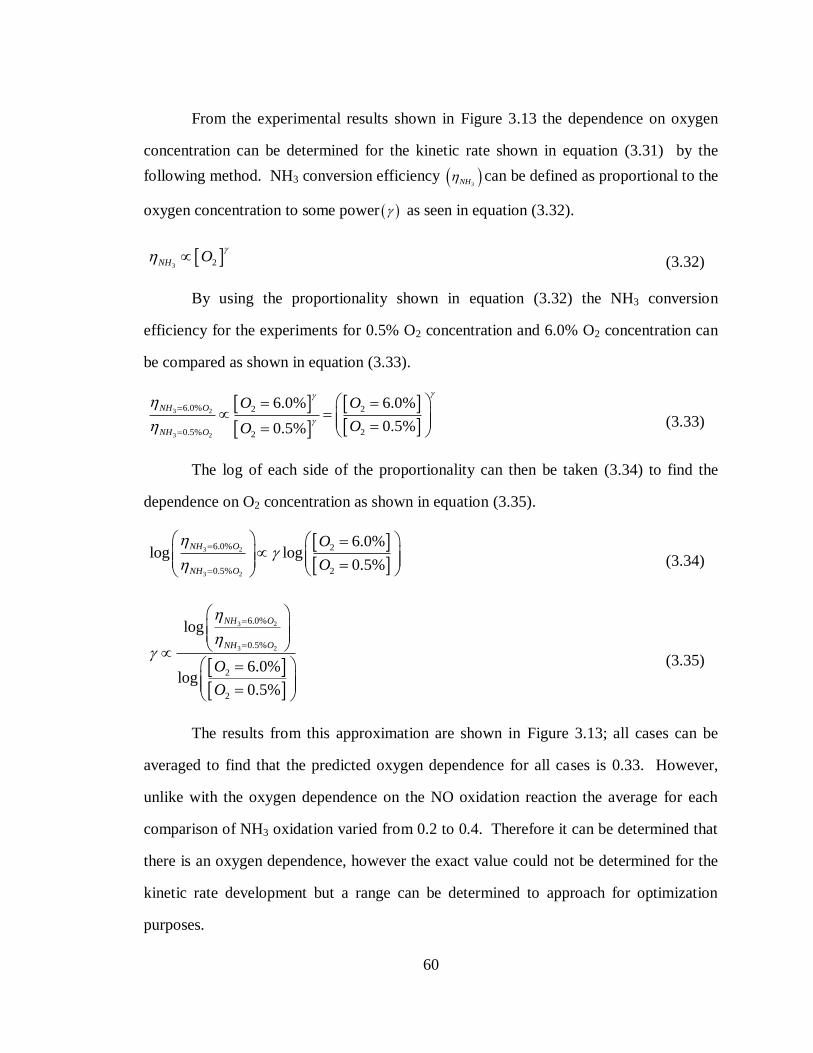
60
From the experimental results shown in Figure 3.13 the dependence on oxygen
concentration can be determined for the kinetic rate shown in equation (3.31) by the
following method. NH3 conversion efficiency 3NH can be defined as proportional to the
oxygen concentration to some power as seen in equation (3.32).
3 2NH O
(3.32)
By using the proportionality shown in equation (3.32) the NH3 conversion
efficiency for the experiments for 0.5% O2 concentration and 6.0% O2 concentration can
be compared as shown in equation (3.33).
3 2
3 2
6.0% 2 2
0.5% 22
6.0% 6.0%
0.5%0.5%
NH O
NH O
O O
OO
(3.33)
The log of each side of the proportionality can then be taken (3.34) to find the
dependence on O2 concentration as shown in equation (3.35).
3 2
3 2
6.0% 2
0.5% 2
6.0%log log
0.5%
NH O
NH O
O
O
(3.34)
3 2
3 2
6.0%
0.5%
2
2
log
6.0%log
0.5%
NH O
NH O
O
O
(3.35)
The results from this approximation are shown in Figure 3.13; all cases can be
averaged to find that the predicted oxygen dependence for all cases is 0.33. However,
unlike with the oxygen dependence on the NO oxidation reaction the average for each
comparison of NH3 oxidation varied from 0.2 to 0.4. Therefore it can be determined that
there is an oxygen dependence, however the exact value could not be determined for the
kinetic rate development but a range can be determined to approach for optimization
purposes.

61
0
0.2
0.4
0.6
0.8
1
300 350 400 450 500
6% O2 / 0.5% O
2
2% O2 / 0.5% O
2
6% O2 / 2% O
2
Average O2 Dependence ~ 0.33
O2 D
ep
ed
en
ce
(-)
Temperature (C)
Figure 3.14 – The average dependence of O2 on NH3 oxidation for all cases is 0.33, while
the average oxygen dependence for each individual case varies from 0.2 – 0.4.
From these results two kinetic models were developed to compare accuracy in the
two approaches. The first kinetic model was developed using the first order oxygen
kinetics proposed by Olsson et al. [45], Sjövall et al. [46], and Wurzenberger [48] as
shown in equation (3.30). The second kinetic model was accomplished by using Kim et
al. [47] saturation of O2 as shown in equation (3.31). Each kinetic model was developed
to compare with data from a temperature ramp experiment with 8% H2O, 8% CO2, 1000
ppm NH3, and 6% O2. A downhill simplex optimize was used to find the fit parameters
for each kinetic rate equation. In Figure 3.15 in can be seen that when only comparing at
a constant level of O2 either kinetic rate form is acceptable, however it would be
preferred to use less fit parameters so the first order oxygen kinetic approximation shown
in equation (3.30) would be used.

62
0
5
10
15
20
25
30
35
40
250 300 350 400 450 500
6.0% O2 Experimental
6.0% O2 First-order [O
2] Eq (7)
6.0% O2 Saturation [O
2]B Eq (8)
NH
3 C
on
ve
rsio
n (
%)
Temperature (C)
Figure 3.15 – Shows no discernable difference in modeling results for both kinetic rate
forms when compared with experimental data from a temperature ramp experiment with
a feed gas of 8% H2O, 8% CO2, 6% O2, and 1000 ppm NH3.
Due to the operation of rich and lean conditions in the EAS, different O2
concentrations need to be evaluated for a more comprehensive kinetic mechanism. To
evaluate the different rate forms it is important to compare the accuracy when O2 levels
change in the feed gas. From Figure 3.16 and Figure 3.17 it can be seen that the
saturation kinetic rate form shown in equation (3.31) increases the accuracy when O2
concentration is 2% and 0.5% respectively, therefore it is important to use saturation
kinetics when O2 concentration will vary by large amounts as seen in the EAS.

63
0
5
10
15
20
25
30
35
40
250 300 350 400 450 500
2.0% O2 Experimental
2.0% O2 First-order [O
2] Eq (7)
2.0% O2 Saturation [O
2]B Eq (8)
NH
3 C
on
ve
rsio
n (
%)
Temperature (C) Figure 3.16 – Shows variation when comparing the kinetic rate forms with the saturation
kinetic model yielding higher accuracy when compared with experimental data from a
temperature ramp experiment with a feed gas of 8% H2O, 8% CO2, 2% O2, and 1000 ppm
NH3.
0
5
10
15
20
25
30
35
40
250 300 350 400 450 500
0.5% O2 Experimental
0.5% O2 First-order [O
2] Eq (7)
0.5% O2 Saturatation [O
2]B Eq (8)
NH
3 C
on
ve
rsio
n (
%)
Temperature (C)
Figure 3.17 – Shows variation when comparing the kinetic rate forms with the saturation
kinetic model yielding higher accuracy when compared with experimental data from a
temperature ramp experiment with a feed gas of 8% H2O, 8% CO2, 0.5% O2, and 1000
ppm NH3.

64
3.4 NOx Reduction with NH3
NOx reduction is defined as the conversion of NO and NO2 from the feed gas
through the catalyst into environmentally benign compounds such as N2 as shown in
(3.36). NH3 SCR catalysts store NH3 on the surface which reacts with NOx and O2 in the
feed gas to from N2 and H2O.
2 2
2
_ _ _ _
_ _
100x
NO in NO in NO out NO out
NO
NO in NO in
c c c c
c c
(3.36)
3.4.1 Background
NOx reduction on an SCR catalyst is commonly thought of to occur as the results
of three simultaneous reactions shown in equations (3.37), (3.38), and (3.39) commonly
labeled as the Standard SCR reaction, the Fast SCR reaction, and the Slow SCR reaction
respectively [2, 3, 45-48, 128].
3 2 2 24 4 4 6NH NO O N H O (3.37)
3 2 2 22 2 3NH NO NO N H O (3.38)
3 2 2 28 6 7 12NH NO N H O (3.39)
The SCR NOx reduction reactions listed in equations (3.37), (3.38), and (3.39) are
assumed to contribute to NOx reduction simultaneously, as seen from previous results it
was concluded the SCR catalyst can oxidize NO to NO2 as well as thermally decompose
NO2 to NO. Due to the nature of these simultaneous NOx reduction reactions with NH3,
experimentally it can be determined that NOx reduction is highly dependent on catalyst
temperature and the NO to NOx ratio (NO:NOx), as illustrated in Figure 3.18.
65
0
20
40
60
80
100
200 250 300 350 400 450
NO:NOx = 0.00
NO:NOx = 0.25
NO:NOx = 0.50
NO:NOx = 0.75
NO:NOx = 1.00
NO
x C
on
ve
rsio
n (
%)
Temperature (C)
0
20
40
60
80
100
200 250 300 350 400 450
NO:NOx = 0.00
NO:NOx = 0.25
NO:NOx = 0.50
NO:NOx = 0.75
NO:NOx = 1.00
NH
3 C
on
ve
rsio
n (
%)
Temperature (C) Figure 3.18 – NOx conversion is highly dependent on the NO:NOx ratio in the feed gas
when comparing experiments performed with a feed gas of 6% H2O, 6% CO2, 6% O2,
400 ppm NH3, 400 ppm NOx.
Standard SCR Reaction
Lyon was one of the first to study the reaction between NH3, NO, and O2 on a
platinum catalyst. From Lyon’s observations the reaction with NH3 and NO without O2
present was trivial. Lyon then proposed a detailed mechanism to model the results from
NH3, NO, and O2 as seen in equations (3.40) - (3.45) [129].
2 2NH NO N H OH (3.40)
2 2 2NH NO N H O (3.41)
2H O OH O (3.42)
3 28NH O OH NH (3.43)
3 2 2NH OH NH H O (3.44)
3 2 2NH H H NH (3.45)

66
The reactions in equations (3.40) - (3.45) are all two body reactions that
demonstrate the detailed reduction of NO with NH3 in the presence of O2 as gas phase
reactions. Byrne et al. [29] combines these reactions to form one global three body
reaction as shown in equation (3.37).
3 2 2 24 4 4 6NH NO O N H O (3.37)
Fast SCR Reaction
The reduction of NO2 with NH3 was initially neglected because engine exhaust
composition heavily favored NO with at least 95% of the NOx composition [30, 130-
133]. It was later discovered by Kato et al. that NOx reduction with NH3 increases
dramatically if equal parts of NO and NO2 were present in the feed gas to the catalyst
[122]. Kato et al. proposed the following detailed reaction mechanism shown in
equations (3.46) - (3.50) for NOx conversion with NH3 when there is an equal ratio of NO
to NO2 in the feed gas to the catalyst.
3 3Z NH Z NH (3.46)
3 3Z NH NO Z NH NO (3.47)
3 2 2Z NH NO Z H N H O (3.48)
2Z H NO Z HONO (3.49)
2 2Z H HONO Z H ONO Z H O NO (3.50)
Due to the high reaction from experimental data, Kato et al. then proposed the global
reaction shown in equation (3.38) as a global reaction to describe the detailed mechanism
in equations (3.46) - (3.50).

67
3 2 2 22 2 3NH NO NO N H O (3.38)
Nova et al. [44] and Grossale et al. [134] investigated the surface nitrate
formation in the reduction of NO2 and NO with NH3 by performing experiments at low
temperatures and proposed the following reactions in equations (3.51) – (3.53) for
vanadium based SCR catalysts and iron based zeolite SCR catalysts respectively. Their
work elaborates on Kato’s reaction scheme by combining NO2 and NH3 to form
ammonium nitrate on the surface of the catalyst as a precursor to the Fast SCR reaction.
3 2 2 4 3 22 2NH NO N NH NO H O (3.51)
4 3 2 2 2NH NO NO NO N H O (3.52)
4 3 3 2 22 2 3 5NH NO NO NH N H O (3.53)
Nova [44] and Grossale [134] state their reaction scheme is important when
considering low temperature operation of a SCR catalyst due to the inhibition effects of
NH3 at low temperatures (Temperature < 200°C). Nova and Grossale also note that the
combination of the reactions shown in equations (3.51) – (3.53) can be combined to form
the global Fast SCR reaction shown in equation (3.38). To simplify the kinetics for the
development of the model, the SCR temperature will be investigated above 200°C where
the global Fast SCR reaction (equation (3.38)) can be used.
Slow SCR Reaction
Kato et al. [122] suggested that NO2 reduction with NH3 should show a similar
detailed reaction mechanism as the oxidation of NH3 as seen in equations (3.20) - (3.23),
however O2 should be replaced with NO2. Thus yielding the following reactions listed in
equations (3.54) – (3.58).

68
3 2 3NH NO NH O NO (3.54)
2NO O NO (3.55)
3 2NH O O HNO H O (3.56)
3 2 2NH O HNO N H O (3.57)
2 2HNO HNO N O H O (3.58)
Due to absence of intermediates in experimental results Kato et al. [122] suggested
equation (3.39) as the global reaction for NO2 reduction with NH3.
3 2 2 28 6 7 12NH NO N H O (3.39)
Ciardelli et al. [135] studied the NH3-NO2 reaction and published a modification
to Kato’s detailed reduction pathway as shown in equations (3.59) – (3.66).
2 2 42NO N O (3.59)
2 4 2 3N O H O HONO HNO (3.60)
3 4 2HONO NH NH NO (3.61)
4 2 2 22NH NO N H O (3.62)
3 3 4 3NH HNO NH NO (3.63)
4 3 2 22NH NO N O H O (3.64)
2NO NO O (3.65)
69
4 3 3 2 22 2 3 5NH NO NO NH N H O (3.66)
Ciardelli points out that the detailed mechanism combines to form the two global
reactions for NOx reduction and for N2O production as shown in equations (3.39) and
(3.67) respectively. A similar reaction for N2O production is also proposed by Kim et al.
[47] and Olsson et al. [45].
3 2 2 28 6 7 12NH NO N H O (3.39)
3 2 2 2 22 2 3NH NO N N O H O (3.67)
3.4.2 Experimental Results
Experimental data for the NOx reduction with NH3 while using a bench-top style
reactor was collected using a variety of experiments. Steady state data was taken in the
form of temperature ramp experiments, which consist of constant inlet concentrations and
varying temperature in a constant upward or downward ramp rate up to 5°C/min.
Experiments were also performed while switching from lean to rich exhaust to replicate
conditions behind a LNT catalyst. During these switching experiments NH3 is present
while rich feed gas is flowing across the catalyst, and oxygen and NOx are present while
the lean feed gas is flowing across the catalyst.
Effect of NH3 to NOx Ratio
It was already shown in Figure 3.18 that the NO to NOx ratio is important in
determining the NOx conversion capabilities of the SCR catalyst. It is also important to
consider NH3 to NOx ratio when predicting NOx conversion with NH3, due to the highly
reactive nature of NH3 on a SCR catalyst. Increasing the NH3 to NOx ratio will increase
the NOx conversion while lowering NH3 conversion which is confirmed in Figure 3.19.

70
It should be noted that NH3 is also a regulated tailpipe emission, and therefore the
limiting factor in the max NH3 to NOx ratio that can be used. Figure 3.19 can be used to
confirm the stoichiometric ratios of NH3 to NOx for the three global NOx reduction
reactions listed in equations (3.37), (3.38), and (3.39) by maximizing both NOx
conversion and NH3 conversion for a set of NH3 to NOx ratios. From Figure 3.19 it can
be confirmed that the stoichiometric NH3 to NOx ratio is 1.0 for the Standard SCR
reaction (equation (3.37)) and the Fast SCR reaction (equation (3.38)), and an NH3 to
NOx ratio of 1.3 for the Slow SCR reaction (equation (3.39)).

71
(a)
0
20
40
60
80
100
200 250 300 350 400 450 500
NH3:NO
x = 2.0
NH3:NO
x = 1.0
NH3:NO
x = 0.5
NO
x C
on
vers
ion
(%
)
Temperature (C)
0
20
40
60
80
100
200 250 300 350 400 450 500
NH3:NO
x = 2.0
NH3:NO
x = 1.0
NH3:NO
x = 0.5
NH
3 C
on
vers
ion
(%
)
Temperature (C)
(b)
0
20
40
60
80
100
200 250 300 350 400 450 500
NH3:NO
x = 2.0
NH3:NO
x = 1.0
NH3:NO
x = 0.5
NO
x C
on
ve
rsio
n (
%)
Temperature (C)
0
20
40
60
80
100
200 250 300 350 400 450 500
NH3:NO
x = 2.0
NH3:NO
x = 1.0
NH3:NO
x = 0.5
NH
3 C
on
ve
rsio
n (
%)
Temperature (C)
(c)
0
20
40
60
80
100
200 250 300 350 400 450 500
NH3:NO
x = 2.0
NH3:NO
x = 1.3
NH3:NO
x = 1.0
NH3:NO
x = 0.5
NO
x C
on
ve
rsio
n (
%)
Temperature (C)
Stoichiometric
Value
0
20
40
60
80
100
200 250 300 350 400 450 500
NH3:NO
x = 2.0
NH3:NO
x = 1.3
NH3:NO
x = 1.0
NH3:NO
x = 0.5
NH
3 C
on
ve
rsio
n (
%)
Temperature (C)
Stoichiometric
Value
Figure 3.19 – Increasing the NH3 to NOx ratio increases NOx conversion while lowering
NH3 conversion which increases the amount of NH3 slip. All experiments are performed
as a temperature ramp with a feed gas of 6% H2O, 6% CO2, 6% O2, 400 ppm NOx,
varying NH3 concentration (a) NO:NOx = 1.0, (a) NO:NOx = 0.5, (c) NO:NOx = 0.0.

72
Effect of O2 Concentration
By observing the reactions listed in equations (3.37), (3.38), and (3.39); it
becomes apparent that O2 only has an effect on the conversion of NO with NH3, where it
was first observed by Lyon [129] that NO conversion with NH3 is strongly enhanced in
the presence of oxygen. In Figure 3.20 it can be seen there is negligible effect due to O2
concentration on NOx conversion when the NO to NOx ratio is 0.5 or 0.0, however there
is a distinct increase in NOx conversion as O2 concentration increases when the NO to
NOx ratio is 1.0 which is studied further in the next section.
(a)
0
20
40
60
80
100
200 250 300 350 400 450
0% O2
2% O2
6% O2
NO
x C
on
ve
rsio
n (
%)
Temperature (C) (b)
0
20
40
60
80
100
200 250 300 350 400 450 500
0% O2
2% O2
6% O2
NO
x C
on
ve
rsio
n (
%)
Temperature (C)
(c)
0
20
40
60
80
100
200 250 300 350 400 450 500
0% O2
2% O2
6% O2
NO
x C
on
ve
rsio
n (
%)
Temperature (C)
Figure 3.20 – NOx conversion is a strong function of O2 concentration only when the
composition of NOx in the feed gas favors NO. The experiments were performed with a
feed gas composition of 8% H2O, 8% CO2, 1000 ppm NH3, 1000 ppm NOx, varying O2
concentration (a) NO:NOx = 1.0, (b) NO:NOx = 0.5, (c) NO:NOx = 0.0

73
O2 Effect on the Standard SCR Reaction
As discussed earlier it was found by Lyon [129] that NH3 will have a strong
reaction with NO in the presence of O2 on a platinum based catalyst. Lyon also found
there is a reaction with NH3 and NO without O2 but it is much lower than with O2 present
[129]. Similarly in Figure 3.21 it can be seen that NO reduction with NH3 without O2
still exists but is small in comparison to when O2 is present.
0
20
40
60
80
100
200 250 300 350 400 450
0% O2
2% O2
6% O2
NO
x C
on
ve
rsio
n (
%)
Temperature (C)
Figure 3.21 – NOx conversion is a strong function of O2 concentration for all experiments
performed with a feed gas composition of 8% H2O, 8% CO2, 400 ppm NH3, 400 ppm
NOx, varying O2 concentration
An additional reaction can be added for conversion of NO with NH3 without O2 as
seen in equation (3.68) commonly called the Rich Standard SCR reaction.
3 2 24 6 5 6NH NO N H O (3.68)
It should be noted that due to the low conversion of NO with NH3 without O2 the reaction
listed in equation (3.68) is removed from most literature models since their kinetic
mechanisms are going to be used for lean exhaust conditions.

74
By confirming NOx conversion for the Standard SCR reaction is dependent on
oxygen concentration from Figure 3.21, as seen previously equation (3.69) can be formed
by assuming the NOx conversion efficiency xNO is proportional to the oxygen
concentration to some power .
2xNO O
(3.69)
By using the proportionality shown in equation (3.69) the experiments for 2% O2
concentration and 6.0% O2 concentration can be compared as shown in equation (3.70).
2
2
6.0% 2 2
2.0% 22
6.0% 6.0%
2.0%2.0%
x
x
NO O
NO O
O O
OO
(3.70)
The log of each side of the proportionality can then be taken (3.71) to find the
dependence on O2 concentration as shown in equation (3.72).
2
2
6.0% 2
2.0% 2
6.0%log log
2.0%
x
x
NO O
NO O
O
O
(3.71)
2
2
6.0%
2.0%
2
2
log
6.0%log
2.0%
x
x
NO O
NO O
O
O
(3.72)
Figure 3.22 shows the O2 dependence as a function of temperature. A strong
dependence on O2 concentration would signify a straight line at each temperature. Due to
minimal conversion of NO with NH3 in experiments without oxygen, it is important to
include the oxygen concentration term in the kinetic rate for the Standard SCR reaction.
The dependence on O2 concentration for the NO Oxidation reaction could be determined
using this method because it is the only reaction occurring on the catalyst; while the
Standard SCR reaction yields inconclusive results due to the simultaneous reactions of
NH3 oxidation, NO oxidation, the Standard SCR reaction, the Fast SCR reaction, and the

75
Slow SCR reaction taking place on the catalyst surface at the same time. Due to the
simultaneous nature of the NOx reduction reactions it can be concluded that O2
dependence is not constant, but a strong function of temperature through the tested
temperature range.
0
0.2
0.4
0.6
0.8
1
200 250 300 350 400 450 500
O2 D
ep
ed
an
ce (
-)
Temperature (C)
Figure 3.22 – The dependence on O2 is not constant and therefore is not independent of
temperature.
Effect of NH3 Storage on NOx Conversion
Experiments from this section are performed to study the effect of stored NH3 on
NOx conversion capabilities for the iron based zeolite SCR catalyst in the EAS. Under
steady state conditions NH3 levels react instantly with NOx on the catalyst to form N2 and
H2O. In an LNT SCR aftertreatment system, NOx is stored on the LNT during lean
exhaust operation. NH3 is produced as a byproduct as of NOx reduction with H2 during a
rich regeneration of the LNT catalyst. The SCR in the EAS operates by storing the NH3
from the rich regeneration to react with any NOx that slips during lean operation. An
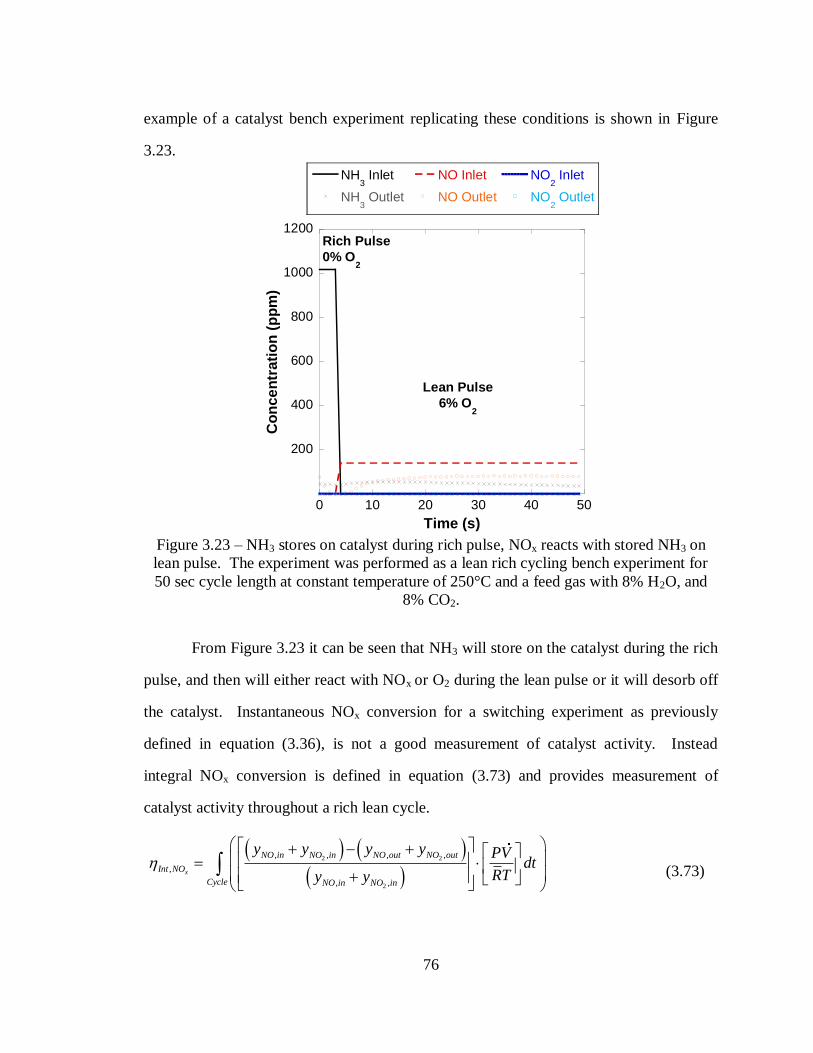
76
example of a catalyst bench experiment replicating these conditions is shown in Figure
3.23.
200
400
600
800
1000
1200
0 10 20 30 40 50
NH3 Inlet
NH3 Outlet
NO Inlet
NO Outlet
NO2 Inlet
NO2 Outlet
Co
nc
en
tra
tio
n (
pp
m)
Time (s)
Rich Pulse
0% O2
Lean Pulse
6% O2
Figure 3.23 – NH3 stores on catalyst during rich pulse, NOx reacts with stored NH3 on
lean pulse. The experiment was performed as a lean rich cycling bench experiment for
50 sec cycle length at constant temperature of 250°C and a feed gas with 8% H2O, and
8% CO2.
From Figure 3.23 it can be seen that NH3 will store on the catalyst during the rich
pulse, and then will either react with NOx or O2 during the lean pulse or it will desorb off
the catalyst. Instantaneous NOx conversion for a switching experiment as previously
defined in equation (3.36), is not a good measurement of catalyst activity. Instead
integral NOx conversion is defined in equation (3.73) and provides measurement of
catalyst activity throughout a rich lean cycle.
2 2
2
, , , ,
,
, ,
x
NO in NO in NO out NO out
Int NO
Cycle NO in NO in
y y y y PVdt
RTy y
(3.73)

77
Figure 3.24 summarizes the integral NOx conversion, for switching experiments
with six consecutive cycles at six different catalyst temperatures. Error analysis is
performed as the RMS value of the standard deviation of integral NOx conversion for the
six consecutive cycles and the measurement error from the bench top reactor used in the
experiments. When comparing the switching experiments with steady state experiments
shown in Figure 3.18, it can be seen that steady experiments approach 90% conversion
efficiency above 350°C, it can be seen that at temperatures above 375°C the integral NOx
conversion becomes limited by the amount of NH3 the catalyst can store.
0
20
40
60
80
100
200 250 300 350 400 450 500
NO:NOx = 1.0
NO:NOx = 0.7
NO:NOx = 0.5
NO:NOx = 0.3
Inte
gra
l N
Ox C
on
vers
ion
(%
)
Temperature (C)
NH3 Storage
Limited Zone
Figure 3.24 – Integral NOx conversion decreases as temperature increase above 300°C,
due to the limited ability to store NH3 at high temperatures in switching experiments. All
experiments are performed with a rich pulse of 8% H2O, 8% CO2, 1000 ppm NH3; and a
lean pulse of 8% H2O, 8% CO2, 150 ppm NOx, with varying NO to NOx ratios.
From the results shown in Figure 3.24 it can be seen that stored NH3 on the
catalyst is used to convert NOx in the feed gas, therefore the gas phase NOx reduction
reactions shown in equations (3.37), (3.38), (3.39), (3.68), and (3.67) can be rewritten as
the NH3 storage reactions shown in equations (3.74), (3.75), (3.76), (3.77), and (3.78)

78
respectively which confirms results by Kim et al. [47], Olsson et al. [45], and
Wurzenberger et al. [48].
3 2 2 24 4 4 4 6Z NH NO O Z N H O (3.74)
3 2 2 22 2 2 3Z NH NO NO Z N H O (3.75)
3 2 2 28 6 8 7 12Z NH NO Z N H O (3.76)
3 2 24 6 4 5 6Z NH NO Z N H O (3.77)
3 2 2 2 22 2 2 3Z NH NO Z N N O H O (3.78)
Temperature Effects
Due to the dependence of temperature on the storage of NH3 on the catalyst a
possibility exists for a hysteresis where NOx will differ depending on the direction of the
temperature ramp in an experiment [136]. Figure 3.25, Figure 3.26, and Figure 3.27
show experiments performed with a constant feed gas where temperature was ramped
upwards at 5°C/min from 200°C to 500°C then temperature was ramped downward at
5°C/min from 500°C to 200°C. From these experiments a small hysteresis effects is seen
where NOx conversion is lower during the downward ramp due to less NH3 being
available on the catalyst. Additionally, in Figure 3.25, Figure 3.26, and Figure 3.27 it
can be seen that at lower temperatures (T ≈ 200°C) the onset of nitrate formation can be
seen from the experimental data. Nitrate formation can occur as low as 150°C where
NO2 formed at the catalyst surface can combine with H2O to inhibit NOx conversion with
NH3 on the catalyst. It was found by Despres et al. [137], Nova et al. [44], and Ciardelli
et al. [135] that nitrates once formed can be removed at low temperature by NO, or by
increasing temperature on the catalyst.

79
0
20
40
60
80
100
200 250 300 350 400 450 500 550
Increasing TemperatureDecreasing Temperature
NO
x C
on
ve
rsio
n (
%)
Temperature (C)
Hysteresis
EffectNitrate
Formation
Figure 3.25 – Upward and downward temperature ramps differ with a small hysteresis
effect between 350–450°C, additionally NOx conversion changes differ at low
temperatures due to the onset of nitrate formation. The experiment was performed as an
upward and then downward temperature ramp with a feed gas of 6% H2O, 6% CO2, 6%
O2, 1000 ppm NH3, and 1000 ppm NO.
0
20
40
60
80
100
200 250 300 350 400 450 500
Upward RampDownward Ramp
NO
x C
on
vers
ion
(%
)
Temperature (C)
Hysteresis Effect
Figure 3.26 – Negligible hysteresis effect on NOx conversion for Fast SCR reaction. The
experiment was performed as an upward and downward temperature ramp with 6% H2O,
6% CO2, 0% O2, 1000 ppm NH3, 500 ppm NO, 500 ppm NO2.

80
0
20
40
60
80
100
200 250 300 350 400 450 500
Upward RampDownward Ramp
NO
x C
on
vers
ion
(%
)
Temperature (C)
Hysteresis Effect
Nitrate Formation
Figure 3.27 – Large hysteresis effect in NOx conversion for Slow SCR reaction at low
temperatures due to the nitrate formation on the catalyst. The experiment was performed
as an upward and downward temperature ramp with 6% H2O, 6% CO2, 0% O2, 1000 ppm
NH3, 750 ppm NO2.
3.4.3 NOx Reduction with NH3 Modeling Approach
The modeling approach for NOx reduction with NH3 is accomplished by
simultaneously determining the kinetic rate parameters of the four reactions shown
(3.74), (3.75), (3.76), and (3.78). However, the kinetic parameters for the Rich Standard
SCR reaction where the reaction shows reduction of NO with NH3 when O2 is not present
in the feed gas (equation (3.77)) can be determined independently of the other NOx
reduction reactions.
Rich Standard SCR (O2 = 0%)
The Rich SCR reaction shown in equation (3.77) shows the reduction pathway of
NO with NH3 when O2 is not present in the feed gas. The kinetic rate form shown in
equation (3.79) is developed from standard surface species reactions shown in Chapter 2.

81
3 2 24 6 4 5 6Z NH NO Z N H O (3.77)
3exp
E
R T
NO Z NHR k y
(3.79)
Figure 3.28 shows acceptable agreement in concentration values for experimental
results compared to modeling results using the reaction shown in equation (3.77) with the
standard kinetic rate form show in equation (3.79). While Figure 3.29 shows expected
conversion levels for this reaction when comparing experimental and modeling results.
0
200
400
600
800
1000
1200
200 250 300 350 400 450 500
Sim NH3
Exp NH3
Sim NO
Exp NO
Co
nc
en
trati
on
(p
pm
)
Temperature (C)
Figure 3.28 – The model for the Rich Standard SCR reaction accurately predicts the NH3
and NO concentrations for a temperature ramp experiment with feed gas of 8% H2O, 8%
CO2, 0% O2, 1000 ppm NH3, 1000 ppm NO

82
0
5
10
15
20
200 250 300 350 400 450 500
SimulationExperimental
NH
3 C
on
vers
ion
(%
)
Temperature (C)
0
5
10
15
20
200 250 300 350 400 450 500
SimulationExperimental
NO
Co
nv
ers
ion
(%
)
Temperature (C) Figure 3.29 – NO Conversion is low without O2 present in feed gas, standard Arrhenius
rate kinetics capture this effect well.
Standard SCR (O2 > 0%)
The Standard SCR reaction is the reduction of NO with NH3 in the presence of
O2. In the early days of SCR modeling, quite often the only reaction used was a gas
phase standard SCR reaction shown in equation (3.37). This assumption was made since
NOx in engine exhaust is approximately greater than 95% NO [4].
3 2 2 24NH 4NO O 4N 6H O (3.37)
A common thought was that for many catalysts different SCR surfaces the
kinetics of SCR can be modeled with simple power-law kinetics as shown in equation
(3.80) [125, 130-133, 138].
3 2NH NO OSCR SCRR k
(3.80)
While power-law kinetics are feasible, it is generally accepted that the rate of the
SCR of NO by NH3 obeys a Langmuir-Hinshelwood type mechanism involving reaction
on copper-containing sites of an adsorbed species derived from NO with a different
adsorbed species derived from NH3 with a stronger adsorption of NH3 than NO [41]. A

83
Langmuir-Hinshelwood type mechanism would also allow a pathway for results found by
Stevenson et al. [130] and Eng and Bartholomew [132], where high levels of ammonia
can inhibit the SCR reaction by replacing the available nitrate sites as shown in equation
(3.81).
2
3
NO O
1 NH
SCR
SCR
a
kR
K
(3.81)
From current kinetic mechanisms for SCR catalysts where more than one NOx
reduction pathway exists, it is assumed that NOx will only react with NH3 stored on the
catalyst surface and the reaction will written according to equation (3.74) [45-48, 128].
3 2 2 24 4 4 6Z NH NO O Z N H O (3.74)
Sjövall et al. [46], Olsson et al. [45], Narayanaswamy and He [128], and
Wurzenberger [48], all suggest that a kinetic rate in equation (3.82) with first order
dependence on oxygen concentration be used to describe the standard SCR reaction in
equation (3.74).
2 3exp
E
R T
NO O Z NHR k y y
(3.82)
While Kim et al. [47] suggest that the kinetic rate form should have an oxygen
dependence for saturation effects of oxygen as shown in equation (3.83).
2 3exp
E
R T
NO O Z NHR k y y
(3.83)
From earlier results it can be seen that it is important to keep oxygen
concentration in the kinetic rate but the power dependence on oxygen concentration could
not be determined (Figure 3.22). Therefore, the kinetic rates from equations (3.82) and
(3.83) were both fit to using a downhill simplex optimizer to data from a temperature
ramp experiment with a feed gas composition of 8% H2O, 8% CO2, 6% O2, 1000 ppm

84
NH3, and 1000 ppm NO. The results were then compared to a similar experiment with
2% O2. Figure 3.30 shows how both kinetic rate forms compare to experimental results.
Each kinetic rate yields the same result for the 6% O2 experiment. The standard kinetic
rate form in equation (3.82) yielded more accurate NH3 concentration results for the 2%
O2 case, while the oxygen dependent rate form shown in equation (3.83) yielded more
accurate NO conversion results. Due acceptable accuracy with each kinetic rate, it can be
assumed that either rate for could be used, however due to less rate parameters being
present in the standard rate form shown in equation (3.82) is suggested to be used.
0
20
40
60
80
100
200 250 300 350 400 450 500 550
2% O2 Experimental
2% O2 Saturatation [O
2]B
2% O2 First-order [O
2]
6% O2 Experimental
6% O2 Saturatation [O
2]B
6% O2 First-order [O
2]
NO
Co
nv
ers
ion
(%
)
Temperature (C)
0
20
40
60
80
100
200 250 300 350 400 450 500 550
2% O2 Experimental
2% O2 Saturatation [O
2]B
2% O2 First-order [O
2]
6% O2 Experimental
6% O2 Saturatation [O
2]B
6% O2 First-order [O
2]
NH
3 C
on
vers
ion
(%
)
Temperature (C) Figure 3.30 – The first order kinetic O2 approximation is more accurate for NO
predictions while the saturation kinetic O2 approximation is more accurate for NH3
predictions. Each experiment was performed as a temperature ramp experiment with
feed gas of 8% H2O, 8% CO2, 1000 ppm NH3, 1000 ppm NO, with O2 concentration as
listed
Fast SCR
The Fast SCR reaction shown in equation (3.75) has commonly been modeled
with two methods, the first approach is a more detailed approach where NO2 and NH3
will form a ammonia nitrate on the catalyst surface which can then be reduced by NO as
shown in equations (3.46) - (3.50). While the second approach models the global Fast
SCR reaction using a standard Arrhenius rate form shown in equation (3.84).

85
3 2 2 22 2 2 3Z NH NO NO Z N H O (3.75)
2 3exp
E
R T
NO NO Z NHR k y y
(3.84)
Due to the temperature range expected the global reaction approach is used with
the results shown in Figure 3.31. From the modeling results it can be seen that simulation
predictions are statistically significant when the catalyst temperature is between 200°C –
450°C, while at temperatures above 450°C the model under predicts NOx conversion.
0
20
40
60
80
100
200 250 300 350 400 450 500
SimulationExperimental
NO
x C
on
ve
rsio
n (
%)
Temperature (C)
0
20
40
60
80
100
200 250 300 350 400 450 500
SimulationExperimental
NH
3 C
on
ve
rsio
n (
%)
Temperature (C) Figure 3.31 – Simulation prediction for NOx conversion and NH3 conversion is within
error for 200°C – 450°C. The experiment was performed as a temperature ramp with 8%
H2O, 8% CO2, 0% O2, 1140 ppm NH3, 540 ppm NO, 268 ppm NO2.
Slow SCR
The global Slow SCR reaction shown in equation (3.76) is similar to the global
fast SCR reaction, in that it can be modeled by two methods, the first approach is a more
detailed approach where NO2 and NH3 will form a ammonia nitrate on the catalyst
surface which can then be reduced by thermal decomposition of NO2 to NO or by
reduction of nitrate formation with HONO as shown in equations (3.59) – (3.66). The

86
second approach is to use an Arrhenius rate form for the global reaction shown in
equation (3.85).
3 2 2 28 6 8 7 12Z NH NO Z N H O (3.76)
2 3exp
E
R T
NO Z NHR k y
(3.85)
Due to the temperature range expected the global reaction approach is used with
the results shown in Figure 3.32. From the modeling results it can be seen that simulation
predictions are statistically significant for the tested temperature range.
0
20
40
60
80
100
200 250 300 350 400 450 500
SimulationExperimental
NO
x C
on
ve
rsio
n (
%)
Temperature (C)
0
20
40
60
80
100
200 250 300 350 400 450 500
SimulationExperimental
NH
3 C
on
ve
rsio
n (
%)
Temperature (C) Figure 3.32 – Simulation predicts NOx and NH3 conversion within error NO2 conversion
with NH3. The experiment was performed as a temperature ramp with 8% H2O, 8%
CO2, 0% O2, 1110 ppm NH3, 800 ppm NO2.
3.5 Model Validation
Validation of a kinetic mechanism is done by comparing simulation results with
experimental results not used for determining kinetic parameters. If simulation results
are within experimental error, that model is validated to the accuracy the validation
experiment.

87
3.5.1 Summary of Global SCR Mechanism
From the previous sections the following lean mechanism has been established as
a starting point for developing a kinetic mechanism for the SCR catalyst in the EAS. A
summary of the reactions and rate forms are listed in Table 3.1, while Table 3.2 lists
corresponding parameters for the listed kinetic rates listed in Table 3.1.
Table 3.1 − Summary of chemical reaction and kinetic rates for lean SCR model
Chemical Reaction Kinetics Rate Form
(R1) 2 2
1
2NO O NO
1
2
21 1 exp
E
NORT
NO O
eq
yR k y y
K
(R2) 3 3Z NH Z NH
22 3
3 32 2 2 exp
rr Z NH
E
RT
f NH Z r Z NHR k y k
(R3) 3 2 2 24 3 4 2 6Z NH O Z N H O
3
3
2 33 3 exp
E
RT
O Z NHR k y
(R4) 3 2 24 6 4 5 6Z NH NO Z N H O
4
34 4 exp
E
RT
NO Z NHR k y
(R5) 3 2 2 24 4 4 4 6Z NH NO O Z N H O
5
2 35 5 exp
E
RT
NO O Z NHR k y y
(R6) 3 2 2 22 2 2 3Z NH NO NO Z N H O
6
2 36 6 exp
E
RT
NO NO Z NHR k y y
(R7) 3 2 2 28 6 8 7 12Z NH NO Z N H O
7
2 37 7 exp
E
RT
NO Z NHR k y
(R8) 3 2 2 2 22 2 2 3Z NH NO Z N N O H O
8
2 38 8 exp
E
RT
NO Z NHR k y

88
Table 3.2 − Summary of kinetic parameters used in the lean SCR model kinetic model
Parameter Value Units
Site density 21.13 10 [kmol m-2
]
1k 01.06 10 [kmol m-3
s-1
]
1E 24.64 [kJ mol-1
]
2 fk 27.99 10 [kmol m-2
s-1
moleNH3-1
]
2rk 71.29 10 [kmol m-2
s-1
]
2rE 98.00 [kJ mol-1
]
2r 0.2894 [-]
3k 11.31 10 [kmol m-2
s-1
moleO2-1
]
3E 66.79 [kJ mol-1
]
3 0.2585 [-]
4k 33.63 10 [kmol m-2
s-1
moleNO-1
]
4E 57.94 [kJ mol-1
]
5k 72.6 10 [kmol m-2
s-1
moleNO-1
moleO2-1
]
5E 76.29 [kJ mol-1
]
6k 95.41 10 [kmol m-2
s-1
moleNO-1
moleNO2-1
]
6E 0.46 [kJ mol-1
]
7k 91.06 10 [kmol m-2
s-1
moleNO2-1
]
7E 104.45 [kJ mol-1
]
8k 27.99 10 [kmol m-2
s-1
moleNO2-1
]
8E 0.00 [kJ mol-1
]
Experiments were done to validate the kinetic mechanism using the synthetic gas
bench and measurements on an International 6.4L engine using the EAS for emissions
control. The following sections discuss the experimental and simulation results from the
two sources.

89
3.5.2 Engine Validation
In this section the model is first compared to engine data taken with the EAS
attached to a 6.4 L International diesel engine. Emissions data were taken simultaneously
at the inlet and outlet of the SCR catalyst. At the inlet the AVL CEB II emissions bench
is used for oxygen measurements, along with the H-Sense for hydrogen measurement,
and an MKS FTIR measurement for all other species in the exhaust. For 1-D simulation
the catalyst temperature is assumed to be constant which is determined by two
thermocouples mounted in the front and back of the catalyst brick. The temperature of
each thermocouple differed by an average of 10°C. The average temperature is shown in
Figure 3.33 where the average SCR temperature increases to 420°C during the LNT
regeneration of the EAS and cools to 370°C during normal operation.
0
100
200
300
400
500
0 100 200 300 400 500 600 700
Average Catalyst Temperature
Tem
pe
ratu
re (
C)
Time (s)
LNT Regneration
Normal Operation
Figure 3.33 – The average SCR catalyst temperature varies from 370°C to 420°C during
regeneration cycling of the EAS.
The EAS did not produce large amounts of NH3 at the SCR inlet of the original
design target during engine operation with the calibration of engine and EAS used in
these experiments. Therefore, NOx conversion for the SCR is moderate. Figure 3.34
shows agreement in inflection points between simulation predictions and experimental

90
results. However, it was determined that the model commonly over predicted the
conversion NOx, but all reactions with H2, CO, and HC shown in Figure 3.35 are not
included in the kinetic mechanism listed in Table 3.1 but will be discussed later in
chapter 9.
The simulation error for each species was determined as the average absolute
difference between experimental results and simulation results for each species. The
average error for NO is 31.9 ppm, the average error for NO2 is 18.2, and the average error
for NH3 is 2.2 ppm.

91
(a)
0
50
100
150
200
250
300
0 100 200 300 400 500 600 700
NO Inlet
Experimental NO Outlet
Simulation NO Outlet
Co
nc
en
trati
on
(p
pm
)
Time (s) (b)
0
50
100
150
200
250
300
0 100 200 300 400 500 600 700
NO2 Inlet
Experimental NO2 Outlet
Simulation NO2 Outlet
Co
nce
ntr
ati
on
(p
pm
)
Time (s)
(c)
0
50
100
150
200
250
300
0 100 200 300 400 500 600 700
NH3 Inlet
Experimental NH3 Outlet
Simulation NH3 Outlet
Co
nc
en
trati
on
(p
pm
)
Time (s)
Figure 3.34 – Experimental and Simulation outlet species show acceptable agreement for
(a) NO, (b) NO2, and (c) NH3.
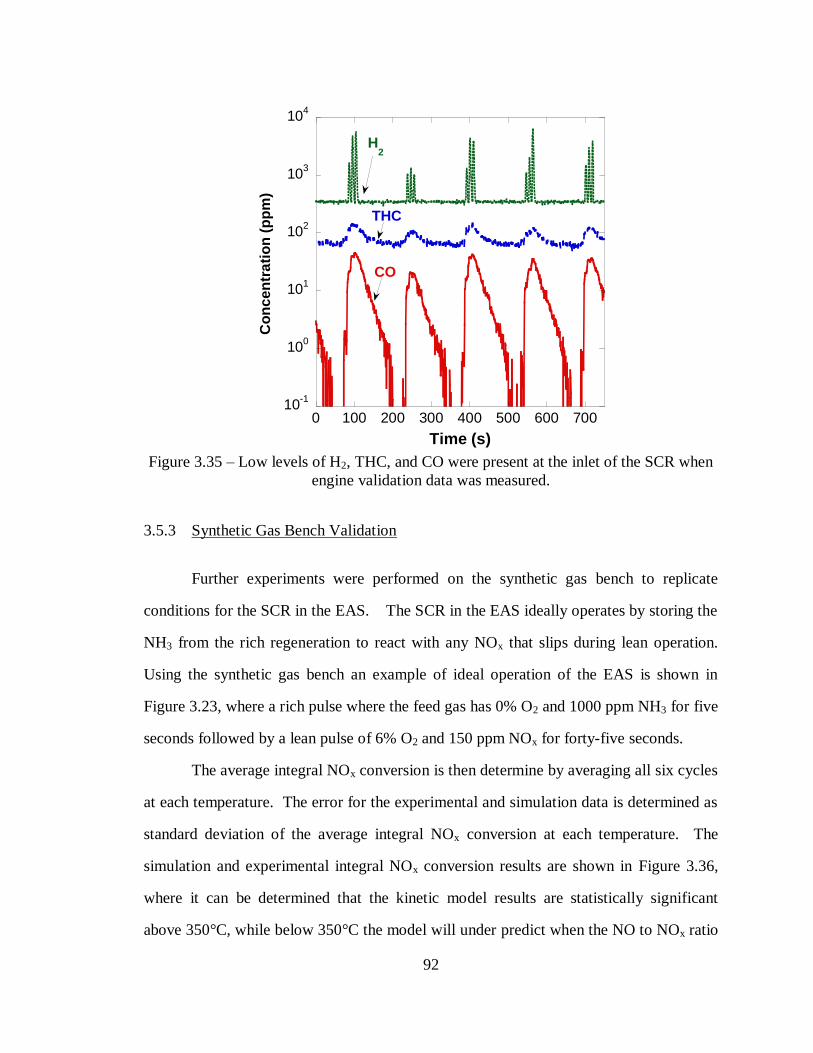
92
10-1
100
101
102
103
104
0 100 200 300 400 500 600 700
Co
nc
en
tra
tio
n (
pp
m)
Time (s)
H2
THC
CO
Figure 3.35 – Low levels of H2, THC, and CO were present at the inlet of the SCR when
engine validation data was measured.
3.5.3 Synthetic Gas Bench Validation
Further experiments were performed on the synthetic gas bench to replicate
conditions for the SCR in the EAS. The SCR in the EAS ideally operates by storing the
NH3 from the rich regeneration to react with any NOx that slips during lean operation.
Using the synthetic gas bench an example of ideal operation of the EAS is shown in
Figure 3.23, where a rich pulse where the feed gas has 0% O2 and 1000 ppm NH3 for five
seconds followed by a lean pulse of 6% O2 and 150 ppm NOx for forty-five seconds.
The average integral NOx conversion is then determine by averaging all six cycles
at each temperature. The error for the experimental and simulation data is determined as
standard deviation of the average integral NOx conversion at each temperature. The
simulation and experimental integral NOx conversion results are shown in Figure 3.36,
where it can be determined that the kinetic model results are statistically significant
above 350°C, while below 350°C the model will under predict when the NO to NOx ratio

93
equals 1.0, or over predict integral NOx conversion when the integral NOx conversion is
equal to 0.5.
(a)
0
20
40
60
80
100
200 250 300 350 400 450 500
Simulation
Experimental
NO
x C
on
ve
rsio
n (
%)
Temperature (C) (b)
0
20
40
60
80
100
200 250 300 350 400 450 500
Simulation
Experimental
NO
x C
on
vers
ion
(%
)
Temperature (C)
Figure 3.36 – Simulation data under predicts integral NOx conversion under 400°C when
compared to the Experimental data when (a) NO:NOx = 1.0; while simulation data over
predicts integral NOx conversion under 350°C when compared to the experimental data
for (b) NO:NOx = 0.5 .
In Figure 3.36 it has been observed that the simulation predictions for integral
NOx conversion predictions match inflection points with the experimental data, but do
not predict the right magnitude for the integral NOx conversion. Figure 3.37 shows a
comparison of simulation concentration values with experimental values for NO and
NO2. In all of the experiments there is a large amount of NOx reduction after the rich
pulse, then asymptotes to a minimum NOx conversion during the lean pulse for the
experimental data. However, since the NOx reduction reactions (Reactions (4) – (8) in
Table 3.1) are based linearly on the surface coverage fraction of NH3 in the kinetic
mechanism 3Z NH
, the simulation predicted NOx conversion will continue linearly
throughout the lean pulse of the cycle until the predicted NH3 on the catalyst is equal to
zero. Therefore it can be determined that NOx conversion is highly dependent on the
amount of NH3 on the surface of the catalyst.

94
(a)
0
50
100
150
200
250
300
280 320 360 400 440 480 520 560
NO Inlet
Simulation NO Outlet
Experimental NO Outlet
Co
nce
ntr
ati
on
(p
pm
)
Time (s) (b)
0
50
100
150
200
250
300
300 350 400 450 500 550
NO InletSimulation NO OutletExperimental NO Outlet
Co
nce
ntr
ati
on
(p
pm
)
Time (s)
(c)
0
50
100
150
200
250
300
600 640 680 720 760 800 840
NO Inlet
Simulation NO Outlet
Experimental NO Outlet
NO2 Inlet
Simulation NO2 Outlet
Experimental NO2 Outlet
Co
nce
ntr
ati
on
(p
pm
)
Time (s) (d)
0
50
100
150
200
250
300
600 640 680 720 760 800 840 880
NO Inlet
Simulation NO Outlet
Experimental NO Outlet
NO2 Inlet
Simulation NO2 Outlet
Experimental NO2 Outlet
Co
nce
ntr
ati
on
(p
pm
)
Time (s)
Figure 3.37 – The amount of stored NH3 on the catalyst plays are large role in NOx
reduction capabilities during lean rich cycling experiments for (a) NO:NOx = 1.0,
Temperature =200°C, (b) NO:NOx = 1.0, Temperature =400°C, (c) NO:NOx = 0.5,
Temperature =200°C, (d) NO:NOx = 1.0, Temperature =400°C
3.6 Conclusions
The following conclusions can be made based on experimental and simulation
results shown in this chapter.

95
3.6.1 NO Oxidation Conclusions
From the experimental data shown Figure 3.1 it can be concluded that the
oxidation of NO to NO2 is a reversible reaction with NO2 experiencing thermal
decomposition at temperatures above 300°C.
From experimental data in Figure 3.2 it can be determined that the oxidation of
NO to NO2 is dependent on O2 concentration by a half order effect as seen in Figure 3.3,
while from Figure 3.4 it can be determined that O2 concentration has negligible effects on
NO2 thermal decomposition to NO and O2.
Further experimental results shown in Figure 3.5 and Figure 3.6 show that a feed
gas that includes H2O and CO2 will inhibit the oxidation of NO to NO2 as well as the
thermal decomposition of NO2 to NO and O2. However, this effect is negligible in the
expected concentration range.
From the storage experiment shown in Figure 3.7 it can be determined that NO2
adsorption is small with any adsorbed NO2 thermally decomposing to NO making NO2
adsorption negligible for kinetic modeling of the NO oxidation reaction.
From the experimental results it has been proven that the NO oxidation reaction is
not inhibited by NO2 and H2O, and assuming NO and O2 storage is negligible the kinetic
rate in equation (3.14) is determined, which yields an accurate agreement between
experimental and modeling results as shown in Figure 3.8.
3.6.2 NH3 Storage Conclusions
It has been determined that a single site global approximation can be used to
model the storage of NH3 due to the presence of a single desorption peak in Figure 3.9.
When NH3 storage capacity for the simulation is compared to experimentally determined
values it can be seen that multiple catalytic sites are used to store NH3 due to non
linearity in shape of the experimental data as seen in Figure 3.10. In Figure 3.11 it can be

96
seen that a slight accuracy increase can be made when using a Tempkin isotherm kinetic
rate for the ammonia storage reaction.
3.6.3 NH3 Oxidation Conclusions
As shown from experimental data in Figure 3.12 only negligible amounts of NO
and N2O formed when oxidizing NH3 on the SCR catalyst. It is therefore only important
to model the stoichiometric reaction for ammonia oxidation to complete combustion
products as shown in equation (3.26). It has been determined experimentally that
increasing O2 concentration will increase ammonia conversion during ammonia
oxidation, although it is not a linear effect between 0.5% and 6% O2 concentration in the
feed gas as seen in Figure 3.14. Lastly, it was found that to account for ammonia
oxidation in a kinetic model where O2 concentration can drastically vary, such as in the
EAS, that a saturation kinetic reaction rate needs to be used to increase the accuracy of
the model.
3.6.4 NOx Reduction with NH3 Conclusions
It can be concluded that the NO to NOx ratio is an important determining
characteristic of the feed gas when predicting NOx conversion with NH3 with max
conversion of NOx occurring when the feed gas contains equal amounts of NO and NO2
as seen in Figure 3.18. It can also be determined from Figure 3.18 that NOx reduction
with NH3 occurs due to three simultaneous global reactions shown in equations (3.37),
(3.38), and (3.39). The stoichiometric ratios for the three reactions in equations (3.37),
(3.38), and (3.39) are confirmed by varying the NH3 to NOx ratio to maximize NOx and
NH3 conversion for the purposed NO to NOx ratios as seen in Figure 3.19. Experimental
results with varying oxygen concentration as shown in Figure 3.20 have shown that only
NO reduction with NH3 is dependent on oxygen concentration. Due the ability for NOx

97
conversion with NH3 during cycling experiments shown in Figure 3.23; where NH3 is
present in the rich pulse while NOx is present in the lean pulse, the simultaneous NOx
conversion with NH3 reactions shown in equations (3.37), (3.38), (3.39), (3.68), and
(3.67) can be rewritten as reaction that take place with NH3 stored on the surface of the
catalyst as shown in equations (3.74), (3.75), (3.76), (3.77), and (3.78) respectively.
It has been determined that the reduction of NO with NH3 when oxygen is not
present is small but can be accounted for using standard kinetic rate expressions as seen
in (3.77). It can be seen that when oxygen is present NO conversion with NH3 is strongly
dependent on temperature as seen in Figure 3.21. A method to determine the oxygen
dependence for this reaction was used which yielded results that show that the oxygen
dependence is also a function of temperature as seen in Figure 3.22. It is proposed that
this is due to the effect of simultaneous nature of the NO Oxidation, NH3 Oxidation, Fast
SCR, and Slow SCR reactions on the catalyst.
From the Fast SCR reaction as shown in equation (3.75) it was determined that
the Fast SCR reaction can be modeled as a global reaction with a standard Arrhenius
kinetic rate for the 200°C – 450°C temperature range as seen in Figure 3.31.
The Slow SCR reaction as shown in equation (3.76) was determined to have the
largest hysteresis effect at low temperatures; primarily due to the formation of
ammonium nitrate at low temperatures on the catalyst surface. The global Slow SCR
reaction with a standard Arrhenius rate simulation was shown to be within error and is
therefore considered adequate when predicting NH3 and NOx conversion for the entire
temperature range tested as shown in Figure 3.32.
3.6.5 Model Validation Conclusions
It was observed in Figure 3.34 that simulation predictions align within 15% of
experimental engine data. However, it should be noted that during validation testing of
98
the EAS and engine, the NH3 levels at the SCR inlet were low which correlates to low
activity of the SCR catalyst. Therefore further validation experiments were required.
The synthetic gas bench was then used for further validation of the kinetic
mechanism. Cycling experiments were designed as shown in Figure 3.23, where 1000
ppm of NH3 was stored on the catalyst during a five second rich pulse to reduce NOx
present in the forty-five second lean pulse. Simulation predictions were compared to
varying the NO to NOx ratios in the lean pulse, where it was observed that the kinetic
model under predicts integral NOx conversion when the NO to NOx ratio favors NO, and
over predicts integral NOx conversion when the NO to NOx ratio favors an equal mixture
as seen in Figure 3.36. It is determined that the NOx conversion is a strong function of
stored NH3 on the catalyst, which is determined to be the weak point in the current
kinetic model.

99
CHAPTER 4
N2O PRODUCTION AND REACTIONS
With increasing emphasis on greenhouse gases, nitrous oxide (N2O) emissions
from automobiles are coming under increasing scrutiny [139-142]. N2O is an absorber of
infrared radiation and contributes around 8% to the “greenhouse effect” in the
troposphere [143]. N2O is a stable molecule with a lifetime of 170 years, and can diffuse
into the stratosphere causing ozone layer depletion [144-146]. This chapter will discuss
the potential for production of N2O on the SCR catalyst used in the EAS, as well a
suggested modeling approach to account for the reduction of N2O with NH3.
4.1 Background
Previous research regarding N2O over zeolite-based catalysts has shown that it
can be formed when either NO or NO2 is in the inlet mixture [87, 92, 116, 117, 119, 147-
149]. Research has shown that Cu-containing zeolites clearly formed larger amounts of
N2O than Fe-containing zeolites [92]. Ciardelli et al. [135] has suggested from work on
vanadium and iron based zeolite catalyst that NH3 and NO2 will form ammonium nitrate
as the precursor to all reactions with NH3 and NO2 as seen in equation (4.1). Ciardelli
then suggests ammonium nitrate can be reduced with NO as seen in equation (4.2), or
form N2O due to thermal breakdown as seen in equation (4.3).

100
3 2 4 3 2 22NH 2NO NH NO N H O (4.1)
4 3 2 2 2NH NO NO NO 2H ON (4.2)
4 3 2 2NH NO N O 2H O (4.3)
This is corroborated in experimental tests over a H-ZSM-5 catalyst [87, 149] and
a copper-zeolite catalyst [116] where the selectivity to N2O is highest in the case of 100%
NO2.
Kim et al. [47] has summarized three possible reaction pathways for N2O
production shown in equations (4.4) – (4.6) where N2O can be formed as a product of
NH3 and O2, NO, or NO2 respectively. Kim et al. suggests any N2O production reaction
can be neglected based on experimental data.
3 2 2 24NH 4O 2N O 6H O (4.4)
3 2 2 2 24NH 4 O 3O 4N O 6H ON (4.5)
3 2 2 2 24NH 2 O N N O 3H ON (4.6)
Epling et al. [57] found that N2O formation only occurs when NO2 concentration
is higher than NO concentration in the feed gas in experiments performed on a iron based
zeolite SCR catalyst. Epling et al. performed spatial analysis experiments for the
reduction of NO2 with NH3. When the maximum catalyst length was used in the spatial
study large amounts of NO2 and NH3 were converted to N2 and H2O. However, the
spatial analysis yielded large quantities of N2O formation as less catalyst length is used.
From these results Epling suggested a two reaction mechanism for NO2 reduction with
NH3, where NO2 and NH3 first react to form N2O as seen in equation (4.6), and then N2O
will be converted by NH3 as seen in equation (4.7). N2O reduction with NH3 is consistent

101
with results by Mauvezin et al. [150] on an Fe-exchanged zeolite SCR catalyst. It should
be noted that the combination of the reactions shown in equations (4.6) and (4.7) yield
the global Slow SCR reaction for NO2 reduction with NH3 as seen in equation (4.8).
3 2 2 22NH 3N O 4N 3H O (4.7)
3 2 2 28NH 6NO 7N 12H O (4.8)
4.2 Experimental Results
Experimental data for the N2O production and reduction reactions when using a
bench-top style reactor are collected using temperature ramp experiments which consist
of constant inlet concentrations and varying temperature in a constant upward or
downward ramp rate up to 5°C/min. The data presented by Epling et al. suggests space
velocity is important when determining the reduction pathways of NO2 and N2O with
NH3 all experiments were run at a low space velocity so diffusion effects are minimized
to determine the proper reduction pathway.
4.2.1 N2O Production
Kim et al. [47] has suggested secondary pathways where N2O production can
exist during the reaction of NH3 and NO or NO2 on a copper based zeolite SCR catalyst.
Since it was already experimentally determined in the last chapter that NH3 and O2 do not
form N2O on this catalyst, the reaction in equation (4.4) can be neglected. The N2O
generation reactions are shown in equations (4.5) and (4.6).
3 2 2 24NH 4NO 3O 4N O 6H O (4.5)
3 2 2 2 22NH 2NO N N O 3H O (4.6)

102
Figure 4.1 shows the concentrations of NO, NO2, N2O, NH3 on a temperature
basis for five different experiments performed with different NO to NOx ratios. By
examining the levels of N2O in these experiments it can be seen that N2O formation is
negligible when the NO to NOx ratio is between 1.0 and 0.5; however when the NO to
NOx ratio is between 0.5 and 0.0, N2O concentrations are considerable. When examining
the NOx N2O pathways it can be seen that the reaction with NH3 and NO to form N2O
shown in equation (4.5) can be neglected, while the reaction with NO2 and NH3 shown in
equation (4.6) remains as the only N2O pathway.
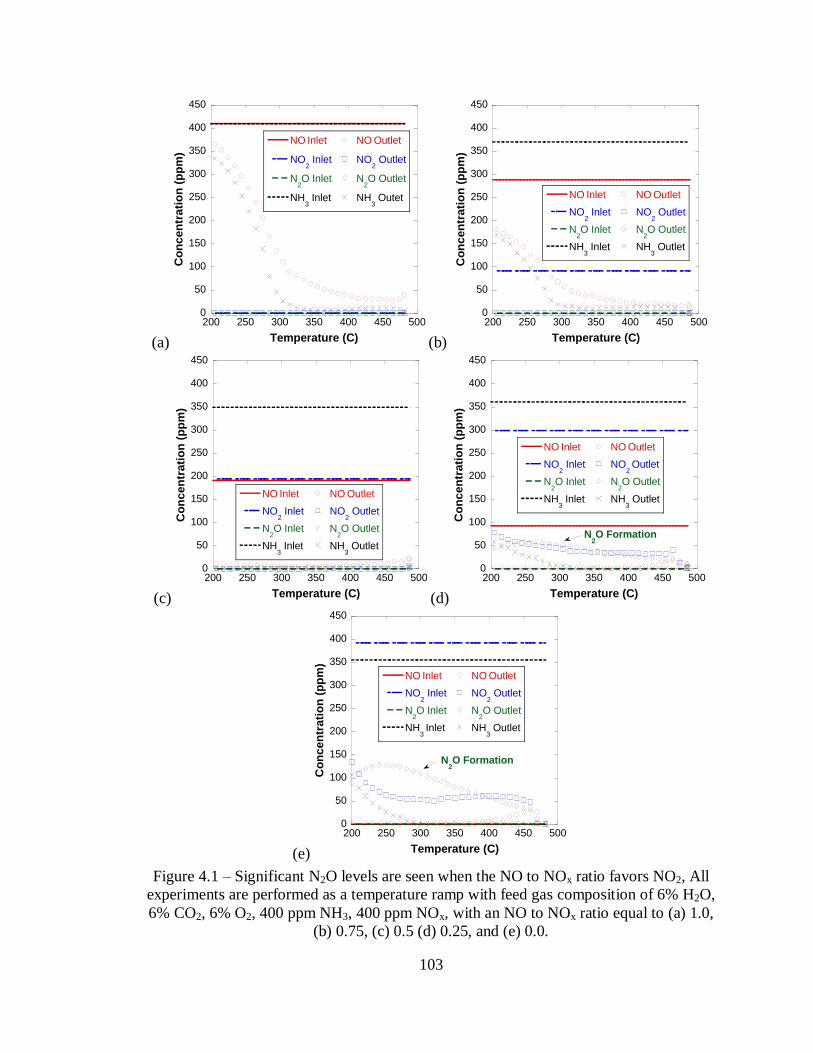
103
(a)
0
50
100
150
200
250
300
350
400
450
200 250 300 350 400 450 500
NO Inlet
NO2 Inlet
N2O Inlet
NH3 Inlet
NO Outlet
NO2 Outlet
N2O Outlet
NH3 Outet
Co
nc
en
trati
on
(p
pm
)
Temperature (C) (b)
0
50
100
150
200
250
300
350
400
450
200 250 300 350 400 450 500
NO Inlet
NO2 Inlet
N2O Inlet
NH3 Inlet
NO Outlet
NO2 Outlet
N2O Outlet
NH3 Outlet
Co
nc
en
trati
on
(p
pm
)
Temperature (C)
(c)
0
50
100
150
200
250
300
350
400
450
200 250 300 350 400 450 500
NO Inlet
NO2 Inlet
N2O Inlet
NH3 Inlet
NO Outlet
NO2 Outlet
N2O Outlet
NH3 Outlet
Co
nc
en
trati
on
(p
pm
)
Temperature (C) (d)
0
50
100
150
200
250
300
350
400
450
200 250 300 350 400 450 500
NO Inlet
NO2 Inlet
N2O Inlet
NH3 Inlet
NO Outlet
NO2 Outlet
N2O Outlet
NH3 Outlet
Co
nc
en
trati
on
(p
pm
)
Temperature (C)
N2O Formation
(e)
0
50
100
150
200
250
300
350
400
450
200 250 300 350 400 450 500
NO Inlet
NO2 Inlet
N2O Inlet
NH3 Inlet
NO Outlet
NO2 Outlet
N2O Outlet
NH3 Outlet
Co
nc
en
trati
on
(p
pm
)
Temperature (C)
N2O Formation
Figure 4.1 – Significant N2O levels are seen when the NO to NOx ratio favors NO2, All
experiments are performed as a temperature ramp with feed gas composition of 6% H2O,
6% CO2, 6% O2, 400 ppm NH3, 400 ppm NOx, with an NO to NOx ratio equal to (a) 1.0,
(b) 0.75, (c) 0.5 (d) 0.25, and (e) 0.0.

104
4.2.2 Effect of NH3 to NO2 Ratio on N2O Production
Since it has been determined that N2O production is due to NH3 reaction with
NO2, the conversion of NO2 to N2O is defined in equation (4.9) based on the
stoichiometric values from equation (4.6) where two NO2 molecules will combine with
two NH3 molecules to form one N2O molecule.
2
2 2
2
_
_ _
_
2100
N O out
NO to N O
NO in
y
y
(4.9)
A series of experiments is then performed test the N2O production for different
NH3 to NO2 ratios in the feed gas. From the N2O production reaction with NH3 and NO2
listed in equation (4.6) it can be seen that the stoichiometric ratio of NH3 to NO2 for N2O
production is 1.0 due to the highest value of NO2 conversion to N2O over the entire
temperature range.
0
20
40
60
80
100
200 250 300 350 400 450 500
NH3:NO
2 = 0.3
NH3:NO
2 = 1.0
NH3:NO
2 = 1.3
NH3:NO
2 = 2.0
NO
2 C
on
vers
ion
to
N2O
(%
)
Temperature (C)
Stoichiometric NH3:NO
2
for N2O Production
Figure 4.2 − N2O production is the highest when there is an equal amount of NH3 and
NO2 in the feed gas. The experiments were performed as a temperature ramp with 6%
H2O, 6% CO2, 0% O2, 400 ppm NOx, and varying NH3 concentration in the feed gas.

105
4.2.3 N2O Reaction with NH3
Due to significant formation of N2O when reducing NO2 with NH3, temperature
ramp experiments were performed with N2O and NH3 in the feed gas. In Figure 4.2 it
was observed that NO2 conversion to N2O reaches a maximum of 80% when varying
temperature and the NH3 to NO2 ratio. According to the reaction scheme proposed by
Epling et al. [57], the reaction of N2O with NH3 is expected in the entire temperature
range. Figure 4.3 shows a temperature ramp experiment measuring the N2O conversion
due to a reaction with NH3. From these experiments it was found that N2O conversion
with NH3 is negligible below 350°C but steadily increases at temperatures above 350°C.
0
20
40
60
80
100
200 250 300 350 400 450 500
600 ppm NH3, 900 ppm N
2O
1000 ppm NH3, 1000 ppm N
2O
N2O
Co
nve
rsio
n (
%)
Temperature (C)
Figure 4.3 − N2O conversion with NH3 is negligible below 350°C. The experiment was
performed as a temperature ramp with 6% H2O, 6% CO2 and listed NH3 and N2O
concentrations in the feed gas.
4.2.4 N2O Conversion in Fast SCR Reaction
Due to the high rate of conversion of NO2 and NH3 to N2O, it is important to test
if this occurs simultaneously with the Fast SCR reaction. By combing the Fast SCR

106
reaction in equation (4.10) with the N2O production reaction from NH3 and NO2 shown
in equation (4.6); the reduction of NO and N2O by NH3 reaction can be defined in
equation (4.11). If experimental data proves this is indeed the precursor to these steps the
reduction of NO and N2O by NH3 reaction (4.11) can be substituted for the Fast SCR
reaction (4.10).
3 2 2 22NH NO+NO 2N 3H O (4.10)
3 2 2 2 22NH 2NO N N O 3H O (4.6)
3 2 2 22NH 2NO N O 3N 3H O (4.11)
To measure total conversion of NO, NO2, and N2O with NH3 during these
experiments, NOy conversion is defined according to equation (4.12).
2 2 2 2
2 2
_ _ _ _ _ _
_ _ _
100y
NO in NO in N O in NO out NO out N O out
NO
NO in NO in N O in
y y y y y y
y y y
(4.12)
An experiment is designed by combining NO, N2O, and NH3 in feed gas for a
temperature ramp. If N2O is a precursor in the Fast SCR experiment NOy conversion
would approach 95% conversion. From Figure 4.4 it can be seen that the conversion of
NO and N2O by NH3 follows the same trend as the N2O reduction with NH3 as shown in
Figure 4.4, where conversion is minimal below 350°C, but steadily increases as the
temperature increases above 350°C. Therefore, the Fast SCR reaction shown in equation
(4.10) cannot be substituted for the NO and N2O reduction with NH3 reaction shown in
equation (4.11).

107
0
20
40
60
80
100
200 250 300 350 400 450 500
600 ppm NH3, 900 ppm N
2O
1000 ppm NH3, 1000 ppm N
2O
1000 ppm NH3, 1000 ppm NO, 500 ppm N
2O
NO
y C
on
vers
ion
(%
)
Temperature (C)
Figure 4.4 − The addition of NO in the feed gas of NH3 and N2O does not increase the
conversion of NOy. The experiments were performed as a temperature ramp with 6%
H2O, 6% CO2, and listed values of NH3, NO, and N2O.
4.3 N2O Production Effect on NO2 Reduction with NH3
From Figure 4.1 it was determined that N2O production is significant when the
NO to NOx favors NO2 with N2O production being the highest when only NO2 and NH3
are in the feed gas. Therefore it can be determined that NOx reduction with NH3 is a
combination of at least the four reactions shown in equations (4.13), (4.14), (4.15), and
(4.16).
3 2 2 24NH 4NO O 4N 6H O (4.13)
3 2 2 22NH NO NO 2N 3H O (4.14)

108
3 2 2 26NH 8NO 7N 12H O (4.15)
3 2 2 2 22NH 2NO N N O 3H O (4.16)
Epling et al. [57] has suggested that since N2O production only occurs as a
reaction with NH3 and NO2, equation (4.15) can be replaced with equation (4.17) if the
N2O production reaction is included as seen in equation (4.16).
3 2 2 22NH 3N O 4N 3H O (4.17)
To test this theory by Epling et al. the NOx conversion, the NO2 conversion to
N2O, N2O conversion with NH3, and the NO2 conversion due to thermal decomposition
are plotted based on temperature as seen in Figure 4.5. It should be noted that the N2O
conversion with NH3 and the NO2 conversion due to thermal decomposition are from
separate experiments shown earlier in Figure 4.3 and Figure 3.6 respectively. In Figure
4.5 it can be seen that most of the NOx conversion from the reaction of NO2 and NH3 is
initially due to NO2 conversion to N2O. However, as the temperature increases NO2
conversion to N2O decreases due to possible reactions with N2O and NH3 or by the
enacting the Fast SCR reaction by thermally decomposition of NO2 to NO.

109
0
20
40
60
80
100
200 250 300 350 400 450 500
NOx Conversion
NO2 Conversion to N
2O
N2O Conversion with NH
3
(seperate experiment)
NO2 Thermal Decomposition to NO
(seperate experiment)
Co
nv
ers
ion
(%
)
Temperature (C) Figure 4.5 – Summary of NOx conversion pathways for reactions with NO2 and NH3.
The experiment was performed as a temperature ramp with 6% H2O, 6% CO2, 1000 ppm
NH3, and 750 ppm NO2, in the feed gas.
From the conversions results shown in Figure 4.5, the conversion of NO2 to N2O
2 2_ _NO to N O and the N2O conversion with NH3
2N O are combined to see if their values
equal the NOx conversion values for the stoichiometric experiment. This is done to test
the proposed reaction scheme by Epling et al. [57] as shown in equation (4.18).
3 2 2 2 2
3 2 2 2
3 2 2 2
2NH 2NO N N O 3H O
+ 2NH 3N O 4N 3H O
8NH 6NO 7N 12H O
2 2
2
_ _
+
x
NO to N O
N O
NO
(4.18)
When comparing the method shown in equation (4.18) it can be seen in Figure 4.6
that a significant amount of NOx conversion is unaccounted for, therefore it is important
to test Epling et al. approximation by including the Fast SCR reaction from equation
(4.10). The Fast SCR reaction is added by adding the NO2 conversion due to thermal
decomposition is assuming NO formed due to thermal decomposition 2NO enacts the
Fast SCR reaction which is the dominant reaction for NOx reduction with NH3. Since
oxygen is not present in these experiments, the Standard SCR reaction as seen in equation

110
(4.13) is ignored. The combination of the Fast SCR reaction and N2O pathways for NOx
reduction is shown mathematically in equation (4.19) with maximum predicted NOx
conversion based on these reactions is set to 100% conversion.
3 2 2 2 2
3 2 2 2
2 2
3 2 2 2
2NH 2NO N N O 3H O
+ 2NH 3N O 4N 3H O
1+ NO NO+ O
2
+ 2NH NO+NO 2N 3H O
xNO
2 2
2
2
_ _
min 100
+
x
NO to N O
N O
NO
NO
or
(4.19)
A comparison of NOx conversion from the experiment versus predicted values
using the reaction pathways suggested by Epling et al. [57] are shown in Figure 4.6.
From these results it can be seen that neither combination will account for the entire
conversion of NOx from the experimental data. It can therefore be concluded that the
global Slow SCR reaction cannot be neglected in the reaction mechanism, but the
additional pathway for N2O conversion with NH3 proposed by Epling et al. needs to be
included.

111
0
20
40
60
80
100
200 250 300 350 400 450 500
NOx Conversion
NO2 Conversion to N
2O
+ N2O Conversion with NH
3
NO2 Conversion to N
2O
+ N2O Conversion with NH
3
+ Fast SCR
Co
nv
ers
ion
(%
)
Temperature (C)
Figure 4.6 − The Slow SCR reaction cannot be neglected due the combination of other
reactions not equaling the conversion of NOx for NO2 reduction with NH3. The
experiment was performed as a temperature ramp with 6% H2O, 6% CO2, 1000 ppm
NH3, and 750 ppm NO2, in the feed gas.
4.4 Suggested Modeling Approach
In the detailed reactions shown in equations (4.1) – (4.3) there is no reaction
pathway for the reduction of N2O with NH3. Due to the inability to test N2O reactions
with ammonium nitrate, a global mechanism is proposed to account for the results shown
in Figure 4.6. From the last chapter it was determined that all the NOx reduction with
NH3 reactions take place with NH3 stored on the surface of the catalyst. Therefore, the
proposed modeling global reactions for NOx reduction with NH3 are shown in equations
(4.20) – (4.25).
3 2 24Z NH 6NO 4 5N 12H OZ (4.20)
3 2 2 24Z NH 4NO O 4 4N 6H OZ (4.21)

112
3 2 2 22Z NH NO NO 2 2N 3H OZ (4.22)
3 2 2 26Z NH 8NO 6 7N 12H OZ (4.23)
3 2 2 2 22Z NH 2NO 2 N N O 3H OZ (4.24)
3 2 2 22Z NH 3N O 2 4N 3H OZ (4.25)
While the kinetics for each reaction can be modeled as an Arrhenius rate as shown
in equation (4.26). The pre-exponential k and the activation energy E from the Rich
Standard SCR reaction (equation (4.20)) and the N2O reduction with NH3 reaction
(equation (4.25)) can be determined based on separately based on their respective
individual experiments. The pre-exponential and activation energy will need to be
determined simultaneously for the remaining reactions from multiple experiments.
3
Inlet Species
exp
E
RT
iZ NHi
R k y
(4.26)
4.5 Conclusions
It has been determined that significant amounts of N2O are produced
simultaneously during the reduction of NOx with NH3 when the NO to NOx ratio favors
NO2 as seen in Figure 4.1. It has been determined that up to 80% of NO2 can be
converted to N2O when reacting with NH3 as seen in Figure 4.2. From Figure 4.3 it was
determined that NH3 can be used to in the reduction of N2O, but the reaction does not
start until the catalyst temperature is above 350°C. It was determined that N2O is not the
critical pathway for NO2 for the Fast SCR reaction because NO does not increase the
conversion of N2O with NH3 below 350°C as seen in Figure 4.4. Lastly, it was
determined that combining the NO2 conversion to NO, N2O conversion with NH3, and

113
the NO2 conversion due to thermal decomposition, a NOx conversion estimate can be
formed for the simultaneous NOx reduction reactions. From these results it was seen that
the Slow SCR reaction (equation (4.23)) cannot be neglected, as well as the N2O
production reaction from NO2 and NH3 (equation (4.24)) and the reduction of N2O with
NH3 reaction (equation (4.25)) need to be included in the kinetic mechanism.
114
CHAPTER 5
EFFECT OF NH3 STORAGE ON NOX REDUCTION
One major weak point of the current kinetic mechanism is NOx conversion
predictions as NH3 concentration varies. This is due to instantaneous reactions between
NO, NO2, and NH3 during steady state operation. This chapter provides experimental
studies of NOx conversion dependence on NH3 concentration on the catalyst as well as a
proposal for modifications to the current kinetic rate form equations.
5.1 Model Validation Results
The current proposed global reactions and their corresponding kinetic rate forms
are shown in Table 5.1. From Table 5.1 it can be seen that every reaction that includes
NH3 in its reactants includes surface coverage fraction of NH3 3Z NH
. The surface
coverage fraction of NH3 is a non-dimensional number from 0 to 1 that represents the
amount of NH3 stored on the catalyst compared to maximum amount of NH3 able to store
on the catalyst. When reviewing the kinetic rate equations for all reactions with NH3 in
the reactants in Table 5.1, it can be seen that each kinetic rate form is based on a linear
dependence on the surface coverage fraction of NH3.

115
Table 5.1 − Summary of chemical reaction and kinetic rates for lean SCR model from
literature and experimental sources.
Chemical Reaction Kinetics Rate Form
(R1) 2 2
1
2NO O NO
1
2
21 1 exp
E
NORT
NO O
eq
yR k y y
K
(R2) 3 3Z NH Z NH
22 3
3 32 2 2 exp
rr Z NH
E
RT
f NH Z r Z NHR k y k
(R3) 3 2 2 24 3 4 2 6Z NH O Z N H O
3
3
2 33 3 exp
E
RT
O Z NHR k y
(R4) 3 2 24 6 4 5 6Z NH NO Z N H O
4
34 4 exp
E
RT
NO Z NHR k y
(R5) 3 2 2 24 4 4 4 6Z NH NO O Z N H O
5
2 35 5 exp
E
RT
NO O Z NHR k y y
(R6) 3 2 2 22 2 2 3Z NH NO NO Z N H O
6
2 36 6 exp
E
RT
NO NO Z NHR k y y
(R7) 3 2 2 28 6 8 7 12Z NH NO Z N H O
7
2 37 7 exp
E
RT
NO Z NHR k y
(R8) 3 2 2 2 22 2 2 3Z NH NO Z N N O H O
8
2 38 8 exp
E
RT
NO Z NHR k y
(R9) 3 2 2 22 3 2 4 3Z NH N O Z N H O
9
2 39 9 exp
E
RT
N O Z NHR k y
From Table 5.1 the reactions listed in (R1) – (R8) were compared to lean/rich or
lean-rich cycling experiments to validate the kinetic mechanism as shown in Figure 5.1.
From these results it was shown that the SCR kinetic mechanism will under predict
integral NOx conversion below 400°C, while at or above 400°C the model prediction is
statistically significant for the experimental results for an NO to NOx ratio equal to 1.0 in
the lean pulse. The kinetic mechanism will over predict integral NOx conversion for the
entire temperature range, however at or above 350°C the simulation predictions are
statistically significant when compared to the experimental results for an NO to NOx ratio
equal to 0.5 in the lean pulse.
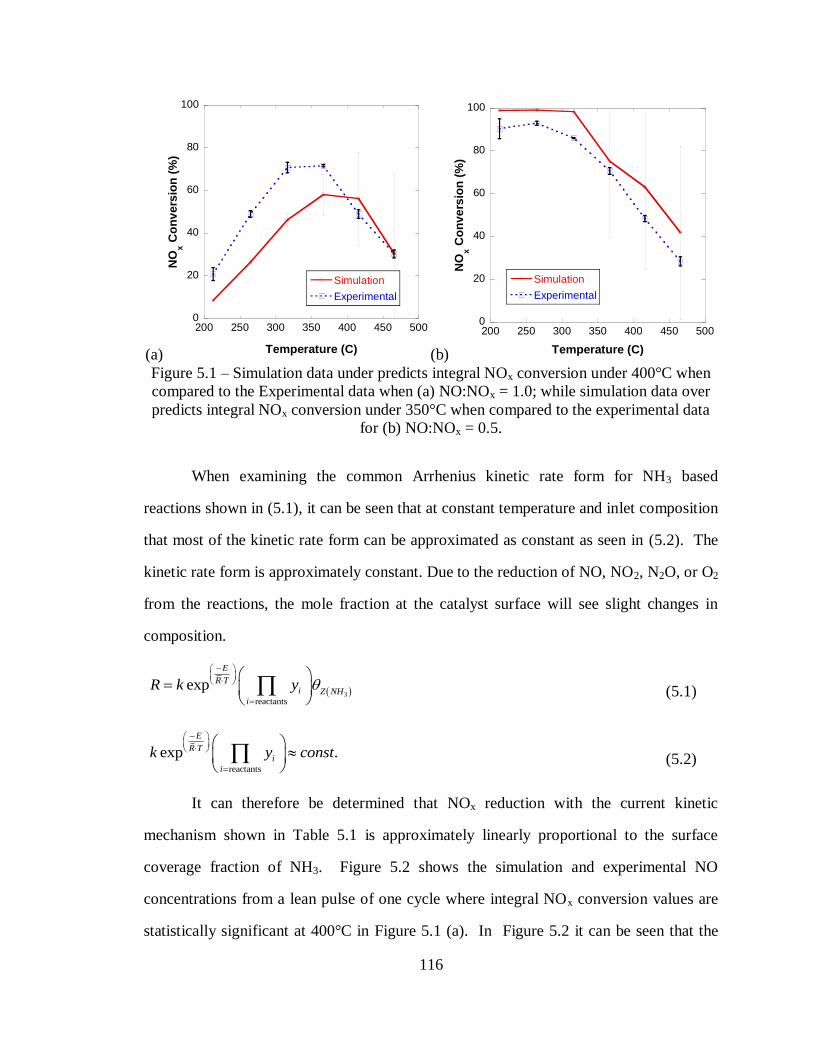
116
(a)
0
20
40
60
80
100
200 250 300 350 400 450 500
Simulation
Experimental
NO
x C
on
ve
rsio
n (
%)
Temperature (C) (b)
0
20
40
60
80
100
200 250 300 350 400 450 500
Simulation
Experimental
NO
x C
on
vers
ion
(%
)
Temperature (C)
Figure 5.1 – Simulation data under predicts integral NOx conversion under 400°C when
compared to the Experimental data when (a) NO:NOx = 1.0; while simulation data over
predicts integral NOx conversion under 350°C when compared to the experimental data
for (b) NO:NOx = 0.5.
When examining the common Arrhenius kinetic rate form for NH3 based
reactions shown in (5.1), it can be seen that at constant temperature and inlet composition
that most of the kinetic rate form can be approximated as constant as seen in (5.2). The
kinetic rate form is approximately constant. Due to the reduction of NO, NO2, N2O, or O2
from the reactions, the mole fraction at the catalyst surface will see slight changes in
composition.
3
reactants
exp
E
R T
i Z NHi
R k y
(5.1)
reactants
exp .
E
R T
i
i
k y const
(5.2)
It can therefore be determined that NOx reduction with the current kinetic
mechanism shown in Table 5.1 is approximately linearly proportional to the surface
coverage fraction of NH3. Figure 5.2 shows the simulation and experimental NO
concentrations from a lean pulse of one cycle where integral NOx conversion values are
statistically significant at 400°C in Figure 5.1 (a). In Figure 5.2 it can be seen that the

117
simulation using the kinetic mechanism predicts NO concentrations corresponding to
linear reduction of NH3 stored on the catalyst, while the experimental results shows
definitively that NO concentration is not linearly reduced during the lean pulse. Upon
further investigations a similar effect could be derived due to pressure pulsations
however, since exhaust pressure is held constant on an engine by a variable geometry
turbocharger aftertreatment catalysts pressure is assumed constant. Therefore, pressure
was held constant for the rich and lean pulse in the reactor bench experiments. It can
therefore be concluded that NOx conversion is a strong function of the amount of NH3 on
the catalyst. For these experimental results the FTIR readings were offset based
experimental data taken that bypassed the catalyst. It is possible that the time constant of
the FTIR readings will filter the experimental data in these experiments, however since
data is recorded at 1 Hz this will not affect the trend seen where approximately 15
seconds pass before NO breakthrough occurs in Figure 5.2.
0
50
100
150
200
340 350 360 370 380 390 400
NO InletSimulation NO OutletExperimental NO Outlet
Co
nce
ntr
ati
on
(p
pm
)
Time (s)
Approx. Linear
Dependence
on NH3
in Simulation
Non-Linear
Dependence
on NH3
in Experimental
Figure 5.2 – The amount of stored NH3 on the catalyst plays are large role in NOx
reduction capabilities during lean rich cycling experiments for NO:NOx = 1.0,
Temperature =400°C.

118
5.2 Experimental Results
Experiments from this section are performed to study the effect of stored NH3 on
NOx conversion capabilities for the iron based zeolite SCR catalyst in the EAS. As stated
earlier, under steady state conditions NH3 levels react instantly with NOx on the catalyst
to form complete products (N2 and H2O). In an LNT-SCR aftertreatment system, NOx is
stored on the LNT during lean exhaust operation. NH3 is produced as a byproduct of
NOx reduction with H2 during a rich regeneration of the LNT catalyst. The SCR in the
EAS operates by storing the NH3 from the rich regeneration to react with any NOx that
slips during lean operation. An example of a catalyst bench experiment replicating these
conditions is shown in Figure 5.3.
200
400
600
800
1000
1200
0 10 20 30 40 50
NH3 Inlet
NH3 Outlet
NO Inlet
NO Outlet
NO2 Inlet
NO2 Outlet
Co
nce
ntr
ati
on
(p
pm
)
Time (s)
Rich Pulse
0% O2
Lean Pulse
6% O2
Figure 5.3 − NH3 stores on catalyst during rich pulse, NOx reacts with stored NH3 on lean
pulse. The experiment was performed as a lean rich cycling bench experiment for 50 sec
cycle length at constant temperature of 250°C and a feed gas with 8% H2O, and 8% CO2.

119
Since NH3 will store during the rich phase of the cycle, but NOx conversion will
only happen during the lean phase, it is important to study the effect of NH3 storage on
NOx conversion across the SCR catalyst. An experiment is designed where temperature,
CO2 concentration, and H2O concentration are held constant, for a much longer cycle
than shown in Figure 5.3. The long cycle switching experiment is designed in two steps,
with the first step designed to saturate the catalyst with NH3 in the rich phase by dosing
the catalyst with 1000 ppm NH3, 0% O2, 6% H2O, and 6% CO2 for 2 minutes. The
second step will react NO, NO2, and O2 with NH3 stored on the catalyst during an 8
minute dose of 400 ppm NOx, 6% O2, 6% H2O, and 6% CO2. This process was repeated
for 10 cycles at seven temperatures (175°C, 225°C, 275°C, 325°C, 375°C, 425°C, 475°C)
and three NO to NOx ratios (0.0, 0.5, 1.0). An example of the long switching experiment
at constant temperature of 275°C with the NO to NOx ratio equal to 1.0 is shown in
Figure 5.4

120
200
400
600
800
1000
1200
0 2 4 6 8 10
NH3 Inlet
NH3 Outlet
NO Inlet
NO Outlet
NO2 Inlet
NO2 Outlet
Co
nce
ntr
ati
on
(p
pm
)
Time (min)
Rich
Pulse
0% O2
Lean Pulse
6% O2
NOx Conversion
NH3 Storage
Figure 5.4 − Example of a long switching experiment where the catalyst will saturate
with NH3 during a 2 minute rich pulse, then measure the conversion of NOx from the feed
gas during the 8 minute lean pulse.
5.3 Analysis and Results of Long Cycling Experiments
From the long switching experiments the NOx conversion as a function of the
surface coverage fraction of NH3 can be determined. The surface coverage fraction of
NH3 3Z NH
is defined as the fraction of the amount of stored NH3 on the catalyst
surface over the total amount of NH3 that can be stored on the catalyst surface. The total
amount of stored NH3 that can be stored on the catalyst was determined from the TPD
experiments with NH3 shown in Chapter 3. The surface coverage fraction of NH3 from
the long switching experiments can be calculated based on experimental measurements as
shown in equation (5.3). Where the amount of NH3 on the catalyst 3 ,NH caty in equation
(5.3), is based on the stoichiometric NH3 values of the NH3 Storage reaction (R1), the

121
Standard SCR reaction (R5) the Fast SCR reaction (R6), the Slow SCR reaction (R7), and
the N2O Production reaction as seen in (5.4). It should be noted that since the reactor
bench using N2 as the carrier gas, NH3 loss to oxidation cannot be measured. However,
NH3 oxidation effects can be ignored in the calculation of the surface coverage fraction of
NH3 because it is much smaller then NOx conversion effects with NH3 in the investigated
temperature range.
33
3
,
, ,max
1NH catNH
NH stored Cat Cycle
PVy dt
Q V RT
(5.3)
3 3 3 2 2 2
23
2 2
, , , , , , , ,
Standard and Fast SCR N O ProductionNH Storage
Fast SCRC
, , , ,
2
1 max
3
NH cat NH in NH out NO in NO out NO in NO out N O out
NO in NO out NO in NO out
y y y y y y y y
y y y y
2
2
N O ProductionCorrectionorrection
,
Slow SCR
2 ,0N O outy
(5.4)
2 2
2
, , , ,
, ,
100x
NO in NO in NO out NO out
NO
NO in NO in
y y y y
y y
(5.5)
For each experiment the surface coverage fraction of NH3 (equation (5.3)) was
plotted against the instantaneous NOx conversion (equation (5.5)) for ten consecutive
cycles. Since the comparison of surface coverage fraction of NH3 and instantaneous
NOx conversion are non-dimensionalized terms, all ten cycles at each NO to NOx ratio
for each temperature were overlapped as seen in Figure 5.5. When examining the
trendlines it was observed that all data had collapsed creating a single trend line for each
temperature and at a given NO to NOx ratio.

122
0
20
40
60
80
100
0 0.2 0.4 0.6 0.8 1
Cycle 1Cycle 2Cycle 3Cycle 4Cycle 5Cycle 6Cycle 7Cycle 8Cycle 9Cycle 10
NO
x C
on
vers
ion
(%
)
NH3 Surface Coverage Fraction (-)
Figure 5.5 – By non-dimensionalizing NOx conversion vs. the surface coverage fraction
of NH3, all 10 cycles can be collapsed to form one trendline to characterize the effect of
stored NH3 on NOx conversion. Each cycle was performed with a rich pulse of 2 minutes
with 1000 ppm NH3, 6% H2O, and 6% CO2, and a lean pulse of 8 minutes with 400 ppm
NO2, 6% O2, 6% H2O, and 6% CO2 in the feed gas at a constant temperature of 325°C.
The results are shown in Figure 5.6, where it can be seen that instantaneous NOx
conversion is highly dependent on the surface coverage fraction of NH3. In Figure 5.6 it
can be seen that at 275°C and below for the NO to NOx ratio equal to zero (Figure 5.6
(a)), NOx conversion is linearly dependant on the surface coverage fraction of NH3. This
linear dependence of NOx conversion on the surface coverage fraction of NH3 for the all
NO2 NOx composition is due to existence of two simultaneous reactions competing for
the reduction of NO2 with NH3 as shown in (R7) and (R8) from Table 5.1. In all other
cases NOx conversion below the threshold surface coverage fraction for each temperature
is negligible. This behavior implies that there are multiple surface sites that can store
NH3, but not all of the sites will contribute to the reduction of NOx with NH3. This is
different than results shown in Chapter 3, where NH3 storage is modeled on a single
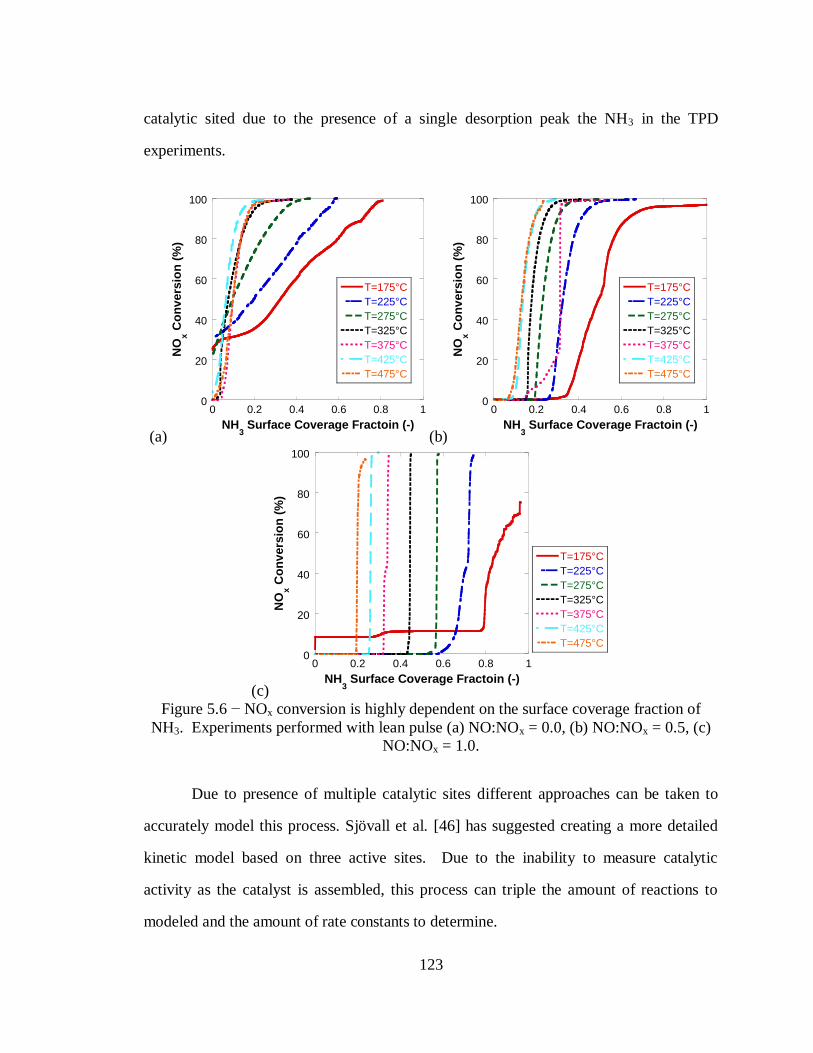
123
catalytic sited due to the presence of a single desorption peak the NH3 in the TPD
experiments.
(a)
0
20
40
60
80
100
0 0.2 0.4 0.6 0.8 1
T=175°C
T=225°C
T=275°C
T=325°C
T=375°C
T=425°C
T=475°C
NO
x C
on
vers
ion
(%
)
NH3 Surface Coverage Fractoin (-)
(b)
0
20
40
60
80
100
0 0.2 0.4 0.6 0.8 1
T=175°C
T=225°C
T=275°C
T=325°C
T=375°C
T=425°C
T=475°C
NO
x C
on
vers
ion
(%
)
NH3 Surface Coverage Fractoin (-)
(c)
0
20
40
60
80
100
0 0.2 0.4 0.6 0.8 1
T=175°C
T=225°C
T=275°C
T=325°C
T=375°C
T=425°C
T=475°C
NO
x C
on
vers
ion
(%
)
NH3 Surface Coverage Fractoin (-)
Figure 5.6 − NOx conversion is highly dependent on the surface coverage fraction of
NH3. Experiments performed with lean pulse (a) NO:NOx = 0.0, (b) NO:NOx = 0.5, (c)
NO:NOx = 1.0.
Due to presence of multiple catalytic sites different approaches can be taken to
accurately model this process. Sjövall et al. [46] has suggested creating a more detailed
kinetic model based on three active sites. Due to the inability to measure catalytic
activity as the catalyst is assembled, this process can triple the amount of reactions to
modeled and the amount of rate constants to determine.

124
By examining the results of Figure 5.6 it can be determined that NOx conversion
is proportional to the surface coverage fraction of NH3 as shown in equation (5.6).
3xNO Z NH
f (5.6)
A modeling study was performed consistent with one cycle of the long switching
experiments shown in Figure 5.4. From this study the NOx conversion versus the surface
coverage fraction of NH3 is compared for the modeling results and the experimental
results as shown in Figure 5.7. It can be seen that the current kinetic model will predict
NOx conversion approximately linearly dependent on the surface coverage fraction of
NH3 while experimental data has mostly proven to show NOx conversion dependence on
the surface coverage fraction of NH3 is highly non-linear except in the few instances
already stated.

125
(a)
0
20
40
60
80
100
0 0.1 0.2 0.3 0.4 0.5 0.6 0.7 0.8
Experimental T=225°C
Experimental T=325°C
Experimental T=425°C
Simulation T=225°C
Simulation T=325°C
Simulation T=425°C
NO
xC
on
vers
ion
(%
)
Surface Coverage Fraction of NH3 (-)
(b)
0
20
40
60
80
100
0 0.1 0.2 0.3 0.4 0.5 0.6 0.7 0.8
Experimental T=225°C
Experimental T=325°C
Experimental T=425°C
Simulation T=225°C
Simulation T=325°C
Simulation T=425°C
NO
xC
on
vers
ion
(%
)
Surface Coverage Fraction of NH3 (-)
(c)
0
20
40
60
80
100
120
0 0.1 0.2 0.3 0.4 0.5 0.6 0.7 0.8
Experimental T=225°C
Experimental T=325°C
Experimental T=425°C
Simulation T=225°C
Simulation T=325°C
Simulation T=425°C
NO
xC
on
vers
ion
(%
)
Surface Coverage Fraction of NH3 (-)
Figure 5.7 − NOx conversion is based on a linear prediction in the current kinetic
mechanism. Modeling predictions are based on a NO:NOx of (a) 1.0, (b) 0.5, (c) 0.0
5.4 Proposed modifications to the kinetic rate form
Using these findings in Figure 5.6 and Figure 5.7, it can be assumed that the
kinetic mechanism shown in Table 5.1 can be improved by changing the dependence of
the surface coverage fraction of NH3 in the rate forms with NH3 in the reactants. Lietti et
al. [95] initially observed NOx conversion is strongly dependent on the surface coverage

126
fraction of NH3 as a reservoir effect where not every site that stores NH3 is active in NOx
reduction. Lietti has suggested using a kinetic rate form as shown in equation (5.7),
where 3
*
Z NH is the critical NH3 surface concentration value of storage sites that effect NOx
conversion.
3
*
3
3
*
reactants
exp 1 exp
Z NH
Z NH
Z NH
E
R T
i
i
R k y
(5.7)
From the experimental data generated in Figure 5.6 it is observed that all sites that
store NH3 are not active in the NOx removal process. When evaluating the proposed
kinetic rate by Lietti in equation (5.7) it can be observed that the critical NH3 surface
concentration can dominate the kinetic rate at extremely low values. Therefore a new
approximation can be made which combines work on adsorption isotherms by Kisliuk
[151] and work done by Lietti to normalize the reservoir effect to account for the
probability of NH3 being absorbed on an active catalytic site as shown in equation (5.8).
3
*
3
3
*
3
1.0reactants
1 expexp
1 exp
Z NH
Z NH
Z NH
Z NH
E
R T
i
i
R k y
(5.8)
By making the assumption that the kinetic rate is approximately constant except
for the surface coverage fraction of NH3 shown in equation (5.2); the potential NOx
conversion for a constant temperature can be plotted against the surface coverage
dependence of NH3 for the original kinetic rate form (equation (5.1)). This
approximation is compared to the approximation by Lietti et al. (equation (5.7)), and the
suggested normalized rate form (equation (5.8)). The comparison for the three suggested
kinetic rates is shown in Figure 5.8, where the critical NH3 concentration value is varied
to show potential changes to the rate kinetic rate form. It can be seen that the potential

127
for improvement of the kinetic mechanism can be seen in Figure 5.8 by using the
proposed kinetic rate form in equation (5.8) and determining the critical NH3
concentration through the optimization process.
(a)
0
20
40
60
80
100
0 0.2 0.4 0.6 0.8 1
NO:NOx = 0.0
Linear
Smith 0.1
Smith 1.0
Lietti 0.1
Lietti 1.0
NO
x C
on
vers
ion
(%
)
NH3 Surface Coverage Fractoin (-)
(b)
0
20
40
60
80
100
0 0.2 0.4 0.6 0.8 1
NO:NOx = 0.5
Linear
Smith 0.1
Smith 1.0
Lietti 0.1
Lietti 1.0
NO
x C
on
vers
ion
(%
)NH
3 Surface Coverage Fractoin (-)
(c)
0
20
40
60
80
100
0 0.2 0.4 0.6 0.8 1
NO:NOx = 1.0
Linear
Smith 0.1
Smith 1.0
Lietti 0.1
Lietti 1.0
NO
x C
on
vers
ion
(%
)
NH3 Surface Coverage Fractoin (-)
Figure 5.8 − Determination of the dependence on the surface coverage fraction of NH3
can be determined based on experimental data for (a)NO:NOx = 0.0, (a)NO:NOx = 0.5,
(c)NO:NOx = 1.0

128
5.5 Conclusions
By lengthening the ideal rich lean cycling conditions an experiment was designed
to saturate the catalyst with NH3 and measure the NOx conversion as all NH3 is removed
from the catalyst. From the long cycling experiments shown in Figure 5.4 the amount of
NH3 stored on the catalyst can be determined as a non-dimensional term called the NH3
surface coverage. NOx conversion for each cycle can be plotted against the NH3 surface
coverage fraction, which can then be collapsed to find the trendline signifying the
dependence on stored NH3 for a constant temperature of a given NO to NOx ratio. The
trendlines created were then used to formulate a new approximation to be implemented in
the kinetic rates of the NH3 oxidation reaction (R3) , the Standard SCR reaction (R5), the
Fast SCR reaction (R6), the Slow SCR reaction (R7), and the N2O Production reaction
(R8) in the SCR kinetic mechanism shown in Table 5.2. It is suggested not to change the
kinetic rate of the Rich Standard SCR reaction (R4) due to the low activity of the
reaction. It also suggested to not change the kinetic rate for the N2O Reduction with NH3
reaction (R9) however, the kinetic rate can be changed once initial modeling results are
analyzed.

129
Table 5.2 − Summary of chemical reaction and kinetic rates for lean SCR model with
new dependence of the surface coverage fraction of NH3.
Chemical Reaction Kinetics Rate Form
(R1) 2 2
1
2NO O NO
1
2
21 1 exp
E
NORT
NO O
eq
yR k y y
K
(R2) 3 3Z NH Z NH
22 3
3 32 2 2 exp
rr Z NH
E
RT
f NH Z r Z NHR k y k
(R3) 3 2 2 24 3 4 2 6Z NH O Z N H O
3
*
3 ,333
2
3
*
,33
3 31.0
1 expexp
1 exp
Z NH
Z NH
Z NH
Z NH
E
RT
OR k y
(R4) 3 2 24 6 4 5 6Z NH NO Z N H O
4
34 4 exp
E
RT
NO Z NHR k y
(R5) 3 2 2 24 4 4 4 6Z NH NO O Z N H O
3
*
5 ,53
2
3
*
,53
5 51.0
1 expexp
1 exp
Z NH
Z NH
Z NH
Z NH
E
RT
NO OR k y y
(R6) 3 2 2 22 2 2 3Z NH NO NO Z N H O
3
*
6 ,63
2
3
*
,63
6 61.0
1 expexp
1 exp
Z NH
Z NH
Z NH
Z NH
E
RT
NO NOR k y y
(R7) 3 2 2 28 6 8 7 12Z NH NO Z N H O
3
*
7 ,73
2
3
*
,73
7 71.0
1 expexp
1 exp
Z NH
Z NH
Z NH
Z NH
E
RT
NOR k y
(R8) 3 2 2 2 22 2 2 3Z NH NO Z N N O H O
3
*
8 ,83
2
3
*
,83
8 81.0
1 expexp
1 exp
Z NH
Z NH
Z NH
Z NH
E
RT
NOR k y
(R9) 3 2 2 22 3 2 4 3Z NH N O Z N H O
9
2 39 9 exp
E
RT
N O Z NHR k y
130
CHAPTER 6
EFFECT OF H2O AND CO2 ON SCR REACTIONS
Due to the unique operation of the LNT-SCR aftertreatment system present in the
EAS, all of the catalysts will be exposed to rich and lean exhaust conditions where the
LNT will generate NH3 to be used by the SCR when the exhaust becomes rich. By
examining the lean (φ < 1) and rich (φ > 1) complete combustion equations listed in
equations (6.1) and (6.2) respectively, estimates for gas compositions can be determined
for engine under different equivalence ratios if the hydrogen to carbon ratio of the fuel is
known. For ease of performing estimates of H2O and CO2 estimates, H2 and CO were
assumed negligible for the calculations.
2 2 2 2
14
1 791 1
2 4 21
HC
H HC CFuel Air CO H O O N
(6.1)
2 2 2
14
791
2 21H
C
HC
HCFuel Air CO H O CH N
(6.2)

131
For diesel fuel it can be estimated that the hydrogen to carbon ratio is 1.8 [4].
Results using this hydrogen to carbon ratio and varying the equivalence ratio from 0.5 to
3.0 are shown in Figure 6.1. In Figure 6.1 it can be seen that H2O and CO2 levels will
change from approximately 6% when lean to approximately 15% when rich. Due to the
EAS working between normal engine operation of an equivalence ratio of approximately
0.6 and an equivalence ratio of 1.1 when performing a rich regeneration [19, 20], H2O
and CO2 levels should be varied between 6% and 12%. From Chapter 3 the effect of
oxygen concentration on the SCR reactions was characterized. It should also be noted
that the SCR catalyst (located downstream of the LNT and cDPF) may be exposed to H2,
CO, and hydrocarbons when the exhaust stream becomes rich; however the effect of
these gases will be studied in the next chapter.
0
5
10
15
20
0.5 1 1.5 2 2.5 3
CO2
H2O
O2
Exh
ast
Gas C
om
po
sit
ion
(%
)
Equivalence Ratio (-)
Figure 6.1 − Shows how H2O and CO2 concentration increase from 6% to 15% as
equivalence ratio increases.

132
6.1 NO Oxidation
Due to common kinetic rate forms for the oxidation of NO to NO2 containing a
water inhibition term, experiments with varying H2O and CO2 values were already
studied. In Chapter 3 it was found that water strongly inhibits catalyst activity when
comparing experiments with 0% H2O / CO2 and a 6% H2O /CO2. However, increasing to
10% H2O / CO2 did not further affect conversion in the forward or reverse reaction for
the oxidation of NO to NO2. Due to these results the inhibition terms were dropped from
the proposed kinetic rate forms because there is no change in conversion in the expected
H2O concentration range of 6 – 10%. The conversion experiments are shown in Figure
6.2.
(a)
0
20
40
60
80
100
200 250 300 350 400 450
0% H2O
6% H2O
8% H2O
10% H2O
NO
Co
nv
ers
ion
(%
)
Temperature (C)
2 2
1NO O NO
2
(b)
0
20
40
60
80
100
200 250 300 350 400 450 500
0% H2O
6% H2O
10% H2O
NO
2 C
ove
rsio
n (
%)
Temperature (C)
2 2
1NO NO O
2
Figure 6.2 − From 0 – 6% water concentration in the feed gas can have large effects on
the oxidation of NO to NO2 and reduction of NO2 to NO and O2, while there is little
effect on the the forward and reverse reaction when the concentration of H2O is varied
from 6 – 10%, all experiments were performed with 6% O2, and 1000 ppm NO.
6.2 NH3 Storage
Due to the drastic change in H2O and CO2 concentration it is important to study
the effect of each on the NH3 storage capacity of the catalyst as it is the rate limiting step
in NOx reduction with NH3. It has been stated that CO2 has a small effect on storage of

133
NH3 [18], but H2O will have a more significant effect [101]. All TPD experiments to
determine NH3 storage capacity were performed with a gas space velocity of 30,000 hr-1
.
Error analysis for the TPD experiments is calculated as a RMS combination of the 2%
error in NH3 concentrations from the FTIR and the standard deviation of NH3 storage
capacities from multiple experiments at each temperature and gas compositions. The first
series of experiments were performed with only NH3 in the feed gas, the second series of
experiments is performed with NH3 and CO2 in the feed gas, and the last series of
experiments is performed with NH3, CO2, and H2O in the feed gas with equivalent values
of CO2 and H2O due to the hydrogen to carbon ratio of diesel fuel being close to a value
of 2.0 [4]. For the synthetic gas bench the minimum value of H2O concentrations is 0
(off) or 4% while the maximum H2O concentration is 10%.
Figure 6.3 below shows how NH3 storage capacity is affected by different H2O
and CO2 concentrations at initial storage temperatures between 175°C–475°C. From this
Figure 6.3 it can be determined that CO2 has little effect on the NH3 storage capacity of
this catalyst except at high temperature when comparing to TPD experiments performed
with no H2O or CO2 in the feed gas. The experiments performed with no H2O or CO2 in
the feed gas represent the maximum NH3 storage capacity for the SCR catalyst. CO2
high temperature effects on NH3 storage capacity can be assumed negligible because it
has been found that H2O concentration will have a stronger inhibition effect on NH3
storage capacity and in combustion exhaust gas H2O and CO2 are always present.

134
0
200
400
600
800
1000
1200
1400
1600
150 200 250 300 350 400 450 500
0% CO2, 0% H
2O
4% CO2, 0% H
2O
4% CO2, 4% H
2O
10% CO2, 0% H
2O
10% CO2, 10% H
2O
NH
3 S
tora
ge
(g
/m3)
Temperature (C)
Figure 6.3 − Shows H2O concentration has a larger effect on NH3 storage capacity then
CO2 concentration
Figure 6.4 shows the effect of different H2O and CO2 gas concentration in the
feed gas on NH3 storage capacity in a series of TPD experiments. The feed gas
concentrations of CO2 and H2O were held constant for each experiment. A saturation
effect is seen as a result from this series of experiments, where NH3 storage capacity of
the catalyst decreases as H2O concentration increases, however this effect is not linear
with H2O concentration, and shows only small decreases in NH3 storage capacity as H2O
concentration in the feed gas increases. This is commonly referred to as a saturation
effect on a catalyst and commonly occurs when a gas concentration is higher than 2% in
the feed gas.

135
0
200
400
600
800
1000
1200
1400
1600
150 200 250 300 350 400 450 500
0% CO2, 0% H
2O
4% CO2, 4% H
2O
6% CO2, 6% H
2O
8% CO2, 8% H
2O
10% CO2, 10% H
2O
NH
3 S
tora
ge (
g/m
3)
Temperature (C)
Figure 6.4 − Shows a saturation of the catalyst by H2O that will not have major effects on
NH3 storage capacity.
(a)
0
200
400
600
800
1000
1200
1400
1600
0 2 4 6 8 10
NH
3 S
tora
ge (
g/m
3)
CO2 and H
2O Concentration (%)
T=175°C
T=275°C
T=375°C
T=475°C
T=225°C
T=325°C
T=425°C
(b)
100
150
200
250
300
350
400
450
500
0 2 4 6 8 10
NH
3 S
tora
ge (
g/m
3)
CO2 and H
2O Concentration (%)
T=375°C
T=475°C
T=425°C
Figure 6.5 – NH3 storage capacity decreases as temperature increases, and as H2O
concentration increases.
6.2.1 NH3 Storage Modeling Approach for Varying Water Concentrations
From the results shown in Figure 6.4 it can be seen that NH3 storage capacity is
reduced as the concentration of water increases. It can therefore be proposed that there is

136
a competition on the active catalytic sites between H2O and NH3. It can then be proposed
that the NH3 storage competition with H2O storage can be defined by the equations in
(6.3) and (6.4).
1f
1r3 3Z NH Z NH
R
R
(6.3)
2f
2r2 2Z H O Z H O
R
R (6.4)
To use this method the NH3 storage reaction (equation (6.3)) will be calibrated to
a TPD experiment at an initial storage temperature of 200°C with 0% H2O and 0% CO2
in the feed gas. In Chapter 3 it was found that a Tempkin Isotherm kinetic rate yielded
higher accuracy then a traditional rate form when mathematically describing the NH3
storage reaction in equation (6.3). Therefore, the kinetic rate equations shown in (6.5)
and (6.6) will be used as the forward and reverse kinetic rates for equation (6.3).
31f 1f NH Zk y R (6.5)
1rZ NH3
31r 1r Z NH
expE
R Tu mk
R (6.6)
It was found that when comparing these results to TPD experiments at different
initial storage temperatures that the accuracy of the model can increase if an activation
energy is added to the forward kinetic rate form as shown in (6.7). While this term is
commonly neglected [108], calibration results found that the activation energy to be
5.353 kJ mol-1
, which is small, but not negligible.
1f
31f 1f NH ZexpE
R Tu mk y
R (6.7)
The rate forms for the forward and reverse reactions (equations (6.7) and (6.6))
were fit simultaneously for a TPD experiment performed with an inlet feed gas of NH3 in
N2 without any H2O or CO2 present at a catalyst temperature of 200°C (shown in Figure

137
6.6). The coefficients for equations (6.6)and (6.7) are given in Table 6.1. It should be
noted that this is the same approach as used in Chapter 3 to calibrate the NH3 Storage
reaction; however calibration was done to match a TPD experiment with 8% H2O and 8%
CO2.
Table 6.1 − Parameters developed to model the reaction described by equation (6.3)
Parameter Value Units
Site Density 1.67×10⁻²
[kmol m-2
]
E1f 5.353 [kJ mol-1
]
k1f 2.61×100 [kmol m
-2 s
-1 moleNH3
-1]
E1r 96.340 [kJ mol-1
]
k1r 2.99×10³ [kmol m
-2 s
-1]
λ1 0.256 [-]
0
100
200
300
400
500
600
0 10 20 30 40 50 60
NH3 Inlet
Experimental NH3 Outlet
Simulation NH3 Outlet
Temperature (C)
Co
nc
en
trati
on
(p
pm
) o
r T
em
pera
ture
(C
)
Time (min) Figure 6.6 − Comparison of experimental and simulation data for a TPD experiment with
0% H2O and 0% CO2 in the feed gas.

138
After the modeling parameters were determined, results from all four TPD
experiments with 0% H2O/CO2 were compiled with an average error in NH3
concentration range from 5.52 – 7.36 ppm. Figure 6.7 illustrates that there is good
agreement between the model and experimental values. However, the model diverges at
the high and low temperatures. This occurs because there is more than one site that can
absorb NH3, as previously found by [91, 104, 109]. As stated before, our global
mechanism uses only one active site for the strongly chemisorbed ammonia, and assumes
that weakly bonded ammonia is stored on secondary sites that are not modeled. This
effect is also prevalent in the NH3 adsorption behavior during the shoulder at the end of
the first stage of the TPD experiment where the NH3 approaches the inlet concentration
values.
400
600
800
1000
1200
1400
1600
1800
2000
200 250 300 350 400
SimulationExperimental
NH
3 S
tora
ge
(g
/m3)
Temperature (C)
Figure 6.7 − Model shows acceptable agreement with experimental data for total NH3
storage capacity under varying storage temperatures for experiments with 0% H2O and
0% CO2.
Once the NH3 storage reaction has been calibrated and verified for the TPD
experiments with 0% H2O and 0% CO2, the H2O competition reaction shown in equation
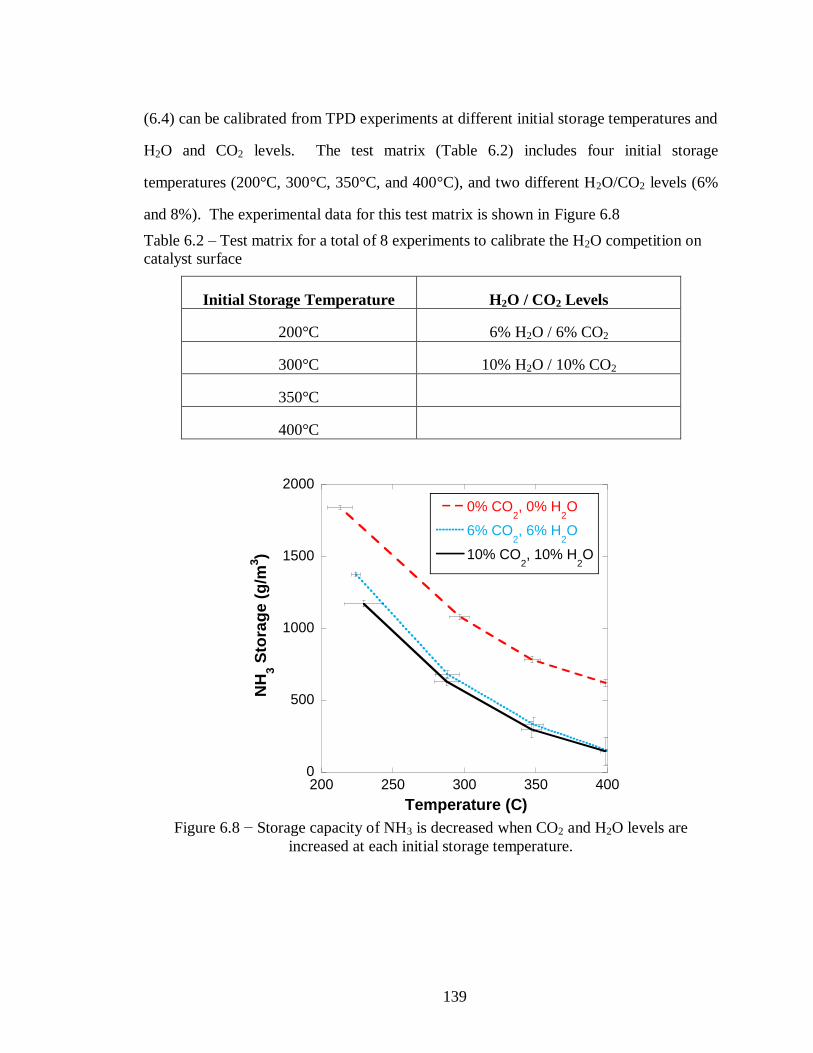
139
(6.4) can be calibrated from TPD experiments at different initial storage temperatures and
H2O and CO2 levels. The test matrix (Table 6.2) includes four initial storage
temperatures (200°C, 300°C, 350°C, and 400°C), and two different H2O/CO2 levels (6%
and 8%). The experimental data for this test matrix is shown in Figure 6.8
Table 6.2 – Test matrix for a total of 8 experiments to calibrate the H2O competition on
catalyst surface
Initial Storage Temperature H2O / CO2 Levels
200°C 6% H2O / 6% CO2
300°C 10% H2O / 10% CO2
350°C
400°C
0
500
1000
1500
2000
200 250 300 350 400
0% CO2, 0% H
2O
6% CO2, 6% H
2O
10% CO2, 10% H
2O
NH
3 S
tora
ge
(g
/m3)
Temperature (C)
Figure 6.8 − Storage capacity of NH3 is decreased when CO2 and H2O levels are
increased at each initial storage temperature.

140
It is proposed to use standard Arrhenius kinetic rates for the H2O competition for
catalytic sites reaction shown in equation (6.4). Therefore, the corresponding forward and
reverse rate forms listed in Equations (6.8) and (6.9) respectively.
2f
2r2 2Z H O Z H O
R
R
(6.4)
2f
22f 2f H O Zexpu m
E
R Tk y R
(6.8)
2r
22r 2r Z H O
expu m
E
R Tk R
(6.9)
Table 6.3 provides the parameters for the reaction rate expressions in Equations
(6.8) and (6.9). When fitting the H2O storage reaction (Equation (6.4)), all cases of
varying storage temperature and varying H2O/CO2 concentration were included to
account for how H2O concentration and temperature influence the amount of stored NH3
on the catalyst. Once the rate parameters were determined additional simulations were
done starting with a H2O saturated catalyst to tests its effect on NH3 storage. The results
showed negligible differences therefore it can be concluded that H2O will fill an empty
site temporarily, and then release, creating a free site that can store either NH3 or H2O
depending on feed gas composition.
Table 6.3 − Parameters developed to model the reaction expression derived from
equation (6.4).
Parameter Value Units
E2f 47.260 [kJ mol-1
]
k2f 2.98×101 [kmol m
-2 s
-1 moleH2O
-1]
E2r 20.120 [kJ mol-1
]
k2r 2.03×10⁻³
[kmol m-2
s-1
]
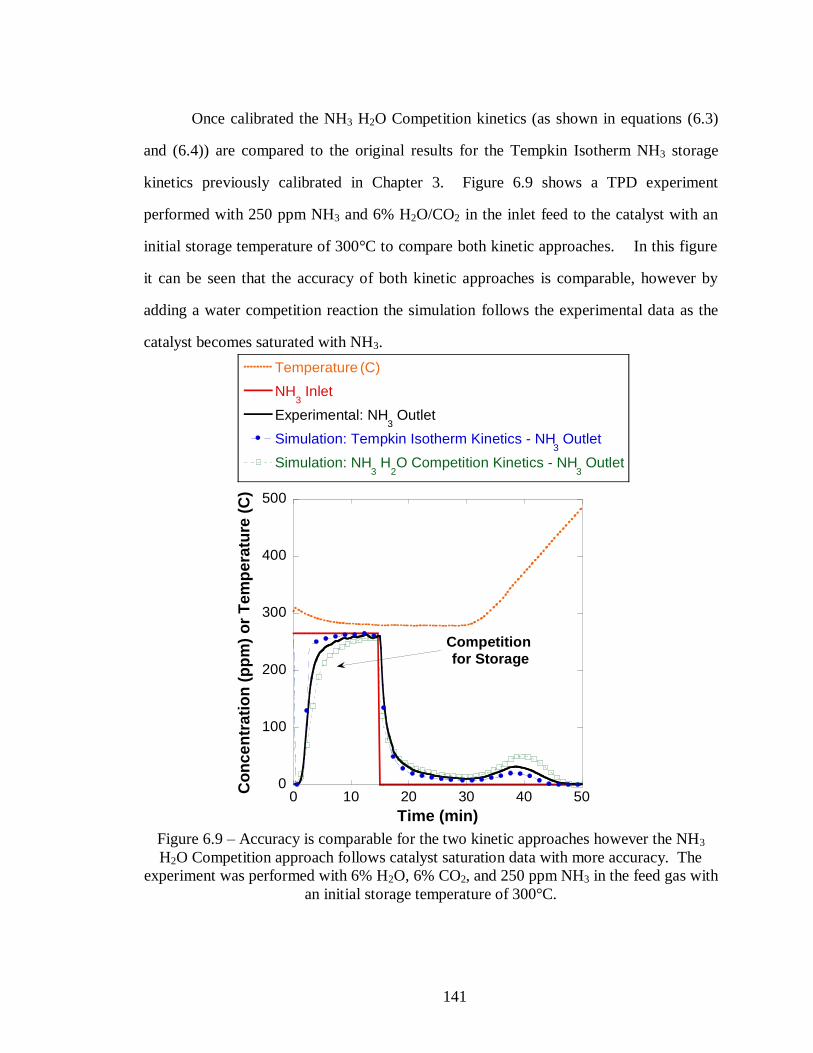
141
Once calibrated the NH3 H2O Competition kinetics (as shown in equations (6.3)
and (6.4)) are compared to the original results for the Tempkin Isotherm NH3 storage
kinetics previously calibrated in Chapter 3. Figure 6.9 shows a TPD experiment
performed with 250 ppm NH3 and 6% H2O/CO2 in the inlet feed to the catalyst with an
initial storage temperature of 300°C to compare both kinetic approaches. In this figure
it can be seen that the accuracy of both kinetic approaches is comparable, however by
adding a water competition reaction the simulation follows the experimental data as the
catalyst becomes saturated with NH3.
0
100
200
300
400
500
0 10 20 30 40 50
Temperature (C)
NH3 Inlet
Experimental: NH3 Outlet
Simulation: Tempkin Isotherm Kinetics - NH3 Outlet
Simulation: NH3 H
2O Competition Kinetics - NH
3 Outlet
Co
nce
ntr
ati
on
(p
pm
) o
r T
em
pera
ture
(C
)
Time (min)
Competition
for Storage
Figure 6.9 – Accuracy is comparable for the two kinetic approaches however the NH3
H2O Competition approach follows catalyst saturation data with more accuracy. The
experiment was performed with 6% H2O, 6% CO2, and 250 ppm NH3 in the feed gas with
an initial storage temperature of 300°C.

142
Figure 6.10 illustrates how each kinetic approach predicts the NH3 storage
capacity of the catalyst. It can be seen that original Tempkin Isotherm approach will only
change the NH3 storage capacity as the initial storage temperature change, while H2O
levels changes have no effect. The NH3 H2O Competition kinetics however allows
corrections for temperature and H2O concentration. It should be noted that when
modeling SCR catalysts to be used in only steady-state conditions, H2O storage effects
will remain relatively low. Therefore, modeling complete storage effects with the water
reaction is not necessary and the simulation only requires the NH3 reaction (equation
(6.3)) as long as calibration is performed with a representative H2O/CO2 level. However,
in the case of the LNT-SCR aftertreatment system, the lean/rich switching will cause
significant shifts in water concentration. Thus, incorporating H2O storage in the model is
important to account for the amount of stored NH3 to predict the total NOx conversion of
the LNT-SCR system.

143
0
500
1000
1500
200 250 300 350 400
Experimental: 6% H2O, 6% CO
2
Tempkin Isotherm: 6% H2O, 6% CO
2
NH3 H
2O Competition: 6% H
2O, 6% CO
2
Experimental: 10% H2O, 10% CO
2
Tempkin Isotherm: 10% H2O, 10% CO
2
NH3 H
2O Competition: 10% H
2O, 10% CO
2
NH
3 S
tora
ge C
ap
acit
y (
g/m
3)
Temperature (C)
Tempkin Isotherm
Kinetics
NH3 H
2O Competition
Kinetics
Figure 6.10 – The original Tempkin Isotherm kinetic approach to NH3 storage capacity
only varies with the initial storage temperature, while the NH3 H2O Competition kinetic
approach allows for changes in NH3 storage capacity based on temperature and H2O
concentration.
6.3 NH3 Oxidation
Temperature ramp experiments were performed at different H2O and CO2
concentrations for ammonia oxidation experiments. When comparing two experiments
with 6% H2O/CO2 and 10% H2O/CO2 as shown in Figure 6.11, it can be seen that the
NH3 conversion trendlines vs. temperature are similar however these are slight changes in
magnitude. From the previous sections it was concluded that H2O and NH3 will compete
for catalytic sites. Since NH3 oxidation occurs when NH3 is on the surface of the
catalyst, increases in H2O concentration will decrease the amount of NH3 on the catalyst

144
surface and decrease the conversion with NH3. It can therefore be concluded that the
oxidation of NH3 is a relatively slow reaction where H2O competition for catalytic sites
affects the NH3 Conversion. Further corroboration is done by adding the NH3 H2O
competition reaction shown in (6.4) to the modeling prediction from Chapter 3, where it
can be seen that a changes in NH3 conversion predictions can be accounted for by adding
the H2O storage reaction instead of changing the kinetic reaction rate for the NH3
oxidation reaction.
0
5
10
15
20
25
30
35
40
250 300 350 400 450 500
Experimental: 6% H2O, 6% CO
2
Experimental: 10% H2O, 10% CO
2
Simulation: 6% H2O, 6% CO
2
Simulation: 10% H2O, 10% CO
2
NH
3 C
on
vers
ion
(%
)
Temperature (C)
Figure 6.11 − Negligible changes in NH3 conversion in oxidation experiments when H2O
and CO2 concentrations are varied from 6% – 10% in the feed gas with 1000 ppm NH3,
and 6% O2.
6.4 NOx Reduction with NH3
Figure 6.12 shows the results of experiments performed while testing varying
H2O and CO2 levels to in the feed gas. From these results it can be seen that H2O and
CO2 levels do not have an effect on NOx conversion with NH3 for all NO to NOx ratios.
Therefore it can be concluded that NO and NO2 will react quickly with stored NH3,
therefore H2O competition for catalytic sites will not affect NOx conversion.

145
(a)
0
20
40
60
80
100
200 250 300 350 400 450 500
6% H2O, 6% CO
2
8% H2O, 8% CO
2
NO
x C
on
vers
ion
(%
)
Temperature (C) (b)
0
20
40
60
80
100
200 250 300 350 400 450 500
6% H2O, 6% CO
2
8% H2O, 8% CO
2
NO
x C
on
ve
rsio
n (
%)
Temperature (C)
(c)
0
20
40
60
80
100
200 250 300 350 400 450 500
6% H2O, 6% CO
2
8% H2O, 8% CO
2
NO
x C
on
ve
rsio
n (
%)
Temperature (C)
Figure 6.12 − NOx conversion does not change with as H2O and CO2 concentrations
increase. Experiments were performed as a temperature ramp with 6% O2, 1000 NH3,
and 1000 NO varying H2O and CO2 concentration feed gas (a) NO:NOx = 1.0, (b)
NO:NOx = 0.5, (c) NO:NOx = 0.0
6.5 Conclusions
The following conclusion can be made based on experimental and simulations
results presented in this chapter.

146
6.5.1 NO Oxidation Conclusions
It has been determined that the oxidation of NO to NO2 is affected by H2O
concentration but not in the predicted H2O concentration range of the EAS. Therefore as
shown in Chapter 3, H2O inhibition term can neglected in the kinetic rate.
6.5.2 NH3 Storage Conclusions
The experiments described in this study indicate that as exhaust gas becomes rich
and H2O and CO2 concentrations increase, the storage capacity of NH3 on an Fe-Zeolite
catalyst decreases. This is important for LNT-SCR combination systems where the
exhaust stream concentrations can vary from 6% H2O/CO2 to 12% H2O/CO2. The
decrease in storage capacity of NH3 is larger between 0 – 6% H2O/CO2 than between 6 –
10% H2O/CO2, which means that if engine conditions were held fairly constant, such as
during lean engine operation with only an SCR system, the H2O competition effect does
not need to be included in a global model and only temperature effects need to be
considered in the model. In cases where the exhaust stream varies from lean to rich, such
as an LNT-SCR system, using an H2O competition model increases the accuracy of
stored NH3 under the constantly varying exhaust conditions. Since NOx conversion is a
strong function of the surface coverage fraction of NH3, a method to model the NH3 H2O
competition for catalytic sites has been proposed to allow NH3 storage to be affected by
temperature and H2O concentration.
6.5.3 NH3 Oxidation Conclusions
It has been determined that the oxidation of NH3 is a relatively slow reaction that
occurs on the catalyst. It was observed that varying H2O concentration will decrease the
conversion of NH3 due to oxidation. It was also shown that this inhibition from H2O can

147
be accounted for using the NH3 H2O competition approach as shown in the NH3 Storage
section.
6.5.4 NOx Reduction with NH3 Conclusions
It was observed that under steady state conditions that NOx conversion is
unaffected by changes in H2O/CO2 levels. Therefore there is no inhibition due to H2O or
CO2 for the NOx conversion reactions. It can therefore be concluded that each NOx
conversion reaction occurs at a faster rate than the NH3 oxidation reaction, since
increasing H2O concentration did not decrease the NOx conversion for each NO to NOx
ratio.

148
CHAPTER 7
EFFECT OF CO, H2, AND C3H6 ON SCR REACTIONS
SCR catalysts are usually installed on engine systems that operate in only lean
exhaust conditions and commonly have a DOC upstream to remove any unburned
hydrocarbons, hydrogen, and carbon monoxide from the exhaust stream [3]. Due to the
flexibility in the regeneration strategy of the EAS, there is a strong possibility that H2,
CO, and hydrocarbons will become part of the feed gas to the SCR catalyst when
optimizing the EAS for maximum NOx conversion. NOx conversion with NH3 is highly
sensitive to the NO to NOx ratio in the feed gas in a SCR. Additionally, Figure 7.1 shows
additional reductants of H2 and CO can slightly increase NOx conversion while C3H6
present will inhibit NOx conversion. This chapter will study how the additional
reductants of H2, CO, and C3H6 will react with NO and NO2 on the iron based zeolite
SCR catalyst in the EAS.
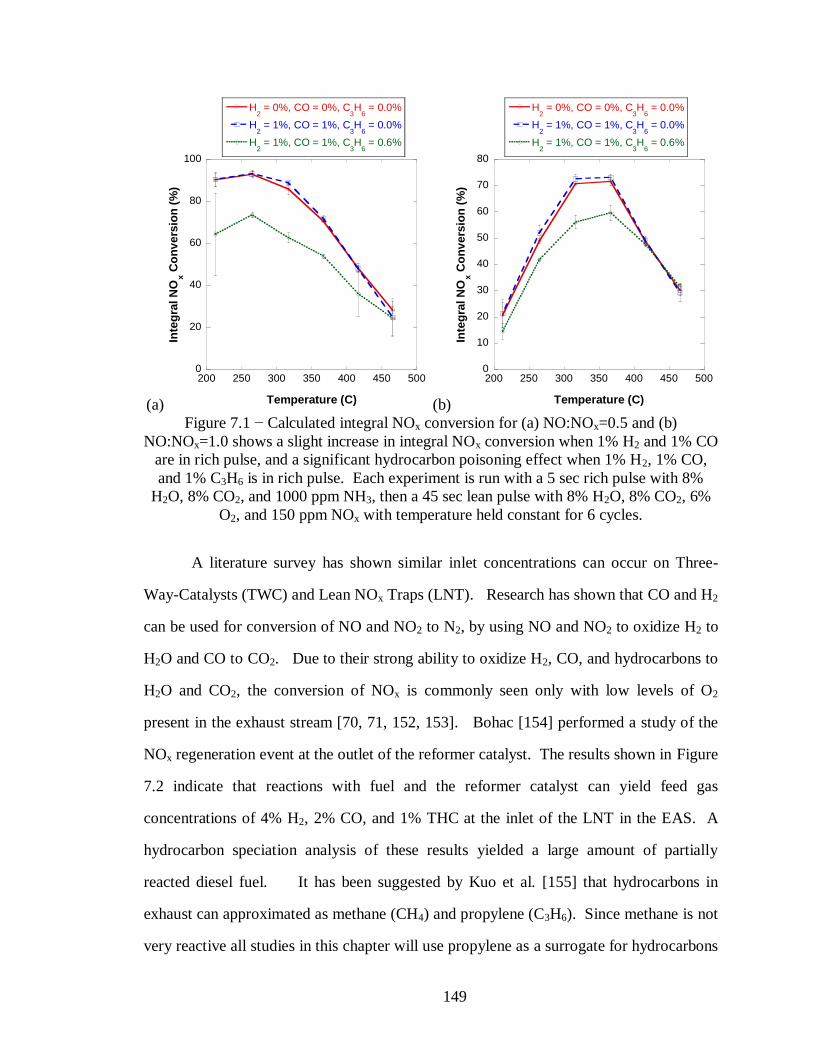
149
(a)
0
20
40
60
80
100
200 250 300 350 400 450 500
H2 = 0%, CO = 0%, C
3H
6 = 0.0%
H2 = 1%, CO = 1%, C
3H
6 = 0.0%
H2 = 1%, CO = 1%, C
3H
6 = 0.6%
Inte
gra
l N
Ox C
on
vers
ion
(%
)
Temperature (C) (b)
0
10
20
30
40
50
60
70
80
200 250 300 350 400 450 500
H2 = 0%, CO = 0%, C
3H
6 = 0.0%
H2 = 1%, CO = 1%, C
3H
6 = 0.0%
H2 = 1%, CO = 1%, C
3H
6 = 0.6%
Inte
gra
l N
Ox C
on
vers
ion
(%
)
Temperature (C)
Figure 7.1 − Calculated integral NOx conversion for (a) NO:NOx=0.5 and (b)
NO:NOx=1.0 shows a slight increase in integral NOx conversion when 1% H2 and 1% CO
are in rich pulse, and a significant hydrocarbon poisoning effect when 1% H2, 1% CO,
and 1% C3H6 is in rich pulse. Each experiment is run with a 5 sec rich pulse with 8%
H2O, 8% CO2, and 1000 ppm NH3, then a 45 sec lean pulse with 8% H2O, 8% CO2, 6%
O2, and 150 ppm NOx with temperature held constant for 6 cycles.
A literature survey has shown similar inlet concentrations can occur on Three-
Way-Catalysts (TWC) and Lean NOx Traps (LNT). Research has shown that CO and H2
can be used for conversion of NO and NO2 to N2, by using NO and NO2 to oxidize H2 to
H2O and CO to CO2. Due to their strong ability to oxidize H2, CO, and hydrocarbons to
H2O and CO2, the conversion of NOx is commonly seen only with low levels of O2
present in the exhaust stream [70, 71, 152, 153]. Bohac [154] performed a study of the
NOx regeneration event at the outlet of the reformer catalyst. The results shown in Figure
7.2 indicate that reactions with fuel and the reformer catalyst can yield feed gas
concentrations of 4% H2, 2% CO, and 1% THC at the inlet of the LNT in the EAS. A
hydrocarbon speciation analysis of these results yielded a large amount of partially
reacted diesel fuel. It has been suggested by Kuo et al. [155] that hydrocarbons in
exhaust can approximated as methane (CH4) and propylene (C3H6). Since methane is not
very reactive all studies in this chapter will use propylene as a surrogate for hydrocarbons
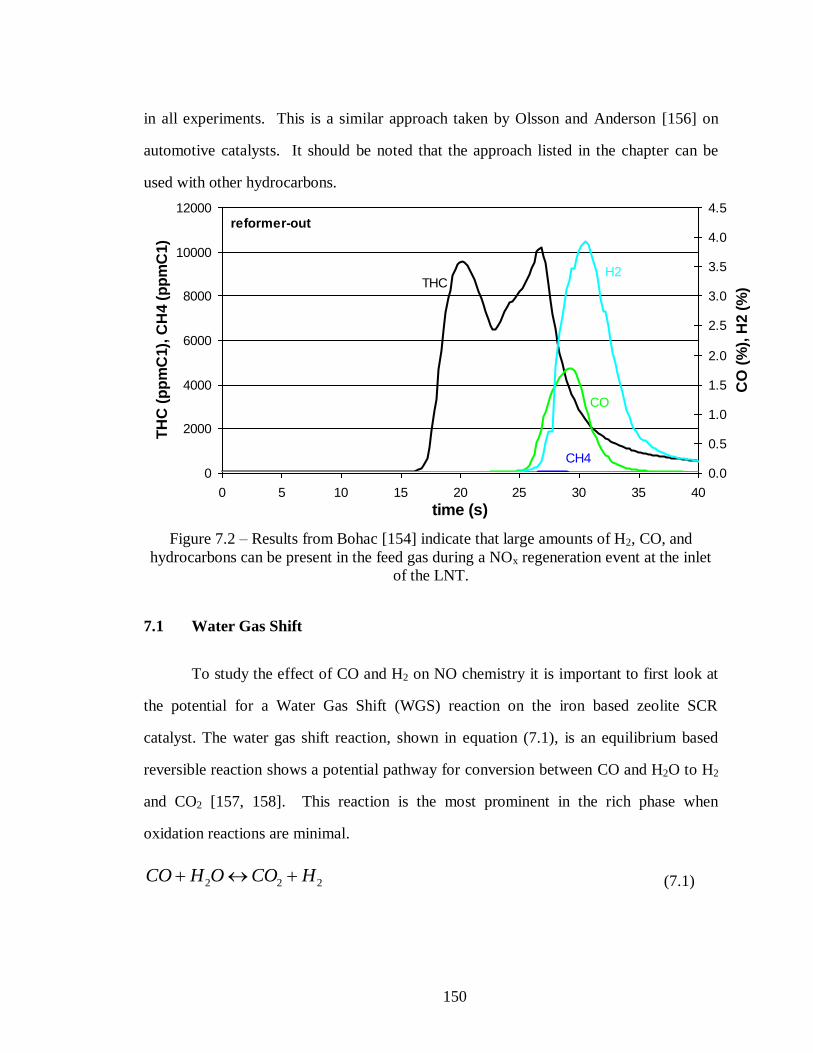
150
in all experiments. This is a similar approach taken by Olsson and Anderson [156] on
automotive catalysts. It should be noted that the approach listed in the chapter can be
used with other hydrocarbons.
Figure 7.2 – Results from Bohac [154] indicate that large amounts of H2, CO, and
hydrocarbons can be present in the feed gas during a NOx regeneration event at the inlet
of the LNT.
7.1 Water Gas Shift
To study the effect of CO and H2 on NO chemistry it is important to first look at
the potential for a Water Gas Shift (WGS) reaction on the iron based zeolite SCR
catalyst. The water gas shift reaction, shown in equation (7.1), is an equilibrium based
reversible reaction shows a potential pathway for conversion between CO and H2O to H2
and CO2 [157, 158]. This reaction is the most prominent in the rich phase when
oxidation reactions are minimal.
2 2 2CO H O CO H (7.1)
0
2000
4000
6000
8000
10000
12000
0 5 10 15 20 25 30 35 40
time (s)
TH
C (
pp
mC
1),
CH
4 (
pp
mC
1)
0.0
0.5
1.0
1.5
2.0
2.5
3.0
3.5
4.0
4.5
CO
(%
), H
2 (
%)
reformer-out
THC
CH4
CO
H2

151
Chen et al. found up to 12% conversion from CO and H2O to H2 and CO2 from
the WGS shift reaction on an Fe based SCR catalyst [158]. Figure 7.3 shows
experiments performed as a temperature ramp with both the forward and reverse
constituents in a balance of nitrogen as the only species in the feed gas. From the
experimental data shown in Figure 7.3 it can be seen that the WGS reaction on the Fe
based zeolite SCR catalyst in the EAS is negligible.
100
101
102
103
104
105
106
107
200 250 300 350 400 450 500
H2O
CO2
CO
H2
Co
nc
ne
trati
on
(p
pm
)
Temperature (C)
2 2 2CO H O CO H
100
101
102
103
104
105
106
107
200 250 300 350 400 450 500
H2O
CO2
CO
H2
Co
nc
ne
trati
on
(p
pm
)
Temperature (C)
2 2 2CO H CO H O
Figure 7.3 − Experimental data shows no water gas shift reaction in either direction
across the Fe based SCR catalyst for entire temperature operation range
7.2 H2, CO, and C3H6 Oxidation
After determining there is no effect from WGS it becomes important to
understand lean reactions with H2 and CO on the SCR catalyst. Under lean conditions
the oxidation of H2 and CO is commonly studied in TWC kinetics [152, 153, 157] and
DOC kinetics [72].
7.2.1 H2 Oxidation
Reviewing literature from TWC and DOC kinetics it can be found that the kinetic
rates are very high for the oxidation of H2 to H2O as seen in the reaction shown in
equation (7.2) [71, 72, 157].
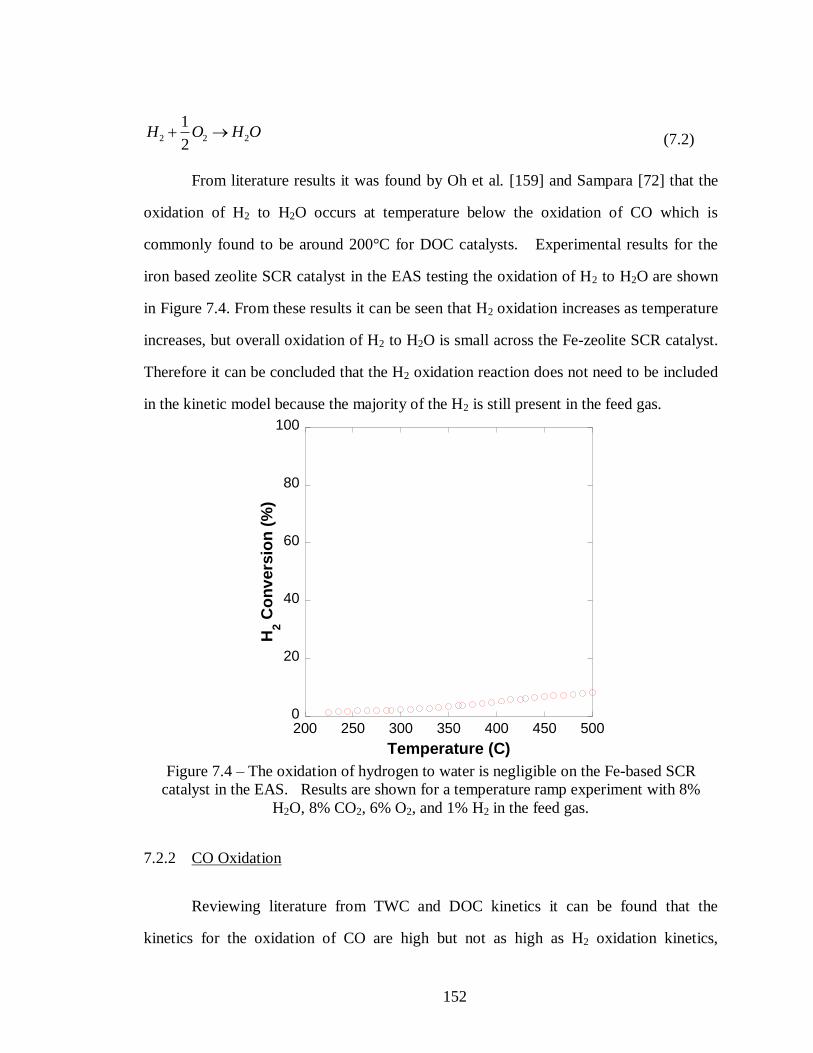
152
2 2 2
1
2H O H O
(7.2)
From literature results it was found by Oh et al. [159] and Sampara [72] that the
oxidation of H2 to H2O occurs at temperature below the oxidation of CO which is
commonly found to be around 200°C for DOC catalysts. Experimental results for the
iron based zeolite SCR catalyst in the EAS testing the oxidation of H2 to H2O are shown
in Figure 7.4. From these results it can be seen that H2 oxidation increases as temperature
increases, but overall oxidation of H2 to H2O is small across the Fe-zeolite SCR catalyst.
Therefore it can be concluded that the H2 oxidation reaction does not need to be included
in the kinetic model because the majority of the H2 is still present in the feed gas.
0
20
40
60
80
100
200 250 300 350 400 450 500
H2 C
on
vers
ion
(%
)
Temperature (C)
Figure 7.4 – The oxidation of hydrogen to water is negligible on the Fe-based SCR
catalyst in the EAS. Results are shown for a temperature ramp experiment with 8%
H2O, 8% CO2, 6% O2, and 1% H2 in the feed gas.
7.2.2 CO Oxidation
Reviewing literature from TWC and DOC kinetics it can be found that the
kinetics for the oxidation of CO are high but not as high as H2 oxidation kinetics,

153
however there is still a strong preference for CO to oxidize to CO2 as seen in the reaction
shown in equation (7.3) [71, 72, 157, 160].
2 2
1
2CO O CO
(7.3)
From literature it was found that while the oxidation of CO to CO2 is not quite as
high as the oxidation of H2 to H2O, complete conversion of CO to CO2 is expected for
DOC catalysts above 200°C [159, 161]. Experimental results for the oxidation of CO to
CO2 for the iron based zeolite SCR catalyst in the EAS are shown in Figure 7.5. From
these results it can be seen that there is no change in the oxidation of CO to CO2 as
temperature increases. Additionally the conversion of CO to CO2 is below 5% for the
entire temperature range, therefore it can be concluded that the CO oxidation reaction
does not need to be included in the kinetic model.
0
20
40
60
80
100
200 250 300 350 400 450 500
CO
Co
nv
ers
ion
(%
)
Temperature (C)
Figure 7.5 − There is a negligible oxidation effect of CO to CO2 on the Fe-based SCR
catalyst in the EAS. Results are shown for a temperature ramp experiment with 8%
H2O, 8% CO2, 6% O2, and 1% CO in the feed gas.

154
7.2.3 C3H6 Oxidation
The oxidation of hydrocarbons is commonly included in kinetic mechanisms for
LNT, TWC, and DOC global kinetic mechanisms [70, 71, 152, 153, 155-157]. It can be
seen in Figure 7.6 that the conversion of C3H6 due to oxidation is a strong function of
temperature with a maximum conversion of 40% at 500°C.
0
20
40
60
80
100
200 250 300 350 400 450 500
C3H
6 C
on
ve
rsio
n (
%)
Temperature (C)
Figure 7.6 – The oxidation of C3H6 is a strong function of temperature with a maximum
conversion of C3H6 around 40%. The experiment was performed as a temperature ramp
with a 6% H2O, 6% CO2, 6% O2, and 0.6% C3H6 in the feed gas.
Olsson et al. [156] has suggested two reactions that can occur simultaneously for
the oxidation of C3H6. The first reaction shown in equation (7.4) is defined as the
complete conversion of C3H6 to CO2 and H2O, while the second reaction shown in
equation (7.5) shows only partial conversion of C3H6 to CO and H2O. Experimental
results in Figure 7.7 show that the dominant pathway for the oxidation of C3H6 leads to
the formation of large amounts of CO as temperature increases; therefore the reaction
shown in equation (7.5) is the dominant pathway in the oxidation of C3H6.

155
3 6 2 2 2
93 3
2C H O CO H O
(7.4)
3 6 2 23 3 3C H O CO H O (7.5)
0
1000
2000
3000
4000
5000
200 250 300 350 400 450 500
C3H
6 Inlet
CO Inlet
H2 Inlet
C3H
6 Outlet
CO Outlet
H2 Outlet
Co
nc
en
tra
tio
n (
pp
m)
Temperature (C)
Figure 7.7 – The oxidation of C3H6 is a strong function of temperature that yields a large
amount of CO as the temperature increases. The experiment was performed as a
temperature ramp with a 6% H2O, 6% CO2, 6% O2, and 0.6% C3H6 in the feed gas.
7.3 NOx Reduction with H2, CO, and C3H6
From the experiments shown above in Figure 7.3, Figure 7.4, and Figure 7.5 it has
been determined that CO and H2 reactions with H2O, CO2, or O2 are negligible for a
kinetic mechanism. While in Figure 7.6, it can be seen that a significant amount of C3H6
will be left to react with NOx when oxidation is accounted for. Therefore, NOx reduction
possibilities can occur similar to reactions seen TWC and LNT kinetic mechanisms [69,
70, 162, 163]. NOx is defined as the sum of NO and NO2 in the exhaust stream. The
conversion of NO and the conversion of NO2 are defined in equations (7.6) and (7.7)

156
respectively. The conversion of NOx is the combination of the conversion of NO and the
conversion of NO2 as defined in equation (7.8).
_ _
_
100NO IN NO OUT
NO
NO IN
c c
c
(7.6)
2 2
2
2
_ _
_
100NO IN NO OUT
NO
NO IN
c c
c
(7.7)
2 2
2
_ _ _ _
_ _
100x
NO IN NO IN NO OUT NO OUT
NO
NO IN NO IN
c c c c
c c
(7.8)
Experiments were performed to investigate the NOx conversion potential for CO,
H2, and C3H6. For each reductant two experiments were performed, the first assuming all
NOx in the feed gas was NO, and the second assumes that all NOx in the feed gas is NO2.
From these experiments (Figure 7.8) it can be seen that NOx conversion is similar
whether the NOx concentration in the feed gas is all NO or NO2 except for C3H6 where
NOx conversion is significantly higher for an all NO2 in the feed gas. It should be noted
that since the conversion of NOx is not measured by the generation of N2, it is possible
for NO2 and C3H6 to form organonitrates (CH3ONO, CH3ONO2, CH3NO2, etc.) at low
temperatures as seen by Kolli et al. [164] on tungstated zirconia-based catalysts.

157
0
5
10
15
20
25
30
35
40
250 300 350 400 450 500
1% CO, 1000 ppm NO
1% CO, 1000 ppm NO2
1% H2, 1000 ppm NO
1% H2, 1000 ppm NO
2
0.6% C3H
6, 1000 ppm NO
0.6% C3H
6, 1000 ppm NO
2N
Ox C
on
ve
rsio
n (
%)
Temperature (C)
Figure 7.8 − NOx conversion for each reductant (H2, CO, and C3H6) is similar when the
feed gas is NO or NO2 as the composition of NOx. The NO2 reduction experiments were
performed with 10% H2O, 10% CO2, 0% O2, 1000 ppm NO2, and varying H2, CO, and
C3H6 concentration; while the NO reduction experiments were performed with 8% H2O,
8% CO2, 6% O2, and 1000 ppm NO, and varying H2, CO, and C3H6 concentration.
Conventional engine exhaust NOx mixtures strongly favor NO with average NOx
mixtures that contain around 95% NO and 5% NO2 [4]. Because engine exhaust
mixtures favor NO most literature sources on TWC and LNT kinetic models contain only
NO reduction. From these literature sources it is commonly seen that NO will reduce to
N2 when interacting with the reductants such as CO, H2, and C3H6 in the investigated
temperature range. Currently with the wide spread use of low temperature combustion
strategies, the ratio of NO2 is increasing for NOx composition [165]. However, engine out
NOx composition cannot be approximated because the SCR is located downstream of a
LNT and DOC catalyst in the EAS. Estimates for the NO to NOx ratio at the SCR in the
EAS have been determined experimentally from engine results, which yielded NOx
mixtures with a NO to NOx ratio of 30% to 70%. To investigate the reason for similar
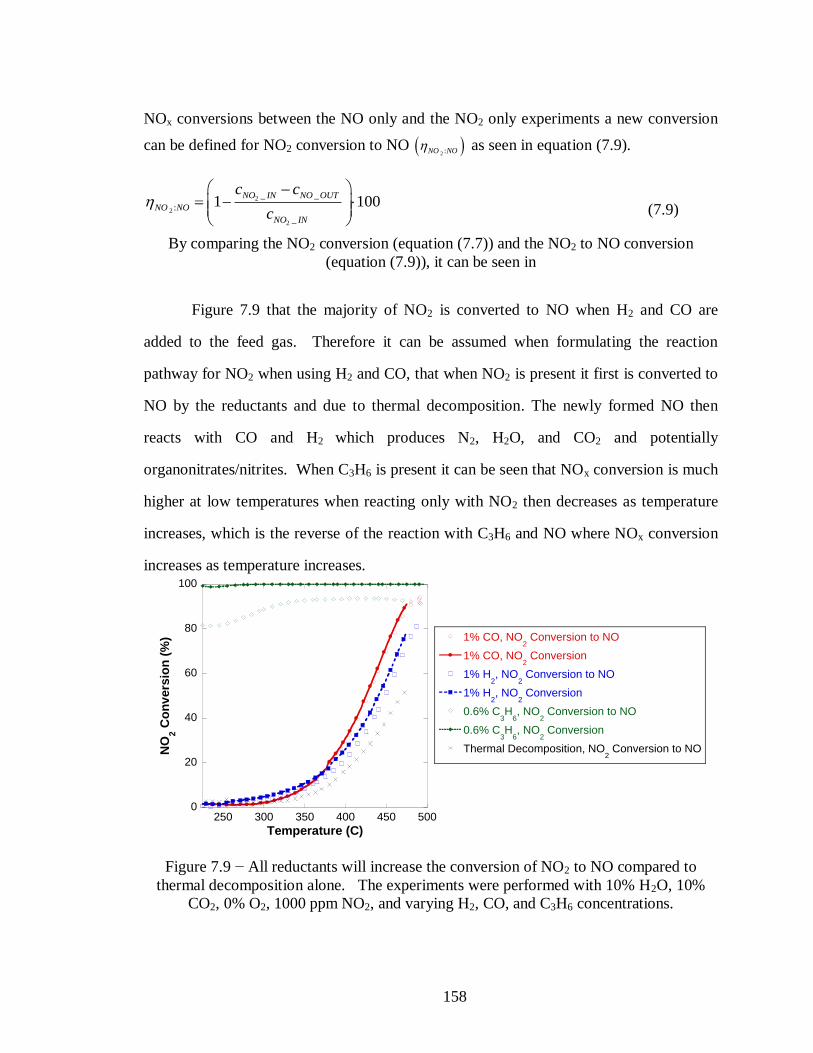
158
NOx conversions between the NO only and the NO2 only experiments a new conversion
can be defined for NO2 conversion to NO 2 :NO NO as seen in equation (7.9).
2
2
2
_ _
:
_
1 100NO IN NO OUT
NO NO
NO IN
c c
c
(7.9)
By comparing the NO2 conversion (equation (7.7)) and the NO2 to NO conversion
(equation (7.9)), it can be seen in
Figure 7.9 that the majority of NO2 is converted to NO when H2 and CO are
added to the feed gas. Therefore it can be assumed when formulating the reaction
pathway for NO2 when using H2 and CO, that when NO2 is present it first is converted to
NO by the reductants and due to thermal decomposition. The newly formed NO then
reacts with CO and H2 which produces N2, H2O, and CO2 and potentially
organonitrates/nitrites. When C3H6 is present it can be seen that NOx conversion is much
higher at low temperatures when reacting only with NO2 then decreases as temperature
increases, which is the reverse of the reaction with C3H6 and NO where NOx conversion
increases as temperature increases.
0
20
40
60
80
100
250 300 350 400 450 500
1% CO, NO2 Conversion to NO
1% CO, NO2 Conversion
1% H2, NO
2 Conversion to NO
1% H2, NO
2 Conversion
0.6% C3H
6, NO
2 Conversion to NO
0.6% C3H
6, NO
2 Conversion
Thermal Decomposition, NO2 Conversion to NON
O2 C
on
vers
ion
(%
)
Temperature (C)
Figure 7.9 − All reductants will increase the conversion of NO2 to NO compared to
thermal decomposition alone. The experiments were performed with 10% H2O, 10%
CO2, 0% O2, 1000 ppm NO2, and varying H2, CO, and C3H6 concentrations.

159
7.3.1 CO NOx Reduction
From Figure 7.8 it can be seen that CO will convert less NOx than H2 or C3H6.
This is further corroborated by Figure 7.10 where NO2 conversion and NO2 conversion to
NO is high but NOx conversion is less than 5%. Due to conversion of NOx with CO being
less than 5% the NO reduction with CO reaction shown in equation (7.10) can be
neglected in the kinetic mechanism.
2 22 2 2CO NO CO N (7.10)
0
20
40
60
80
100
200 250 300 350 400 450 500
NO2 Conversion
NO2 Conversion to NO
NOx Conversion
Co
nv
ers
ion
(%
)
Temperature (C)
Figure 7.10 − NO2 conversion with CO is mostly due to NO2 conversion to NO with less
than 5% of the NO being converted to N2. The experiment was performed with 10% H2O,
10% CO2, 0% O2, 1000 ppm NO2, and 1% CO.
From Figure 7.11 it can be seen that CO will increase the conversion of NO2
compared to thermal decomposition alone. It can also be seen that NO2 conversion
increases as CO concentration increases. Figure 7.10 shows that the majority of
conversion will be from NO2 to NO and not NOx reduction. The CO oxidation with NO2
reaction shown in equation (7.11) therefore can be used to account for any additional
conversion of NO2 to NO when CO is present.

160
2 2CO NO CO NO (7.11)
0
20
40
60
80
100
250 300 350 400 450 500
0 ppm CO
1000 ppm CO
5000 ppm CO
10000 ppm CON
O2 C
on
vers
ion
(%
)
Temperature (C)
Figure 7.11 − CO increases NO2 conversion to NO as concentration of CO increases. The
experiments were performed with 10% H2O, 10% CO2, 0% O2, 1000 ppm NO2, and
varying CO concentration.
7.3.2 H2 NOx Reduction
It can be seen from Figure 7.8 that NOx conversion with H2 is higher than with
CO. From Figure 7.12 it can be seen that as with CO, NO2 will converted to NO first
before reduction to N2.

161
0
20
40
60
80
100
200 250 300 350 400 450 500
NO2 Conversion
NO2 Conversion to NO
NOx Conversion
Co
nv
ers
ion
(%
)
Temperature (C)
Figure 7.12 − NO2 conversion with H2 primarily due to NO2 conversion to NO with up to
7% of NOx converted to N2. The experiments were performed with 10% H2O, 10% CO2,
0% O2, 1000 ppm NO2, and 1% H2.
The conversion of NO2 with H2 can be further seen in Figure 7.13 where
increasing H2 concentration will increase NO2 conversion. Due to the increase in
conversion of NO2 to NO with H2 compared to thermal decomposition the reaction of H2
being oxidized by NO2 shown in equation (7.12) can be used to describe this behavior.
2 2 2H NO H O NO (7.12)
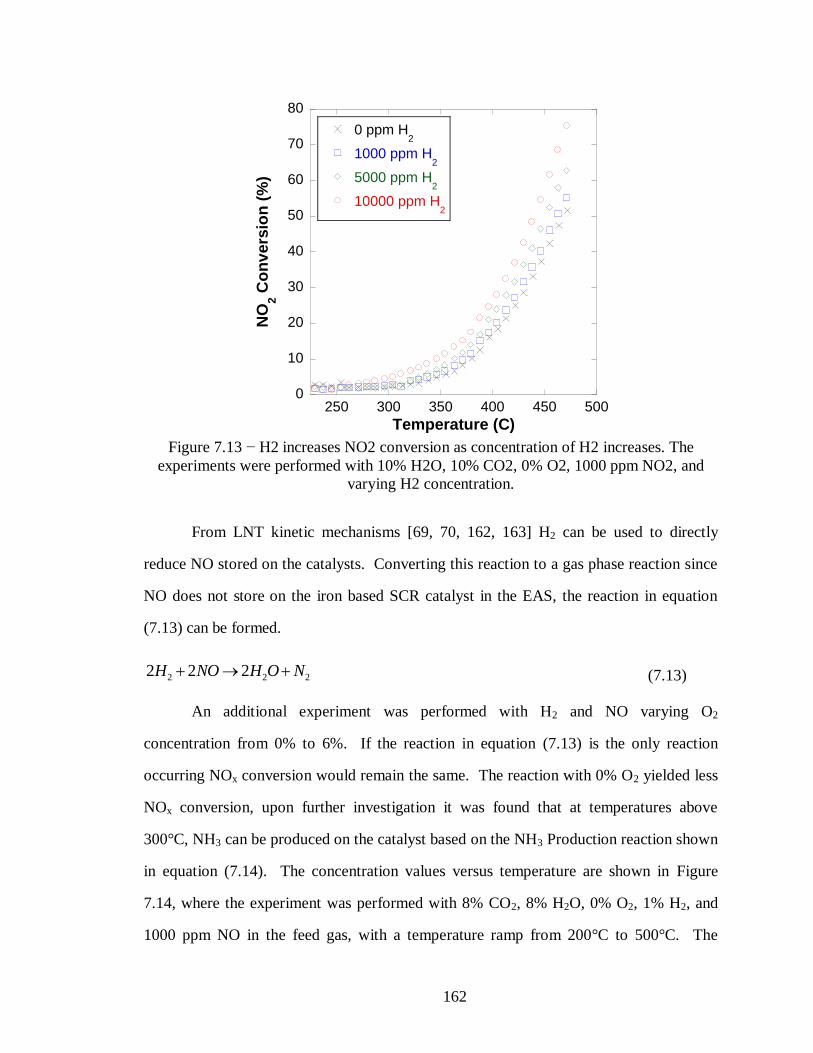
162
0
10
20
30
40
50
60
70
80
250 300 350 400 450 500
0 ppm H2
1000 ppm H2
5000 ppm H2
10000 ppm H2
NO
2 C
on
vers
ion
(%
)
Temperature (C)
Figure 7.13 − H2 increases NO2 conversion as concentration of H2 increases. The
experiments were performed with 10% H2O, 10% CO2, 0% O2, 1000 ppm NO2, and
varying H2 concentration.
From LNT kinetic mechanisms [69, 70, 162, 163] H2 can be used to directly
reduce NO stored on the catalysts. Converting this reaction to a gas phase reaction since
NO does not store on the iron based SCR catalyst in the EAS, the reaction in equation
(7.13) can be formed.
2 2 22 2 2H NO H O N (7.13)
An additional experiment was performed with H2 and NO varying O2
concentration from 0% to 6%. If the reaction in equation (7.13) is the only reaction
occurring NOx conversion would remain the same. The reaction with 0% O2 yielded less
NOx conversion, upon further investigation it was found that at temperatures above
300°C, NH3 can be produced on the catalyst based on the NH3 Production reaction shown
in equation (7.14). The concentration values versus temperature are shown in Figure
7.14, where the experiment was performed with 8% CO2, 8% H2O, 0% O2, 1% H2, and
1000 ppm NO in the feed gas, with a temperature ramp from 200°C to 500°C. The

163
production of NH3 on the catalyst would allow for two pathways for NO conversion on
the SCR catalyst. The first pathway titled the “Rich Standard SCR” reaction shown in
equation (7.15) yields little conversion in literature surveys, while the second reaction
shown in equation (7.16) is titled the “Standard SCR Reaction” where the addition of O2
creates a preferred pathway to NOx reduction [45, 47, 48, 129] as also seen in Chapter 3.
The conversion of NO for both the Rich Standard SCR reaction and Standard SCR
reaction were corroborated for this catalyst in experiments performed in Chapter 3.
2 3 25 2 2 2H NO NH H O (7.14)
3 2 24 6 5 6NH NO N H O (7.15)
3 2 2 24 4 4 6NH NO O N H O (7.16)
0
200
400
600
800
1000
1200
250 300 350 400 450 500
NO
NO2
N2O
NH3
Co
nce
ntr
ati
on
(p
pm
)
Temperature (C)
Figure 7.14 − H2 and NO will combine to form NH3, which can be used in NOx
conversion. The experiment was performed with 8% H2O, 8% CO2, 0% O2, 1000 ppm
NO2, and 1% H2.
When examining the H2 NO experiment with 6% O2, no NH3 formation was seen,
therefore it can be assumed that any NH3 formed would then react with NO and O2 to

164
convert the NO to N2. By comparing the NO conversion to NH3 for the 0% O2
experiment to the NOx conversion of 6% O2 experiment in Figure 7.15, it can be seen that
the NH3 produced accounts for the increase not seen in the NOx conversion experiments
with CO. Therefore it can be assumed that the preferred pathway is H2 will preferentially
react with NO2 to form NO and H2O (equation (7.12)). H2 will then react with NO to
form small amounts of NH3 on the catalyst (equation (7.14)) which will then react with
NO and NO2 according to the NOx reduction with NH3 reactions discussed in Chapter 3.
0
5
10
15
20
200 250 300 350 400 450 500
NOx Conversion (6% O2)
NO Conversion to NH3 (0% O
2)
NO
x C
on
vers
ion
(%
)
Temperature (C)
Figure 7.15 − Up to 5% of the NO will combine with H2 to form NH3. The experiment
was performed with 8% H2O, 8% CO2, 0% O2, 1000 ppm NO2, and 1% H2.
7.3.3 C3H6 NOx Reduction
As discussed earlier propylene (C3H6) is used in the feed gas as surrogate for any
fuel that is not converted to H2 and CO in the fuel reformer based on work by Kuo et al.
[155]. It has been observed that C3H6 will react with both NO and NO2. In Figure 7.16
it can be seen that C3H6 will remove small amounts of NO. This reaction is a strong

165
function of C3H6 concentration and reaches a maximum conversion of 10% when 0.6%
C3H6 is in the feed gas. The proposed reaction for C3H6 and NO is shown in (7.17).
3 6 2 2 29 3 3 4.5C H NO CO H O N (7.17)
0
20
40
60
80
100
200 250 300 350 400 450 500
1000 ppm NO, 100 ppm C3H
6
1000 ppm NO, 6000 ppm C3H
6
NO
x C
on
vers
ion
(%
)
Temperature (C)
Figure 7.16 – The conversion of NO by C3H6 is low and highly dependent on the amount
of C3H6 in the feed gas. The experiments were performed as a temperature ramp with 8%
H2O, 8% CO2, 6% O2, 1000 ppm NO, and varying C3H6 concentrations.
From Figure 7.17 it can be seen that propylene strongly converts NO2, and as the
concentration of propylene increases NO2 is completely converted. Figure 7.18 shows
that NOx conversion is the highest at low temperatures and decreases as temperature
increases. It can also be seen in Figure 7.18 that NOx conversion increases as C3H6
concentration increases.
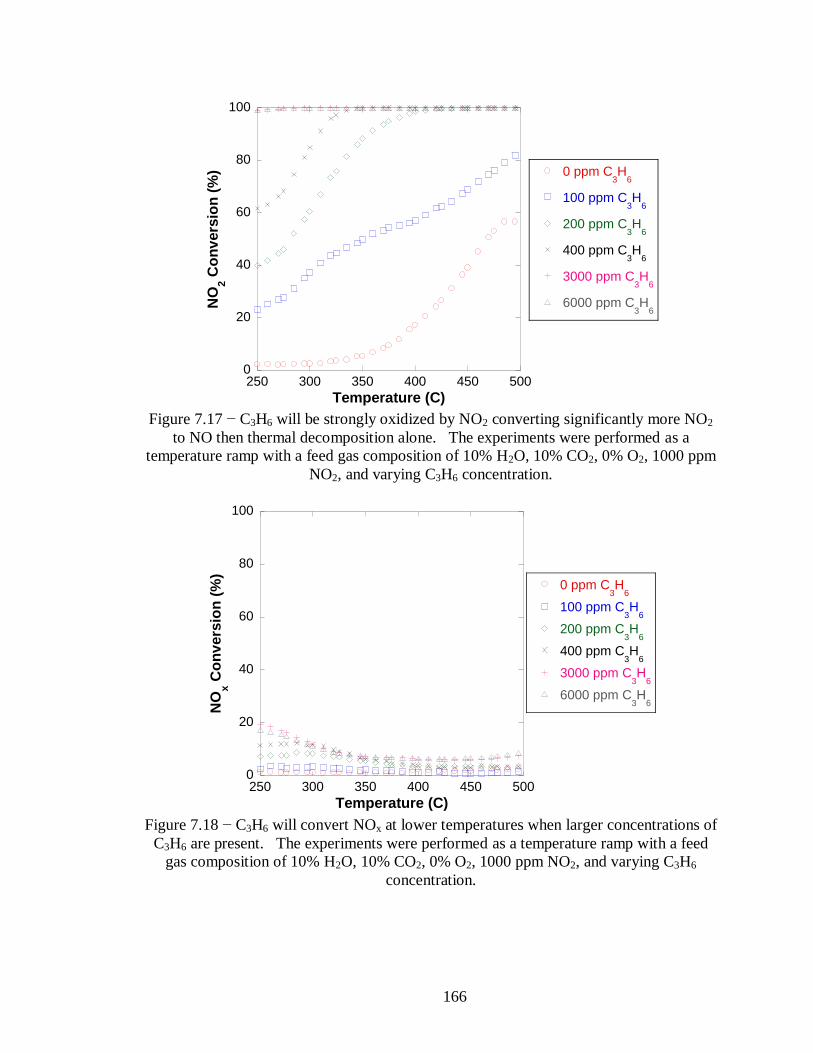
166
0
20
40
60
80
100
250 300 350 400 450 500
0 ppm C3H
6
100 ppm C3H
6
200 ppm C3H
6
400 ppm C3H
6
3000 ppm C3H
6
6000 ppm C3H
6
NO
2 C
on
vers
ion
(%
)
Temperature (C) Figure 7.17 − C3H6 will be strongly oxidized by NO2 converting significantly more NO2
to NO then thermal decomposition alone. The experiments were performed as a
temperature ramp with a feed gas composition of 10% H2O, 10% CO2, 0% O2, 1000 ppm
NO2, and varying C3H6 concentration.
0
20
40
60
80
100
250 300 350 400 450 500
0 ppm C3H
6
100 ppm C3H
6
200 ppm C3H
6
400 ppm C3H
6
3000 ppm C3H
6
6000 ppm C3H
6
NO
x C
on
vers
ion
(%
)
Temperature (C)
Figure 7.18 − C3H6 will convert NOx at lower temperatures when larger concentrations of
C3H6 are present. The experiments were performed as a temperature ramp with a feed
gas composition of 10% H2O, 10% CO2, 0% O2, 1000 ppm NO2, and varying C3H6
concentration.

167
From Figure 7.19 it can be seen that high levels of C3H6 will completely remove
NO2 across the catalyst. Also in Figure 7.19 it can be seen that the NO2 conversion to
NO accounts for most of the NO2 conversion leading to the reaction shown in equation
(7.18) as the dominant reaction for C3H6 and NO2.
3 6 2 2 29 3 3 9C H NO CO H O NO (7.18)
0
20
40
60
80
100
200 250 300 350 400 450 500
NO2 Conversion
NO2 Conversion to NO
NOx Conversion
Co
nv
ers
ion
(%
)
Temperature (C)
Figure 7.19 − C3H6 is the most reactive species with NO2, where most NO2 will be
converted to NO. The experiments is performed as a temperature ramp with a feed gas
composition of 10% H2O, 10% CO2, 0% O2, 1000 ppm NO2, and 0.6% C3H6.
Figure 7.20 shows the concentration values vs. temperature for two experiments
performed as temperature ramps with 1000 ppm NO2 and with varying C3H6
concentrations. Due to high levels of H2O and CO2 in the feed gas the conversion of
C3H6 to CO2 and H2O could not be measured, however a noticeable rise in CO
concentration has been seen as temperature increases for both experiments. This leads to
the possible inclusion of the steam reforming reaction shown in equation (7.19).
3 6 2 23 3 6C H H O CO H (7.19)

168
H2 values were negligible during the experiments shown in Figure 7.20. It was
determined previously that H2 reactions with NO and NO2 are small. Therefore it can be
determined that the reactions with C3H6 are not likely to occur due to steam reforming
reaction (equation (7.19)) , but are more likely to occur as a reaction where C3H6 is
oxidized by NO2 that does not yield complete conversion to CO2 as shown in equation
(7.20).
3 6 2 26 3 3 6C H NO CO H O NO (7.20)
0
200
400
600
800
1000
1200
200 250 300 350 400 450 500
NO (6000 ppm C3H
6)
NO2 (6000 ppm C
3H
6)
CO (6000 ppm C3H
6)
NO (100 ppm C3H
6)
NO2 (100 ppm C
3H
6)
CO (100 ppm C3H
6)
Co
nce
ntr
ati
on
(p
pm
)
Temperature (C)
Figure 7.20 – C3H6 and NO2 will react to form CO; however the concentration does not
increase as C3H6 concentration increases. The experiments were performed as a
temperature ramp with 6% H2O, 6% CO2, 1000 ppm NO2, and varying C3H6
concentration in the feed gas.
Figure 7.21 compares the NOx conversions with C3H6 for a feed gas with a NOx
composition of all NO (Figure 7.16) and a feed gas with a NOx composition of all NO2
(Figure 7.18). At high temperatures C3H6 will react with NO2 to form NO as shown in

169
equation (7.20), therefore NOx conversion at high temperatures is similar for both
experiments. At low temperatures however NOx conversion is much higher when the
NOx composition is all NO2. From Figure 7.20 it can be seen that CO concentration is
low in the low temperature range. It can then be theorized that the direct reduction of
NO2 with C3H6 reaction shown in equation (7.21) can capture this effect.
3 6 2 2 2 22 18 6 6 9C H NO CO H O N (7.21)
0
20
40
60
80
100
200 250 300 350 400 450 500
1000 ppm NO, 6000 ppm C3H
6
1000 ppm NO2, 6000 ppm C
3H
6
NO
x C
on
vers
ion
(%
)
Temperature (C)
Figure 7.21 – NOx conversion with C3H6 is higher at low temperatures when the NOx
composition is all NO2 in the feed gas, but as temperature increases NOx conversion
converges for a NOx composition of all NO in the feed gas with the experiment with a
NOx composition of all NO2 in the feed gas.
7.4 NH3 Storage Effects with H2, CO, and C3H6
When performing a regeneration of the LNT it is common for a small portion of
the fuel to remain unconverted into H2 and CO in the fuel reformer. The reductants can
in turn slip through the LNT into the feed gas of the SCR. Because this is when NH3 will
be generated by the LNT and then stored on the SCR catalyst it is important to test their
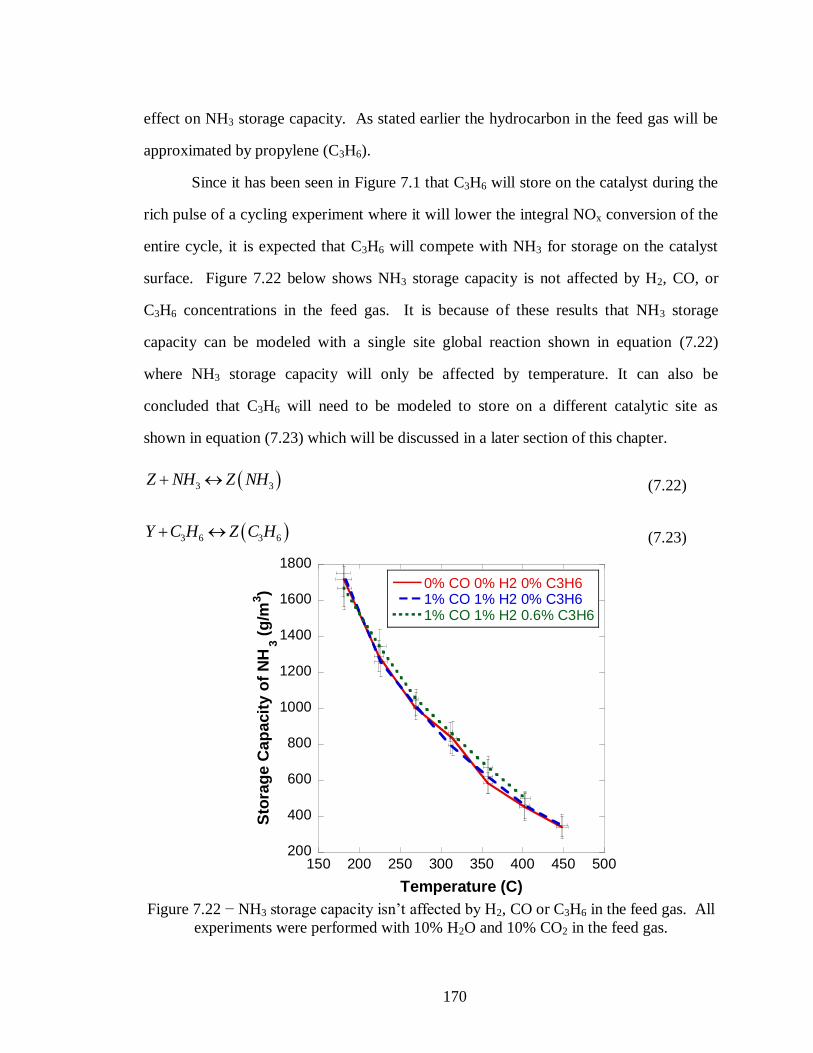
170
effect on NH3 storage capacity. As stated earlier the hydrocarbon in the feed gas will be
approximated by propylene (C3H6).
Since it has been seen in Figure 7.1 that C3H6 will store on the catalyst during the
rich pulse of a cycling experiment where it will lower the integral NOx conversion of the
entire cycle, it is expected that C3H6 will compete with NH3 for storage on the catalyst
surface. Figure 7.22 below shows NH3 storage capacity is not affected by H2, CO, or
C3H6 concentrations in the feed gas. It is because of these results that NH3 storage
capacity can be modeled with a single site global reaction shown in equation (7.22)
where NH3 storage capacity will only be affected by temperature. It can also be
concluded that C3H6 will need to be modeled to store on a different catalytic site as
shown in equation (7.23) which will be discussed in a later section of this chapter.
3 3Z NH Z NH (7.22)
3 6 3 6Y C H Z C H (7.23)
200
400
600
800
1000
1200
1400
1600
1800
150 200 250 300 350 400 450 500
0% CO 0% H2 0% C3H61% CO 1% H2 0% C3H61% CO 1% H2 0.6% C3H6
Sto
rag
e C
ap
acit
y o
f N
H3 (
g/m
3)
Temperature (C)
Figure 7.22 − NH3 storage capacity isn’t affected by H2, CO or C3H6 in the feed gas. All
experiments were performed with 10% H2O and 10% CO2 in the feed gas.

171
7.5 NH3 Oxidation Effects with H2, CO, and C3H6
To account for any slip of reductant from the LNT in a LNT-SCR aftertreatment
system, further NH3 oxidation experiments were performed with H2, CO, and C3H6 in the
feed gas. From the results shown in Figure 7.23, it can be seen that the addition of H2
and CO to the feed gas will not affect the conversion of NH3 due to oxidation. However,
it can also be seen that when C3H6 is present the conversion of NH3 due to oxidation will
strongly increase. It can be theorized this is due to additional hydroxyl formation from
the oxidation of C3H6.
0
20
40
60
80
100
200 250 300 350 400 450 500
0% CO, 0% H2, 0.0% C
3H
6
1% CO, 1% H2, 0.0% C
3H
6
1% CO, 1% H2, 0.6% C
3H
6
NH
3 C
on
ve
rsio
n (
%)
Temperature (C)
Figure 7.23 – H2 and CO in the feed gas do not influence the conversion of NH3 due to
oxidation, however the addition of C3H6 strongly increases the conversion of NH3 due to
oxidation. All experiments were performed with a feed gas concentration of 8% H2O, 8%
CO2, 6% O2, and 1000 ppm NH3.
Since adding hydroxyl molecules would increase the number of reactions
necessary to create a kinetic mechanism for the SCR catalyst, equation (7.24) is proposed
as global reaction where NH3 is oxidized in the presence of C3H6. C3H6 will still be
oxidized as a combination of the reactions shown in equations (7.4) and (7.5).

172
3 3 6 2 2 3 6 22 6 6Z NH C H O N C H H O (7.24)
3 6 2 2 2
93 3
2C H O CO H O (7.4)
3 6 2 23 3 3C H O CO H O (7.5)
7.6 NOx Reduction with NH3 Effects with H2, CO, and C3H6
The three main NOx reduction pathways for NOx reduction with NH3 are shown
in equations (7.25), (7.26), and (7.27). It was observed that reactions with H2, CO, and
C3H6 and NO were much smaller than H2, CO, and C3H6 and NO2 reactions. Therefore,
it is proposed the H2, CO, and C3H6 will effect NOx conversion with NH3 by affecting the
NO to NOx ratio at the catalyst which has been demonstrated as an important
characteristic in NOx reduction with NH3 predictions as seen in Figure 3.18.
3 2 2 24 4 4 4 6Z NH NO O Z N H O (7.25)
3 2 2 22 2 2 3Z NH NO NO Z N H O (7.26)
3 2 2 28 6 8 7 12Z NH NO Z N H O (7.27)
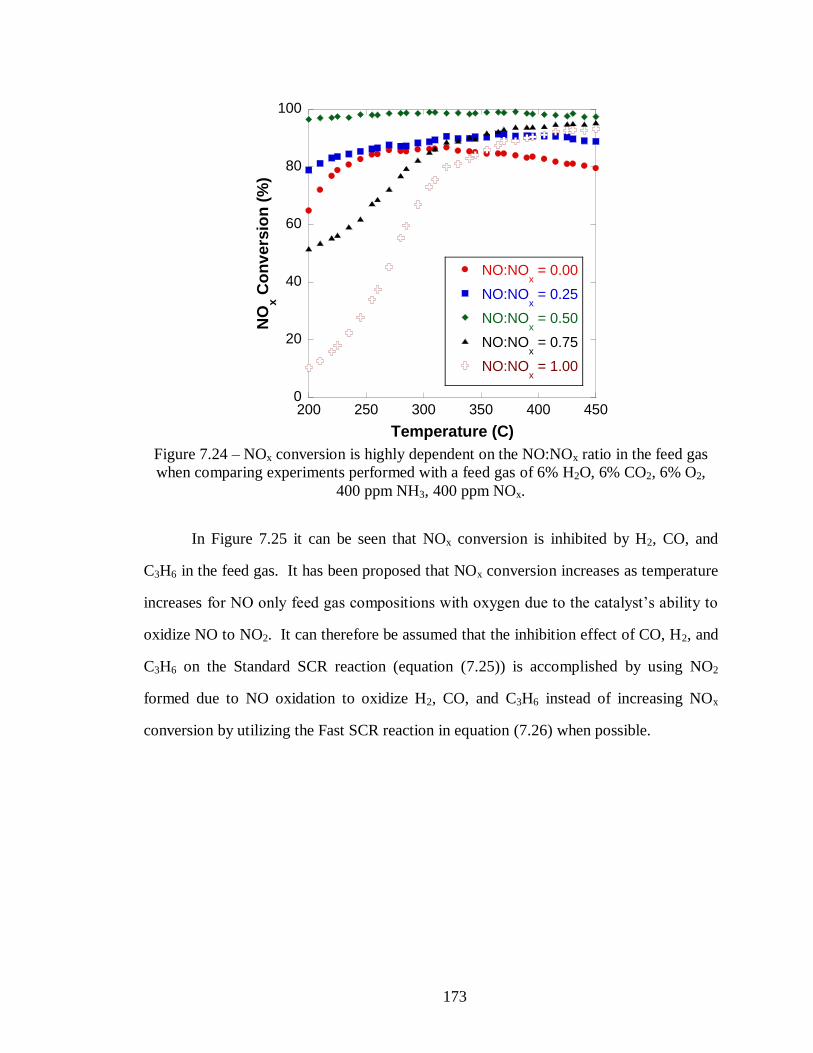
173
0
20
40
60
80
100
200 250 300 350 400 450
NO:NOx = 0.00
NO:NOx = 0.25
NO:NOx = 0.50
NO:NOx = 0.75
NO:NOx = 1.00
NO
x C
on
vers
ion
(%
)
Temperature (C)
Figure 7.24 – NOx conversion is highly dependent on the NO:NOx ratio in the feed gas
when comparing experiments performed with a feed gas of 6% H2O, 6% CO2, 6% O2,
400 ppm NH3, 400 ppm NOx.
In Figure 7.25 it can be seen that NOx conversion is inhibited by H2, CO, and
C3H6 in the feed gas. It has been proposed that NOx conversion increases as temperature
increases for NO only feed gas compositions with oxygen due to the catalyst’s ability to
oxidize NO to NO2. It can therefore be assumed that the inhibition effect of CO, H2, and
C3H6 on the Standard SCR reaction (equation (7.25)) is accomplished by using NO2
formed due to NO oxidation to oxidize H2, CO, and C3H6 instead of increasing NOx
conversion by utilizing the Fast SCR reaction in equation (7.26) when possible.

174
0
20
40
60
80
100
200 250 300 350 400 450
0% CO, 0% H2, 0% C
3H
6
1% CO, 1% H2, 0% C
3H
6
1% CO, 1% H2, 0.6% C
3H
6
NO
x C
on
ve
rsio
n (
%)
Temperature (C)
Figure 7.25 − NOx conversion is strongly affected at high temperatures when H2, CO, and
C3H6 are in the feed gas. All experiments are performed with 6% H2O, 6% CO2, 6% O2,
1000 ppm NH3, and 1000 ppm NO in the feed gas.
Similarly it can be seen in Figure 7.26 that H2 and CO will not have an effect on
the equal molar ratio of NO and NO2 due to the preference for its reaction with NH3. It
has also been observed that due to the strong reaction with C3H6 and NO2, the NO2
reduction to NO will drastically decrease the NOx conversion capabilities when present in
steady state reactions.

175
0
20
40
60
80
100
200 250 300 350 400 450 500
0% H2, 0% CO, 0% C
3H
6
1% H2, 1% CO, 0% C
3H
6
1% H2, 1% CO, 0.6% C
3H
6
NO
x C
on
ve
rsio
n (
%)
Temperature (C)
Figure 7.26 − NOx conversion is strongly affected as temperature increases when H2, CO,
and C3H6 are in the feed gas. All experiments are performed with 6% H2O, 6% CO2, 0%
O2, 1000 ppm NH3, 500 ppm NO, and 500 ppm NO2 in the feed gas.
It can seen be from the experiments in Figure 7.25 and Figure 7.26 that an all NO2
feed gas flow could achieve some benefits of having H2, CO, and C3H6 in the feed gas
due to favorable conversion of NO2 to NO yielding a more ideal equal molar mixture. In
Figure 7.27 it can be seen that H2 and CO increase NOx conversion as temperature
increases due to their ability to convert more NO2 to NO increasing the role of the Fast
SCR reaction (equation (7.26)) . It can also be seen that the addition of C3H6 strongly
increases NOx conversion with NH3 at low temperatures but strongly inhibits NOx
conversion at higher temperatures due to higher conversion of NO2 to NO while
decreasing amount of NH3 on the catalyst.

176
0
20
40
60
80
100
200 250 300 350 400 450 500
0% H2, 0% CO, 0% C
3H
6
1% H2, 1% CO, 0% C
3H
6
1% H2, 1% CO, 0.6% C
3H
6
NO
x C
on
ve
rsio
n (
%)
Temperature (C)
Figure 7.27 − NOx conversion is affected by H2, CO, and C3H6 by converting NO2 to NO
which can increase NOx conversion by favoring the Fast SCR reaction when the NO to
NOx ratio favors NO2. All experiments are performed with 6%H2O, 6% CO2, 0% O2,
1000 ppm NH3, and 1000 ppm NO2 in the feed gas.
From Figure 7.25, Figure 7.26, and Figure 7.27 it has been observed that C3H6 is
the dominant inhibition species for a SCR catalyst by converting NO2 to NO on the
catalyst. It should be noted that similar results are seen when H2 and CO are in the
exhaust stream but to a lesser extent. It has also been determined that H2, CO, and C3H6
can increase NOx conversion when the NO to NOx ratio favors NO2.
Since HC poisoning can have a distinct effect during steady state operation,
cycling experiments were performed for the Standard and Fast SCR reactions as shown in
Figure 7.28. In Figure 7.28 it can be seen that H2 and CO in the rich pulse in a cycling
experiment have negligible effects on cycling experiments, while C3H6 in the rich pulse
will strongly inhibit integral NOx conversion. It can be determined that C3H6 will store
with NH3 on the catalyst during a rich pulse and then react with NOx during the lean
pulse as seen in Figure 7.28.

177
(a)
0
20
40
60
80
100
200 250 300 350 400 450
H2 = 0%, CO = 0%, C
3H
6 = 0.0%
H2 = 1%, CO = 1%, C
3H
6 = 0.0%
H2 = 1%, CO = 1%, C
3H
6 = 0.6%
Inte
gra
l N
Ox C
on
ve
rsio
n (
%)
Temperature (C) (b)
0
20
40
60
80
100
200 250 300 350 400 450
H2 = 0%, CO = 0%, C
3H
6 = 0.0%
H2 = 1%, CO = 1%, C
3H
6 = 0.0%
H2 = 1%, CO = 1%, C
3H
6 = 0.6%
Inte
gra
l N
Ox C
on
ve
rsio
n (
%)
Temperature (C)
Figure 7.28 − Integral NOx conversion is changes are negligible when H2 and CO are in
the rich pulse, while C3H6 present will decrease the integral NOx conversion when
present in the rich pulse. All experiments are performed with a rich pulse of 8% H2O,
8% CO2, 1000 ppm NH3; and a lean pulse of 8% H2O, 8% CO2, 150 ppm NOx, with (a)
NO:NOx = 1.0 and (b) NO:NOx = 0.5.
7.7 C3H6 Poisoning
When running experiments with high levels of C3H6, coking or carbon deposits
sticking to the catalyst became obvious as shown in Figure 7.29. Once coking was
observed that catalyst was cleaned at 500°C with O2 and NO2 for 10 minutes until the
original color of the catalyst returned. It was observed through repeated tests that this did
not change catalyst activity once cleaned. This effect has been studied by Montreuil and
Lambert where a formulation is used to reduce the poisoning effects of hydrocarbons on
SCR catalysts [166]. The ability for C3H6 to store on the SCR catalyst during the rich
pulse of a cycling experiment, where it will reduce the integral NOx conversion of the
catalyst throughout the cycle was shown in Figure 7.28. Due to this poisoning effect and
the evidence that C3H6 will store on the catalyst this section is dedicated to quantifying
the storage capabilities of C3H6 on the SCR catalyst.

178
(a) (b)
Figure 7.29 – Shows an example of (a) catalyst during normal operation, and (b) a
catalyst that has been gone through coking after experiments with high levels of C3H6.
7.7.1 Temperature Programmed Desorption with C3H6
A Temperature Programmed Desorption (TPD) experiment, similar to the
experiments performed for NH3 storage in Chapter 3, was performed with C3H6 to test for
the storage capacity of C3H6 on the SCR catalyst. From the TPD experiment shown in
Figure 7.30 a negligible amount of C3H6 is stored on the catalyst. However, as
previously as seen in Figure 7.28 the integral NOx conversion decreased when C3H6 was
present in the rich pulse of the feed gas into the SCR catalyst.

179
0
50
100
150
200
250
300
350
400
0 1000 2000 3000 4000 5000 6000
Inlet C3H
6
Outlet C3H
6
Temperature (C)
Co
nc
en
trati
on
(p
pm
) o
r T
em
pera
ture
(C
)
Time (s)
Storage
Area
Figure 7.30 − C3H6 storage is low when finding storage capacity with a Temperature
Programmed Desorption (TPD) experiment. The experiment was performed with a feed
gas of 10% H2O, 10% CO2, and 350 ppm C3H6.
7.7.2 C3H6 / NO2 Lean Rich Switching Experiments
Since storage could not be found using a TPD experiment, a new experiment is
designed to calculate the storage capacity of C3H6. These experiments operate by holding
temperature constant, then flow a feed gas through the catalyst of 1000 ppm NO2 and 8%
H2O to find the thermal decomposition of NO2 at the catalyst temperature. Three cycles
are then performed with a rich pulse containing 8% H2O and 0.6% C3H6 for 2 minutes
followed by an 8 minute pulse of 8% H2O and 1000 ppm NO2. The results for each
temperature are seen in Figure 7.31.
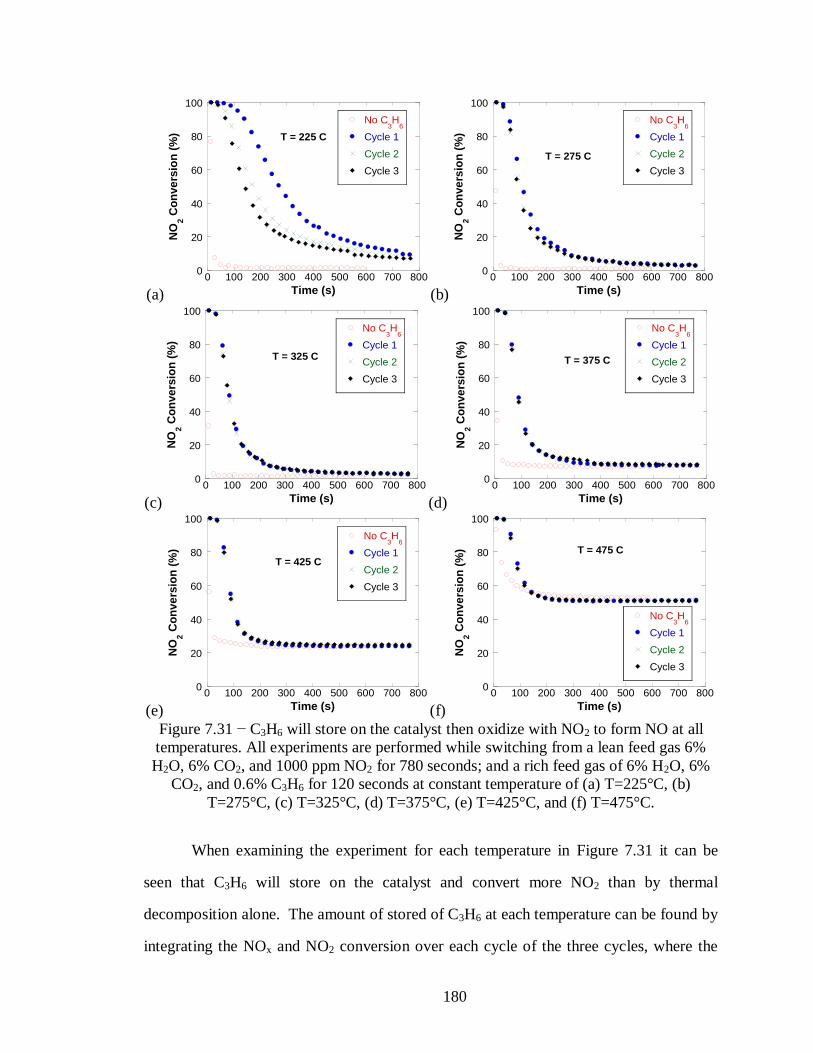
180
(a)
0
20
40
60
80
100
0 100 200 300 400 500 600 700 800
T = 225 C
No C3H
6
Cycle 1
Cycle 2
Cycle 3
NO
2 C
on
ve
rsio
n (
%)
Time (s) (b)
0
20
40
60
80
100
0 100 200 300 400 500 600 700 800
T = 275 C
No C3H
6
Cycle 1
Cycle 2
Cycle 3
NO
2 C
on
ve
rsio
n (
%)
Time (s)
(c)
0
20
40
60
80
100
0 100 200 300 400 500 600 700 800
T = 325 C
No C3H
6
Cycle 1
Cycle 2
Cycle 3
NO
2 C
on
ve
rsio
n (
%)
Time (s) (d)
0
20
40
60
80
100
0 100 200 300 400 500 600 700 800
T = 375 C
No C3H
6
Cycle 1
Cycle 2
Cycle 3
NO
2 C
on
ve
rsio
n (
%)
Time (s)
(e)
0
20
40
60
80
100
0 100 200 300 400 500 600 700 800
T = 425 C
No C3H
6
Cycle 1
Cycle 2
Cycle 3
NO
2 C
on
ve
rsio
n (
%)
Time (s) (f)
0
20
40
60
80
100
0 100 200 300 400 500 600 700 800
T = 475 C
No C3H
6
Cycle 1
Cycle 2
Cycle 3
NO
2 C
on
ve
rsio
n (
%)
Time (s)
Figure 7.31 − C3H6 will store on the catalyst then oxidize with NO2 to form NO at all
temperatures. All experiments are performed while switching from a lean feed gas 6%
H2O, 6% CO2, and 1000 ppm NO2 for 780 seconds; and a rich feed gas of 6% H2O, 6%
CO2, and 0.6% C3H6 for 120 seconds at constant temperature of (a) T=225°C, (b)
T=275°C, (c) T=325°C, (d) T=375°C, (e) T=425°C, and (f) T=475°C.
When examining the experiment for each temperature in Figure 7.31 it can be
seen that C3H6 will store on the catalyst and convert more NO2 than by thermal
decomposition alone. The amount of stored of C3H6 at each temperature can be found by
integrating the NOx and NO2 conversion over each cycle of the three cycles, where the

181
C3H6 storage capacity can be related to the average total moles of NOx converted
assuming that NO and NO2 storage on the catalyst is negligible as shown in Chapter 3.
To calculate the amount of stored C3H6 on the catalyst, it must be assumed that
total stored mass is small in proportion to the total flow. Once this assumption is made
the total molar flow rate ( N ) across the catalyst for each time step as shown in equation
(7.28) must be calculated first. The molar flow rate of each species ( iN ) can then be
calculated by multiplying the total molar flow rate by the mole fraction of species ( iy ) as
seen in equation (7.29). By integrating (7.29) for a given species over an entire rich lean
cycle in the feed gas total moles of species through the entire cycle ( iN ) can be
calculated as seen in equation (7.30). The integral NOx conversion for each cycle is
calculated using equation (7.31).
P VN
R T
(7.28)
i i
P VN y
R T
(7.29)
i i i
Cycle Cycle
P VN N dt y dt
R T
(7.30)
2 2
2
_ _ _ _
_ _
_ _
100x
NO IN NO IN NO OUT NO OUT
INT NO Conv
NO IN NO IN
N N N N
N N
(7.31)
When performing the switching experiments for C3H6 storage, it was found that
the average integral NOx conversion for all three cycles at each temperature is less than
5% as seen in Figure 7.32. Error is calculated as the standard deviation of the integral
NOx conversion for the three cycles.

182
0
5
10
15
20
250 300 350 400 450 500
Inte
gra
l N
Ox C
on
vers
ion
(%
)
Temperature (C)
Figure 7.32 − Stored C3H6 has negligible conversion of NO on the catalyst.
Since integral NOx conversion is small the integral NO2 conversion is calculated
using equation (7.32) for the thermal decomposition of NO2 at the beginning of each
temperature, and for the three rich lean cycles where additional NO2 is converted due to
stored C3H6. In Figure 7.33 a significant increase can be seen in NO2 conversion for the
rich lean cycling with C3H6. Due to the integral NOx conversion being low, the results
shown in Figure 7.33 further verify the results shown earlier that the preferential pathway
for C3H6 is to react with NO2 and form NO as shown in the reaction in equation (7.20).
2 2
2
_ _
_ _
_
100x
NO IN NO OUT
INT NO Conv
NO IN
N N
N
(7.32)
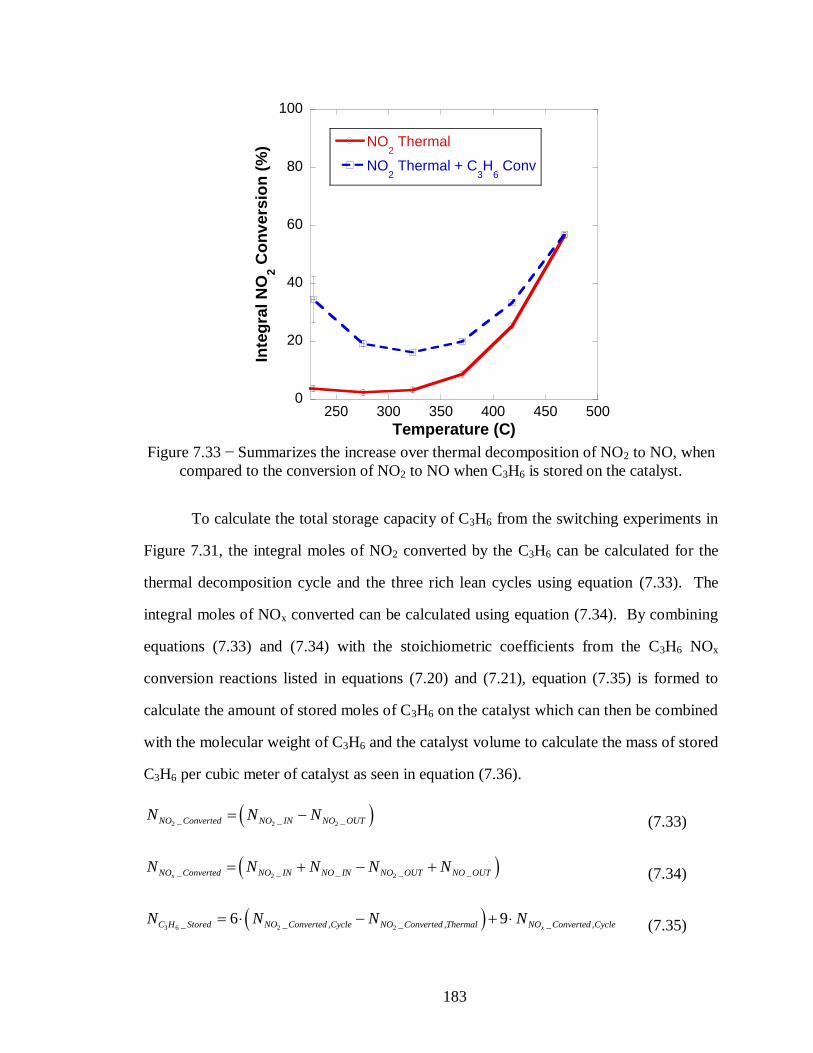
183
0
20
40
60
80
100
250 300 350 400 450 500
NO2 Thermal
NO2 Thermal + C
3H
6 Conv
Inte
gra
l N
O2 C
on
vers
ion
(%
)
Temperature (C)
Figure 7.33 − Summarizes the increase over thermal decomposition of NO2 to NO, when
compared to the conversion of NO2 to NO when C3H6 is stored on the catalyst.
To calculate the total storage capacity of C3H6 from the switching experiments in
Figure 7.31, the integral moles of NO2 converted by the C3H6 can be calculated for the
thermal decomposition cycle and the three rich lean cycles using equation (7.33). The
integral moles of NOx converted can be calculated using equation (7.34). By combining
equations (7.33) and (7.34) with the stoichiometric coefficients from the C3H6 NOx
conversion reactions listed in equations (7.20) and (7.21), equation (7.35) is formed to
calculate the amount of stored moles of C3H6 on the catalyst which can then be combined
with the molecular weight of C3H6 and the catalyst volume to calculate the mass of stored
C3H6 per cubic meter of catalyst as seen in equation (7.36).
2 2 2_ _ _NO Converted NO IN NO OUTN N N (7.33)
2 2_ _ _ _ _xNO Converted NO IN NO IN NO OUT NO OUTN N N N N (7.34)
3 6 2 2_ _ , _ , _ ,6 9
xC H Stored NO Converted Cycle NO Converted Thermal NO Converted CycleN N N N (7.35)

184
3 6 3 6
3 6
_
_
C H Stored C H
C H Stored
Cat
N MWm
V
(7.36)
The results for equation (7.36) are shown in Figure 7.34 where it can be seen that
the storage capacity of C3H6 reduces with temperature. The error in storage capacity is
calculated as the standard deviation of the three rich lean cycles from the experiments
shown in Figure 7.31. It should be noted that Amin et al. [167] found that NOx reduction
with C3H6 on a HC-SCR catalyst is low above 350°C is due to minimal storage of C3H6,
therefore it is possible that storage of C3H6 on the catalyst is in the form of
organonitrates, however the effect of strongly reducing NO2 to NO on the catalyst is still
the dominant effect in inhibiting the SCR NOx reduction process with NH3.
0
100
200
300
400
500
250 300 350 400 450 500
Stored C3H
6
Sto
red
C3H
6 (
g/m
3)
Temperature (C)
Figure 7.34 − Shows calculated values of C3H6 storage on the catalyst, calculated from
the experiments shown in Figure 7.31.
7.8 Modeling Approach
Table 7.1 shows the current proposed kinetic mechanism as defined from the
previous chapters.

185
Table 7.1 − Summary of chemical reaction and kinetic rates for lean SCR model with
new dependence of the surface coverage fraction of NH3 and H2O competition with NH3
for storage.
Chemical Reaction Kinetics Rate Form
(R1) 2 2
1
2NO O NO
1
2
21 1 exp
E
NORT
NO O
eq
yR k y y
K
(R2) 3 3Z NH Z NH
22 3
3 32 2 2 exp
rr Z NH
E
RT
f NH Z r Z NHR k y k
(R3) 3 2 2 24 3 4 2 6Z NH O Z N H O
3
*
3 ,333
2
3
*
,33
3 31.0
1 expexp
1 exp
Z NH
Z NH
Z NH
Z NH
E
RT
OR k y
(R4) 3 2 24 6 4 5 6Z NH NO Z N H O
4
34 4 exp
E
RT
NO Z NHR k y
(R5) 3 2 2 24 4 4 4 6Z NH NO O Z N H O
3
*
5 ,53
2
3
*
,53
5 51.0
1 expexp
1 exp
Z NH
Z NH
Z NH
Z NH
E
RT
NO OR k y y
(R6) 3 2 2 22 2 2 3Z NH NO NO Z N H O
3
*
6 ,53
2
3
*
,53
6 61.0
1 expexp
1 exp
Z NH
Z NH
Z NH
Z NH
E
RT
NO NOR k y y
(R7) 3 2 2 28 6 8 7 12Z NH NO Z N H O
3
*
7 ,73
2
3
*
,73
7 71.0
1 expexp
1 exp
Z NH
Z NH
Z NH
Z NH
E
RT
NOR k y
(R8) 3 2 2 2 22 2 2 3Z NH NO Z N N O H O
3
*
8 ,83
2
3
*
,83
8 81.0
1 expexp
1 exp
Z NH
Z NH
Z NH
Z NH
E
RT
NOR k y
(R9) 3 2 2 22 3 2 4 3Z NH N O Z N H O
9
2 39 9 exp
E
RT
N O Z NHR k y
(R10) 2 2Z H O Z H O
10 10
2 210 10 10exp exp
f rE E
RT RT
f H O Z r Z H OR k y k

186
From experimental results in this chapter, the following reactions are proposed in
Table 7.2 to account for the more dominant reactions. It should be noted that reactions
with CO, H2, or C3H6 and NO are ignored due to the low conversion of for each reaction.
The oxidation of CO and H2 are also ignored for the same reasons.
Table 7.2 − Summary of chemical reaction and kinetic rates for reactions determined
from effects on NO, NO2, O2, and NH3 from H2, CO, and C3H6.
Chemical Reaction Kinetics Rate Form
(R11) 3 6 3 6Y C H Y C H
11 11
3 6 3 611 11 11exp exp
f rE E
RT RT
f C H Y r Y C HR k y k
(R12) 3 6 2 26 3 3 9Y C H NO Y CO H O NO
12
2 3 612 12 exp
E
RT
NO Y C HR k y
(R13) 3 6 2 2 29 3 3 9Y C H NO Y CO H O NO
13
2 3 613 13 exp
E
RT
NO Y C HR k y
(R14)
3 3 6 2
3 6 2 2
4 3
2 6
Z NH Y C H O
Z Y C H N H O
14
14
2 3 6 314 14 exp
E
RT
O Y C H Z NHR k y
(R15) 3 6 2 22 6 2 6 6Y C H O Y CO H O
15
15
2 3 615 15 exp
E
RT
O Y C HR k y
(R16) 3 6 2 2 22 9 2 6 6Y C H O Y CO H O
16
16
2 3 616 16 exp
E
RT
O Y C HR k y
(R17) 2 2 2H NO H O NO 17
2 217 17 exp
E
RT
H NOR k y y
(R18) 2 2CO NO CO NO 18
218 18 exp
E
RT
CO NOR k y y
Table 7.3 is a compilation of Table 7.1 and Table 7.2 to highlight the entire
proposed kinetic mechanism. It should be noted that the dependence on the surface
coverage fraction of NH3 is defined in equation (7.37).
3
*
,3
33
*
,3
1.0
1 exp
1 exp
Z NH
Z NH i
Z NH
Z NH i
Z NHf
(7.37)

187
Table 7.3 − Summary of chemical reaction and kinetic rates for lean SCR model with
new dependence of the surface coverage fraction of NH3, H2O competition with NH3 for
storage, and reactions determined from effects on NO, NO2, O2, and NH3 from H2, CO,
and C3H6.
Chemical Reaction Kinetics Rate Form
(R1) 2 2
1
2NO O NO
1
2
21 1 exp
E
NORT
NO O
eq
yR k y y
K
(R2) 3 3Z NH Z NH
22 3
3 32 2 2 exp
rr Z NH
E
RT
f NH Z r Z NHR k y k
(R3) 3 2 2 24 3 4 2 6Z NH O Z N H O 3
3
2 33 3 exp
E
RT
O Z NHR k y f
(R4) 3 2 24 6 4 5 6Z NH NO Z N H O
4
34 4 exp
E
RT
NO Z NHR k y
(R5) 3 2 2 24 4 4 4 6Z NH NO O Z N H O
5
2 35 5 exp
E
RT
NO O Z NHR k y y f
(R6) 3 2 2 22 2 2 3Z NH NO NO Z N H O
6
2 36 6 exp
E
RT
NO NO Z NHR k y y f
(R7) 3 2 2 28 6 8 7 12Z NH NO Z N H O
7
2 37 7 exp
E
RT
NO Z NHR k y f
(R8) 3 2 2 2 22 2 2 3Z NH NO Z N N O H O
8
2 38 8 exp
E
RT
NO Z NHR k y f
(R9) 3 2 2 22 3 2 4 3Z NH N O Z N H O
9
2 39 9 exp
E
RT
N O Z NHR k y
(R10) 2 2Z H O Z H O
10 10
2 210 10 10exp exp
f rE E
RT RT
f H O Z r Z H OR k y k
(R11) 3 6 3 6Y C H Y C H
11 11
3 6 3 611 11 11exp exp
f rE E
RT RT
f C H Y r Y C HR k y k
(R12) 3 6 2 26 3 3 9Y C H NO Y CO H O NO
12
2 3 612 12 exp
E
RT
NO Y C HR k y
(R13) 3 6 2 2 29 3 3 9Y C H NO Y CO H O NO
13
2 3 613 13 exp
E
RT
NO Y C HR k y
(R14)
3 3 6 2
3 6 2 2
4 3
2 6
Z NH Y C H O
Z Y C H N H O
14
14
2 3 6 314 14 exp
E
RT
O Y C H Z NHR k y
(R15) 3 6 2 22 6 2 6 6Y C H O Y CO H O
15
15
2 3 615 15 exp
E
RT
O Y C HR k y
(R16) 3 6 2 2 22 9 2 6 6Y C H O Y CO H O
16
16
2 3 616 16 exp
E
RT
O Y C HR k y

188
(R17) 2 2 2H NO H O NO 17
2 217 17 exp
E
RT
H NOR k y y
(R18) 2 2CO NO CO NO 18
218 18 exp
E
RT
CO NOR k y y
7.9 Conclusions
It has been found from experimental results that the oxidation of H2 and CO are
negligible for the purpose of kinetic modeling. It is observed that there is no change in
CO, H2, CO2, and H2O concentrations due to water gas shift. It was observed that the
conversion of NO with H2 follows a pathway where NH3 is formed which then reduces
NO. It was observed that the conversion of NO with C3H6 reaches a maximum of 8%,
which is higher than the conversion of NO with CO or H2. However, due to the low
overall conversion values the reactions between NO and C3H6, H2, or CO can be
considered negligible for the purpose of kinetic modeling. It was also observed that CO,
H2, and C3H6 will increase the conversion of NO2 to NO over thermal decomposition. It
was observed that C3H6 is the most reactive with NO2, followed by H2, then CO. It was
observed that C3H6 will store on the catalyst during cycling experiments while H2 and CO
do not. It was observed that C3H6 does not compete with NH3 for catalytic sites, since
storage of C3H6 could not be determined from a TPD, a method to calculate the storage of
C3H6 has been proposed. It was observed that C3H6 will increase the conversion of NH3
due to oxidation, which is theorized as due to the increase in hydroxyl radicals created by
the oxidation of C3H6. It was found that CO, H2, and C3H6 effect NOx conversions with
NH3 by changing the NO to NOx ratio at the catalyst by utilizing their strong reactions
with NO2. This has proven beneficial when the NOx composition is all NO2, but CO, H2,
and C3H6 will inhibit NOx conversion when NOx composition favors NO. It was
observed that only C3H6 will inhibit NOx conversion in an equal molar NOx composition
due to the reactivity of the Fast SCR reaction. Lastly, proposed changes to the kinetic
mechanism are made and shown to capture all of the effects from this chapter.
189
CHAPTER 8
CONCLUSIONS
When performing steady-state experiments it was determined that modifications
to the literature SCR kinetic mechanisms are needed to account for oxygen dependence
from saturation. A modification to the kinetic reaction rates involving oxygen has been
proposed to account for the effect of oxygen saturation along with an experimental
method to determine the oxygen saturation dependence for each oxygen dependant
reaction. The oxygen saturation dependence on the standard SCR reaction (NO reduction
with NH3 in the presence of O2) has been determined have a strong dependence on
oxygen and temperature; therefore the proposed oxygen saturation kinetic rate form did
not increase the accuracy of the model.
Additional steady-state experiments have yielded modifications to the NO2
reduction with NH3 reaction pathways. It has been determined that the current two
reactions (Slow SCR reaction and N2O Production reaction) are important along with a
prominent third reaction of N2O reduction with NH3 needs to be added to the kinetic
mechanism.
From validation data it was determined that the proposed steady-state lean SCR
kinetic mechanisms from literature did not accurately predict catalyst behavior under rich
lean cycling conditions. It has been determined that the kinetic rate forms from literature
are inadequate due to their linear dependence on the surface coverage fraction of NH3

190
which will not capture the non-linear relationship between NOx conversion and the
amount of stored NH3 on the catalyst. A modification to the kinetic rate forms for the
prominent reactions involving stored NH3 has been proposed to account for the reservoir
effect of stored NH3 on the SCR catalyst.
Due to the switch from lean to rich exhaust from the regeneration of the LNT, the
effects of varying H2O and CO2 concentrations have been studied for the proposed lean
SCR reactions. It was found that H2O strongly affects the storage capacity of NH3 on the
SCR catalyst. The oxidation of NH3 was also determined to be effected by H2O
concentration; however it has been concluded that this is due to the reduction in the
amount of stored NH3 on the catalyst. It was found that H2O concentration does not
affect the other proposed reactions due to their high reaction rates. From these results an
additional reaction has been proposed to capture the effect of H2O on NH3 storage.
The affects of H2, CO, and C3H6 were studied to understand their roles in rich
exhaust conditions. Experimental results have allowed the water gas shift reaction, the
oxidations of H2 and CO, and reactions between NO and H2, CO, or C3H6 to be
disregarded. It was also determined that H2, CO, and C3H6 have no effect on NH3 storage
capacity of the catalyst. However, it was observed that H2, CO, and C3H6 have strong
reactions with NO2 yielding NO. It has been proposed to include a reaction for each
reductant with NO2 in the kinetic mechanism. It was determined that H2, CO, and C3H6
reactions with NO2 can inhibit NOx conversion on the SCR catalyst by affecting the NO
to NOx ratio at the catalyst. Since NOx reduction with NH3 favors an equal molar ratio of
NO and NO2, it was observed in a feed gas with an all NO2 NOx composition that H2,
CO, and C3H6 will increase NOx conversion due their reactions with NO2 to form NO. It
is proposed that all of the effects of CO, H2, and C3H6 on NOx reduction with NH3 can be
accounted for by adding NO2 reactions with CO, H2, and C3H6. It was also observed that
the oxidation of C3H6 will strongly increase the oxidation of NH3. Since reaction
intermediates could not be determined, a global reaction is proposed to account for the

191
increase in NH3 oxidation in the presence of C3H6. From cycling experiments it was
found that CO and H2 storage on the catalyst is negligible while C3H6 has been found to
store on the catalyst. Since C3H6 could not be determined with a TPD experiment a non-
traditional method to determine the storage of C3H6 has been used. From these results it
was found that C3H6 stores on the catalyst but not on the same catalytic sites as NH3,
therefore a new catalytic storage site is used to account for all reaction involving C3H6.
The above conclusions are made based on experimental and simulation results
shown in this document. The pertinent chemical reactions and suggested kinetic rates
from this document are shown in Table 8.1. It should be noted that the reactions shown
in (R1) – (R8) are commonly used in kinetic mechanisms for NH3 SCR catalysts for
steady-state operation, while reaction (R9) – (R18) are added to account for observed
experimental effects. Additionally the kinetic rate forms for reaction dependant on stored
NH3 as shown in (R3), (R5), (R6), (R7), and (R8) have been changed to account for the
determined non-linear effects of stored NH3 on NOx conversion
Table 8.1 − Summary of chemical reaction and kinetic rates for lean SCR model with
new dependence of the surface coverage fraction of NH3, H2O competition with NH3 for
storage, and reactions determined from effects on NO, NO2, O2, and NH3 from H2, CO,
and C3H6.
Chemical Reaction Kinetics Rate Form
(R1) 2 2
1
2NO O NO
1
2
21 1 exp
E
NORT
NO O
eq
yR k y y
K
(R2) 3 3Z NH Z NH
22 3
3 32 2 2 exp
rr Z NH
E
RT
f NH Z r Z NHR k y k
(R3) 3 2 2 24 3 4 2 6Z NH O Z N H O 3
3
2 33 3 exp
E
RT
O Z NHR k y f
(R4) 3 2 24 6 4 5 6Z NH NO Z N H O
4
34 4 exp
E
RT
NO Z NHR k y
(R5) 3 2 2 24 4 4 4 6Z NH NO O Z N H O
5
2 35 5 exp
E
RT
NO O Z NHR k y y f
(R6) 3 2 2 22 2 2 3Z NH NO NO Z N H O
6
2 36 6 exp
E
RT
NO NO Z NHR k y y f

192
(R7) 3 2 2 28 6 8 7 12Z NH NO Z N H O
7
2 37 7 exp
E
RT
NO Z NHR k y f
(R8) 3 2 2 2 22 2 2 3Z NH NO Z N N O H O
8
2 38 8 exp
E
RT
NO Z NHR k y f
(R9) 3 2 2 22 3 2 4 3Z NH N O Z N H O
9
2 39 9 exp
E
RT
N O Z NHR k y
(R10) 2 2Z H O Z H O
10 10
2 210 10 10exp exp
f rE E
RT RT
f H O Z r Z H OR k y k
(R11) 3 6 3 6Y C H Y C H
11 11
3 6 3 611 11 11exp exp
f rE E
RT RT
f C H Y r Y C HR k y k
(R12) 3 6 2 26 3 3 9Y C H NO Y CO H O NO
12
2 3 612 12 exp
E
RT
NO Y C HR k y
(R13) 3 6 2 2 29 3 3 9Y C H NO Y CO H O NO
13
2 3 613 13 exp
E
RT
NO Y C HR k y
(R14)
3 3 6 2
3 6 2 2
4 3
2 6
Z NH Y C H O
Z Y C H N H O
14
14
2 3 6 314 14 exp
E
RT
O Y C H Z NHR k y
(R15) 3 6 2 22 6 2 6 6Y C H O Y CO H O
15
15
2 3 615 15 exp
E
RT
O Y C HR k y
(R16) 3 6 2 2 22 9 2 6 6Y C H O Y CO H O
16
16
2 3 616 16 exp
E
RT
O Y C HR k y
(R17) 2 2 2H NO H O NO 17
2 217 17 exp
E
RT
H NOR k y y
(R18) 2 2CO NO CO NO 18
218 18 exp
E
RT
CO NOR k y y
Where:
3
*
,3
33
*
,3
1.0
1 exp
1 exp
Z NH
Z NH i
Z NH
Z NH i
Z NHf
8.1 NO Oxidation Summary
It has been determined that the oxidation of NO to NO2 is a reversible reaction
with NO2 experiencing thermal decomposition due to equilibrium at temperatures above
300°C. It was also determined that the oxidation of NO to NO2 is dependent on O2
193
concentration by a half order effect. Additionally, it was determined that O2 concentration
has negligible effects on NO2 thermal decomposition to NO and O2. It was observed that
a feed gas that includes H2O and CO2 will inhibit the oxidation of NO to NO2 as well as
the thermal decomposition of NO2 to NO and O2. However, this effect is negligible in
the expected concentration range of the EAS. It was confirmed that NO2 adsorption is
small with any adsorbed NO2 thermally decomposing to NO making NO2 adsorption
negligible for kinetic modeling of the NO oxidation reaction. Since it was found that
H2O, NO, NO2 and O2 do not inhibit the oxidation of NO to NO2 in the forward or
reverse directions the kinetic rate shown for (R1) was determined to be sufficient.
8.2 Oxidation of H2, CO, and C3H6, and WGS
It has been found from experimental results that the oxidation of H2 and CO are
negligible for the purpose of kinetic modeling. It was determined that up to 40% of C3H6
can be converted due to oxidation. It was observed during these experiments that the
oxidation of C3H6 occurs through two pathways. The first is the formation of complete
combustion products CO2 and H2O (R16), while the second leads to the formation of CO
and H2O (R15). It was determined that since at low concentrations large amounts of CO
are still formed therefore the CO pathway (R15) is the more dominant pathway. It was
also observed that there is no change in CO, H2, CO2, and H2O concentrations due to
water gas shift.
8.3 Effect of H2, CO and C3H6 on NO and NO2
It was observed that the conversion of NO with H2 follows a pathway where NH3
is formed which then reduces NO. However, it was observed that the conversion of NO
with C3H6 reaches a maximum of 8%, which is higher than the conversion of NO with
CO or H2. Due to the low overall conversion values the reactions between NO and C3H6,
194
H2, or CO can be considered negligible for the purpose of kinetic modeling. It was also
observed that CO, H2, and C3H6 will increase the conversion of NO2 to NO over thermal
decomposition. It was observed that C3H6 is the most reactive with NO2, followed by H2,
then CO which are added to kinetic mechanism as shown in (R12), (R13), (R17), and
(R18). It was also observed that C3H6 will store on the catalyst during cycling
experiments while H2 and CO do not. An experimental method to determine the storage
capacity of C3H6 has been determined.
8.4 NH3 Storage Summary
It has been determined that a single site global approximation can be used to
model the storage of NH3 (R2) due to the presence of a single desorption peak in TPD
experiments with NH3. It was also determined that using a kinetic rate based on a
Tempkin isotherm increased accuracy for the ammonia storage reaction. It was
determined experimentally that as exhaust gas becomes rich and H2O and CO2
concentrations increase, the storage capacity of NH3 on the SCR catalyst decreases. This
is important for LNT-SCR combination systems where the exhaust stream concentrations
can vary from 6% H2O/CO2 to 12% H2O/CO2. The decrease in storage capacity of NH3
is larger between 0 – 6% H2O/CO2 than between 6 – 10% H2O/CO2, which means that if
engine conditions were held fairly constant, such as during lean engine operation with
only an SCR system, the H2O competition (R10) effect does not need to be included in a
global model and only temperature effects need to be considered in the model. In cases
where the exhaust stream varies from lean to rich, such as an LNT-SCR system, using an
H2O competition (R10) model increases the accuracy of stored NH3 under the constantly
varying exhaust conditions. It was also determined that H2, CO, and C3H6 do not affect
the NH3 storage capacity of the catalyst. Therefore, it can be concluded that C3H6 will
store on a different catalytic site then NH3 (R11).

195
8.5 NH3 Oxidation Summary
It was determined experimentally that only negligible amounts of NO and N2O
formed when oxidizing NH3 on the SCR catalyst. It is therefore only important to model
the stoichiometric reaction for ammonia oxidation to complete combustion products as
shown in (R3). Experimentally it can be seen that increasing O2 concentration will
increase ammonia conversion during ammonia oxidation, although it is not a linear effect
between 0.5% and 6% O2. It was found that to account for ammonia oxidation in a
kinetic model where O2 concentration can drastically vary, such as in the EAS, that a
saturation kinetic reaction rate need to be used to increase the accuracy of the model as
shown in (R3). It was observed that varying H2O concentration will decrease the
conversion of NH3 due to oxidation. It was observed that this inhibition from H2O can be
accounted for using the NH3 H2O competition reaction (R10). It was observed that C3H6
will increase the conversion of NH3 due to oxidation, which is theorized as due to the
increase in hydroxyl radicals created by the oxidation of C3H6, which is accounted for as
a global reaction shown in (R14). It was also observed that H2 and CO had negligible
effects on the oxidation of NH3.
8.6 NOx Reduction with NH3 Summary
It can be concluded that the NO to NOx ratio is an important determining
characteristic of the feed gas when predicting NOx conversion with NH3 with max
conversion of NOx occurring when the feed gas contains equal amounts of NO and NO2.
It can also be determined that NOx reduction with NH3 occurs due to five simultaneous
global reactions shown in (R4), (R5), (R6), (R7), and (R8). Due the ability for NOx
conversion with NH3 during cycling experiments; where NH3 is present in the rich pulse
while NOx is present in the lean pulse, the simultaneous NOx conversion with NH3

196
reactions are written as reactions that take place with NH3 stored on the surface of the
catalyst as shown in (R4) – (R8).
Experimental results with varying oxygen concentration have shown that only NO
reduction with NH3 is dependent on oxygen concentration. It has been determined that
the reduction of NO with NH3 when oxygen is not present is small but can be accounted
for using standard kinetic rate expressions as seen in (R4). It can be seen that when
oxygen is present NO conversion with NH3 is strongly dependent on temperature. A
method to determine the oxygen dependence for this reaction was used which yielded
results that show that the oxygen dependence is also a function of temperature. It is
proposed that this is due to the effect of simultaneous nature of the NO Oxidation (R1),
NH3 Oxidation (R3), Fast SCR (R6), and Slow SCR reactions (R7) on the catalyst.
The Fast SCR reaction as shown in (R6) can be modeled as a global reaction with
a standard Arrhenius kinetic rate for the 200°C – 450°C temperature range. The Slow
SCR reaction as shown in (R7) was determined to be to have the largest hysteresis effect
at low temperatures; primarily due to the formation of ammonium nitrate at low
temperatures on the catalyst surface. The global Slow SCR reaction with a standard
Arrhenius rate simulation was shown to be statistically significant and is therefore
considered adequate when predicting NH3 and NOx conversion for the entire temperature
range tested.
It has been determined that significant amounts of N2O are produced
simultaneously during the reduction of NOx with NH3 when the NO to NOx ratio favors
NO2. It has been determined that up to 80% of NO2 can be converted to N2O when
reacting with NH3 (R8). It was determined that NH3 can be used to in the reduction of
N2O, but the reaction does not start until the catalyst temperature is above 350°C (R9). It
was determined that NO2 formation to N2O is not the critical pathway the Fast SCR
reaction (R6) because NO does not increase the conversion of N2O with NH3 below
350°C. It was determined that the Slow SCR reaction (R7) is important by combining

197
the NO2 conversion to NO, N2O conversion with NH3, and the NO2 conversion due to
thermal decomposition, a to formulate a NOx conversion estimate.
It was determined from validation experiments that the NOx conversion is highly
dependent on the amount of NH3 stored on the catalyst. This is confirmed by an
experiment where the ideal rich lean cycling conditions are lengthened to saturate the
catalyst with NH3 and measure the NOx conversion as all NH3 is removed from the
catalyst. From the long cycling experiments the amount of NH3 stored on the catalyst can
be determined as a non-dimensional term called the NH3 surface coverage fraction.
Instantaneous NOx conversion for each cycle can be plotted against the NH3 surface
coverage fraction, which can then be collapsed to find the trendline signifying the
dependence on stored NH3 for a constant temperature of a given NO to NOx ratio. The
trendlines created were then used to formulate a new approximation to be implemented in
the kinetic rates of the NH3 oxidation reaction (R3) , the Standard SCR reaction (R5), the
Fast SCR reaction (R6), the Slow SCR reaction (R7), and the N2O Production reaction
(R8) in the SCR kinetic mechanism shown in Table 8.1. It is suggested not to change the
kinetic rate of the Rich Standard SCR reaction (R4) due to the low activity of the
reaction. It also suggested to use the standard Arrhenius kinetic rate for the N2O
Reduction with NH3 reaction (R9) until initial modeling results are analyzed.
It was observed that under steady state conditions that NOx conversion is
unaffected by changes in H2O and CO2 levels. Therefore there is no inhibition due to H2O
or CO2 for the NOx conversion reactions. It can therefore be concluded that each NOx
conversion reaction occurs much quicker than the NH3 oxidation reaction, since
increasing H2O concentration did not decrease the NOx conversion for all NO to NOx
ratios.
It was found that CO, H2, and C3H6 effect NOx conversions with NH3 by
changing the NO to NOx ratio at the catalyst by utilizing their strong reactions with NO2
(R12), (R13), (R17), (R18). This is corroborated when experimental results have shown

198
increases NOx reduction when the NOx composition is all NO2, by converting the NO2 to
equal amounts of NO and NO2 at the catalyst where NH3 is present. This is further
shown when CO, H2, and C3H6 will inhibit NOx conversion when an equal molar NOx
composition is present and an all NO NOx composition is present by inhibiting the Fast
SCR reaction (R6) from taking place.

199
REFERENCES
1. Peters, L.D. (2004) U.S. passenger car market should open up to more
Turbodiesel cars Yale Daily News
2. Majewski, W.A. SCR Systems for Mobile Engines. DieselNet Technology Guide
2005 [cited 2005 2/9/2006].
3. Majewski, W.A. Selective Catalytic Reduction. Diesel Catalysts 2005 [cited
2005.
4. Heywood, J., Internal Combustion Engine Fundamentals. 1988, New York:
McGraw-Hill Inc.
5. Ball, D., Nunan, N., Blosser, B., Wilson, J., Mitchell, G., Davis, S., and Zammit,
M., FlexMetal Catalyst Technologies. SAE Paper 2005-01-1111, 2005.
6. Omoto, H., Kobayashi, T., Ishikawa, K., and Yamada, T., Catalyst Design for
Meeting Stringent LEV-2 NOx Regulation. SAE Paper 2002-01-0348, 2002.
7. Pulkrabek, W., Engineering Fundamentals of the Internal Combustion Engine.
1997, New Jersey: Prentice-Hall Inc.
8. Stone, R., Introduction to Internal Combustin Engines. Third ed. 1999,
Warrendale: Society of Automotive Engineers Inc.
9. Ayala, A., Gebel, M.E., Okamoto, R.A., Reiger, P.L., Kado, N.Y., Cotter, C., and
Verma, N., Oxidation Catalysts Effect on CNG Transit Bus Emissions. SAE Paper
2003-01-1900, 2003.
10. Maklno, M., Kondo, T., Kunz, A., Ohara, E., Schuetze, F., Hoffmann, M.,
Groeger, M., Jean, E., Ottaviani, E., Guertler, W., Paule, M., Keppeler,B., and D.
Scharr, Evaluation of Advanced Diesel Oxidation Catalyst Concepts: Part 2. SAE
Paper 2006-01-0032, 2006.
11. Fayard, J.-C. and Sequelong, T., A New DPF System for Duty Cycle Vehicles.
SAE Paper 2004-01-1937, 2004.
12. Fayard, J.-C., Sequelong, T., and Joubert, E., A New Active DPF System for "Stop
& Go" Duty Cycle Vehicles: Durability and Improvements. SAE Paper 2005-01-
1754, 2005, 2005.
13. Tatur, M., Tomazic, D., Thornton, M., Orban, J., and Slone, E., Tier 2 Useful Life
(120,000 miles) Exhaust Emission Results for a NOx Adsorber and Diesel
Particle Filter Equipped LIght-Duty Diesel Vehicle. SAE Paper 2006-01-0424,
2006.
14. Colliou, T., Lavy, J., Martin, B., Chandes, K., Pichon, G., and Pierron, L.,
Coupling of a NOx trap and a cDPF for emissions reduction of a 6-cylinder HD
engine. SAE Paper 2004-01-1945, 2004. 1.
15. Schmieg, S. and Lee, J., Evaluation of Supplier Catalysts Formulations for the
Selective Catalytic Reduction of NOx with Ammonia. SAE Paper 2005-01-3881,
2005.

200
16. Wolf, P., AdBlue as a Reducing Agen for the Decrease of NOx Emissions from
Diesel Engines of Commercial Vehicles. 2003, DGMK: Hamburg.
17. Fang, H.L. and DaCosta, H.F.M., Urea thermolysis and NOx reduction with and
without SCR catalysts. Applied Catalysis: B Environmental, 2003. 46(1): p. 17-
34.
18. Gabrielsson, P.L.T., Urea-SCR in automotive applications. Topics in Catalysis,
2004. 28(1): p. 177-184.
19. Chimner, C., Transient On-Road Emission Reduction of an LNT + SCR
Aftertreatment System. SAE Paper 2008-01-2641, 2008. 1.
20. Dykes, E., NOx Performance of an LNT+SCR System Designed to Meet EPA
2010 Emissions: REsults of Engine Dynamometer Emission Tests. SAE Paper
2008-01-2642, 2008. 1.
21. Cohn, J., Steele, D., and Anderson, H., Method of Selectively Removing Oxides of
Nitrogen from Oxygen-Containing Gases. 1961: United States.
22. Lyon, R.K. and Hardy, J.E., Discovery and Deveolopment of the Thermal DeNOx
Process. Ind. Eng. Chem. Fundam., 1986. 25(1): p. 19-24.
23. Bowman, C.T., Mechanisms and Modeling of Gas-Phase Aftertreatment Methods
for NO Removal from Combustion Products, in Physical and Chemical Aspects of
Combustion, F.L. Dryer and R.F. Sawyer, Editors. 1997, Gordon and Breach
Science Publishers: United Kingdom. p. 29-68.
24. Brouwer, J., Heap, M.P., Pershing, D.W., and Smith, P.J. A Model for Prediction
of Selective Non-Catalytic Reduction of Nitrogen Oxides by Ammonia, Urea, and
Cyanuric Acid with Mixing Limitations in the Presence of CO. Volume,
25. Glarborg, P., Kristensen, P.G., Jensen, S.H., and Dam-Johansen, K., A Flow
Reactor Study of HNCO Oxidation Chemistry. Combustion and Flame, 1994. 98:
p. 241-258.
26. Lyon, R.K., Method for the Reduction of the Concentration of NO in Combustion
Effluents Using Ammonia. 1973, Exxon Research and Engineering Company:
United States.
27. Miller, J.A., Branch, M.C., and Kee, R.J., A Chemical Kinetic Model for the
Selective Reduction of Nitric Oxide by Ammonia. Combustion and Flame, 1981.
43: p. 81-98.
28. Østberg, M. and Dam-Johansen, K., Empirical Modeling of the Selective Non-
Catalytic Reduction of NO: Comparison with Large-Scale Experiments and
Detailed Kinetic Modeling. Chemical Engineering Science, 1994. 49(12): p.
1897-1904.
29. Byrne, J.W., Chen, M., and Speronello, B.K., Selective Catalytic Reduction of
NOx using Zeolitic Catalysts for High Temperature Applications. Catalysis
Today, 1992. 13: p. 33-42.
30. Busca, G., Lietti, L., Ramis, G., and Berti, F., Chemical and mechanistic aspects
of the selective catalytic reduction of NOx by ammonia over oxide catalysts.
Applied Catalysis: B Environmental, 1998. 18: p. 1-36.
31. Koebel, M., Elsener, M., and Kleemann, M., Urea-SCR: a promising technique to
reduce NOx emissions from automotive diesel engines. Catalysis Today, 2000.
59(1): p. 335-345.
201
32. Andersen, H., Method of Purifying Gases Containing Oxygen and Oxides of
Nitrogen, U.S.P. Office, Editor. 1962.
33. Andersen, H., Cohn, J., and Glogau, R.C., Selective Removal of Nitrogen Oxides
from Gas Streams, U.S.P. Office, Editor. 1962.
34. Andersen, H., Green, W.J., and Steele, D.R., Catalytic Treatment of Nitric Acid
Plant Tail Gas. Industrial and Engineering Chemistry, 1961. 53(3): p. 199-204.
35. Andersen, H. and Keith, C.D., Method of Purifying Gases Containing Oxygen and
Oxides of Nitrogen, U.S.P. Office, Editor. 1961.
36. Griffing, M.E., Lamb, F.W., and Stephens, R.E., Method of Controlling Exhaust
Emission, U.S.P. Office, Editor. 1969.
37. Keith, C.D. and Kenah, P.M., Process for Catalytically Purifying Gases
Containing Oxides of Nitrogen, U.S.P. Office, Editor. 1967.
38. Markvart, M. and Pour, V., The influence of oxygen on the catalytic reduction of
nitric oxide by ammonia. Journal of Catalysis, 1967. 7(3): p. 279-281.
39. Nonnenmacher, H. and Kartte, K., Selective Removal of Oxides of Nitrogen From
Gas Mixtures Containing Oxygen, U.S.P. Office, Editor. 1966.
40. Otto, K., Shelef, M., and Kummer, J.T., Studies of Surface Reactions of Nitric
Oxide by Nitrogen-15 Isotope Labeling. I. The Reaction between Nitric Oxide
and Ammonia over Supported Platinum at 200-250°. The Journal of Physical
Chemistry, 1970. 74(13): p. 2690.
41. Delahay, G. and Coq, B., Pollution Abatement using Zeolites: State of the Art
and Further Needs, in Zeolites for Cleaner Technologies, M. Guisnet and J.-P.
Gilson, Editors. 199?, Imperial College Press.
42. Centi, G. and Perathoner, S., Nature of active species in copper-based catalysts
and their chemistry of transformation of nitrogen oxides. Applied Catalysis A:
General, 1995. 132: p. 179-259.
43. Rahkamaa-Tolonen, K., Maunula, T., Lomma, M., Huuhtanen, M., and Keiski,
R.L., The effect of NO2 on the activity of fresh and aged zeolite catalysts in the
NH3-SCR reaction. Catalysis Today, 2005. 100: p. 217-222.
44. Nova, I., Ciardelli, C., Tronconi, E., Chatterjee, D., and Brandl-Konrad, B., NH3-
NO/NO2 Chemistry over V-based catalysts and its role in the mechanism of the
Fast SCR reaction. Catalysis Today, 2006. 114: p. 3-12.
45. Olsson, L., Sjövall, H., and Blint, R.J., A kinetic model for ammonia selective
catalytic reduction over Cu-ZSM-5. Applied Catalysis B: Environmental, 2007.
81: p. 203-217.
46. Sjovall, H., Blint, R., and Olsson, L., Detailed Kinetic Modeling of NH3 and H2O
Adsorption, and NH3 Oxidation over Cu-ZSM-5. Journal of Physical Chemistry
C, 2009. 113: p. 1393-1405.
47. Kim, J., Cavataio, G., Patterson, J., Laing, P., and Lambert, C., Laboratory
Studies and Mathematical Modeling of Urea SCR Catalyst Performance. SAE
Paper 2007-01-1573, 2007. 1.
48. Wurzenberger, J.C. and Wanker, R., Multi-Scale SCR Modeling, 1D Kinetic
Analysis and 3D System Simulation. SAE Paper 2008-01-1540, 2005. 01.
49. Nova, I., Lietti, L., Tronconi, E., and Frozatti, P., Transient response method
applied to the kinetic analysis of DeNOx-SCR reation. Chemical Engineering
Science, 2001. 56: p. 1229-1237.
202
50. Koci, P., Marek, M., Kubicek, M., Maunula, T., and Harkonen, M., Modelling of
catalytic monolith converters with low-and high-temperature NOx storage
compounds and differentiated washcoat. Chemical Engineering Journal, 2004.
97: p. 131-139.
51. Marangozis, J., Comparison and Analysis of Intrinsic Kinetics and Effectivenss
Factors for the Catalytic Reduction of NO with Ammonia in the Pressence of
Oxygen. Ind. Eng. Chem. Res., 1992. 31: p. 987-994.
52. Kandylas, I.P., Koltaskis, G.C., and Stamatelos, A.M., Mathematical modelling of
precious metals catalytic converters for diesel NOx reduction. Proc. Instn. Mech.
Engrs., 1999. 213: p. 279-292.
53. Chen, M. and Williams, S., Modelling and Optimization of SCR-Exhaust
Aftertreatment Systems. SAE Paper 2005-01-0969, 2005.
54. Chi, J. and DaCosta, H., Modeling and Control of Urea-SCR Aftertreatment
System. SAE Paper 2005-01-0966, 2005.
55. Ciardelli, C., Nova, I., Tronconi, E., Konrad, B., Chatter, D., Ecke, K., and
Weibel, M., SCR-DeNOx for diesel engine exhaust aftertreatment: unsteady-state
kinetic study and monlity reactor modeling. Chemical Engineering Science, 2004.
59: p. 5301-5309.
56. Vradman, L., Herskowitz, M., Capek, L., Wichterlová, B., Brosius, R., and
Martens, J.A., Kinetic Experiments and MOdeling of a Complex DeNOx System:
Decane Selective Catalytic Reduction of NOx in the Gas Phase and over an Fe-
MFI Type Zeolite Catalyst. Ind. Eng. Chem. Res., 2005. 44: p. 4523-4533.
57. Epling, B., Hou, P., Luo, J., Wijayakoon, P., Li, W., and Schmeig, S. Spatially
Resolving the Different SCR Reactions. in Cross-Cut Lean Exhaust Emissions
Reduction Simulations Workshop 2010. 2010. Deaborn Michigan.
58. Hayes, R.E. and Kolackowski, S., Introduction to Catalytic Combustion. 1997,
Amsterdam: Gordon and Breach Science Publishers.
59. Froment, G.F. and Bischoff, K.B., Chemical Reactor Analysis and Design. 1990,
New York: John Wiley & Sons.
60. Perry, R. and Green, D., Perry's Chemical Engineer's Handbook. 6th ed. 1984,
New York: McGraw Hill.
61. Barin, I., Thermochemical Data of Pure Substances. 3rd ed. 1985, New York,
London, Sydney: John Wiley & Sons.
62. (Ed.), V.D.I., VDI-Warmeatlas. 1991, Dusseldorf: VDI Verlag.
63. Reid, R.C., Puausnitz, J., and Poling, B.E., The properties of gases and liquids.
1988, New York: McGraw Hill.
64. Fuller, E.N., Schettler, P.D., and Giddings, J.C., A new method for the prediction
of gas phase diffusion coefficients. Ind. Eng. Chem. , 1966. 58: p. 19-27.
65. Laidler, K.J., Chemical Kinetics. Third ed. 1997, New York: Benjamin Cummins.
66. Klinkert, S., Hoard, J., Sathasivam, S., Assanis, D., and Bohac, S., Design of a
Flow Reactor for Testing Multi-Brick Catalyst Systems Using Rapid Exhaust Gas
Composition Switches. ASME Paper ICEF2009-14016, 2009.
67. Northrop, W., Particulate and Gas Phase Hyrdrocarbon Emissions From
Partially Premixed Low Temperature Compression Ignition Combustion of
Biodiesel, in Mechanical Engineering. 2010, University of Michigan: Ann Arbor.
p. 231.

203
68. Hagena, J., The Impact of Fuel Injection Parameters on the Combustion ,
Emissions, and Performance of a Medium - Duty Diesel Engine, in Mechanical
Engineering. 2004, Univesity of Michigan: Ann Arbor. p. 111.
69. He, Y., Development and Application of a Lean NOx Trap Model. SAE Paper
2006-01-0686, 2006.
70. Depcik, C., Assanis, D., and Bevan, K., A one-dimensional lean NOx trap model
with a global kinetic mechanism that includes NH3 and N2O. Int, J. Engine Res.,
2007. 9: p. 57-77.
71. Kwon, H., Baik, J., Kwon, Y., Nam, I., and Oh, S., Detailed reaction kinetics over
comercial three-way catalysts. Chemical Engineering Science, 2007. 62: p. 5042-
5047.
72. Sampara, C., Global Reaction Kinetics for Oxidation and Storage in Diesel
Oxidation Catalysts, in Mechanical Engineering. 2008, University of Michigan:
Ann Arbor. p. 168.
73. Kiovsky, J.R., Koradia, P.B., and Lim, C.T., Evaluation of a New Zeolitic
Catalyst for NOx Reduction with NH3. Ind. Eng. Chem. Prod. Res. Dev., 1980. 19:
p. 218-225.
74. Iwamoto, M., Yahiro, H., Mine, Y., and Kagawa, S., Excessively Copper Ion-
exchanged ZSM-5 Zeolites as Highly Active Catalysts for Direct Decomposition
of Nitrogen Monoxide. Chemistry Letters, 1989: p. 213-216.
75. Hamada, H., Kintaichi, Y., Sasaki, M., and Ito, T., Selective reduction of nitrogen
monoxide with propane over alumina and HZSM-5 zeolite. Applied Catalysis,
1991. 70: p. L15-L20.
76. Hamada, H., Kintaichi, Y., Sasaki, M., Ito, T., and Tabata, M., Transition metal-
promoted silica and alumina catalysts for the selective reduction of nitrogen
monoxide with propane. Applied Catalysis, 1991. 75: p. L1-L8.
77. Valyon, J. and Hall, W.K., Studies of the Surface Species Formed from NO on
Copper Zeolites. J. Phys. Chem., 1993. 97: p. 1204-1212.
78. Petunchi, J.O. and Hall, W.K., On the role of nitrogen dioxide in the mechanism
of the selective reduction of NOx over Cu-ZSM-5 zeolite. Applied Catalysis B:
Environmental, 1993. 2: p. L17-L26.
79. Sjovall, H., Olsson, L., Fridell, E., and Blint, R.J., Selective catalytic reduction of
NOx with NH3 over Cu-ZSM-5 - The effect of changing the gas composition.
Applied Catalysis: B Environmental, 2006. 64: p. 180-188.
80. Kijlstra, W., Daamen, J., van de Graaf, J., van der Linden, B., Poels, E., and
Bliek, A., Inhibitng and deactivating effects of water on selective catalytic
reduction of nitric oxide with ammonia over MnOx/Al2O3. Applied Catalysis B:
Environmental, 1996. 7: p. 337-357.
81. Hadjiivanov, K., Klissurski, D., Ramis, G., and Busca, G., Fourier transform IR
study of NOx adsorption on a CuZSM-5 DeNOx catalyst. Applied Catalysis B:
Environmental, 1996. 7: p. 251-267.
82. Petunchi, J.O., Sill, G., and Hall, W.K., Studies of the selective reduction of nitric
oxide by hydrocarbons. Applied Catalysis B: Environmental, 1993. 2: p. 303-321.
83. Yokoyama, C. and Misono, M., Catalytic Reduction of Nitrogen Oxides by
Propene in the Presence of Oxygen over Cerium Ion-Exchanged Zeolites. Journal
of Catalysis, 1994. 150: p. 9-17.

204
84. Grünert, W., Hayes, N.W., Joyner, R.W., Shpiro, E.S., Siddiqui, M.R.H., and
Baeva, G.N., Structure, Chemistry, and Activity of Cu-ZSM-5 Catalysts for the
Selective Reduction of NOx in the Presence of Oxygen. J. Phys. Chem., 1994. 98:
p. 10832-10846.
85. Stevenson, S.A. and Vartuli, J.C., The Selective Catalytic Reduction of NO2 by
NH3 over HZSM-5. Journal of Catalysis, 2002. 208: p. 100-105.
86. Stevenson, S.A., Vartuli, J.C., and Sharma, S.B., The Effects of Steaming and
Sodium Exchange on the Selective Catalytic Reduction of NO and NO2 by NH3
over HZSM-5. Journal of Catalysis, 2002. 208: p. 106-113.
87. Wallin, M., Karlsson, C.-J., Skoglundh, M., and Palmqvist, A., Selective catalytic
reduction of NOx with NH3 over zeolite H-ZSM-5: influence of transient ammonia
supply. Journal of Catalysis, 2003. 218: p. 354-364.
88. Stevenson, S.A., Vartuli, J.C., and Brooks, C.F., Kinetics of the Selective
Catalytic Reduction of NO over HZSM-5. Journal of Catalysis, 2000. 190: p. 228-
239.
89. Eng, J. and Bartholomew, C.H., Kinetic and Mechanistic Study of NOx Reduction
by NH3 over H-Form Zeolites. I. Kinetic and Mechanistic Insights into NO
Reduction over H-ZSM-5. Journal of Catalysis, 1997. 171: p. 14-26.
90. Delahay, G., Valade, D., Guzmán-Vargas, A., and Coq, B., Selective catalytic
reduction of nitric oxide with ammonia on Fe-ZSM-5 catalysts prepared by
different methods. Applied Catalysis B: Environmental, 2005. 55: p. 149-155.
91. Krishna, K. and Makkee, M., Preparation of Fe-ZSM-5 with enhanced activity
and stability for SCR of NOx. Catalysis Today, 2006. 114: p. 23-30.
92. Rahkamaa-Tolonen, K., Manunula, T., Lomma, M., Huuhtanen, M., and Keiski,
R.L., The effect of NO2 on the activity of fresh and aged zeolite catalysts in the
NH3-SCR reaction. Catalysis Today, 2005. 100: p. 217-222.
93. Long, R.Q. and Yang, R.T., Selective Catalytic Reduction of NO with Ammonia
over Fe3+
-Exchanged Mordenite (Fe-MOR): Catalytic Performance,
Characterization, and Mechanistic Study. Journal of Catalysis, 2002. 207: p. 274-
285.
94. Auroux, A., Picciau, C., and Gervasini, A., The adsorption and catalytic
properties of Cu-ETS and Cu-ZSM molecular sieves in NOx removal by reduction,
in Porous Materials in Environmentally Friendly Processes, I. Kiricsi, et al.,
Editors. 1999, Elsevier Science B. V. p. 555-562.
95. Lietti, L., Nova, I., Tronconi, E., and Forzatti, P., Transient kinetic study of SCR-
DeNOx reaction. Catalysis Today, 1998. 45: p. 85-92.
96. Perdana, I., Creaser, D., Öhrman, O., and Hedlund, J., NOx adsorption over a
wide temperature range on Na-ZSM-5 films. Journal of Catalysis, 2005. 234: p.
219-229.
97. Marangozis, J., Comparison and Analysis of Intrinsic Kinetics and Effectiveness
Factors for the Catalytic Reduction of NO with Ammonia in the Presence of
Oxygen. Ind. Eng. Chem. Res., 1992. 31: p. 987-994.
98. Brosius, R., Habermacher, D., Martens, J.A., Vradman, L., Herskowitz, M.,
Čapek, L., Sobalík, Z., Dědeček, J., Wichterlová, B., Tokarová, V., et al., NO
oxidation kinetics on iron zeolites: influence of framework type and iron
speciation. Topics in Catalysis, 2004. 30/31: p. 333-339.

205
99. Gordon, S. and McBride, B., Computer Program for Calculation of Complex
Chemical Equilibrium Compositions, Rocket Performance, Incident and Reflected
Shocks and Chapman-Jouguet Detonations. NASA, 1971. SP-273.
100. Stull, D. and Prophet, H., JANAF thermochemical table.s. 2nd ed. 1971,
Washington D. C.: U.S. National Bureau of Standards.
101. Nova, I., Lietti, L., Tronconi, E., and Forzatti, P., Transient response method
applied to kinetic analysis of the DeNOx-SCR reaction. Chemical Engineering
Science, 2001. 56: p. 1229-1237.
102. Tsutsumi, K., Kajiwara, H., and Takahashi, H., Characteristic Studies on
Dealumination of Faujasite-type Zeolite. Bulletin of the Chemical Society of
Japan, 1974. 47(4): p. 801-805.
103. Tsutsumi, K., Qui Koh, H., Hagiwara, S., and Takahashi, H., Direct Measurement
of Interaction Energy between Solids and Gases. I. Heat of Adsorption of
Ammonia on Zeolite. Bulletin of the Chemical Society of Japan, 1975. 48(12): p.
3576-3580.
104. Anderson, J.R., Foger, K., Mole, T., Rajadhyaksha, R.A., and Sanders, J.V.,
Reactions on ZSM-5-Type Zeolite Catalysts. Journal of Catalysis, 1979. 58: p.
114-130.
105. Auroux, A., Bolis, V., Wierzchowski, P., Gravelle, P.C., and Vedrine, J.C., Study
of the Acidity of ZSM-5 Zeolite by Microcalorimetry and Infrared Spectroscopy.
Journal Chemical Society of Faraday?, 1979. 75: p. 2544-2555.
106. Auroux, A., Wierzchowski, P., and Gravelle, P.C., Microcalorimetric Evidence of
the Non-Uniform Distribution of Acid Sites in a ZSM-Type Zeolite.
Thermochimica Acta, 1979. 32: p. 165-170.
107. Kanazirev, V. and Borisova, N., Temperature programmed desorption studies on
the penetration of ammonia into the sodalite cages of A, X and Y type zeolites.
Zeolites, 1982. 2: p. 23-28.
108. Post, J.G. and van Hooff, J.H.C., Acidity and activity of H-ZSM-5 measured with
NH3-t.p.d. and n-hexane cracking. Zeolites, 1984. 4: p. 9-14.
109. Tøpsoe, N.-Y., Pedersen, K., and Derouane, E.G., Infrared and Temperature-
Programmed Desorption Study of the Acidic Properties of ZSM-5-Type Zeolites.
Journal of Catalysis, 1981. 70: p. 41-52.
110. Védrine, J.C., Auroux, A., Bolis, V., Dejaifve, P., Naccache, C., Wierzchowski,
P., Derouane, E., Nagy, J., Gilson, J., van Hooff, J., van den Berg, J., and J.
Wolthuizen, Infrared, Microcalorimetric, and Electron Spin Resonance
Investigations of the Acidic Properties of the H-ZSM-5 Zeolite. Journal of
Catalysis, 1979. 59: p. 248-262.
111. Xu, L., McCabe, R.W., and Hammerle, R.H., NOx self-inhibition in selective
catalytic reduction with urea (ammonia) over a Cu-zeolite catalyst in diesel
exhaust. Applied Catalysis B: Environmental, 2002. 39: p. 51-63.
112. Louis-Rose, I., Methivier, C., and Pradier, C., Oxidation of NH3 on
polycrystalline copper and Cu(1 1 0): a combined FT-IRAS and kinetics
investigation. Catalysis Today, 2003. 85: p. 267-278.

206
113. Chatterjee, D., Burkhardt, T., Weibel, M., Tronconi, E., Nova, I., and Ciardelli,
C., Numerical Simulation of NO/NO2/NH3 Reactions on SCR-Catalytic
Converters: Model Development and Applications. SAE Paper 2006-01-0468,
2006.
114. Hidalgo, C.V., Itoh, H., Hattori, T., Niwa, M., and Murakami, Y., Measurement of
the Acidity of Various Zeolites by Temperature-Programmed Desorption of
Ammonia. Journal of Catalysis, 1984. 85: p. 362-369.
115. Iwamoto, M., Tajima, M., and Kagawa, S., The Effect of Zeolite Composition and
Structure on the Acidity of Proton-exchanged Zeolites. J. Chem. Soc., Chem.
Commun., 1986: p. 598-600.
116. Schmieg, S.J. and Lee, J.-H., Evaluation of Supplier Catalyst Formulations for
the Selective Catlaytic Reduction of NOx With Ammonia. SAE Paper 2005-01-
3881, 2005.
117. Centi, G., Nigro, C., Perathoner, S., and Stella, G., Role of the Support and of
Adsorbed Species on the Behavior of Cu-based Catalysts for NO Conversion.
Catalysis Today, 1993. 17: p. 159-166.
118. Heck, R.M., Catalytic abatement of nitrogen oxides - stationary applications.
Catalysis Today, 1999. 53: p. 519-523.
119. Amiridis, M.D., Puglisi, F., Dumesic, J.A., Millman, W.S., and Topsøe, N.-Y.,
Kinetic and Infrared Spectroscopic Studies of Fe-Y Zeolites for the Selective
Catalytic Reduction of Nitric Oxide by Ammonia. Journal of Catalysis, 1993. 142:
p. 572-584.
120. Qi, G. and Yang, R.T., Ultra-active Fe/ZSM-5 catalyst for selective catalytic
reduction of nitric oxide with ammonia. Applied Catalysis B: Environmental,
2005. 60: p. 13-22.
121. Depcik, C., Modeling Reacting Gases and Aftertreatment Devices for Internal
Combustion Engines, in Mechanical Engineering. 2003, The University of
Michigan: Ann Arbor, Michigan.
122. Kato, A., Matsuda, S., Kamo, T., Nakajima, F., Kuroda, H., and Narlta, T.,
Reaction between NOx and NH3 on Iron Oxide-Titanium Oxide Catalyst. Journal
of Physical Chemistry, 1981. 85(26): p. 4099-4102.
123. Li, Y. and Armor, J.N., Selective NH3 oxidation to N2 in a wet stream. Applied
Catalysis B: Environmental, 1997. 13: p. 131-139.
124. Komatsu, T., Nunokawa, M., Moon, I.S., Takahara, T., Namba, S., and Yashima,
T., Kinetic Studies of Reduction of Nitric Oxide with Ammonia on Cu2+
-
Exchanged Zeolites. Journal of Catalysis, 1994. 148: p. 427-437.
125. Busca, G., Lietti, L., Ramis, G., and Berti, F., Chemical and mechanistic aspects
of the selective catalytic reduction of NOx by ammonia over oxide catalysts: A
review. Applied Catalysis B: Environmental, 1998. 18: p. 1-36.
126. Kieger, S., Delahay, G., Coq, B., and Neveu, B., Selective Catalytic Reduction of
Nitric Oxide by Ammonia over Cu-FAU Catalysts in Oxygen-Rich Atmosphere.
Journal of Catalysis, 1999. 183: p. 267-280.
127. Gekas, I., Gabrielsson, P., Johansen, K., Bjørn, I., Kjær, J.H., Reczek, W., and
Cartellieri, W., Performance of a Urea SCR system combined with a PM and fuel
optimized heavy-duty diesel engine able to achieve the Euro V emission limits.
SAE Paper 2002-01-2885, 2002.

207
128. Narayanaswamy, K. and He, Y., Modeling of Copper-Zeolite and Iron-Zeolite
Selective Catalytic Reduction (SCR) Catalysts at Steady State and Transient
Conditions. SAE Paper 2008-01-0615, 2008. 1.
129. Lyon, R., The NH3-NO-O2 Reaction. International Journal of Chemical Kinetics,
1976. VIII: p. 315-318.
130. Stevenson, S., Vartuli, J., and Brooks, C., Kinetics of the Selective Catalytic
Reduction of NO over H-ZSM-5. Journal of Catalysis, 2000. 190: p. 228-239.
131. Stevenson, S., Vartuli, J., and Sharma, S., The Effects of Steaming and Sodium
Exchange on the Selective Catalytic Reduction of NO and NO2 by NH3 over
HZSM-5. Journal of Catalysis, 2002. 208(1): p. 106-113.
132. Eng, J. and Bartholomew, C., Kinetic and Mechanistic Study of NOx Reduction by
NH3 over H-Form Zeolites. Journal of Catalysis, 1997. 171: p. 14-26.
133. Komatsu, T., Nunokawa, M., Moon, I., Takkahara, T., Namba, S., and Yashima,
T., Kinetic Studies of Reduction of Nitric Oxide with Ammonia on Cu2+-
Exchanged Zeolites. Journal of Catalysis, 1994. 148(2): p. 427-437.
134. Grossale, A., Nova, I., Tronconi, E., Chatterjee, D., and Weibel, M., The
chemistry of the NO/NO2-NH3 "fast" SCR reaction over Fe-ZSM5 investigated by
transient reaction analysis. Journal of Catalysis, 2008. 256: p. 312-322.
135. Ciardelli, C., Nova, I., Tronconi, E., Chatterjee, D., Bandl-Konrad, B., Weibel,
M., and Krutzsch, B., Reactivity of NO/NO2-NH3 SCR system for diesel exhaust
aftertreatment: Identification of reaction network as a function of temperature
and NO2 feed content. Applied Catalysis B: Environmental, 2007. 70: p. 80-90.
136. Devarakonda, M., Tonkyn, R., Tran, D., Lee, J., and Herling, D. Modeling
Competitive Adsorption in Urea-SCR Catalysts for Enhanced Low Temperature
NOx Control. in 2010 DOE Crosscut Workshop on Lean Emissions Reduction
Simulation. 2010. Dearborn, MI.
137. Despres, J., Koebel, M., Krocher, O., Elsener, M., and Wokaun, A., Adsorption
and desorption of NO and NO2 on Cu-ZSM-5. Microporous and Mesoporous
Materials, 2003. 58: p. 175-183.
138. Komatsu, T., Uddin, M., and Yashima, T. Zeolites: a refined tool for designing
catalytic sites. in International Zeolite Symposium. 1995. Amsterdam: Elsevier.
139. Jobson, E., Smedler, G., Malmberg, P., Bernier, H., Hjortsberg, O., Gottberg, I.,
and Rosén, Å., Nitrous Oxide Formation Over Three-Way Catalyst. SAE Paper
940926, 1994.
140. Koike, N. and Odaka, M., Methane and Nitrous Oxide (N2O) Emission
Characteristics from Automobiles. SAE Paper 960061, 1996.
141. Koike, N., Odaka, M., and Suzuki, H., Reduction of N2O from Automobiles
Equipped with Three-Way Catalyst - Analysis of N2O Increase Due to Catalyst
Deactivation. SAE Paper 1999-01-1081, 1999.
142. Odaka, M., Koike, N., and Suzuki, H., Deterioration Effect of Three-way Catalyst
on Nitrous Oxide Emission. SAE Paper 980676, 1998.
143. Ramanathan, V., Cicerone, R.J., Singh, H.H., and Kiel, J.T., Trace Gas Trends
and Their Potential Role in Climate Change. Journal of Geophysical Research -
Atmospheres, 1985. 90: p. 5547-5566.
144. Bowman, K.P., Global Trends in Total Ozone. Science, 1988. 239(4835): p. 48-
50.

208
145. Callis, L.B. and Natarajan, M., Ozone and Nitrogen-Dioxide Changes in the
Stratosphere During 1979-84. Nature, 1986. 323(6091): p. 772-777.
146. Weiss, R.F., The Temporal and Spatial-Distribution of Tropospheric Nitrous-
Oxide. Journal of Geophysical Research - Atmospheres, 1981. 86: p. 7185-7195.
147. Brandin, J.G.M., Andersson, L.A.H., and Odenbrand, C.U.I., Catalytic Reduction
of Nitrogen Oxides on Mordenite Some Aspect on the Mechanism. Catalysis
Today, 1989. 4: p. 187-203.
148. Valyon, J. and Hall, W.K., Studies of the Desorption of Oxygen from Cu-Zeolites
during NO Decomposition. Journal of Catalysis, 1993. 143: p. 520-532.
149. Busca, G., Larrubia, M.A., Arrighi, L., and Ramis, G., Catalytic abatement of
NOx: Chemical and mechanistic aspects. Catalysis Today, 2005. 107-108: p. 139-
148.
150. Mauvezin, M., Delahay, G., Kiblich, F., Coq, B., and Kieger, S., Catalytic
reduction of N2O by NH3 in the pressence of oxygen using Fe-exchanged zeolites.
Catalysis Letters, 1999. 62: p. 41-44.
151. Kisliuk, P., The Sticking Probabilities of Gases Chemisorbed on the Surfaces of
Solids. Journal of Phisics and Chemistry Solids, 1957. 3: p. 95-101.
152. Koltsakis, G. and Stameatelos, A., Development and appickation range of
mathematical models for 3-way catalysts. Applied Catalysis B: Environmental,
1997. 12: p. 161-191.
153. Koltsakis, G. and Stameatelos, A., Modeling dynamic phenomena in 3-way
catalytic converters. Chemical Engineering Science, 1999. 54: p. 4567-4578.
154. Bohac, S., Follow-Up Work On: Compositional Analysis of Reformer - Out
Exhaust Gas. 2009, University of Michigan: Ann Arbor.
155. Kuo, J., Morgan, C., and Lassen, H., Mathematical Modeling of CO and HC
Catalytic Converter Systems. SAE Paper 710289, 1971.
156. Olsson, L. and Anderson, B., Kinetic Modeling in Automotive Catalysis. Topics in
Catalysis, 2004. 28(1-4): p. 89-98.
157. Millet, C. and Benramdhane, S., A 3WCC Global Kinetic Model: A Calibration
Method Using Laboratory Scale and Engine Test Bench Experiments. SAE Paper
2008-01-0453, 2008. 1.
158. Chen, W., Hsieg, T., and Jiang, T., An experimental study on carbon monixed
conversion and hydrogen generation from water gas shift reaction. Energy
Conversion and Management, 2008. 49: p. 2801-2808.
159. Oh, S. and Cavendish, J., Transients of Monolith Catalytic Converters: Response
to Step Changes in Feedstream Temperature as Related to Controlling
Automobile Emissions. Industrial and Engineering Chemistry Product Research
and Development, 1982. 21: p. 29.
160. Depcik, C., Loya, S., and Sriniasan, A., Adaptive Carbon Monoxide Kinetic for
Exhaust Aftertreatment Modeling. ASME Paper IMECE2009-11173, 2009.
161. Sampara, C., Global Reaction Kinetics for Oxidation and Storage in Diesel
Oxidation Catalysts, in Mechanical Engineering. 2008, University of Michigan:
Ann Arbor. p. 147.
162. Forzatti, P., Lietti, L., Nova, I., and Tronconi, E., Diesel NOx aftertreatment
catalytic technologies: Analogies in LNT and SCR catalytic chemistry. Catalysis
Today, 2010.

209
163. Yang, J. and Jung, H., The effect of temperature on NOx reduction by H2 in the
presence of excess oxygen on a Pt/Al2O3 monolithic catalyst. Chemical
Engineering Journal, 2009. 146: p. 11-15.
164. Kolli, N., Potvin, C., and Thomas, C., Evidence for the Facile Formation of
Nitrogen-Containing Compounds from NOx and Propene Species on Tungstated
Zirconia-Based Catalysts: Are these Compounds Active or Spectator Species in
the Selective Catalytic Reduction of NOx by C3H6? Journal of Catalysis, 2008.
259(2): p. 240-249.
165. Mosiewicz, P., Porshnev, P., Nester, S., Kennedy, L., Fridman, A., Rabovister, J.,
and Cygan, D., Study of Low-Temperature Combustion in a Low-NOx Burner.
Combustion Science and Technology, 2000. 160(1): p. 1-21.
166. Montreuil, C. and Lambert, C., The Effect of Hydrocarbons on Selective
Catalyzed Reduction of NOx over Low and High Temperature Catalyst
Formulations. SAE Paper 2008-01-1030, 2008. 1.
167. Amin, N. and Chong, C., SCR of NO with C3H6 in the Pressence of Excess O2
over Cu/Ag/CeO2-ZrO2 Catalyst. Chemical Engineering Journal, 2005. 113(1): p.
13-25.