Initial Screening MANA 5341 Dr. George Benson [email protected].
Upload
vuongxuyenCategory
view
214download
0
By Josh Oliver and Fitsum Tesfa
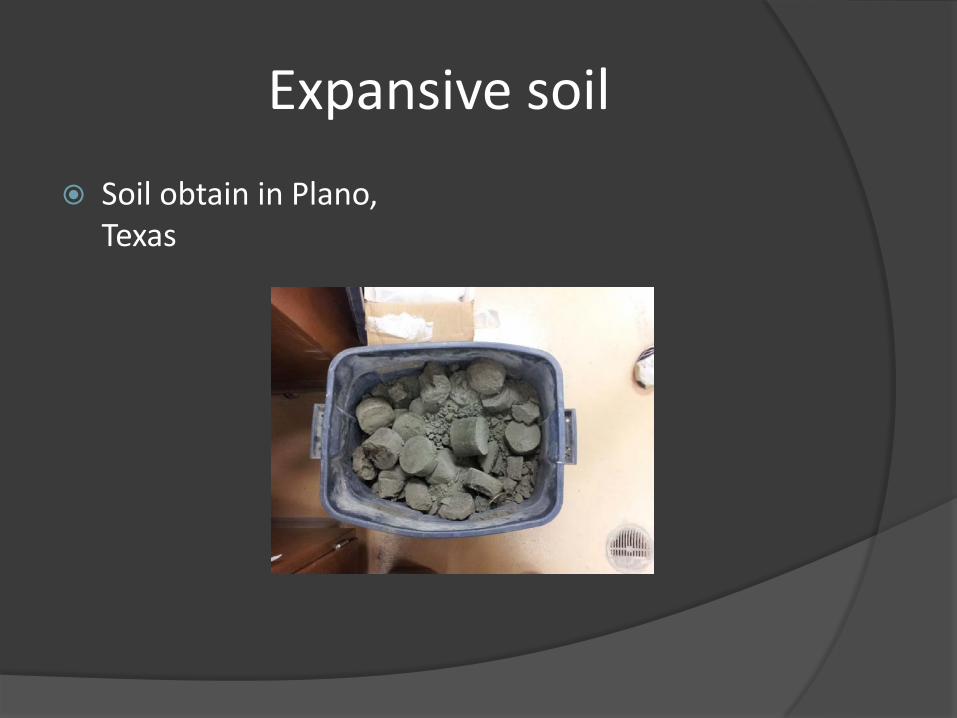
Expansive soil
Soil obtain in Plano, Texas

First Step
Oven dried for 24hrs at 160 degree

The oven dried soil was crushed
After soil was crushed it was then pulverized
Classification of soil using mechanical analysis
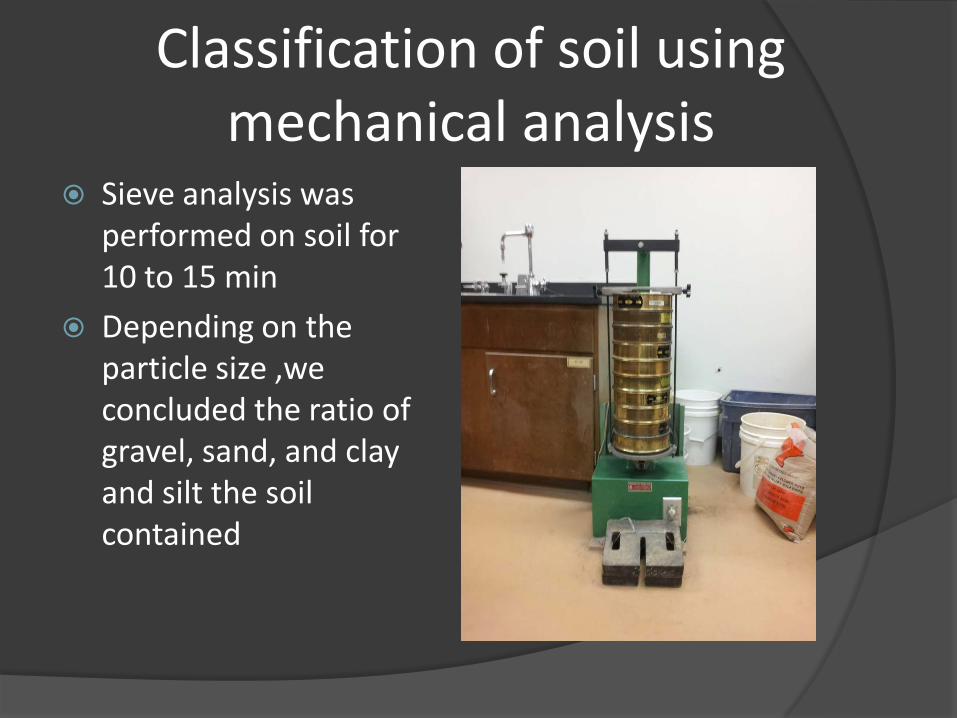
Sieve analysis was performed on soil for 10 to 15 min
Depending on the particle size ,we concluded the ratio of gravel, sand, and clay and silt the soil contained
Classification of Soil using mechanical analysis
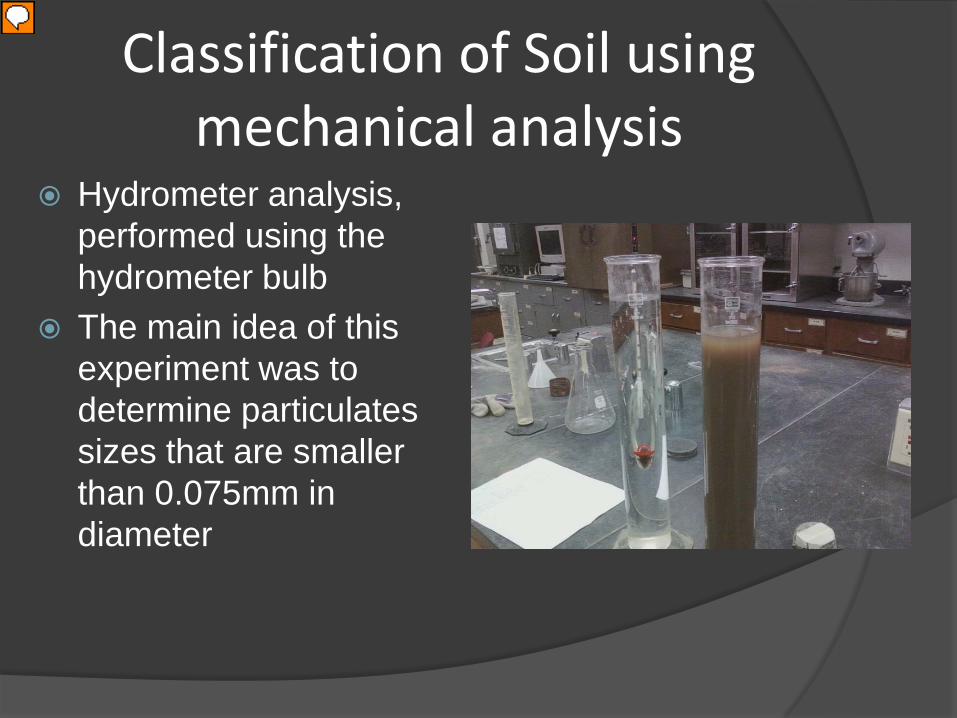
Hydrometer analysis, performed using the hydrometer bulb
The main idea of this experiment was to determine particulates sizes that are smaller than 0.075mm in diameter
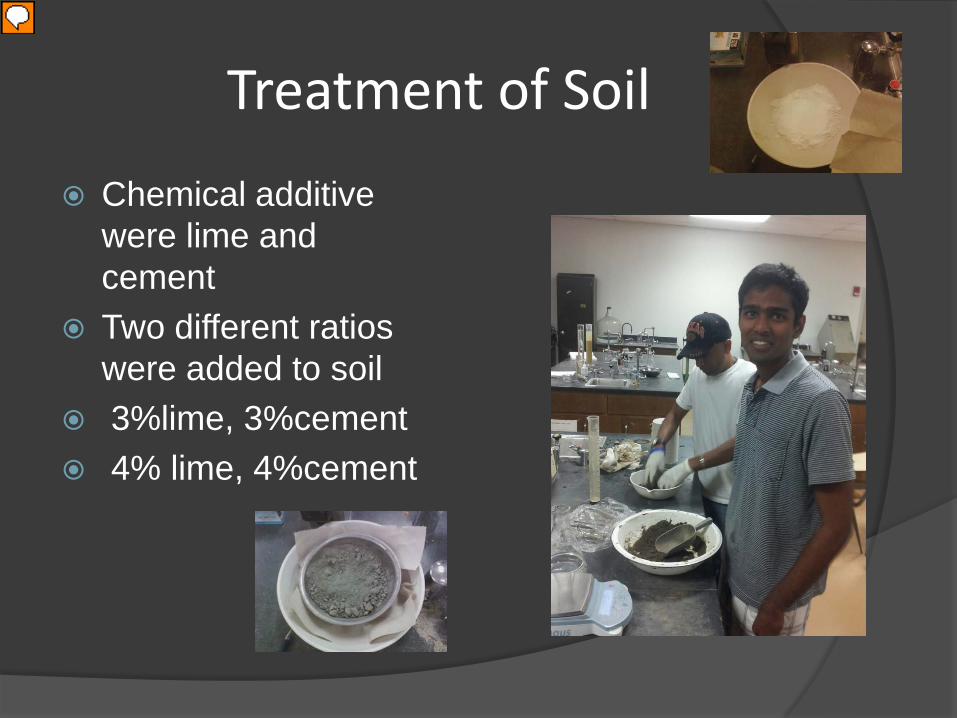
Treatment of Soil
Chemical additive were lime and cement
Two different ratios were added to soil
3%lime, 3%cement 4% lime, 4%cement
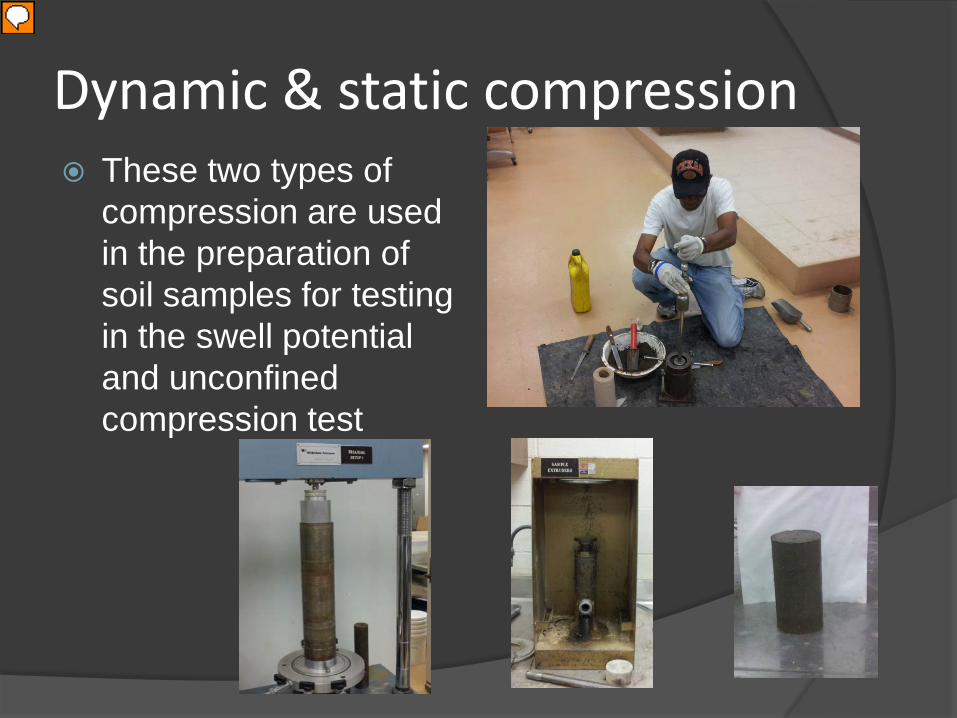
Dynamic & static compression These two types of
compression are used in the preparation of soil samples for testing in the swell potential and unconfined compression test

One dimensional swelling testone dimensional swelling test
time(min) control treated 3%lime treated 4%lime3%cement 4%cement
h= 0.983in 1.008in 1.026ind=2.495in d=2.498in d=2.500inw=139.05gm w=138.24gm w=137.29gm
0.1 0.097 0 0.175 0 0.299 00.5 0.102 0.508647 0.175 0 0.299 0
1 0.103 0.610376 0.175 0 0.299 02 0.106 0.915565 0.175 0 0.299 05 0.114 1.7294 0.175 0 0.299 0
15 0.125 2.848423 0.175 0 0.299 030 0.13 3.35707 0.175 0 0.299 060 0.135 3.865717 0.175 0 0.299 0
120 0.14 4.374364 0.175 0 0.299 01440 0.163 6.71414 0.175 0 0.299 0
10080 0.169 7.324517 0.177 0.198413 0.299 0
Swelling test graph
-1
0
1
2
3
4
5
6
7
8
0.1 1 10 100 1000 10000 100000
%1D
SW
ELL
Time (min)
% swell vs time
control
treated 3%lime & 3%cement
treated 4%lime & 4%cement
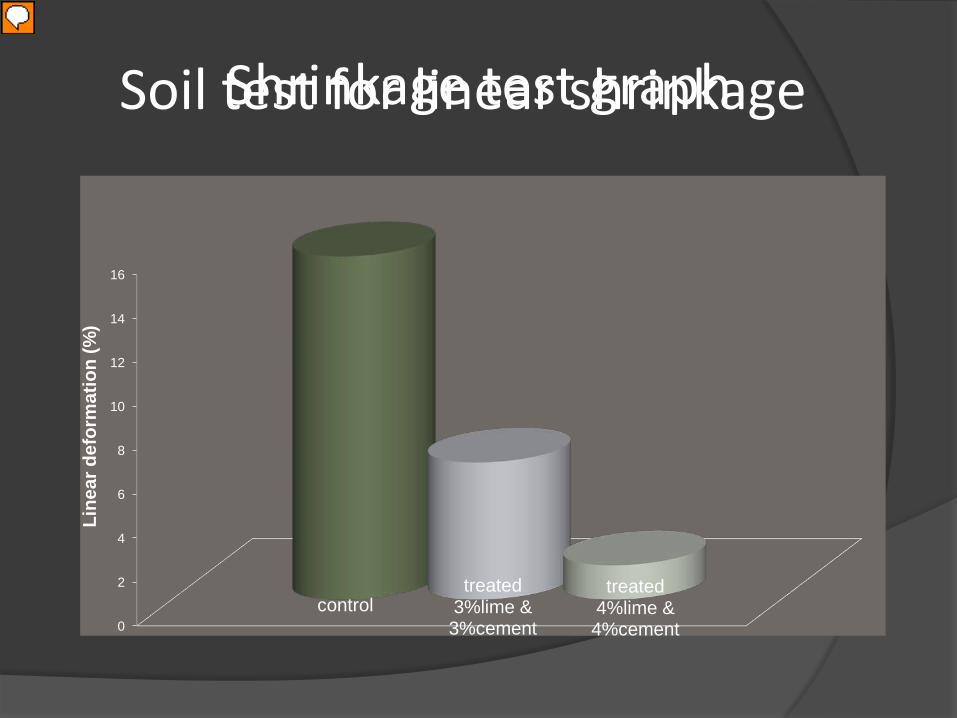
Soil test for linear shrinkage
4% lime, 4% cement
3% lime, 3% cement
control
soil test for linear shrinkage
control treated 3%lime treated 4%lime
3%cement 4%cement
soil(gm) 200 200 200
water 45% 45% 45%
initial length(mm) 12.8 12.8 12.8
final length(mm) 10.8 12 12.6
shrinks (mm) 2 0.8 0.2
linear shrinkage strain % 15.63 6.25 1.563
Shrinkage test graph
0
2
4
6
8
10
12
14
16
controltreated
3%lime &3%cement
treated4%lime &4%cement
Line
ar d
efor
mat
ion
(%)

Soil samples for Unconfined Compression Test
Soil sample stayed in moisture room at 100% humidity for 7days
UCT is than ran on samples
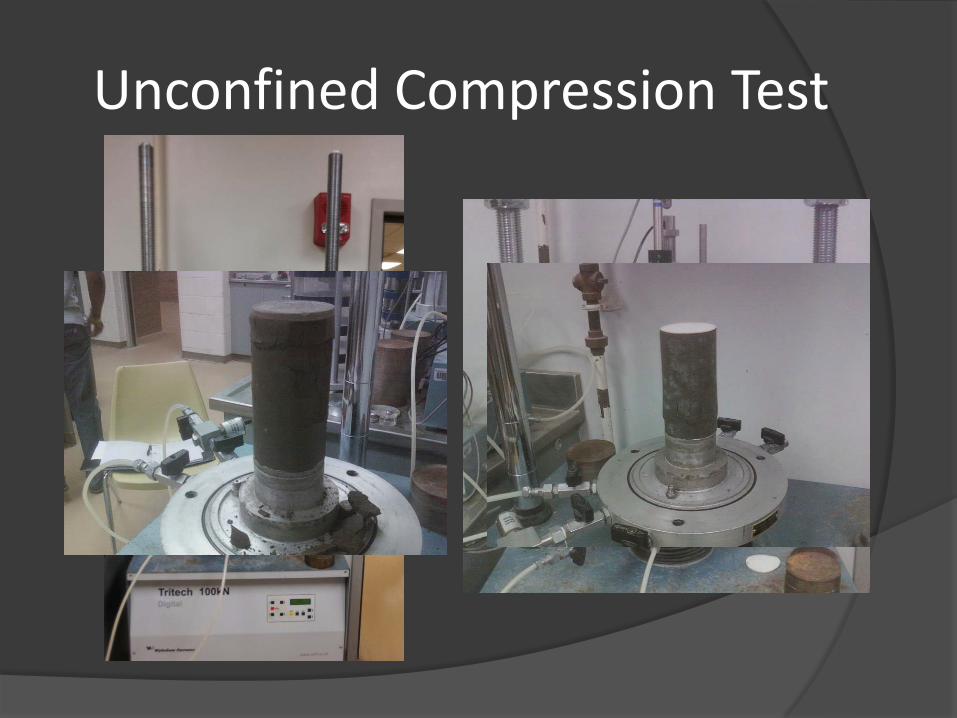
Unconfined Compression Test
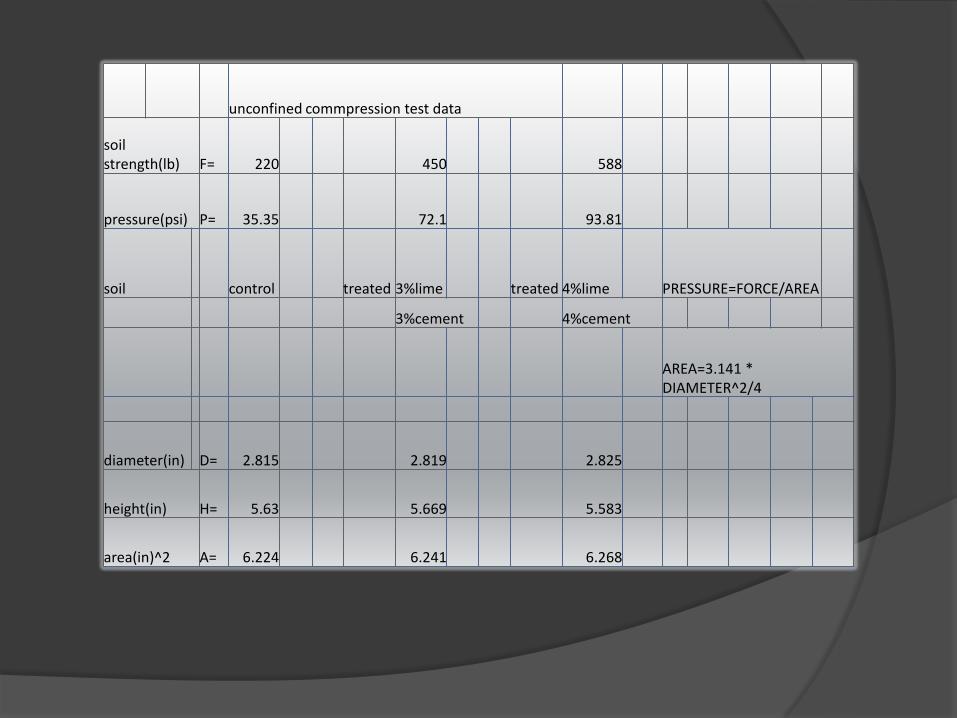
unconfined commpression test data
soil strength(lb) F= 220 450 588
pressure(psi) P= 35.35 72.1 93.81
soil control treated 3%lime treated 4%lime PRESSURE=FORCE/AREA
3%cement 4%cement
AREA=3.141 * DIAMETER^2/4
diameter(in) D= 2.815 2.819 2.825
height(in) H= 5.63 5.669 5.583
area(in)^2 A= 6.224 6.241 6.268

0
20
40
60
80
100
control
treated3%lime &3%cement
treated4%lime &4%cement
pres
sure
(psi
)
Unconfine Compression TestPressure endured before failure
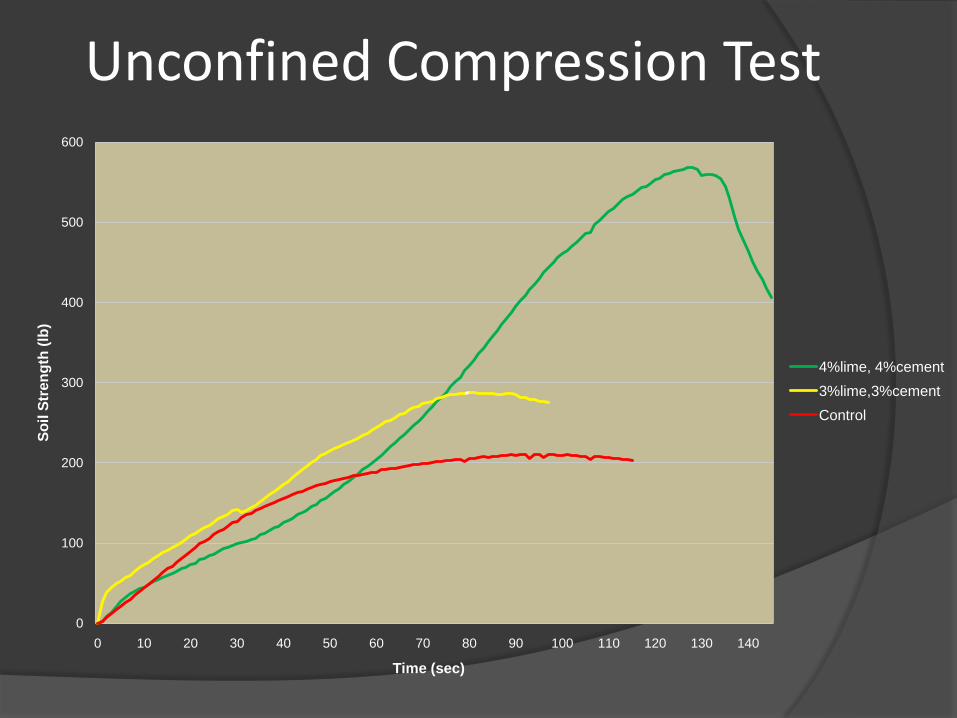
Unconfined Compression Test
0
100
200
300
400
500
600
0 10 20 30 40 50 60 70 80 90 100 110 120 130 140
Soil
Stre
ngth
(lb)
4%lime, 4%cement3%lime,3%cementControl
Time (sec)
Conclusion Soil treated or chemically altered with a 4% lime-4%
cement proved to be more stable as indicated by the test performed.
The 3% lime-3% cement treatment increased stability but not substantially compared to the 4% ratios.
Both treatments proved stronger and more stable than the control.
This research proved that lime and cement additives improved the overall qualities and performance of the soil.
Research in this field is proving invaluable to stabilization there by improving long term viability of structures.

Acknowledgments
I would like to extend a special thanks to Dr. Puppala, Aravind Pedarla, and Ranjan Rout for expertise and assistance rendered that provided me with invaluable experience also recognizing Dr. Yazdani, Dr. Daza, Dr. Weatherton, Minh Le, the University of Texas at Arlington Civil engineering Dept., University of Texas at Arlington and the National Science Foundation.
Questions