By John T. K
56
T he S uccessful I mplementation of the “OC R ecovery P roject ” at W yeth M edica I reland B y J ohn T. K enny This project is the work of John T. Kenny and was submitted in February 2009 as part of the requirements for the award of the degree of MSc (Industrial Pharmaceutical Science) of the National University of Ireland Signed byL_ brought to you by CORE View metadata, citation and similar papers at core.ac.uk provided by CUAL Repository (Connacht Ulster Alliance Libraries)
Transcript of By John T. K

T h e S u c c e s s f u l I m p l e m e n t a t i o n o f t h e “OC
R e c o v e r y P r o j e c t ” a t W y e t h M e d i c a I r e l a n d
B y J o h n T. K e n n y
This project is the work of John T. Kenny and was submitted in February 2009 as part
of the requirements for the award of the degree of MSc (Industrial Pharmaceutical
Science) of the National University of Ireland
Signed byL_
brought to you by COREView metadata, citation and similar papers at core.ac.uk
provided by CUAL Repository (Connacht Ulster Alliance Libraries)
A c k n o w l e d g e m e n t s
I would like to extend my thanks to all the members of the OC Recovery Project Team and
OC Tiger Teams, in particular Cormac Ahem for giving me the opportunity to participate and
Mervyn Martin and his amazing talent for obtaining signatures.
Special thanks go to my wife Cliona and four children Leah, Josiah, John and Daireann for
supporting me through two years of study, exams and thesis writing and re-writing.
Page 2 o f 56
T a b l e O f C o n t e n t s
GLOSSARY OF TERMS......................................................................................... 4CHAPTER 1: ABSTRACT...................................................................................... 5CHAPTER 2: INTRODUCTION............................................................................6
2.1 Program Management.............................................................................................................................................. 6
2.1.1 The interface between program management and project management..................................................6
2.2 Project Roles and Responsibilities.........................................................................................................................8
2.3 Team Development................................................................................................................................................. 10
2.4 The Project L ifecycle..............................................................................................................................................11
2.5 Stakeholder Management.......................................................................................................................................12
2.5.1 Project Stakeholder Management Strategy.................................................................................................. 15
2.6 Risk Management.......................................................................................................................................................... 15
2.6.1 Use and Benefits o f Tools for Project Risk Management........................................................................ 16
2.6.2 Risk analysis......................................................................................................................................................17
2.6.3 Risk allocation strategy.................................................................................................................................. 18
2.7 Project Communication Management..................................................................................................................19
2.7.1 Performance Reporting....................................................................................................................................19
CHAPTER 3: THE PROJECT TEAM MODEL...............................................203.1 The Project as Part o f a Functional Organisation.............................................................................................. 20
3.2 The Project as part o f a Pure Project Organisation............................................................................................ 21
3.3 The Project as part o f a Matrix Organisation...................................................................................................... 22
3.3.1 The Strong Matrix Model...............................................................................................................................22
3.3.2 The Weak Matrix M odel................................................................................................................................22
3.3.3 Advantages/Disadvantages of the Matrix M odel.......................................................................................23
CHAPTER 4: METHODOLOGY AND RESULTS......................................... 244.1 The Bulk Release Team ........................................................................................................................................25
4.1.1 Project Scope and Strategy............................................................................................................................ 25
4.1.2 Project Execution............................................................................................................................................ 27
4.2 The Tiger Team s..................................................................................................................................................... 30
4.2.1 The OC Compression Team Findings..........................................................................................................33
4.2.2 Findings o f the OC Solution Preparation/Coating Team s........................................................................37
CHAPTER 5: DISCUSSION AND CONCLUSIONS...................................... 44CHAPTER 6: FUTURE W ORK ...........................................................................49
APPENDICES:APPENDIX 1: Typical OC Bulk Release Team weekly priority list from December
2007
APPENDIX 2: References
Page 3 o f 56

G l o s s a r y o f T e r m s
o c Oral ContraceptivesPPU Primary Processing UnitWMI Wyeth Medica Irelando o s Out of StockLS Low StockPMBOK® Project Management Body of KnowledgeSOP Standard Operating ProcedureQP Qualified PersonSAPERP Systems Applications and Products Enterprise Resource PlanningMIR Manufacturing Investigation ReportLIR Laboratory Investigation ReportQA Quality AssuranceQC Quality ControlTCCR Temporary Change Control RequestCCRF Change Control Request FormBMR Batch Manufacturing RecordOE Operational ExcellenceSPC Solution Preparation/CoatingDMAIC Define, Measure, Analyse, Improve and ControlCAPA Corrective and Preventive Actions
Page 4 o f 56
C h a p t e r 1 : A b s t r a c t
Projects and project management are now in widespread use across the pharmaceutical
industry. Project size can range from something as simple as sourcing and purchasing a new
piece of office equipment to something as vast as building a 100 ,0 00m2 extension to an
existing facility.
However, the successful execution of a project can sometimes be an arduous task. A project
must be perceived as important, it must be well defined and the context well understood. It
must be planned with success in mind and similarly resourced. It must be led from the front
by a Project Manager (PM) who is used to success.
This work discusses the successful implementation of a matrix organisation project
management model, i.e. the approach taken and the results achieved. The Wyeth Medica
Ireland (WMI) oral contraceptive (OC) business generates ca. 200 million dollars net per
annum in worldwide sales and is therefore an important product portfolio. The OC Recovery
Project was initiated at WMI in order to rescue this multimillion-dollar business when it was
unable to provide finished product to a large number of customers. In a defined timeframe of
12 months the Bulk Release Team succeeded in reducing a backlog of 32 out of stock (OOS)
and 36 low stock (LS) markets to a situation where there were minimal OOS and LS markets.
A number of other project teams (known as Tiger Teams) worked simultaneously with the
Bulk Release Team to implement a process improvement and sustainability plan to help
improve first time product quality and subsequently maintain customer service.
The approach adopted by the OC Recovery Project was two-pronged. Firstly, the OOS
markets were replenished through the action of the Bulk Release Team, and secondly, upon
dissolution of this team, customer service was sustained through the process improvements
made by the Tiger Teams. The matrix models that were employed in this process greatly
facilitated these results.
Page 5 o f 56
C h a p t e r 2 : I n t r o d u c t io n
The Project Management Process at WMI is described via SOP. To better understand the
process it is necessary to review and examine current Project Management terminology and
methodology. In light of this examination it will then be possible to better view the project
management process and analyse the existing models at WMI.
2.1 Program ManagementProgram Management can be defined as “the integration and management of a group of
related projects with the intent of achieving benefits that would not be realized if they were
managed independently” (Lycett et al. 2004, pp.289-299). Significant tensions tend to arise
between the inward-focused and task-oriented view of projects and strategy-focused and often
emergent wider organizational view. There is an increasing recognition that programme
management provides a means to bridge the gap between project delivery and organizational
strategy.
A program exists to create value by improving the management of projects in isolation
(Pellegrini 1997, pp. 141-149). Thus, while they create benefits through better organization of
projects, they do not in themselves deliver individual project objectives. The fundamental
goals of program management can be categorized two-fold:
• Efficiency and effectiveness goals: Aspects of management that a proficient project
manager should address, even in the cases where related projects are undertaken
without overall co-ordination. It is believed that a general improvement in
management efficiency and effectiveness can be achieved by taking an integrated
approach to these particular aspects of management.
• Business focus goals: The external alignment of projects with the requirements, goals,
drivers and culture of the wider organization. These goals are associated with defining
an appropriate direction for the constituent projects within a program as well as for the
program as a whole.
2.1.1 The interface between program management and project management
Standard approaches to program management strive to obtain an inappropriate level of detail
driven by a desire to exercise an inappropriate degree of control. This tends to lead to systems
Page 6 o f 56

of program planning and control that are complex to the point of becoming unmanageable.
Two negative consequences arise as a result:
• Excessive hierarchical bureaucracy and control: It can be very difficult to achieve an
appropriate balance between excessive control and insufficient control in a multi
project context (Partington 1996, pp. 13-21). The negative consequences of an overly
bureaucratic approach to program management are: (a) a deterioration of the
relationship between PMs and program managers encouraging a culture of blame and
(b) diversion of energy from value adding activities.
• Focus on an inappropriate level of detail: Large integrated plans/networks are difficult
to formulate and have a tendency to become cumbersome and excessively complex.
By focusing at an inappropriate level of detail, there is a real risk that program
managers will fail to identify the issues that are of real significance to the program.
Consequently, the focus at the program level should be on the interfaces between
projects (Levene & Braganza 1996, pp.331-339). This is important given that
interdependencies often become associated with issues of ownership.
Figure 1: Key program management relationships and goals (Levene & Braganza, 1996).
Key relationships are:
(a) Between program management and project management,
Page 7 o f 56
(b) Individual PMs within a program and
(c) Individual projects and the goals and drivers of the wider business.
Figure 1 ties these relationships to the fundamental goals of program management.
2.2 Project Roles and Responsibilities
The Project Team: is the group responsible for planning and executing the project. It consists
of a PM and a number of project team members, who are brought in to deliver their tasks
according to the project schedule.
The Project Manager (PM): is the person responsible for ensuring that the Project Team
completes the project. The PM develops the project plan with the team and manages the
team’s performance of project tasks. It is also the responsibility of the PM to secure
acceptance and approval of deliverables from the project sponsor and stakeholders. The PM is
responsible for communication, including status reporting, risk management, escalation of
issues that cannot be resolved in the team, and, in general, making sure the project is delivered
in budget, on schedule, and within scope.
The Project Team Members: are responsible for executing tasks and producing deliverables as
outlined in the Project Plan and directed by the PM, at whatever level of effort or participation
has been defined for them.
On larger projects, some Project Team members may serve as Team Leads, providing task
and technical leadership, and sometimes maintaining a portion of the project plan.
The Project Sponsor and/or Project Director: is a manager with demonstrable interest in the
outcome of the project who is responsible for securing spending authority and resources for
the project. The Project Sponsor acts as a vocal and visible champion, legitimizes the
project’s goals and objectives, keeps abreast of major project activities, and is a decision
maker for the project. The Project Sponsor will participate in and/or lead project initiation; the
development o f the Project Charter. He or she will participate in project planning (high level)
and the development of the Project Initiation Plan. The Project Sponsor provides support for
the PM; assists with major issues, problems, and policy conflicts; removes obstacles; is active
in planning the scope; approves scope changes; signs off on major deliverables; and signs off
on approvals to proceed to each succeeding project phase. The Project Sponsor generally
Page 8 o f 56

chairs the steering committee on large projects. The Project Sponsor may elect to delegate any
of the above responsibilities to other personnel either on or outside the Project Team
The Steering Committee: generally includes management representatives from the key
organizations involved in the project oversight and control, and any other key stakeholder
groups that have special interest in the outcome of the project. The Steering committee acts
individually and collectively as a vocal and visible project champion throughout the
representative organizations; generally the committee members approve project deliverables,
help resolve issues and policy decisions, approve scope changes, and provide direction and
guidance to the project. Depending on how the project is organized, the steering committee
can be invoLved in providing resources, assist in securing funding, act as liaisons to executive
groups and sponsors, and fill other roles as defined by the project.
Customers: comprise the business units that identified the need for the product or service the
project will develop. Customers can be at all levels of an organization. Since it is frequently
not feasible for all the Customers to be directly involved in the project, the following roles are
identified:
• Customer Representatives: are members of the customer community who are
identified and made available to the project for their subject matter expertise. Their
responsibility is to accurately represent their business units’ needs to the Project Team,
and to validate the deliverables that describe the product or service that the project will
produce. Customer Representatives are also expected to bring information about the
project back to the customer community. Towards the end of the project, Customer
Representatives will test the product or service the project is developing, using and
evaluating while providing feedback to the Project Team.
• Customer Decision-Makers: are those members of the customer community who have
been designated to make project decisions on behalf of major business units that will
use, or will be affected by, the product or service the project will deliver. Customer
Decision-Makers are responsible for achieving consensus of their business unit on
project issues and outputs, and communicating it to the PM. They attend project
meetings as requested by the PM, review and approve process deliverables, and
provide subject matter expertise to the Project Team. On some projects they may also
serve as Customer Representatives or be part of the Steering Committee.
Page 9 o f 56

The Stakeholders: are all those groups, units, individuals, or organizations, internal or external
to the organization, which are impacted by, or can impact, the outcomes of the project. This
includes the following:
• Project Team, Sponsors, Steering Committee, customers, and customer co-workers
who will be affected by the change in customer work practices due to the new product
or service.
• Customer managers affected by modified workflows or logistics.
• Customer correspondents affected by the quantity or quality of newly available
information.
• Other similarly affected groups.
2.3 Team Development
Regardless if one is a team leader or a team member, in order to function effectively in a team
it is important that one understands that all teams progress through stages of development.
The leader needs to predict what stage the team is at and then apply behaviours that will be
most effective in enhancing the team’s performance.
Research has shown that teams tend to develop through four stages (Tuckman, 1965) they are:
• Forming
• Storming
• Norming
• Performing
Forming Stage: The team is faced with the need to become more acquainted with its
members, purposes and boundaries. Relationships must be formed and trust established. The
team begins to establish ground rules by trying to find out what behaviours are acceptable
with respect to both the project and interpersonal relations. This stage is complete once team
members begin to think of themselves as part of a group.
Storming Stage: The team is faced with disagreements, counter-dependence and the need to
manage conflict. Challenges include violations of team norms and expectations and
overcoming group thinking. Focusing of process improvements, recognizing team
achievement and fostering win-win relationships are needed from team leaders.
Page 10 o f 56

Norming Stage: The team is faced with creating cohesion and unity, differentiating roles,
identifying expectations for members and enhancing commitment. The team leaders provide
supportive feedback and foster a commitment to a vision.
Performing Stage: The team is faced with the need for continuous improvement, innovation,
speed and the capitalization of core competencies. Sponsoring team members, new ideas,
orchestrating their implementation and fostering extraordinary performance are needed from
the team leaders (Gray & Larson 2005, p.344).
Figure 2 details the management skills required for high performing teams, with particular
emphasis on forming, norming, storming and performing during team development.
Figure 2: Management skills for high performing teams (Whetton & Cameron 2005, p.412)
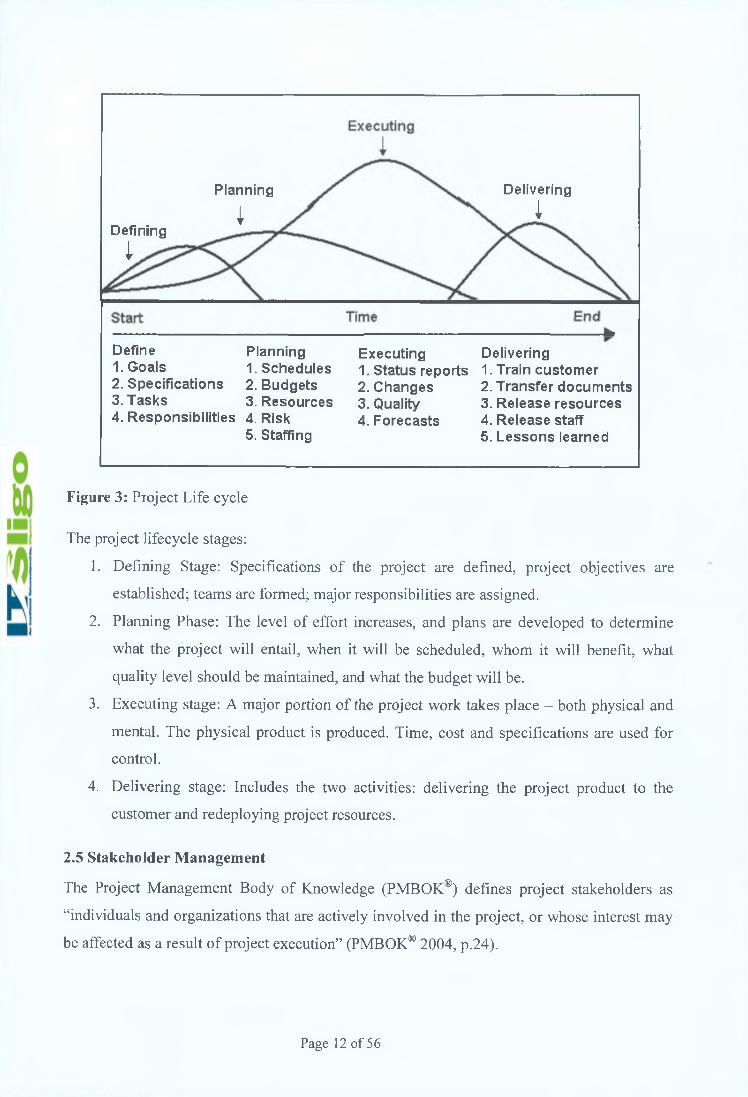
2.4 The Project Lifecycle
Within a project lifecycle there are predictable changes in the level of effort and focus over
the life of a project. There are many different life cycle models depicted in project
management literature, most of which are specific to a particular industry. Below Figure 3
depicts a generic lifecycle by Gray & Larson (2005, p.7).
Page 11 o f 56
Defining
I
Planning
IDelivering
I
Define1. Goals2. Specifications3. Tasks4. Responsibilities
Planning1. Schedules2. Budgets3. Resources4. Risk5. Staffing
Executing1. Status reports2. Changes3. Quality4. Forecasts
Delivering1. Train customer2. Transfer documents3. Release resources4. Release staff5. Lessons learned
Figure 3: Project Life cycle
The project lifecycle stages:
1. Defining Stage: Specifications of the project are defined, project objectives are
established; teams are formed; major responsibilities are assigned.
2. Planning Phase: The level of effort increases, and plans are developed to determine
what the project will entail, when it will be scheduled, whom it will benefit, what
quality level should be maintained, and what the budget will be.
3. Executing stage: A major portion of the project work takes place - both physical and
mental. The physical product is produced. Time, cost and specifications are used for
control.
4. Delivering stage: Includes the two activities: delivering the project product to the
customer and redeploying project resources.
2.5 Stakeholder Management
The Project Management Body of Knowledge (PMBOK®) defines project stakeholders as
“individuals and organizations that are actively involved in the project, or whose interest may
be affected as a result of project execution” (PMBOK® 2004, p.24).
Page 12 o f 56

McElroy and Mills (2003, pp.99-118) define stakeholder management in projects as “the
continuing development of relationships with stakeholders for the purpose of achieving a
successful project outcome” To achieve a successful outcome the first step is to identify the
project stakeholders. Jepsen & Eskerod (in press) describe the following process from their
research that should be followed to analyze the stakeholders on a project:
1. Identify the (important) stakeholders.
2. Characterize the stakeholders pointing out their:
(a) Needed contributions
(b) Expectations concerning rewards for contributions
(c) Power in relation to the project
3. Make a decision about which strategy to use to influence each stakeholder.
Andersen et al. (2004) as cited in Jepsen & Eskerod (in press), suggest presenting the results
of the stakeholder analysis in an outline like the one displayed in Figure 4. The stakeholders
should be listed along with their area of interest (their stake). Furthermore, necessary
contributions along with each Stakeholder’s expectations in the form of rewards from the
project as well as their power in relation to the project should be inserted. Finally, the
appropriate strategy for influencing each stakeholder and the person responsible for
implementing the strategy should be added.
S tak eh old er A rea o f
in terest
C ontributions E xp ectation s P o w er S trategy R esponsib le
Figure 4: Stakeholder analysis table
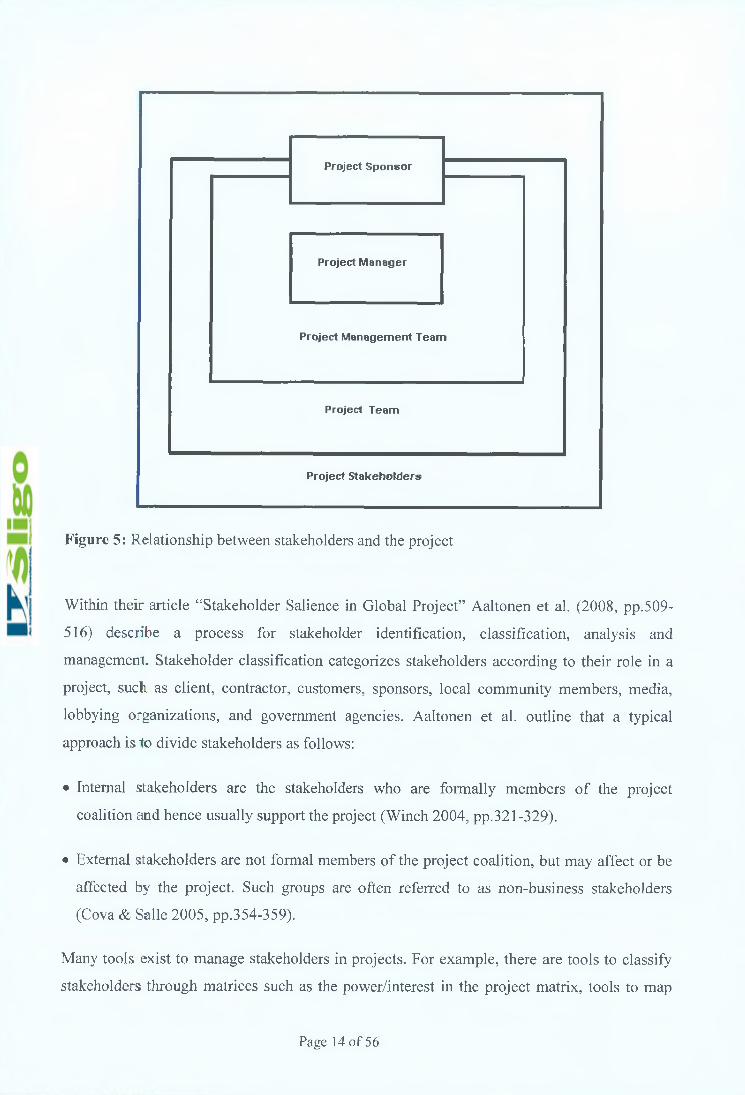
The PMBOK® directs that the project management team must identify the stakeholders,
determine their requirements, expectations and to the extent possible, manage their influence
in relation to the requirements to ensure a successful project. Figure 5 illustrates the
relationship between stakeholders and the project team (PMBOK® 2004, p.25).
Page 13 o f 56
Project Sponsor
Project Manager
Project M anagem ent Team
Project Team
Project Stakeholders
Figure 5: Relationship between stakeholders and the project
Within their article “Stakeholder Salience in Global Project” Aaltonen et al. (2008, pp.509-
516) describe a process for stakeholder identification, classification, analysis and
management. Stakeholder classification categorizes stakeholders according to their role in a
project, such as client, contractor, customers, sponsors, local community members, media,
lobbying organizations, and government agencies. Aaltonen et al. outline that a typical
approach is to divide stakeholders as follows:
• Internal stakeholders are the stakeholders who are formally members of the project
coalition and hence usually support the project (Winch 2004, pp.321-329).
• External stakeholders are not formal members of the project coalition, but may affect or be
affected by the project. Such groups are often referred to as non-business stakeholders
(Cova & Salle 2005, pp.354-359).
Many tools exist to manage stakeholders in projects. For example, there are tools to classify
stakeholders through matrices such as the power/interest in the project matrix, tools to map
Page 14 o f 56
whether stakeholders are promoting or opposing the project, and tools to categorize, visualize,
and identify different stakeholder attributes such as Stakeholder Circle (Aaltonen et al., 2008).
2.5.1 Project Stakeholder Management Strategy
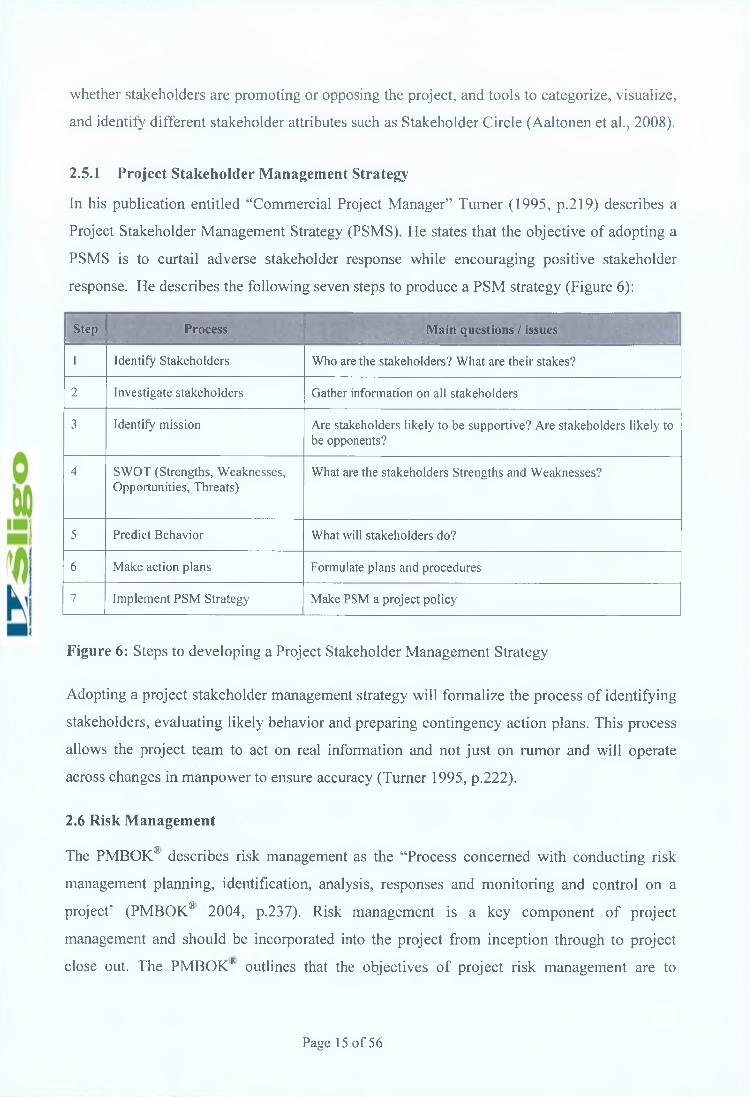
In his publication entitled “Commercial Project Manager” Turner (1995, p.219) describes a
Project Stakeholder Management Strategy (PSMS). He states that the objective of adopting a
PSMS is to curtail adverse stakeholder response while encouraging positive stakeholder
response. He describes the following seven steps to produce a PSM strategy (Figure 6 ):
Step Process Main questions / issues
1 Identify Stakeholders Who are the stakeholders? What are their stakes?
2 Investigate stakeholders Gather information on all stakeholders
3 Identify mission Are stakeholders likely to be supportive? Are stakeholders likely to be opponents?
4 SWOT (Strengths, Weaknesses, Opportunities, Threats)
What are the stakeholders Strengths and Weaknesses?
5 Predict Behavior What will stakeholders do?
6 Make action plans Formulate plans and procedures
7 Implement PSM Strategy Make PSM a project policy
Figure 6: Steps to developing a Project Stakeholder Management Strategy
Adopting a project stakeholder management strategy will formalize the process of identifying
stakeholders, evaluating likely behavior and preparing contingency action plans. This process
allows the project team to act on real information and not just on rumor and will operate
across changes in manpower to ensure accuracy (Turner 1995, p.222).
2.6 Risk Management
The PMBOK® describes risk management as the “Process concerned with conducting risk
management planning, identification, analysis, responses and monitoring and control on a
project' (PMBOK® 2004, p.237). Risk management is a key component of project
management and should be incorporated into the project from inception through to project
close out. The PMBOK8 outlines that the objectives of project risk management are to
Page 15 o f 56

increase the probability of positive events, and decrease the probability and impact of events
adverse to the project.
The PMBOK8 describes the following Project Risk Management process:
Risk Management Planning: deciding how to approach, plan and execute the risk management
activities fora project.
Risk Identification: determining which risks might affect the project and documenting their
characteristics.
Qualitative Risk Analysis: prioritizing risk for subsequent further analysis or action by
assessing and combining their probability of occurrence and impact.
Quantitative Risk Analysis: numerically analyzing the effect on overall project objectives of
identified risks.
Risk Monitoring and Control: tracking identified risk, monitoring residual risk, and
identifying new risk, executing risk responses plans, and evaluating their effectiveness
throughout the project lifecycle.
A project risk can be defined as an ‘uncertain event or condition that, it occurs, has a positive
or a negative effect on at least one project objective, such as time, cost, scope or quality’ A
risk may have one or more causes and if it occurs, one or more impacts (PMBOK® 2004,
p.238).
2.6.1 Use and B enefits o f Tools for Project R isk M anagem ent
Within the “Use and Benefits of Tools for Project Risk Management” Raz & Michael (2001,
pp.9-17) list a number of variations of Project Risk Management (PRM) processes in use. The
following points list the various processes discussed within the journal:
• Boehm (1991, pp.32-41) suggested a process consisting of two main phases: risk
assessment, which includes identification, analysis and prioritization, and risk control,
which includes risk management planning, risk resolution and risk monitoring planning,
tracking and corrective action.
Page 16 of 56

• Fairley (1994, pp.57-67) talks about seven steps: (1) Identify risk factors; (2) Assess risk
probabilities and effects; (3) Develop strategies to mitigate identified risks; (4) Monitor risk
factors; (5) Invoke a contingency plan; (6 ) Manage the crisis; (7) Recover from the crisis.
• The Software Engineering Institute (Dorofee et al., 1996), a leading source of
methodologies for managing software development projects, looks at project risk
management as consisting of five distinct phases (identification, analysis, response
planning, tracking and control) linked by an ongoing risk communications effort.
• Kliem & Ludin (1997) describe a four-phase process (identification, analysis, control and
reporting) that parallels Deming's four steps for quality management (plan, do, check and
act).
• Chapman & Ward (1997) outline a generic PRM process consisting of nine phases: define
the key aspects of the project; focus on a strategic approach to risk management; identify
where risks might arise; structure the information about risk assumptions and relationships;
assign ownership of risks and responses; estimate the extent of uncertainty; evaluate the
relative magnitude of the various risks; plan responses and manage by monitoring and
controlling execution.
It is evident from the review conducted by Raz & Michael (2001) that there is “general
agreement regarding what is included in the process, with the differences depending on
variations in the level of detail and on the assignment of activities to steps and phases”.
2.6.2 R isk analysis
By analyzing risks based on their potential consequences and probability of occurrence it is
possible to rank/prioritize the risks that are more important. When the risks have been
identified the next step is to analyze the risks. This process is “a vital link between systematic
identification of risks and rational management of the significant ones” (Al-Bahar & Crandall,
1990). Once the risks have been identified and analyzed it is then possible to rank them and
action those risks that are pertinent to the project deliverables.
Page 17 of 56

2.6.3 Risk allocation strategy
According to Ward & Chapman (1991, pp. 140-147), several conditions must be satisfied to determine whether project risks have been properly allocated or not. These conditions are:
• Risk should be allocated to the party with the best capability to control the events that might trigger its occurrence.
• Risks must be properly identified, understood and evaluated by all parties.
• A party must have the technical/managerial capability to manage the risks.
• A party must have the financial ability to sustain the consequences of the risk or to prevent
the risk from occurring.
• A party must be willing to accept the risk.
These conditions must be evaluated against each owner before allocating a project risk to a
particular owner. It is important to determine which party (who) has the best capabilities to
accept the risk (what). The when and how factors should be considered to ensure proper risk
allocation as shown in Figure 7 (Baccarini & Archer 2001, pp. 139-145).
Figure 7: Risk Allocation Strategy
Page 18 of 56
2.7 Project Communication Management
The PMBOK describes project communication management as the knowledge area that
employs the processes required to ensure the timely and appropriate generation, collection,
distribution, storage, retrieval and ultimate disposition of project information.
The Project Management Communication Process includes the following:
• Communication Planning: Determining the information and communications needs of the project stakeholders.
• Information Distribution: Making needed information available to project stakeholders in a timely manner.
• Performance Management: Collecting and distributing performance information. This includes status reporting, progress measurement and forecasting.
• Manage Stakeholders: Manage communications to satisfy the requirements of and resolve issues with stakeholders (PMBOK® 2004, p.221 ).
2.7.1 Perform ance R eporting
The performance reporting process involves the collection of all baseline data, and
distribution of performance information to stakeholders. Performance information includes
how resources are being used to achieve project objectives. Performance reporting should
provide information on scope, schedule, cost and quality (PMBOK® 2004, p.231 ). Common
formats for performance reports include bar charts, S-curves, histograms and tables. Earned
value analysis data is often included as part of performance reporting (PMBOK® 2004,
p.233).
Page 19 of 56
C h apter 3 : T he P roject T eam M o del
Merdith & Mantel (2006, pp.185-199) describe three major project organisational forms and
how they fit in with the parent organisation.
3.1 The Project as Part o f a Functional O rganisation
Projects can be housed in a number of different areas within the parent organisation. One
option is to make the project part of a functional division, for example, a systems installation
project could be based in the Information Services Department. The major advantages of this
method of housing a project are:
• There will be maximum flexibility in the use of staff with personnel being assigned to the
project and re-assigned back to the normal work as and when required.
• Individual experts within the function can be used by many different projects.
• The depth of knowledge within the function can be easily accessed and used to solve
technical problems.
• The function retains technological know-how even when team members leave the project.
• The functional organisation serves to encourage personnel involved in team activities by
containing the normal course of advancement which the team member may pursue apart
from project activity.
The major disadvantages of this method are:
• The client is not the focus of concern as the functional unit has its own routine work to
carry out.
• Sometimes no individual is given full responsibility for the project leading to a lack of
coordination.
• This lack of coordination can lead to slow response times to client needs.
Page 20 of 56
• The project can be sub-optimised or even totally ignored as its goals may not relate to
normal functional interests.
• Motivation of personnel to complete the project may be weak and project activities seen
as a professional detour.
• The functional organisational approach is not holistic and does not lend itself to cross
functional collaboration.
3.2 The Project as part o f a Pure Project O rganisation
A pure project organisation exists at the opposite end of the spectrum from the Functional
Organisation. The project is separate from the rest of the organisation and is self-contained
with its own personnel. The advantages of this model are as follows:
• The PM has full authority and is basically the head of a ‘department’ dedicated to the
project. The project is the point of focus.
• Project personnel report solely to the PM with little or no consultation required from other
functional heads.
• Pure Project Organisations retain a more or less permanent group of experts who have
developed much skill in certain areas, e.g., problem solving.
• The project team tends to be highly focused on and committed to the task in hand.
• The structural organisation tends to be simple, flexible and easy to understand.
• A systems approach is taken whereby the project is considered as a whole and the focus is
not placed on optimisation of the project’s sub-systems.
There are also some disadvantages to this system:
• Where several project teams exist there can be duplication of effort in every area thus
leading to severe inefficiency.
• The PM may stockpile technical experience and equipment just in case they are needed,
thus making the project very expensive to fund.
• Highly technological projects may require the services of the function most closely
associated with the project but access may not be readily available due to the pure project
structure.
Page 21 of 56

• Normal policies and procedures may be abandoned due to urgent needs of the project but
this can lead to administrative and procedural errors.
• Team members on projects can form strong attachments to the project as it grows and
“projectitis” may ensue whereby there is infighting amongst project personnel and a we-
they attitude pervades.
• There can be much concern amongst team members as to what happens when the project
ends.
3.3 The Project as part o f a M atrix O rganisation
The Matrix Organisation model was developed in an attempt to couple the advantages of the
functional and pure project models and avoid some of the disadvantages of each. A matrix
organisation can basically take any form that lies along the spectrum between the functional
and pure project models. A strong matrix organisation most closely resembles the pure project
form, whereas a weak matrix organisation bears more similarity to the functional form. An
almost infinite variety of organisational forms exists between the strong/weak matrix
extremes.
3.3.1 T he Strong M atrix M odel
In this model the project team is not separated from the main organisation, as is the case with
the pure project model. The PM usually reports to a Program Manager (described in Chapter
2) who is normally responsible for other projects also. It is not uncommon however for the
PM to report to a manager with a particular interest in the project. Individuals are assigned to
the project on either a full-time or part-time basis from their respective functional
departments. Meredith and Mantel (2006, pp. 185-199) emphasise that “the PM controls when
and what these people will do, while the functional managers control who will be assigned to
the project and what technology will be used”.
3.3.2 The W eak M atrix M odel
This model may only employ one full-time member, e.g., the PM. Rather than functional
personnel being assigned to the project on a part-time or full-time basis, capacity to the
project is devoted with the PM coordinating the activities carried out by the function.
Page 22 of 56
The matrix approach represents a synergistic combination of the best parts of the functional
and pure project models:
• The PM is responsible for bringing the project in on-time and within budget having
achieved what it set out to do. The project is the point of focus, as with the pure project
model.
• Because of the matrix structure, the project has reasonable access to all technologies
across the functions. Also, as certain functional personnel may be involved in several
projects it reduces the duplication of work that often exists in the pure project structure.
• Personnel are less concerned about post-project work as they are still part of a function.
• The response to client needs is as rapid as the pure project response while this form is also
capable of response to the demands of the parent organisation.
• When several projects are simultaneously underway, the matrix model allows the
company to better balance resources to meet the goals of the individual projects.
• The matrix organisation model provides a middle ground between the extremes of the
functional and pure project organisational models. There is also great flexibility regarding
the organisation of the project, with the parent organisation having much scope to adjust
the model to suit the project needs.
The disadvantages of the matrix model mainly involve conflict between the PM and other
functional managers. They are as follows:
• Within the matrix organisation there is a need for a balance of power between the
functional manager and the PM. This balance is sometimes very delicate and can lead to
ambiguity as to who is really leading the project this causing the project to suffer.
• The ability of the matrix organisation to balance the time, cost and performance of several
projects has a flip-side. The projects require careful management with sharing of resources
between projects possibly leading to political infighting.
• A strong matrix model can suffer from the same “projectitis” complaint as the pure project
model with project identity being very strong and projects refusing to die.
• Problems may arise when the PM’s negotiating skills are not sufficient to secure adequate
resources and technical assistance from the relevant functional manager’s department.
3.3.3 Advantages/Disadvantages of the Matrix Model
Page 23 of 56
C h apter 4 : M ethodology A nd R esults
Wyeth Medica Ireland (WMI) was established in Newbridge, Co. Kildare in 1992. The
company currently employees over 1300 people in a facility of over 100,000m2. WMI is
considered a centre of excellence for the global and regional supply of existing products.
WMI currently manufactures a range of products to over 100 markets, covering Europe,
Africa, Australia, Asia and Latin America. The facility produces over 140 different product
formulations packaged in approximately 800 different pack-to-market presentations.
The key products manufactured at WMI include:
• Hormone Replacement
• Oral Contraceptives
• Cardiovascular
• Gastrointestinal
• Central Nervous System
• Antibiotics
Of the products above the Oral Contraceptives (OCs) product range makes up approximately
30% of the volume manufactured on site. At present the OC product portfolio faces intense
competition from its competitors; both generic and non-generic manufactures are producing
the product at a reduced cost.
During the first four months of 2007 the OC Primary Processing Unit (PPU) began to
encounter a number of “roadblocks” which led to the 32 OOS and 36 LS markets described in
Figure 8 below. At this point a decision was made by the PPU to request the formation and
implementation of a Bulk Release Team and three Tiger Teams. Many of the tools and
methodologies described in the project management processes in Chapter 2 were employed as
a framework for the establishment and success of the projects. The WMI SOP on project
management (PPG-00025977 “Project Management Process”) provided definition and
guidance on the roles, responsibilities and life cycles for the projects.
Page 24 of 56
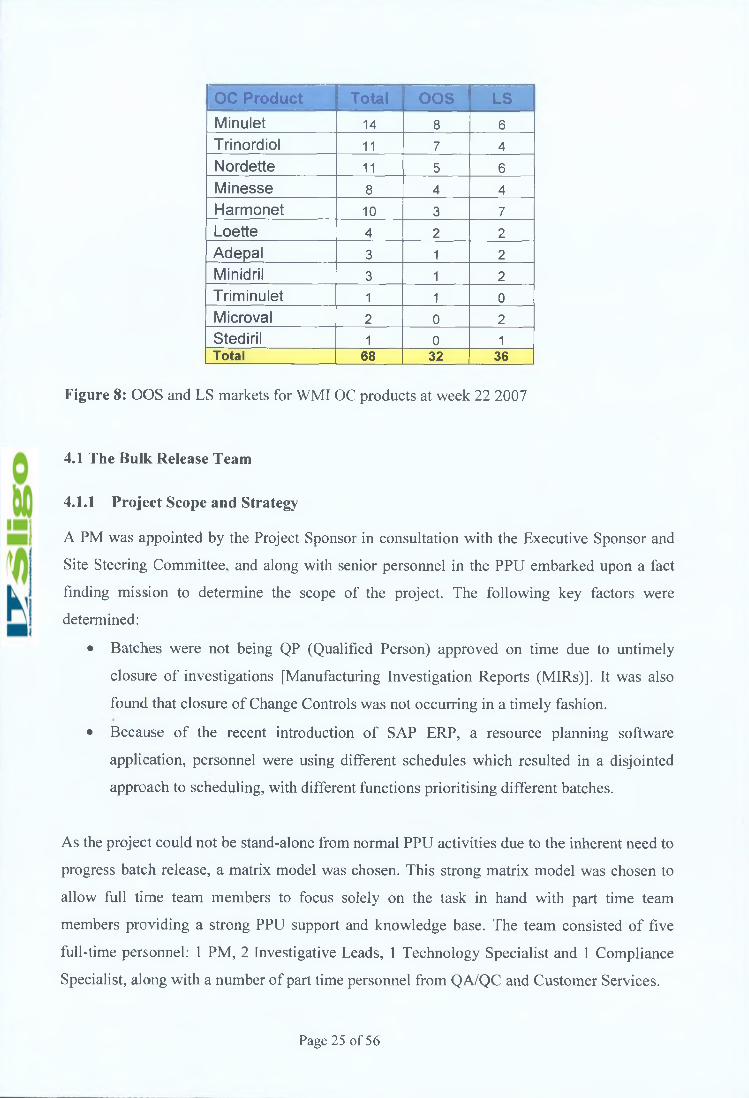
OC Product Total OOS LSMinulet 14 8 6Trinordiol 11 7 4Nordette 11 5 6Minesse 8 4 4Harmonet 10 3 7Loette 4 2 2Adepal 3 1 2Minidril 3 1 2Triminulet 1 1 0Microval 2 0 2Stediril 1 0 1Total 68 32 36
Figure 8: OOS and LS markets for WMI OC products at week 22 2007
4.1 The B u lk R elease Team
4.1.1 P roject Scope and Strategy
A PM was appointed by the Project Sponsor in consultation with the Executive Sponsor and
Site Steering Committee, and along with senior personnel in the PPU embarked upon a fact
finding mission to determine the scope of the project. The following key factors were
determined:
• Batches were not being QP (Qualified Person) approved on time due to untimely
closure of investigations [Manufacturing Investigation Reports (MIRs)]. It was also
found that closure of Change Controls was not occurring in a timely fashion.
• Because of the recent introduction of SAP ERP, a resource planning software
application, personnel were using different schedules which resulted in a disjointed
approach to scheduling, with different functions prioritising different batches.
As the project could not be stand-alone from normal PPU activities due to the inherent need to
progress batch release, a matrix model was chosen. This strong matrix model was chosen to
allow full time team members to focus solely on the task in hand with part time team
members providing a strong PPU support and knowledge base. The team consisted of five
full-time personnel: 1 PM, 2 Investigative Leads, 1 Technology Specialist and 1 Compliance
Specialist, along with a number of part time personnel from QA/QC and Customer Services.
Page 25 of 56

P r o j e c t M a n a g e r
QA/QC personnel and
Customer Services
_ _ ___________
Figure 9: Reporting structure for Batch Release Team. ■ = Full Time, ■ = Part Time
The Investigation Leads were chosen from the Packaging and Processing Supervisor group
with a remit to close all existing MIRs and also to close any newly generated MIRs within 15
calendar days, which was well within the allowed investigation closure time of 30 days from
date initiated. The Processing Investigation Lead (the author) had a strong Quality Control
(QC) background having spent 5 years as an analyst and group leader in the QC laboratories
at WMI. This facilitated closure of Quality related MIRs that resulted from out of
specification and out of trend QC results. For example, a low assay result would merit a
Laboratory Investigation Report (LIR). If this LIR concluded that the root cause was not QC
related then an MIR would be raised to investigate possible active loss during, for example,
granulation or compression. The necessity for this type of expertise will be discussed in the
next section.
The Technology Specialist was recruited on to the team to close out existing temporary
change controls (TCCRs) and permanent change controls (CCRFs). As most of these change
controls related to process changes/deviati^s and validation it was paramount that the
candidate had process development and validation experience. The chosen candidate also
began his career as a compression operator in OC Processing thus adding to his suitability for
the role.
The Compliance Specialist role was multi-faceted and included aspects such as: general
Quality oversight for project related activities, participation in discussion on LIR, MIR and
change control strategy, support in the reporting of project metrics to the site leadership team
ProcessingInvestigation
Lead
PackagingInvestigation
Lead
TechnologySpecialist
ComplianceSpecialist
Page 26 of 56
and Quality liaison for the team with other functions. This candidate had previous experience
in QA, QC and Processing/Packaging.
QA/QC and Customer Services personnel were seconded to work part time for the Bulk
Release Team thus enhancing the general support structure around the team by facilitating
LIR closure, conveying customer expectations and developing weekly schedules based on a
balance between immediate customer requirements and the longer term project goals of
reducing the OOS and LS backlog.
The PM had general oversight of the project team and took special responsibility for a daily
morning meeting involving all team members which looked specifically at how the team
would meet its primary objectives.
4.1.2 Project E xecution
The Bulk Release Team began its year-long mandate in June 2007. By this time the number of
OOS markets had risen to 38 and the number of LS markets was at 39, see Figure 26 in
Discussion and Conclusions section. Depending on the size of particular customer orders, a
number of packaging orders, e.g., 5 to 10, may be fulfilled from one bulk batch. On the other
hand, if an order was large a full bulk batch (7 million tablets for a sugar coated formulation)
may fulfil just a single order. With this in mind, the Investigation Leads started work on the
ten open MIRs (see Figure 10) by prioritising the ones that would address the most OOS
markets while also considering MIRs that were due to be raised for ongoing issues.
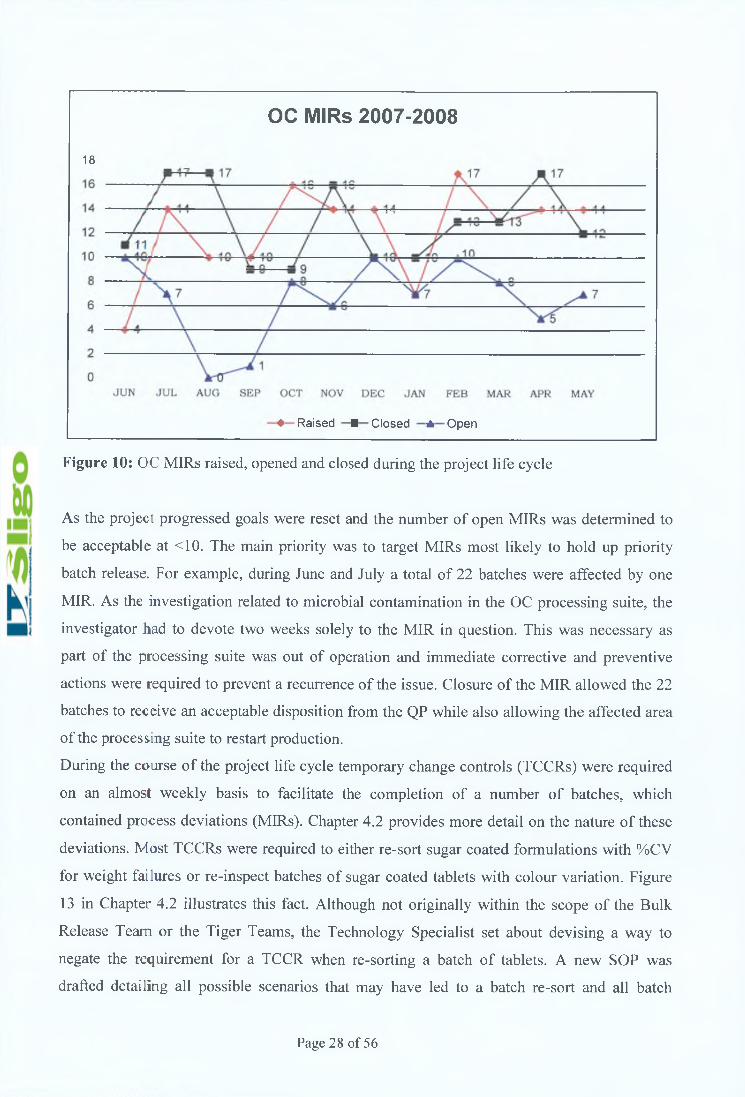
Figure 10 shows the unpredictable nature of MIRs for OC products at WMI during the life
cycle of the project. Even though the number of open MIRs had been reduced to zero in the
space of two months, this was a level that was difficult to maintain. As issues increased,
investigations became more intricate, corrective actions became more relevant and more
difficult to close out, and QP expectations increased.
Page 27 of 56
OC MIRs 2007-2008
18
♦ Raised ■ Closed A O pen
Figure 10: OC MIRs raised, opened and closed during the project life cycle
As the project progressed goals were reset and the number of open MIRs was determined to
be acceptable at <10. The main priority was to target MIRs most likely to hold up priority
batch release. For example, during June and July a total of 22 batches were affected by one
MIR. As the investigation related to microbial contamination in the OC processing suite, the
investigator had to devote two weeks solely to the MIR in question. This was necessary as
part of the processing suite was out of operation and immediate corrective and preventive
actions were required to prevent a recurrence of the issue. Closure of the MIR allowed the 22
batches to receive an acceptable disposition from the QP while also allowing the affected area
of the processing suite to restart production.
During the course of the project life cycle temporary change controls (TCCRs) were required
on an almost weekly basis to facilitate the completion of a number of batches, which
contained process deviations (MIRs). Chapter 4.2 provides more detail on the nature of these
deviations. Most TCCRs were required to either re-sort sugar coated formulations with %CV
for weight failures or re-inspect batches of sugar coated tablets with colour variation. Figure
13 in Chapter 4.2 illustrates this fact. Although not originally within the scope of the Bulk
Release Team or the Tiger Teams, the Technology Specialist set about devising a way to
negate the requirement for a TCCR when re-sorting a batch of tablets. A new SOP was
drafted detailing all possible scenarios that may have led to a batch re-sort and all batch
Page 28 of 56
manufacturing records (BMRs) were updated to include a re-sort section. Previously there had
been a separate re-sort BMR.
Initially, this would have been considered a trade-off (Meredith & Mantel 2006, pp. 132-133),
as devising this new procedure took time and effort. However, by the start of 2008 the new
procedure was in place and there was no longer any need to raise a TCCR to re-sort a batch.
The advantage was that OC Processing no longer had to put a batch on hold to await TCCR
approval; they could re-sort it as soon as their schedule allowed.
Appendix 1 is an excellent example of the week to week scheduling complexities encountered
during the project. This snapshot is taken from the first full week in December 2007. There
were 22 batches on the list with 15 required for release by week end (7th Dec.). Here are some
points to note:
• The first thing to notice is that the QC lab was pulling batches forward. The first three
batches in the schedule were being processed through the lab much quicker than
normal.
• Some batches had LIRs for weight, LOD and assay failures, most of which progressed
to MIRs.
• Four out of five of the OOS batches had an associated MIR, three of these MIRs were
closed.
• 10 out of the 22 batches had MIRs.
• One batch had a TCCR to re-sort part of it and another TCCR (not mentioned) to re-
inspect another part of it (C00385, C00385A and C00385AB).
• One batch was a possible reject. This batch was eventually rejected.
These points indicate a number of characteristics of the Bulk Release Team:
1. The part time support functions, such as QC, were fully behind the vision of the
project even forgoing routine business to reduce the batch cycle times in the lab to
almost 50% of target (30 days was the routine batch turn around time).
2. MIRs were being prioritised based on their effect on OOS, and to a lesser extent LS,
markets.
3. Batches C00385, C00385A and C00385AB were all eventually released to market.
4. LIRs/MIRs/TCCRs were associated with a high proportion of batches.
5. Rejected batches for low/high assay, extreme colour variation etc. were not
uncommon.
Page 29 of 56

It was the PM’s responsibility to constantly tweak this schedule depending on whether
LIR/MIR/TCCR closure was possible, QA/QC personnel were available, customer pressure
existed due to OOS markets, etc. Points 1-3 emphasise good teamwork, good prioritisation
skills and a healthy realisation of the nature of the OC business. With these learnings the team
progressed towards its goal of zero OOS markets and minimal LS markets with a growing
confidence. Note: Points 4 and 5 were indicative of the justification for the Tiger Teams.
4.2 The T iger Team s
To ensure sustainability of product supply following on from the work of the OC Recovery
Team, it was decided to form three further project teams, known as Tiger Teams. Figure 11
details the resource allocation to each team, with the PMs reporting to a Program Manager
who in turn reported to the OC PPU Director (Project Sponsor).
Figure 11: Matrix organisation of the OC Tiger Teams. PT = Part Time, FT = Full Time.
The matrix organisation model used for the Tiger Teams differs from the one described for
the OC Recovery Team. Excluding the PMs, only two of the team members were assigned to
a project on a full time basis. This structure can therefore be described as a weak or functional
matrix. The structure was chosen as there was no requirement for any more full time
Page 30 of 56

personnel and each functional manager agreed to devote, on average, 2 0 % of a team
member’s time to the project. This structure provided access to a broad knowledge and
resource base while still allowing team members to engage in routine functional activities. For
these three projects a Program Manager was selected who was trained in Lean Management
and proficient in such approaches as Six Sigma and operational excellence (OE). Dinsmore
(1993) emphasises the “lean and mean” approach for projects with the managerial difficulties
of a matrix model being offset by their relatively low cost coupled with good access to broad
technical support. The goal of the Tiger Teams was to address the unacceptable level of
customer service and first time quality, and provide solutions to improve process robustness.
They each had a relatively short life cycle of 4 months (July-October 2007) to complete their
defined objectives.
The DMAIC cycle was used to form a framework around which each team could progress
towards their defined objectives. In Figure 12 the acronym DMAIC describes the five phases
of the cycle, namely: define, measure, analyse, improve and control.
Figure 12: Methodology - DMAIC Cycle
Page 31 of 56
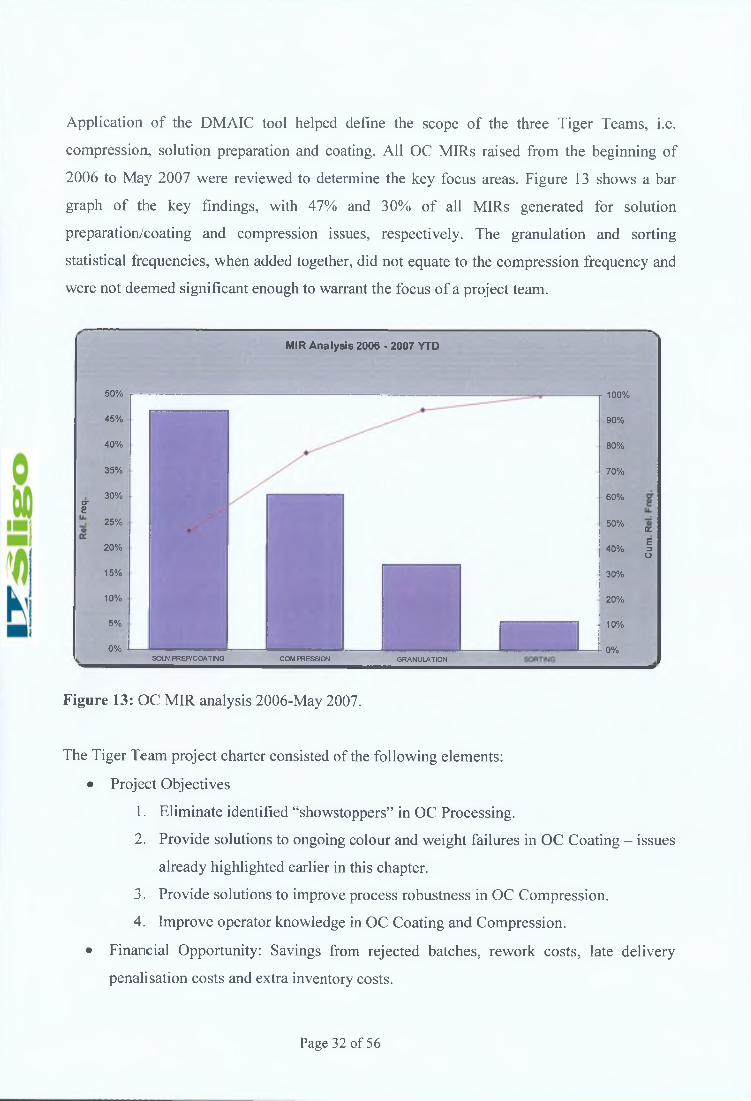
Application of the DMAIC tool helped define the scope of the three Tiger Teams, i.e.
compression, solution preparation and coating. All OC MIRs raised from the beginning of
2006 to May 2007 were reviewed to determine the key focus areas. Figure 13 shows a bar
graph of the key findings, with 47% and 30% of all MIRs generated for solution
preparation/coating and compression issues, respectively. The granulation and sorting
statistical frequencies, when added together, did not equate to the compression frequency and
were not deemed significant enough to warrant the focus of a project team.
MIR Analysis 2006 - 2007 YTD
<Te
50%
45%
40%
35%
30%
25%
20%
15%
10%
5%
0%SOLN PREP/COATING COM PRESSION
100%
90%
80%
70%
60%
50%
40%
30%
20%
10%
0%
tzE3o
GRANULATION
Figure 13: OC MIR analysis 2006-May 2007.
The Tiger Team project charter consisted of the following elements:
• Project Objectives
1. Eliminate identified “showstoppers” in OC Processing.
2. Provide solutions to ongoing colour and weight failures in OC Coating - issues
already highlighted earlier in this chapter.
3. Provide solutions to improve process robustness in OC Compression.
4. Improve operator knowledge in OC Coating and Compression.
• Financial Opportunity: Savings from rejected batches, rework costs, late delivery
penalisation costs and extra inventory costs.
Page 32 of 56
• Business Impact: Reduce compliance risk and improve customer service.
Each PM reported to the Program Manager on a weekly basis with the Program Manager
reporting to the Project Sponsor (OC PPU Director), Executive Sponsor, Site Steering
Committee and stakeholders on a biweekly basis.
Note: From the commencement of the Tiger Team mandate, the Training Dept, worked with
the Operations personnel and PMs of the three teams to create a formalised on-the-job
training assessment kit.
4.2.1 T he O C C om pression Team Findings
The OC Compression Team, using the DMAIC tool, began by defining the problem. The four
goals of the Compression Team were defined as follows:
• Reduce MIRs related to compression issues.
• Reduce downtime caused by these issues.
• Improve the compression process and equipment.
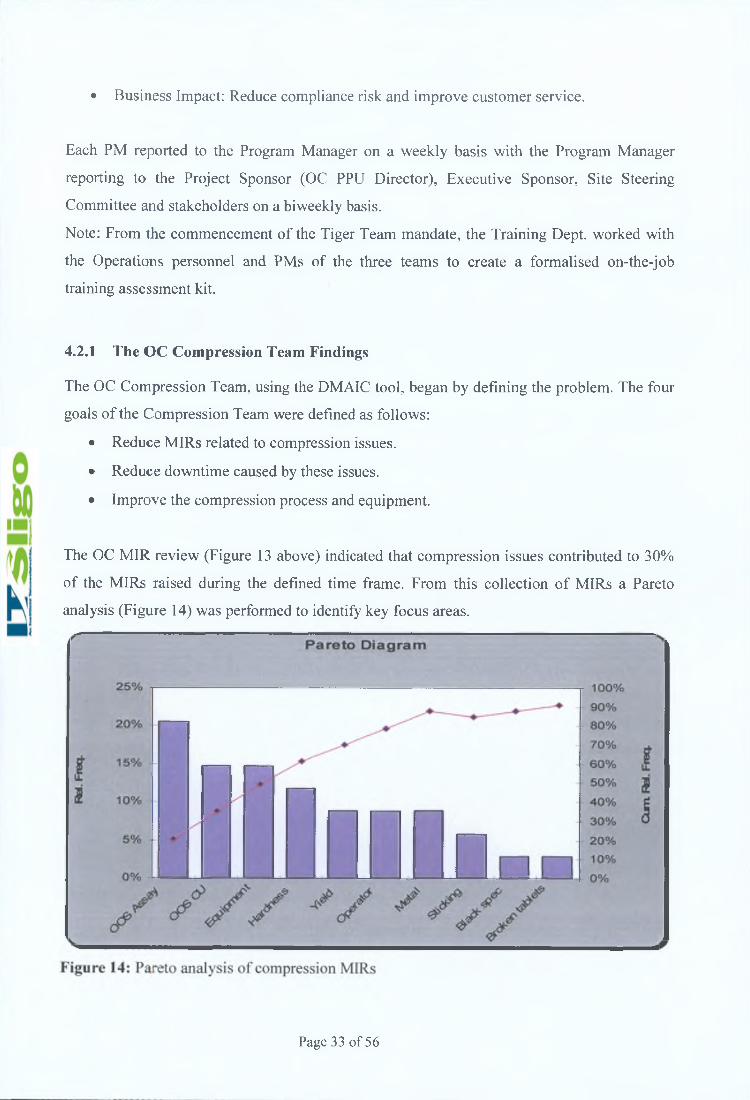
The OC MIR review (Figure 13 above) indicated that compression issues contributed to 30%
of the MIRs raised during the defined time frame. From this collection of MIRs a Pareto
analysis (Figure 14) was performed to identify key focus areas.
Page 33 of 56

As a result of the Pareto analysis the Compression Team decided to focus on two key areas:
equipment issues and out of specification assay/content uniformity results.
4.2.1.1 E quipm ent
A review of the equipment MIRs revealed that a large number of them were related to tooling,
e.g., broken punches, excess rejects, etc. A comparison of tablet thicknesses between Q4 2005
and Q1 2006 yielded the results shown in Figure 15.
Q 4 C o m p r e s s i o n T h i c k n e s s
P r o c e s s D ataLS L 3 . 0 0 0 0 0T a rg et 3 .1 2 5 0 0U S L 3 .2 5 0 0 0S a m pie M e a n 3 .1 1 9 0 9S a m pie N 1 1S t D e v (W ith in ) 0 . 0 2 7 3 0S tD ev (O v era II) 0 . 0 2 7 3 0
-------------- W itti in 0 v e ra I
P o t e n t i a l (W ithin ) C a p a b ilityC p 1.53C P L 1 .45C P U 1 .60càtz 1.45C C p k 1 .53
O v e ra II C a pab ility
P p 1.53P P L 1 .45P P U 1 .60P pk 1 .45C pm 1.52
3 . 0 0 3 . 0 4 3 . 0 8 3 . 1 2 3 . 1 6 3 . 2 0 3 . 2 4O b s e r v e d P e r f o r m a n c e E x p . Within P e r f o r m a n c e E x p . O v era I I P e r f o r m a n c e
P P M < LS L 0 .0 0 P P M < LS L 6 .44 P P M < L S L 6 .44P P M > U S L 0 . 0 0 P P M > U S L 0.81 P P M > U S L 0.81P P M T o t a l 0 . 0 0 P P M T o t a l 7 .26 P P M T o t a l 7 .26
Q 1 C o m p r e s s i o n T h i c k n e s s
P r o c e s s D a t aL S L 3 . 0 0 0 0 0T a r g e t 3 . 1 2 5 0 0U S L 3 . 2 5 0 0 0S a m pie M e a n 3 . 1 7 1 8 2S a m pie N 11S t D e v ( W it h in ) 0 . 0 2 3 7 4S t D ev (O v e r a I I ) 0 . 0 2 3 7 4
------------- W ith in O v e r a l l
P o t e n t i a l ( W i t h i n ) C a p ab ilityC p 1 .7 5C P L 2 . 4 1C P U . 1 1 0
1 .1 0C C pk 1 .7 5
O v er a II C a p a b ility
P p 1 .7 5P P L 2 . 4 1P P U 1 .1 0P pk 1 .1 0C pm 0 . 7 7
3 . 0 0 3 . 0 4 3 . 0 8 3 . 1 2 3 . 1 6 3 . 2 0 3 . 2 4O b s e r v e d P e r f o r m a n c e E x p . With in P e r f o r m a n c e E x p . O v era II P erf or m a n c e
P P M < LS L 0 . 0 0 P P M < L S L 0 . 0 0 P P M < L S L 0 . 0 0P P M > U S L 0 . 0 0 P P M > U S L 4 9 6 . 3 6 P P M > U S L 4 9 6 . 3 6P P M T o t a l 0 . 0 0 P P M T o t a l 4 9 6 . 3 6 P P M T o t a l 4 9 6 . 3 6
Figure 15: Process capability for tablet thickness at compression.
Page 34 of 56

Note: Cpk is an index (a simple number) that measures how close a process is running to its
specification limits, relative to the natural variability of the process. The larger the index, the
less likely it is that any item will be outside specification. A value above 1.33 indicates a
centred and capable process.
The Cpk value for Q4 2005 was 1.45 indicating that the process was centred and capable.
However, the Cpk value of 1.10 for Q1 2006 demonstrated that the process was capable but
no longer centred. When the tooling supplier was contacted it transpired that the tooling
geometry had been revised at the end of 2005 without informing WMI (this was a once off
occurrence). The change in tooling geometry resulted in an average tablet thickness increase
of 0.1 mm. This change would have also resulted in an increase in the level of tablet sorting
rejects.
Having analysed the change in tablet thickness a new vendor was commissioned to produce a
set of tooling to the required specifications. Figure 16 details the process capability achieved
with the new set of tooling.
Process Capability of 56mg core Thickness
Process DataLSL 2.95Target *
USL 3.25Sample Mean 3.06267Sample N 15StDev (Within) 0.00728217StDev(Overall) 0.0173003
USL
Observed Performance PPM < LSL 0.00 PPM > USL 0.00 PPM Total 0.00
Exp. Within Performance PPM < LSL 0.00 PPM > USL 0.00 PPM Total 0.00
Exp. Overall Performance PPM < LSL 0.00 PPM > USL 0.00 PPM Total 0.00
WithinOverall
Potential (Within) CapabilityCp 6.87CPL 5.16C£U
i/ Cpk.....
5.16 N
OVerall C apability--'^
Pp 2.89PPL 2.17PPU 3.61Ppk 2.17Cpm *
Figure 16: Process capability with new vendor tooling.
Page 35 of 56
The new tooling produced a Cpk value of 5.16 thereby demonstrating a capable and centred
compression process.
Controlled drawings were put in place by the Engineering Department and a Quality
agreement was entered into with the new vendor to ensure adequate tooling quality for future
orders.
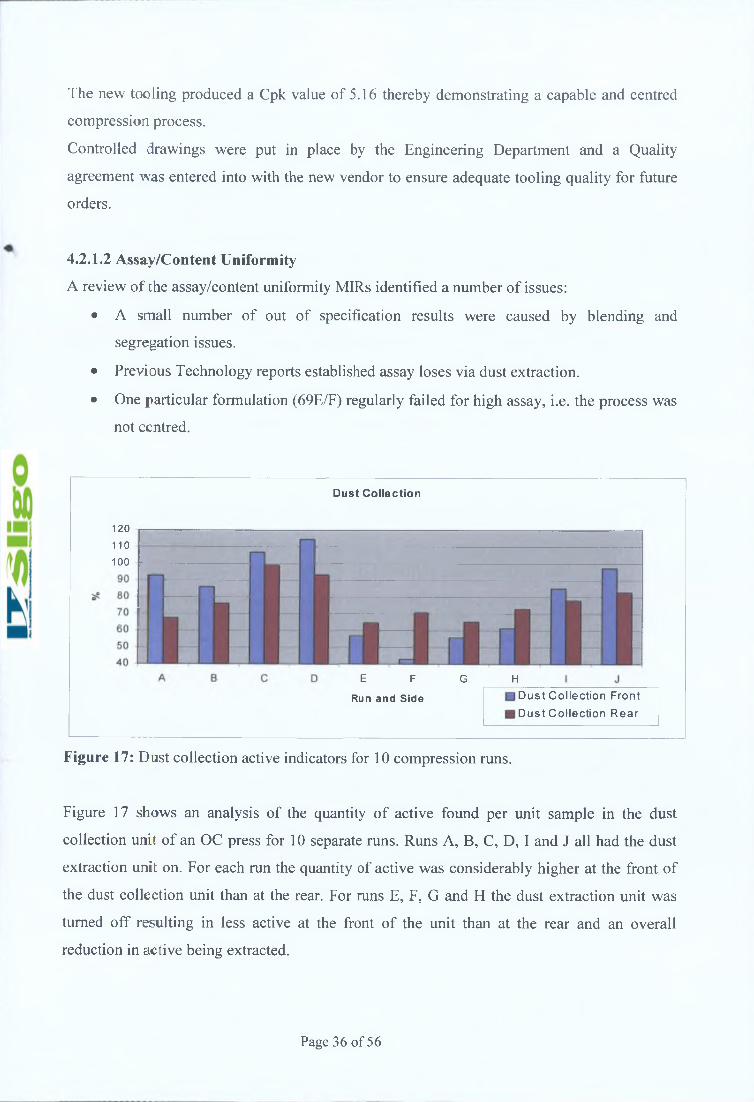
4.2.1.2 A ssay/C ontent U niform ity
A review of the assay/content uniformity MIRs identified a number of issues:
• A small number of out of specification results were caused by blending and
segregation issues.
• Previous Technology reports established assay loses via dust extraction.
• One particular formulation (69E/F) regularly failed for high assay, i.e. the process was
not centred.
Dust Collection
120
110100
E F G H
Run and Side D u s t C o lle c t io n F ro n t
D u s t C o lle c t io n R e a r
Figure 17: Dust collection active indicators for 10 compression runs.
Figure 17 shows an analysis of the quantity of active found per unit sample in the dust
collection unit of an OC press for 10 separate runs. Runs A, B, C, D, I and J all had the dust
extraction unit on. For each run the quantity of active was considerably higher at the front of
the dust collection unit than at the rear. For runs E, F, G and H the dust extraction unit was
turned off resulting in less active at the front of the unit than at the rear and an overall
reduction in active being extracted.
Page 36 of 56

As the dust extraction system on the OC presses was not previously monitored or controlled,
each press was subsequently installed with an air velocity indicator. The levels of extraction
were monitored to determine the optimum setting for the dust collection unit.
An analysis of the 69E/F high assay issue resulted in the implementation of an Overage
Reduction Project. This project was a sizable undertaking and is outside the scope of this
thesis. A reduction in the quantity of the two actives contained within this formulation was
introduced in 2008 resulting in a substantial reduction in MIRs for out of specification/high
assay results.
4.2.2 F indings o f the O C Solution Preparation/C oating T eam s
OC sugar coated tablets are routinely coated in a Pellegrini coating pan (see Figure 18) via a
set shot strategy. A shot is applied via a “jig” (see Figure 23) and the tablets are then rolled
and dried and the process repeated until the desired tablet weight is achieved. The more
complex technological aspects of sugar coating are beyond the scope of this thesis.
Figure 18: A Pellegrini coating pan used to coat OC sugar coated tablets.
Page 37 of 56
As the preparation of coating solution and the application of the solution to coat the tablets are
inherently linked, the progress of the two teams will be addressed together. The OC Solution
Preparation/Coating Teams (SPC Teams), again using the DMAIC tool, began by defining the
problem. The three goals of the SPC Teams were defined as follows:
• Reduce the number of weight and colour variation related MIRs.
• Provide sustainable fixes to eliminate future weight and colour variation MIRs.
• Improve the understanding of the sugar coating and solution preparation processes.
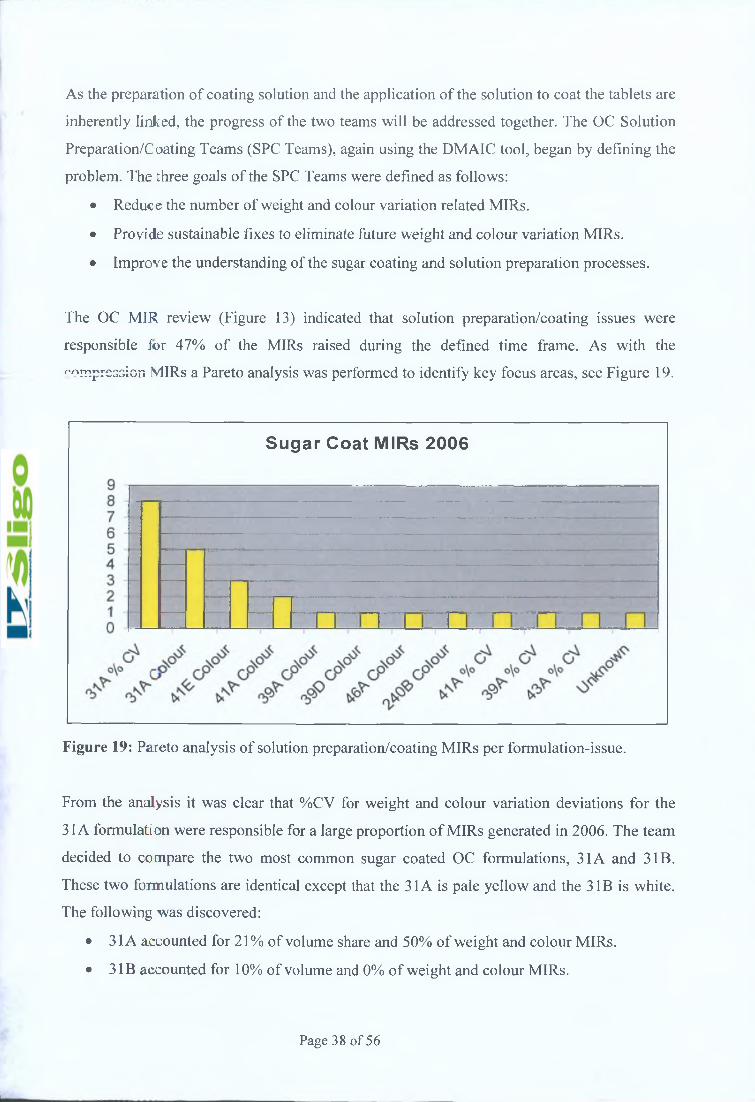
The OC MIR review (Figure 13) indicated that solution preparation/coating issues were
responsible tor 47% of the MIRs raised during the defined time frame. As with the
compression MIRs a Pareto analysis was performed to identify key focus areas, see Figure 19.
Sugar Coat MIRs 2006
Figure 19: Pareto analysis of solution preparation/coating MIRs per formulation-issue.
From the analysis it was clear that %CV for weight and colour variation deviations for the
31A formulation were responsible for a large proportion of MIRs generated in 2006. The team
decided to compare the two most common sugar coated OC formulations, 31A and 3 IB.
These two formulations are identical except that the 31A is pale yellow and the 3 IB is white.
The following was discovered:
• 31A accounted for 21% of volume share and 50% of weight and colour MIRs.
• 3 IB accounted for 10% of volume and 0% of weight and colour MIRs.
Page 38 of 56

Both 31A and 31B used the same core tablet, coating equipment, operators etc. and 31B was
white so colour variation was not an issue. But, analysis of the 31B data showed that none out
of more than 200 batches analysed failed the %CV for weight specification.
Histogram of 31B % CV, 31A % C VNormal
Variable
31B % CV
------- 31A % CV
Mean StDev N
2399 0.7112 164
3.606 0.7307 314
Data
Figure 20: Plot of %CV for weight of 3 1A versus 3 1B formulations.
From the comparison of %CV for weight in Figure 20, the mean %CV for weight for the 3IB
formulation was ca. 2.4%, whereas the mean for the 31A formulation was much higher at ca.
3.6%.
Figure 21 shows the process capability analyses of %CV for weight for the 31A and 3IB
formulations. The Cpk value of 1.29 showed that the 3 IB coating process was a more capable
and centred process than that of 31A (Cpk=0.68).
Page 39 of 56

Process Capability o f 3 1B % CV
Process DataLSL 0Target *USL 5Sample M ean 2.39878Sample N 164StDev (With in) 0 .621662StDev (O v erall) 0 .712263
LSL U SL
0 .0 0 0 .7 5 1 .5 0 2 .25 3 .0 0 3 .7 5 4 .5 0
Observed Performance PPM < LSL 0.00 PPM > U S L 0.00 PPM Total 0.00
Exp. Within Performance PPM < LSL 57.01 PPM > USL 14.30 PPM Total 71.31
Exp. Overa ll Performance PPM < LSL 378.81 PPM > US L 130.08 PPM Total 508 .89
WithinO verall
Potential (Within) CapabilityCp 1.34C PL 1.29c w r 1.39 \{\Pk 1.29 )
O v ercrlli^ap a b i l i t y ^
Pp 1.17PPL 1.12PPU 1.22Ppk 1.12C pm *
P r o c e s s C a p a b i l i t y o f 3 1 A % CV
LSLProcess D a ta
LSL 0Target *USL 5Sample M ean 3 .60756Sam pie N 344StDev(With in ) 0 .685441StDev (O v e rail) 0.731243
USLW ith in O verall
Potential (Within) CapabilityCp 1.22CPL 1.75c p y ^ - -0.-6G —(/pk 0.68
0 v et^ll C a p a b i l i t v /Pp T T TPPL 1.64PPU 0.63Ppk 0.63C pm *
O bserved PerformancePPM < LSL 0.00PPM > USL 23255.81PPM Total 23255.81
Exp. Within Performance PPM < LSL 0.07PPM > USL 21104.53 PPM To ta l 21104.60
Exp. Overa ll Performance PPM < LSL 0.40PPM > USL 28441.21PPM Total 28441 .6 2
Figure 21: Process capability of 31A and 31B formulations for %CV for weight.
The teams examined the excipients of the two colour solutions and the mean flow rates for the
undercoat solutions (most of the coat is composed of the undercoat solution). They found that
the % solids of the two undercoats were very similar at 73.3% for the 31A solution and 74.4%
for the 31B solution.
Page 40 of 56
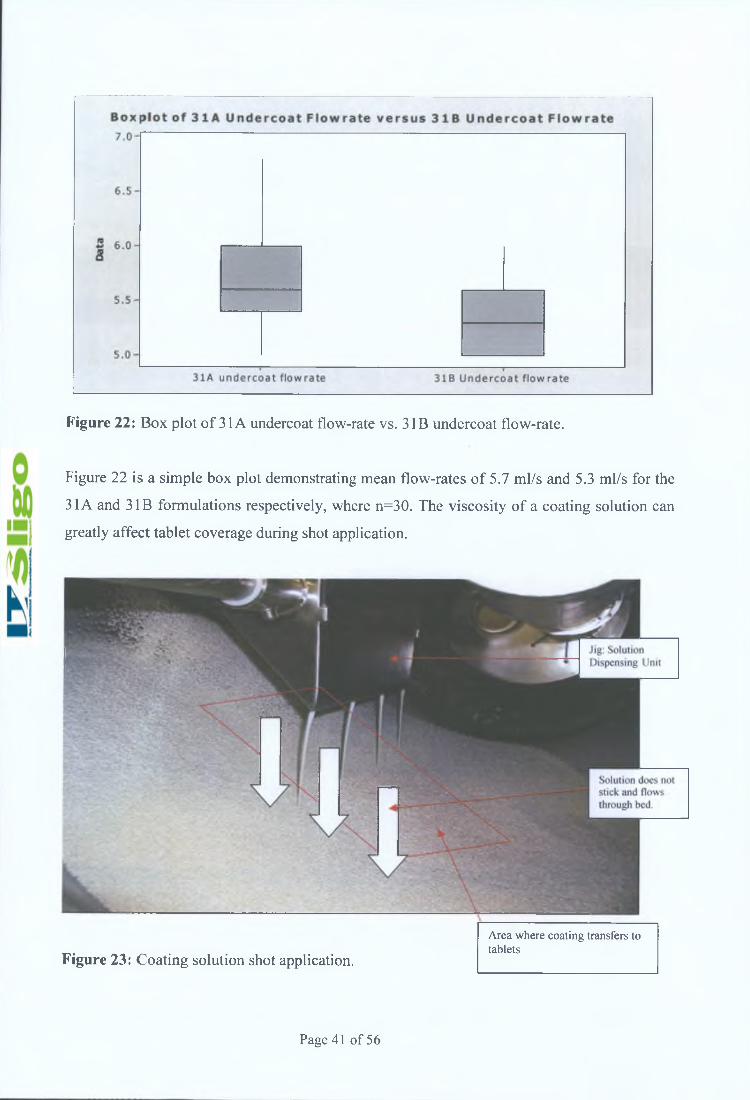
Figure 22: Box plot of 31A undercoat flow-rate vs. 31B undercoat flow-rate.
Figure 22 is a simple box plot demonstrating mean flow-rates of 5.7 ml/s and 5.3 ml/s for the
31A and 31B formulations respectively, where n=30. The viscosity of a coating solution can
greatly affect tablet coverage during shot application.
Area where coating transfers to tablets
Figure 23: Coating solution shot application.
Page 41 of 56

Figure 23 shows how the coating solution is applied. An aliquot of coating solution is placed
in the jig and applied to the tablets in the coating pan over a specified period of time. If the
solution is not viscous enough, i.e. the flow rate is too high, the coating solution will flow
through the tablet bed and not be evenly distributed.
In light of the lack of deviations associated with the 3IB formulation the teams prepared a
trial undercoat solution with 5 kg less water than usual so that the viscosity of the problematic
31A solution would match the viscosity of the non-problematic 31B solution. This solution
was then used to coat a 31A batch of tablets.
D)E
.5»v5«-Ore
Time Series Plot of mean tablet weight, %CV> 3.00 Variable
mean tablet weight %CV
. o' o' o' „o' o' (S' -?>'> ^ ^ ^ ^
& c c / c^° c /
w eight sample point
Figure 24: Time series plot of mean tablet weight/%CV for weight
Figure 24 shows the weight/%CV for weight correlation throughout the coating process. At
the final tablet weight of 90 mg the %CV for weight was 2.9% compared to a typical value of
3.9%.
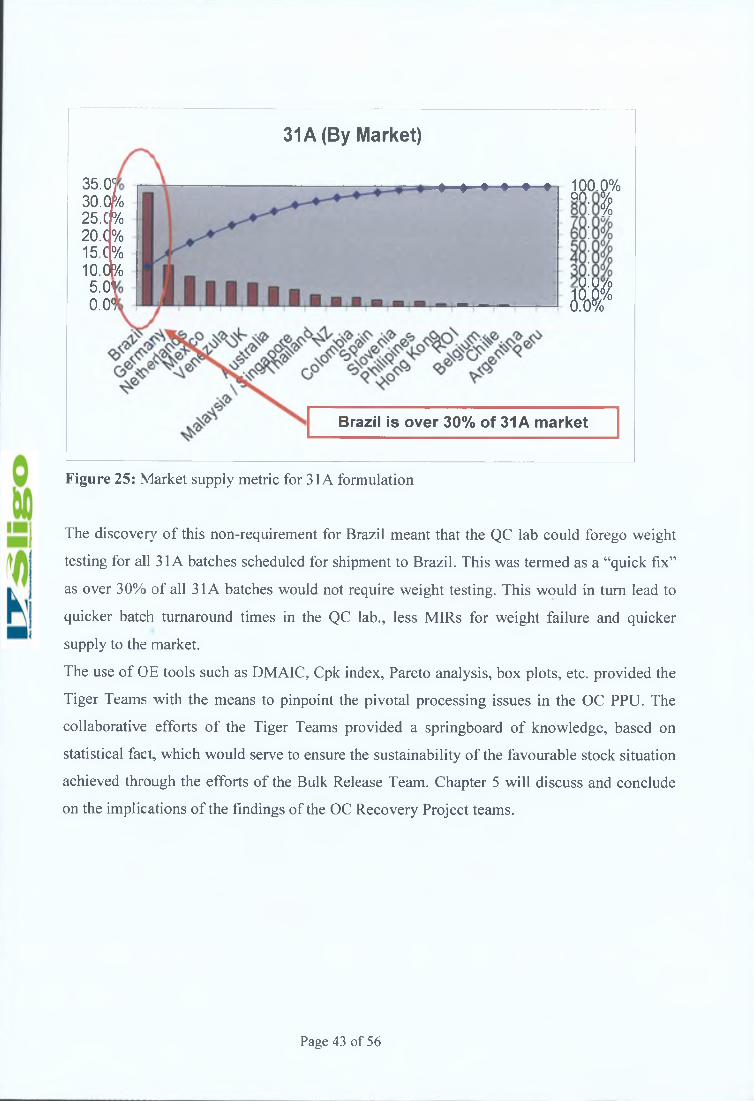
The team members from the Registration Dept, performed an analysis of the registered testing
requirements for all markets supplied with the 31A formulation. They discovered that there
were weight testing requirements for most markets with some exceptions. One of these
exceptions was Brazil which had no weight requirements. As depicted in Figure 25, over 30%
of the volume of 31A tablets produced at WMI is supplied to the Brazilian market.
Page 42 of 56
3 5 .0 5 30. ok 2 5 . C% 20. C% 15.C % 10.OP/0 5.01 O.O'}
31A (By Market)
100.0% oX |
s#Ó .O /o
Brazil is over 30% of 31A m arket
Figure 25: Market supply metric for 31A formulation
The discovery of this non-requirement for Brazil meant that the QC lab could forego weight
testing for all 31A batches scheduled for shipment to Brazil. This was termed as a “quick fix”
as over 30% of all 31A batches would not require weight testing. This would in turn lead to
quicker batch turnaround times in the QC lab., less MIRs for weight failure and quicker
supply to the market.
The use of OE tools such as DMAIC, Cpk index, Pareto analysis, box plots, etc. provided the
Tiger Teams with the means to pinpoint the pivotal processing issues in the OC PPU. The
collaborative efforts of the Tiger Teams provided a springboard of knowledge, based on
statistical fact, which would serve to ensure the sustainability of the favourable stock situation
achieved through the efforts of the Bulk Release Team. Chapter 5 will discuss and conclude
on the implications of the findings of the OC Recovery Project teams.
Page 43 of 56

C h apter 5: D iscussio n A nd C o nclu sio n s
WMI is a “functionally” orientated organisation, that is to say that personnel operate
comfortably within their functions, with very few people having occupied a position in two or
more functional groups. A Processing Operator will very rarely move to Packaging and a QC
analyst will rarely traverse to Processing. In Six Sigma terminology, this could be classified
as a “silo” mentality, where people in one functional group do not know what is happening in
other functional groups. However, it does encourage personnel to pursue a particular career in
a chosen discipline and serves to create a large pool of subject matter experts (SMEs).
The OC Batch Release Team had a project life cycle of 12 months. It required core personnel
who would be given solely to the goals and objectives of the teams. Therefore there was a
requirement for full time personnel. However, because of the nature of the work, e.g., cross
functional knowledge requirements, the Site Steering Committee decided that the team
members must have the necessary experience if the project was to succeed. These factors
ensured that the project model adopted was a strong matrix model where the four core team
members were specially chosen because of their cross-functional experience and they worked
full time for the team with the support of a number of part time personnel from QA/QC and
Customer Services.
The objective of the Bulk Release Team was very clearly communicated to the functional
managers of the full time personnel on the team, however there were occasions when the
functional manager asked a team member to do some routine functional work. This created
some friction between the PM and functional manager and brought to light the importance of
the true project management abilities of the PM within the matrix model. The PM was very
clear in reminding the functional managers of the paramount importance that the project had
in ensuring continued success of the OC business at WMI.
As mentioned at the end of Chapter 4 the Registration Dept, discovered a “quick fix” for the
31A weight failure issue. This however would be better classified as a trade-off, as the
Technology Specialist had to raise a TCCR each time a 31A batch was released to Brazil.
Weight testing was a routine test. Therefore, to negate this test was a planned change in the
testing regime for a 31A batch, which required a TCCR. This strategy was implemented at the
start of 2008 which was around the same time that the Technology Specialist had
implemented the new procedure for re-sorting batches that failed weight testing. This new
procedure negated the requirement to raise a TCCR to re-sort a batch. To summarise, no
Page 44 of 56
sooner had the Technology Specialist devised a method to reduce TCCRs was he
subsequently asked to raise more TCCRs to help the Tiger Teams implement a “quick fix”.
This could have resulted in in-fighting among the project teams as one team’s
recommendation resulted in another teams work load increasing. However, there was a good
holistic sense of common purpose amongst the teams with frequent sharing of information
and expertise. This served to dispel any “we-they” attitude that could have existed and
frequently does when “projectitis” sets in; as discussed in Chapter 3.
Figure 26 illustrates the OOS/LS OC market trend during the life cycle of the OC Batch
Release Project.
LS *-O O S
OC PPU Out of Stock & Low Stock Trending for 2007-2008
0r f t r f r r f i r[t> ¿ ¡I-
Week No.
Figure 26: OOS/LS Trend Data for 2007/2008
Analysis of the trend data shows the phenomenal success of the OC Batch Release Team and
is a clear justification of the use of the matrix model. From a peak of 38 OOS and 39 LS
markets in week 25 of 2007 the team achieved a week 21 2008 result of 2 OOS and 2 LS
markets. The OOS metric declined quicker than the LS as more emphasis was placed on
supplying OOS markets than LS ones. This was an obvious course of action as an OOS
Page 45 of 56
market is a much more serious situation than a LS one. Both metrics can be seen to increase at
the start of 2008. This was a natural occurrence and was due to the holiday period when
supply stopped but demand still existed. The situation recovered by the middle of February
whereupon further progress was made and the metrics declined further to give a favourable
end result. The following statement appeared in a general WMI communication on 13/08/08
“OC recovery is complete. Any low stock or out of stock in the markets are due to over-sales.
There is no constraint of supply or demand.”
As well as reducing the OOS and LS markets to minimal levels, the OC Bulk Release Team
was also responsible for the following by the end of the project life cycle:
• Increasing approved bulk status from 60 million tablets in June 2007 to 170 million
tablets in May 2008.
• The re-sorting procedure was formalised thus resulting in more efficient and timely
schedule attainment and a reduction in TCCRs.
• Closing out 72% of all OC MIRs within 15 days of initiation; 30 days were allowed
for MIR closure.
• An average of 90% schedule adherence was obtained at final QP release. This metric
was below 10% at the beginning of the project.
Upon termination of the Bulk Release Team in May 2008 the OC PPU sought to embed the
Bulk Release Team activities into day-to-day operations. Of the two Investigation Leads, one
was promoted and the other resumed work as a Packaging Supervisor in the OC PPU. The
PPU created a Lead Investigator position to sustain the specific task of opening and closing
investigations and implementing appropriate corrective and preventive actions (CAPA). The
Compliance and Technology Specialists were absorbed back into the OC PPU were they
resumed routine duties but also gained the experience and knowledge associated with having
been on the project team. This knowledge base was retained and utilised in the OC PPU.
Having achieved stock recovery in a sizable number of OC markets a new challenge arose.
How would the OC PPU sustain the current stock situation? The Tiger Teams were
introduced (July 2007) shortly after the OC Recovery Team started. Their task was to improve
process robustness in order to sustain the situation achieved by the Recovery Team.
Following the termination of the Tiger Teams in October 2007, weekly “decision forums”
were held in the OC PPU to agree implementation of identified solutions. The factors
considered were: timelines, cost, product volume projections and resources required. By the
Page 46 of 56

end of 2008 the following identified solutions had been implemented as a result of the work
of the Tiger Teams:
• Compression tooling of a high quality had been sourced and supplied from a reliable
vendor. WMI entered into a Quality agreement with the vendor thus further ensuring
the reliability of the tooling.
• Although not discussed in detail in Chapter 4 the Training Dept, approved and
implemented on-the-job training assessments for compression and coating operations.
These assessments were designed to facilitate better operator understanding of the
manufacturing processes.
• Flow rate measuring devices had been fitted to all OC presses resulting in greater
control of dust extraction during compression and hence less process deviations for
low assay results.
• The 69E/F high assay issue resulted in the implementation of an Overage Reduction
Project. A reduction in the quantity of the two actives contained within these
formulations (now 69G/H) introduced in 2008 resulted in a substantial reduction in
MIRs for out of specification/high assay results. There were also sizable savings from
this project as a number of batches had been rejected between 2005 and 2007.
• The new reduced viscosity 31A undercoat solution was validated and implemented.
• The Registration Dept, took a two pronged approach to the 31A weight and colour
variation issue. They began submissions to harmonise all 31A filings to 3 IB thus
eliminating future colour variation potential. They also made submissions to remove
%CV for weight testing from all Market Authorisations (more than 30 in total). The
expected completion date for this strategy is June 2009.
A number of key learnings were achieved through the actions and successes of the OC
Recovery Project teams:
• The assignment of appropriate resources and the design and capability of the project
teams, i.e. strong/weak matrix models utilised, was paramount to the workings and
success of the project teams.
• Project governance was disciplined and involved communication and collaboration on
a Team/Site/Corporate level.
• The support of senior management was critical to allowing the.teams to focus on the
task in hand.
Page 47 of 56
The Program Manager and PMs were experienced and capable.
The co-location of the project teams (full time personnel) facilitated a natural sharing
of knowledge, a concerted group focus and a holistic approach to issues encountered.
Decisions were data driven, as evidenced by the metrics presented in this thesis, and
not just “good ideas”.
The short timelines associated with the Tiger Teams engendered a sense of urgency.
The sustainability plan developed by the Tiger Teams was an appropriate means to
perpetuate the success achieved the Bulk Release Team.
Page 48 of 56
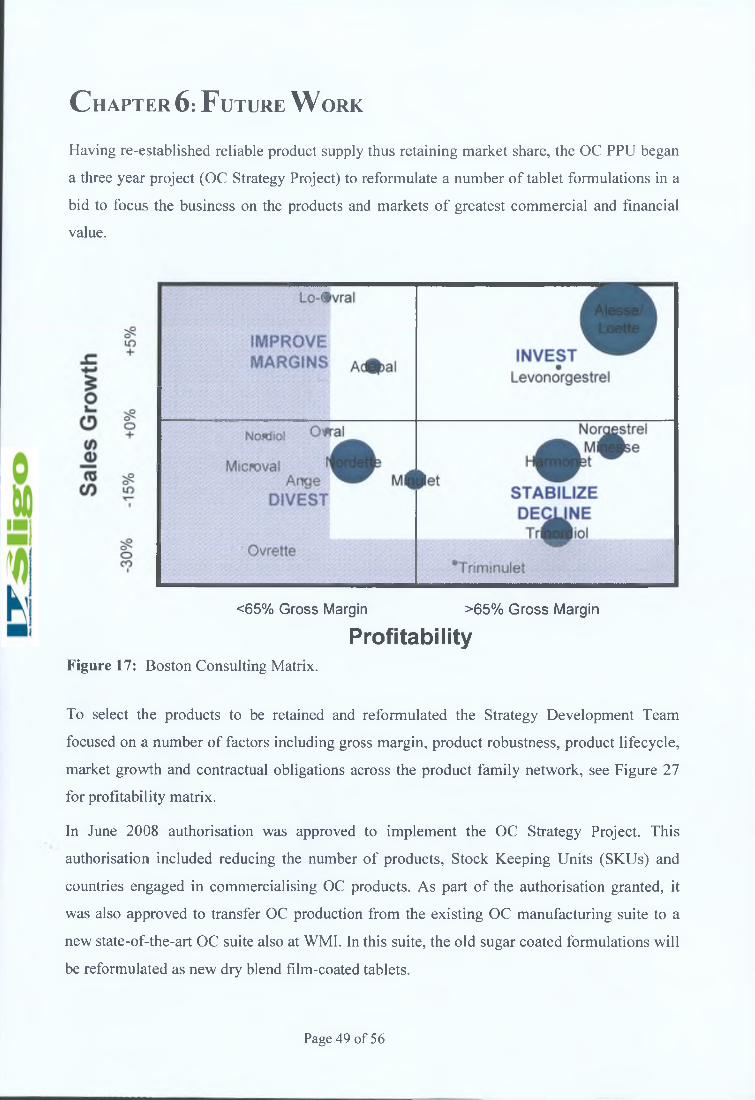
C h apter 6: F uture W ork
Having re-established reliable product supply thus retaining market share, the OC PPU began
a three year project (OC Strategy Project) to reformulate a number of tablet formulations in a
bid to focus the business on the products and markets of greatest commercial and financial
value.
<65% Gross Margin >65% Gross Margin
ProfitabilityFigure 17: Boston Consulting Matrix.
To select the products to be retained and reformulated the Strategy Development Team
focused on a number of factors including gross margin, product robustness, product lifecycle,
market growth and contractual obligations across the product family network, see Figure 27
for profitability matrix.
In June 2008 authorisation was approved to implement the OC Strategy Project. This
authorisation included reducing the number of products, Stock Keeping Units (SKUs) and
countries engaged in commercialising OC products. As part of the authorisation granted, it
was also approved to transfer OC production from the existing OC manufacturing suite to a
new state-of-the-art OC suite also at WMI. In this suite, the old sugar coated formulations will
be reformulated as new dry blend film-coated tablets.
Page 49 of 56

Migrating OC production to the new suite at WMI will bring significant benefits, it will:
• Improve OC supply reliability and afford increased flexibility to respond to variations in
volume.
• Lower the Cost of Goods (COGs).
• Enhance capability to apply future product improvements, including formula harmonisation
and shelf life extensions.
The OC Strategy Project is due for completion in 2010. It is intended that the new dry blend
tabletting process will bring with it reliability, robustness and repeatability. The efforts of the OC
Recovery Project teams have enabled the transition from “old” to “new” thus ensuring the future
manufacture of OC products at WMI.
Page 50 of 56
Typical OC Bulk Release Team weekly priority list from December 2007
APPENDIX 1
Page 51 of 56

Item Description Bulk QC Target QC ActualOut of Stock Comments
B6313 MICROVAL (30/-) C49105 17 December 2007 07-DecB6313 MICROVAL (30/-) C49106 20 December 2007 05-DecB6313 MICROVAL (30/-) C49107 20 December 2007 05-DecB6311B TRINORDIOL 75/40 C49111 30 November 2007 05-Dec QAB6311B TRINORDIOL 75/40 C47748 30 November 2007 03-Dec QA
B6314 STEDIRIL 30 / NORDETTE C48762 13 November 2007 29-Nov UR MIRLAB FAILURE LIR TO BE RAISED FAILED WEIGHT mlr 16557
B6374 HARMONET/MICROLET (75/20) C49080 04 December 2007 06-Dec OOS MIR CLOSED Mirlod out of sped 6510B6374 HARMONET/MICROLET (75/20) C49081 04 December 2007 07-Dec OOS PROCESSING Batch File Required from ProcessingB6349 STEDIRIL (500/50) C47750 04 December 2007 06-Dec PROCESSING Batch File Required from Processing
B6311C TRINORDIOL 125/30 C47765 12 December 2007 30-Nov MIR CLOSEDMIR 16467 INCORRECT COATING STRAGEDY &
LIR 16536B6394 EVANOR TABLETS C40491 30 November 2007 30-Nov OPB6316 PREM PAK C (NORGESTREL 150) C49194 10 December 2007 29-Nov MIR Technology mir micro issue 16614
B6593 PLACEBO Minesse C52252 22 November 2007 26-Nov MIR CLOSED COATING DEFECTSB6314 STEDIRIL 30 / NORDETTE C52676 27 November 2007 06-Dec QA to be reviewedB6314 STEDIRIL 30 /NORDETTE C52675 28 November 2007 05-Dec OOS MIR CLOSED mir on halb sab issueB6394 EVANOR TABLETS C45537 06 November 2007 06-Dec QA REVIEWED
BATCHES WITH MIR/UR TO BE CLOSED
B6374 HARMONET/MICROLET (75/20) C48226 23 November 2007 OOS URBroken PUNCH MIR 16464 CLOSED LIR DEGS PART A RAISED
B6311A TRINORDIOL 125/30 C45842 07 July 2007 09-Nov MIR 16673 mir to be raised for missing checksB6394 EVANOR TABLETS C12392 25 September 2007 OVERDUE PRE QP'D may require stats to close out and memo to mir
B6314 STEDIRIL 30 / NORDETTE C48765 Wednesdaypossiblereject LIR halb not down from the lab c47819 has lir
B6311 TRINORDIOL 125/30 C16688A 15-Oct 23-Oct OOSAPPROVED FOR France
MIR TO BE RAISED TO ALLLOW SHIPMENT TO BRAZIL
B6314STERDRIL (halb C01227 Approved)
C00385ABC00385AC00385 03 November 2007 late INSPECT MIR
RESORT BATCH ALLOCATION PLAN TO SHIP 14/6 FAILED FOR HEIGHT CAN ONLY GO TO BRAZIL TCCR 07-0706
K e y : Date due ScheduleREJECTED MIR WITH QP APPROVED H H U N S lli from QC Attainment
Page 52 o f 56
APPENDIX 2
References
Page 53 of 56
B i b l i o g r a p h y
A Guide to the Project Management Body o f Knowledge (PMBOK® Guide) 2004, 3rd ed.
Aaltonen, K. Jaakko, K. & Tuomas, O., 2008. Stakeholder Salience in Global Projects.
International Journal o f Project Management, 26(5), pp.509-516.
Al-Bahar, J.F. & Crandall, K.C. 1990. Risk management in construction projects: A
systematic approach for contractors. In: Council International du Bâtiment W55/W65 Joint
Symposium. Sydney, 14-21 March, 1990.
Anderson, E.S. Grude, K.V. Haug, T. Katagirl, M. & Turner, R.J., 2004. Goal directed
project management. 3rd ed. London: Kogan.
Boehm, B.W., 1991. Software risk management: Principles and Practices. IEEE Software. 8 ,
pp.32-41.
Baccarini, D. & Archer, R., 2001. The risk ranking of projects: a methodology. International
Journal o f Project Management, 19, pp. 139-145.
Chapman, C. & Ward, S., 1997. Project Risk Management: Processes, Techniques and
Insights. 2nd ed. John Wiley and Sons.
Cova, B. & Salle, R., 2005. Six key points to merge project marketing into project
management. International Journal o f Project Management, 23, pp.354-359.
Dinsmore, P.C., 1993. Flat, Flexible Structures: The Organizational Answer to Changing
Times, The AMA Handbook o f Project Management. New York: AMACOM.
Page 54 of 56
Gray, C.F. & Larson, E.W., 2005. Project Management: The Managerial Process. McGraw
Hill International, 3rd ed.
Fairley, R., 1994. Risk Management for Software Projects. IEEE Software, 11(3), pp.57-67.
Jepsen, A.L. & Eskerod P., (in press). Stakeholder Analysis in Projects: Challenges in using
current guidelines in the real world. International Journal o f Project Management. (Accepted
for publication January 2009).
Kliem, R.L. & Ludin, I.S., 1997. Reducing Project Risk. Brookfield (VT): Gower.
Levene, R.J. & Braganza, A., 1996. Controlling the work-scope in organisational
transformation: a programme management approach. International Journal o f Project
Management, 14(6), pp.331-339.
Lycett, M. Rassau, A. & Danson, J., 2004. Programme management: A critical review.
International Journal o f Project Management, 22, pp.289-299.
McElroy, B. & Mills, C., 2003. Managing Stakeholders. In: Turner, R.J. ed. People in Project
Management. Aldershot: Gower.
Meredith, J.R. & Mantel Jr., S.J., 2006. Project Management: A Managerial Approach, 6 th ed.
Hoboken (NJ): John Wiley & Sons Inc.
Partington, D., 1996. The project management of organisational change. International Journal
o f Project Management, 14(1), pp. 13-21.
Pellegrini, S., 1997. Programme Management: Organising project based change. International
Journal o f Project Management, 15(3), 141-149.
Dorofee, A.J. Walker, J.A. Alberts, C.J. Higuera, R.P. Murphy, R.L. & W illiams, R.C., 1996.
Continous Risk Management Guidebook. Pittsburgh: Carnegie M ellon University.
Page 55 of 56

Raz, T. & Michael, E., 2001. Use and Benefits of Tools for Project Risk Management.
International Journal o f Project Management, 19, pp.9-17.
Tuckman, B.W., 1965. Developmental sequence in small groups. Psychological Bulletin,
63(6), pp.384-399. The article was reprinted in Group Facilitation: A Research and
Applications Journal - Number 3, Spring 2001 and is available as a Word document:
http://dennisleamingcenter.osu.edu/references/GROUP%20DEV%20ARTICLE.doc.
Ward, S.C. & Chapman, C.B., 1991. On the allocation of risk in construction projects,
International Journal o f Project Management, 3, pp. 140-147.
Turner, J.R. ed., 1995. The Commercial Project Manager. McGraw Hill International.
Whetton, D.A. & Cameron, K.S., 2005. Developing Management Skills. 6 th ed. Person Hall
Educational International.
Winch, G.M., 2004. Managing project stakeholders. In: Morris, P.W.G. & Pinto, J.K. eds. The
Wiley Giade to Managing Projects. New Jersey: Wiley.
Websites:
Six Sigma terminology (http://www.isixsigma.com)
Harvard System of Referencing Guide (http://libweb.anglia.ac.uk/referencing/harvard.htm)
WMI documentation was also referenced during the preparation of this thesis, in particular
PPG-00025977 version 5.0 “Project Management Process”.
Page 56 of 56