
by John A. List and David Lucking-Reiley A. List and David Lucking-Reiley* ... evidence of these two...
27
BIDDING BEHAVIOR AND DECISION COSTS IN FIELD EXPERIMENTS by John A. List and David Lucking-Reiley Working Paper No. 00-W06 March 2000 DEPARTMENT OF ECONOMICS VANDERBILT UNIVERSITY NASHVILLE, TN 37235 www.vanderbilt.edu/econ
Transcript of by John A. List and David Lucking-Reiley A. List and David Lucking-Reiley* ... evidence of these two...
BIDDING BEHAVIOR AND DECISION COSTS IN FIELD EXPERIMENTS
by
John A. List and David Lucking-Reiley
Working Paper No. 00-W06
March 2000
DEPARTMENT OF ECONOMICS VANDERBILT UNIVERSITY
NASHVILLE, TN 37235
www.vanderbilt.edu/econ

Bidding Behavior and Decision Costs in Field Experiments
John A. List and David Lucking-Reiley*
12 March 2000
Abstract
Whether rationality of economic behavior increases with expected payoffs and decreaseswith the cognitive cost it takes to formulate an optimal strategy remains an open question. Weexplore these issues with field data, using individual bids from sealed-bid auctions in which wesold nearly $10,000 worth of sportscards. Our results indicate that stakes do indeed matter, ashigh-priced ($70) cards produced more of the theoretically predicted strategic behavior than didlower-priced ($3) cards. We find additional evidence consistent with the importance of cognitivecosts, as subjects more experienced with sportscard auctions exhibited a greater tendency tobehave strategically than did less experienced bidders.
JEL: D44 (Auctions), C93 (Field Experiments),Keywords: Cognitive Cost, Multi-Unit Auctions, Field Experiments
*List: Department of Economics, University of Central Florida, Orlando, FL 32765,[email protected]: Department of Economics, Vanderbilt University, Nashville, TN 37235,[email protected].

1. Introduction
Positive opportunity costs of mental effort may invalidate the predictions of
traditional models of rational (or hyper-rational) agents. Conlisk (1996) uses deliberation
costs as a recurring theme when discussing four important reasons for incorporating
bounded rationality in economic models. Smith and Walker (1993) and Smith and
Szidarovszky (1999) present effort models which predict that individuals’ behavior will
more closely match the predictions of rational-behavior theories as (1) the stakes of the
decision increase, and (2) the decision costs decrease.1 Smith and Walker (1993) find
evidence of these two effects in a comprehensive review of thirty-one published
laboratory experiments. Camerer and Hogarth (1999) extend Smith and Walker’s survey
by examining 74 experimental papers, and find evidence in favor of the cognitive-effort
theory, noting that “higher levels of incentives have the largest effects in judgment and
decision tasks.” Although the laboratory evidence is compelling, there has been little
verification of these predictions outside the laboratory.2
The present paper fills this gap by examining field data from 164 multi-unit
sportscard auctions carried out on the floor of a sportscard show. We auctioned four
types of trading cards with book values ranging from $3 to $70, providing significant
variation in the stakes of the auction. Our auctions also included two distinct types of
subjects: some auctions had sportscard dealers bidding against each other, while others
had individual card collectors as the participants. This variation allows us to explore the
1 Whereas Smith and Walker (1993) model man versus nature, Smith and Szidarovszky (1999) extend themodel to allow for interactive decision in the n-person case.
2 Note, however, the similarities of increasing rewards with the parallel literature that compareshypothetical and real responses (see, e.g., List and Shogren, 1998, and List, 2000).

second dimension of decision-cost theory−do dealers, who commonly participate in
sportscard auctions and therefore likely require less effort to bid optimally, bid more
rationally than nondealers? Our measure of “rational” bidding comes from multi-unit
auction theory, which predicts strategic “demand reduction” in uniform-price auctions.
For each type of bidder and each type of card, we measure this demand-reduction
behavior in the uniform-price auction relative to a control (the multi-unit Vickrey
auction) where bidders are predicted to fully reveal their demands.
Our sportscard data, generated from sales of 328 sportscards with a combined
book value of nearly $10,000, provide two major insights. First, we find that the
predicted strategic behavior is considerably greater when the auctioned sportscards have
higher values. Second, dealers exhibit more of the predicted strategic behavior than do
nondealers, for both lower and higher priced cards. Nondealers may find that the
cognitive effort required to bid strategically exceeds the benefits, especially for low-
valued cards. By contrast, dealers have more experience with auctions and make their
living by trading cards, so their cognitive costs are likely lower than those of nondealers.
These two findings are consistent with recent theoretical models of monetary rewards and
decision costs, and extend previous experimental evidence from the laboratory into the
field.
2. Background on Multi-Unit Auctions
Our experiment examines bidding behavior in sealed-bid auctions for two
identical units of a homogeneous good, using two different price rules: uniform-price and
generalized Vickrey. A recent wave of theoretical literature has investigated equilibria in
uniform-price auctions with multi-unit demand (Noussair (1995), Katzman (1995),
Tenorio (1997), Engelbrecht-Wiggans and Kahn (1998), and Ausubel and Cramton
(1997)). The main result is that in uniform-price auctions, bidders have a dominant
strategy to truthfully reveal their demands for the first unit of the good, but they have an
incentive to reduce their bids below their valuations for additional units. The incentive is
that one’s bid on an additional unit might end up determining the price paid for winning a
single unit, so a lower bid has some chance of increasing one’s consumer surplus.3 The
economic consequences of demand reduction include inefficient allocations and possible
reductions in auction revenue.
To avoid the inefficiencies associated with the uniform-price auction, theorists
have identified an alternative mechanism, the generalized Vickrey auction, which gives
bidders a dominant strategy of revealing their true valuations for all units of the good. In
this multi-unit Vickrey auction, as in the uniform-price auction, each bidder can submit
up to n different sealed bids on individual units, and the top n bids are declared winners.
If a bidder submits one or more of the winning bids, her price for her first unit equals the
highest rejected bid submitted by someone else, and her price for the kth unit equals the
3 As Engelbrecht-Wiggans and Kahn (1998) demonstrate, multiple equilibria are possible, includingequilibria which involve truthtelling on both units. However, Ausubel and Cramton (1996) demonstratethat truthtelling equilibria are a special case; in almost all bidder valuation environments, a Nashequilibrium is guaranteed to have some demand reduction.

kth highest of the rejected bids submitted by others.4 This is a special case of a Groves-
Clarke mechanism for dominant-strategy truthtelling.5
For our purposes, this auction literature provides predictions about strategic
behavior on which to base a test of cognitive costs and rewards. Theory predicts second-
unit bids to be lower in the uniform-price auction than in the Vickrey auction. If
deliberation costs are important, we should find that demand reduction in the uniform-
price auctions is more prevalent for higher priced cards, as bidders will tend to invest
more effort in thinking about the subtle strategic incentives when they stand to gain more
from such effort. We have a similar prediction about dealers versus nondealers. Dealers
routinely participate in sportscard auctions both to sell and acquire their card stocks, and
even though they may never have participated in these particular auction formats, they
may exert less cognitive effort to find optimal strategies than nondealers with less prior
auction experience of any kind. Since dealers make their living selling cards and
typically sell cards for higher prices than nondealers, the monetary rewards to strategic
behavior may also be much larger for dealers. Both effects predict more strategic
demand reduction for dealers than nondealers.
3. Data
4 Technically, these rules are demand-revealing only in cases where every bidder’s demand curve is eitherflat or downward-sloping, as is assumed in the theoretical papers cited above. If bidders have upward-sloping demands (increasing returns to scale in purchases), then this simple pricing rule is invalid; a slightlymore complicated set of instructions would be required to implement a Groves-Clarke truthtellingmechanism.
5 See Groves(1973) and Clarke(1971). Intuitively, the key feature of this mechanism is that when bidderstruthfully reveal their willingness to pay for the goods, the price rule ensures that each winning bidder paysan amount equal to the surplus she displaces from the other bidder(s) who would have won in her absence.

We use data from a field experiment at a 1998 Orlando trading card show (List
and Lucking-Reiley (2000)) to compare outcomes in uniform-price and Vickrey sealed-
bid auctions, with particular attention paid to the effects of rewards and deliberation
costs. We conducted 82 Vickrey and 82 uniform-price auctions. Our participants were
of two types: card dealers and nondealers, each bidding against rivals of the same type.
The auctioned sportscards fit into two price categories: low (book value of $3) and high
(book value of $70). For the low-priced card auctions, we chose a Joe Montana 1982
Topps football card and a 1989 Michael Jordan Hoops basketball card. For the higher-
priced auctions, we selected a Cal Ripken, Jr. 1982 Topps baseball card and a Barry
Sanders 1989 Score football card. We sold dozens of each type of card, with all cards in
identical condition. All auctions for a given card type displayed the same sportscards to
bidders, and identical copies were sold to winning bidders after the auctions concluded.
To perform the simplest possible field experiment, we chose a design with two
bidders and two cards per auction. Two bidders were invited to submit two bids each for
two identical sportscards, in an auction with no reserve price. We chose the auction
format and card type for each subject according to a predetermined schedule, to avoid
accidentally introducing experimenter bias. After receipt of bids from a group of subjects
within a treatment, we randomly matched pairs of bidders to determine the outcome of
each two-person auction. Each participant’s experience typically followed four steps: (1)
inspection of the good, (2) learning the auction rules, (3) placing two bids, and (4)
conclusion of the transaction (usually a couple of hours after step (3)). No subject
participated in more than one auction.6
6 Experimental instructions are in the Appendices. For more details about the experimental procedure, seeList and Lucking-Reiley (2000).

Table 1 provides a breakdown of the number of auctions completed. In total, we
ran 164 different two-unit auctions, including 82 uniform-price and 82 Vickrey. We
auctioned 328 sportscards with a total book value of nearly $10,000. The numbers in the
table represent the number of auctions run for each treatment type. For example, we ran
15 uniform-price dealer auctions for Cal Ripken Jr. cards, which implies that we sold 30
Cal Ripken, Jr. cards to dealers in uniform-price auctions.
4. Experimental Results
Table 2 presents descriptive statistics of our bidding data. In List and Lucking-
Reiley (2000), we noted that the data provide evidence of strategic demand
reduction−across all five treatments second-unit bids are lower in the uniform-price
auctions than in the Vickrey auctions. Here, we push the data somewhat harder, and note
that the amount of demand reduction appears to vary both with the stakes of the
experiment ($3 versus $70 book values) and with the level of bidder experience
(nondealers versus dealers).
Before comparing the strategic behavior across dealers and nondealers, we point
out two apparent differences in their underlying demands for cards. First, dealers’
demands tend to be situated at a higher level than those of nondealers for the Joe
Montana card (book value $3), which was the only card auctioned to both types of
bidders. In both Vickrey and uniform-price auctions, and for both first units and second
units of the good, mean bids are higher for dealers than for nondealers. Second, dealers’
demands also appear to be less steeply sloped. In the Vickrey auction, where bids should

equal bidders’ true values, we find that dealers value a second unit at $0.77 (or 38%) less
than a first unit, on average, while the corresponding decline for nondealers is
significantly larger, at $0.90 (or 66%). This second effect also appears in the data for $70
cards, though the comparison is less clean because the cards auctioned to the two groups
were not identical. First-unit bids on $70 cards are relatively similar across subject types,
but demands are again less steeply sloped for dealers than for nondealers. The mean
decline between first and second Vickrey auction bids is $7.83 (16%) for dealers, but
$23.00 (44%) for nondealers.
The differences across bidder types appear consistent with dealers having better
resale opportunities for cards. Dealers hold inventories of cards that they later sell to
individual consumers typically at flat prices−they can usually sell a second copy of a
single card at the same price as they sold the first. Dealers also buy cards from individual
consumers, typically at prices 40-60% lower than those at which they sell them. By
contrast, most consumers collect single copies of individual cards, with little interest in
holding multiple copies. Furthermore, a given sportscard consumer might not even desire
a single copy of a particular card (e.g., if she already has a copy, or if she does not collect
cards of that type). For cards not desired for their collections, nondealers’ resale
opportunities are much lower than the resale opportunities of dealers. Nondealers might
be expected to get lower prices when selling, and would also generally find it more
inconvenient (costly) to locate a buyer.7 Overall, then, we might expect individual
7 This inconvenience might be relatively large in the case where the consumer wants to resell a single low-valued card, which helps to depress nondealers’ values proportionally more for the $3 card than for the $70card.

consumers to have both lower overall demands and steeper demand curves than dealers,
consistent with what we find in the data.
In the subsections below, we discuss our two major results: (1) strategic behavior
is much more evident for high-priced than low-priced cards, and (2) strategic behavior is
more evident for dealers than for nondealers.
4A. Strategic behavior is evident primarily for high-priced cards
Columns 3 and 4 of Table 2 provide strong evidence of strategic demand
reduction. As the theory predicts, second-unit bids are lower in the uniform-price than in
the Vickrey auctions. Mean Vickrey bids exceed mean uniform-price bids by
approximately $12 for the high-priced cards, and by only $0.05 to $0.30 for the low-
priced cards.
Figures 1-4 present a graphical depiction of these results. First, consider the data
from auctions for $70 cards: Ripken (nondealers) in Figure 1, and Sanders (nondealers) in
Figure 2. In each case, we note that the distribution of uniform-price bids clearly lies to
the left of the distribution of Vickrey bids, which we interpret as strategic demand
reduction in the uniform-price auctions. In stark contrast are nondealers’ second-unit
bids on the $3 cards: Jordan in Figure 3, and Montana in Figure 4. In these cases, the
Vickrey and uniform-price bid distributions look nearly indistinguishable from each
other, though the mean Vickrey bid remains numerically slightly higher than the mean
uniform-price bid.8
8 In the present paper, we provide figures only for second-unit bids. For histograms of first-unit bids, seeList and Lucking-Reiley (2001).

For each of the five different card treatments, we compute t-statistics for the
hypothesis that mean second-unit bids are equal across auction formats: tSanders,ND = 2.82,
tRipken,D = 3.10, tJordan,D = 0.47, tMontana,D = 1.19; tMontana,ND = 0.34.9 The five t-statistics all have
the expected positive sign, indicating that mean second-unit bids were larger in the
Vickrey auctions than in the uniform-price auctions.10 However, the differences are
statistically significant only for the two high-value cards (Ripken, Sanders), not for the
low-value cards (Jordan, Montana).
We conclude that the demand-reduction effect appears larger when the stakes are
higher. This is true not only in dollar magnitude, but also relative to the variance of bids
(as measured by the t-test). Subjects may have considered the stakes in the $3 card
auctions not to be large enough to warrant careful consideration of strategies, and
therefore made less than perfectly strategic second-unit bids.11 This is consistent with the
previously cited literature on deliberation costs in laboratory experiments.12
9 We report results of a large-sample test, which requires no distributional assumptions. We are making thelarge-sample assumption with sample sizes as small as 20; to check robustness we also conducted small-sample t-tests which assume populations have normal distributions and equal variances. The results werenever qualitatively different.
10 Further evidence of demand reduction can be obtained by examining the difference between eachbidder’s first and second-unit bids, a measure of the steepness of each bidder’s downward-sloping bidschedule. In each case, the mean difference between first-unit and second-unit bids is much larger in theuniform-price than in the Vickrey auctions. For example, differences between bid one and bid two were$7-$23 in the Vickrey auctions for expensive cards, compared with $30-$45 in the uniform-price auctions.For the low-priced cards, bids differed by $0.80-$0.90 in the Vickrey auctions, and $1.00-$1.50 in theuniform-price auctions. But, we note that one caveat to this differencing approach is that we do not findequality of first-unit bids across auction formats (for high-priced cards). Instead, first-unit bids are larger inthe uniform-price auctions than in the corresponding Vickrey auctions. The magnitude of the difference isin the $10 neighborhood for the high-priced ($70) cards, and $0.03 to $0.46 for the low-priced ($3) cards.For further discussion of this anomaly, see List and Lucking-Reiley (2000).
11 We implicitly assume here that the optimal strategy always involves demand reduction (lower second-bids in the uniform-price auction). Since the theoretically optimal strategy varies with the true distributionof bidder values, this is not necessarily the case. It is possible that because of intrinsic differences in biddervalues, some cards should have more demand reduction than others in Nash equilibrium. The true valuesare not directly observable, but the Vickrey bids should provide a good indication of the true distribution ofvalues.

4B. Strategic behavior increases with experience
We find some evidence for a second prediction of cognitive-cost theory: that
strategic behavior is more pronounced when agents have more experience. Since dealers
generally have more experience with auctions than nondealers,13 we examine differences
in strategic behavior between dealers and nondealers. We focus here on bidding behavior
for the $3 Joe Montana card, the only card bid on by both dealers and nondealers.
The descriptive statistics in Table 2 indicate some evidence of dealers behaving
more strategically than nondealers. The difference in mean second-unit bids between the
Vickrey and uniform-price auctions is $0.32 for dealers (roughly 25% of the mean
Vickrey bid), but only $0.05 for nondealers (roughly 10% of the mean Vickrey bid).
Neither amount is significantly different from zero at conventional levels, but for dealers
the difference at least begins to approach statistical significance (p = 0.213, two-tailed,
versus p = 0.734 for nondealers).
Fortunately for our purposes, the main difference between the shapes of the low-stakes and the high-stakesvalue distributions is that the low-stakes cards appear to have values skewed towards zero. The theorygenerally predicts the opposite of what we observe: when values are more concentrated at zero, thereshould be more strategic demand reduction in uniform-price auctions. Although not proved in general, thisclaim is substantiated by several examples given by Engelbrecht-Wiggans and Kahn (1998) and Ausubeland Cramton (1996). The intuition for this claim (more demand reduction with lower distributions ofvalues) is that the gains from demand reduction are greater when one’s second-unit bid is more likely toactually determine the price, which can only occur when others’ bids are sufficiently low. Thus,differences in bid distributions do not appear to be the reason for the observed lessening of demandreduction in our low-stakes experiments.
12 See Slonim and Roth (1998) for a recent laboratory experiment where an increase in stakes movesbehavior closer to Nash equilibrium. With a month’s salary at stake instead of a more typical laboratorypayoff amount, their subjects moved closer to subgame-perfect strategies in the ultimatum game, thoughthe equilibrium was still significantly different from that predicted by theory.
13 Admittedly, individuals in this market have little experience with multi-unit auctions, but we believe thatprevious experience with single-unit auctions may give bidders a better general feel for competitive biddingstrategies.

Figures 4 and 5 provide a visual comparison of the second-unit bids for the Joe
Montana card. Figure 4 shows very little difference in mean bids between the two
auction formats for nondealers, with somewhat higher variance of bids in the uniform-
price auction. By contrast, Figure 5 shows one main difference in dealers’ bidding
behavior between auction formats: there are more zero bids in the uniform-price auction
than in the Vickrey auction. A comparison between the two figures also indicates that the
overall level of demand for the cards was higher for dealers, with a considerable number
of bids above $2.00, than for nondealers.
An alternative test of demand reduction provides stronger statistical support of the
experience hypothesis. As in List and Lucking-Reiley (2000), we examine whether the
slopes of individuals’ bid schedules are steeper in the uniform-price auction than in the
Vickrey auction. In other words, we test whether the difference between an individual’s
first-unit bid and his second-unit bid is greater in the uniform-price auction, as predicted
by demand-reduction theory. Though dealers’ bid schedules are slightly flatter than
nondealers’ bid schedules in the Vickrey auction (consistent with better resale
opportunities for multiiple units), their bid schedules are somewhat steeper than those of
nondealers in the uniform-price auction. Performing a two-tailed t-test of differences in
bid differences across auction types, we find statistical significance at the 13% level (p =
0.128) for dealers, and statistical insignificance (p = 0.80) for nondealers.14 This
evidence of a difference between dealers and nondealers, while somewhat noisy, is
suggestive that dealers behave more strategically, exhibiting more demand reduction,
14 See footnote 9 for a caveat to this finding.
than nondealers. This finding is consistent with the notion that dealers need to exert less
effort than nondealers to place optimal bids.
4. Concluding Remarks
Recent evidence from the laboratory indicates that predictions of rational models
may fail if the cognitive costs of finding optimal strategies are large compared to their
expected rewards. We explore this issue in the field by auctioning-off nearly $10,000
worth of sportscards in 164 different auctions. Our results suggest that strategic behavior
and expected payoffs are positively correlated. Indeed, bidders exhibited strategic
demand-reduction behavior much more for high-priced cards than they did for lower-
priced cards. A second result is that subjects more experienced with sportscard auctions
exhibited a greater tendency to engage in demand reduction than did less experienced
subjects. The effect of the size of the stakes is much more pronounced than the effect of
the bidder type. In particular, we find pronounced evidence of strategic behavior for
goods worth around $70. For goods worth around $3, by contrast, we find no evidence of
strategic behavior for inexperienced bidders (nondealers), and some weak evidence of
strategic behavior for experienced bidders (dealers). The size of the stakes, and to some
extent bidder experience, both help to explain when strategic behavior is more likely.

References
Ausubel, Lawrence M. and Peter C. Cramton (1996), “Demand reduction andinefficiency in multi-unit auctions,” University of Maryland, working paper.
Camerer, Colin and Robin M. Hogarth (1999), “The Effect of Financial Incentives onPerformance in Experiments: A Review and Capital-Labor Theory,” Journal of Risk andUncertainty, 19, 7-42.
Clarke, E. (1971), “Multipart Pricing of Public Goods,” Public Choice, 2, 19-33.
Conlisk, John (1996), “Why Bounded Rationality?” Journal of Economic Literature, 34,669-700.
Engelbrecht-Wiggans, Richard and Charles M. Kahn (1998), “Multi-Unit Auctions withUniform Prices,” Economic Theory, vol. 12, pp. 227-258.
Groves, Theodore (1973), “Incentives in Teams,” Econometrica, 41, 617-31.
Katzman, Brett Eric (1995), “Multi-unit auctions with incomplete information,” Workingpaper, University of Miami.
List, John A. and Jason F. Shogren (1998), “Deadweight loss of Christmas: Comment,”American Economic Review, December, 88(5), pp. 1350-1356.
List, John A. (2000), “Do Explicit Warnings Eliminate the Hypothetical Bias inElicitation Procedures? Evidence from Field Auctions for Sportscards.” AmericanEconomic Review, forthcoming.
List, John A., and David Lucking-Reiley (2000), “Demand Reduction in Multi-UnitAuctions: Evidence from a Sportscard Field Experiment,” American Economic Review,forthcoming.
List, John A., and David Lucking-Reiley (2001), “Demand Reduction in Uniform-PriceMulti-Unit Auctions,” Handbook of Experimental Economic Results, forthcoming, 2001.
Noussair, Charles (1995), “Equilibria in a multi-object uniform price sealed bid auctionwith multi-unit demands,” Economic Theory, 5, 337-351.
Slonim, Robert, and Alvin E Roth (1998), “Learning in high stakes ultimatum games: anexperiment in the Slovak Republic,” Econometrica, 66, 569-596.
Smith, Vernon L., and James M. Walker (1993), “Monetary Rewards and Decision Costin Experimental Economics,” Economic Inquiry, 31, 245-261.

Smith, Vernon L., and Ferenc Szidarovszky (1999), “Monetary Rewards and DecisionCost in Strategic Interactions,” Working paper, University of Arizona.
Tenorio, Rafael (1997), “On Strategic Quantity Bidding in Multiple Unit Auctions,”Journal of Industrial Economics, vol. 40, no.2, pp. 207-217.
Vickrey, William (1961), “Counterspeculation, Auctions, and Competitive SealedTenders,” Journal of Finance, vol. 16, no.1, pp. 8-37.
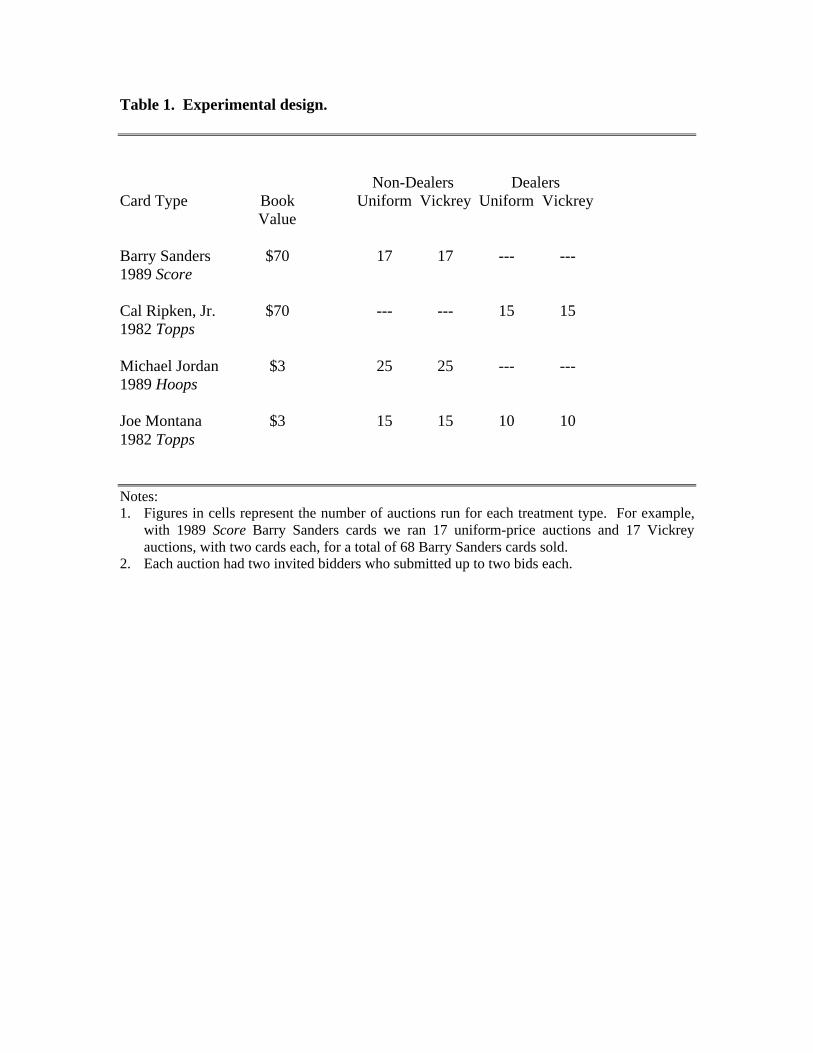
Table 1. Experimental design.
Non-Dealers DealersCard Type Book
ValueUniform Vickrey Uniform Vickrey
Barry Sanders $70 17 17 --- ---1989 Score
Cal Ripken, Jr. $70 --- --- 15 151982 Topps
Michael Jordan $3 25 25 --- ---1989 Hoops
Joe Montana $3 15 15 10 101982 Topps
Notes:1. Figures in cells represent the number of auctions run for each treatment type. For example,
with 1989 Score Barry Sanders cards we ran 17 uniform-price auctions and 17 Vickreyauctions, with two cards each, for a total of 68 Barry Sanders cards sold.
2. Each auction had two invited bidders who submitted up to two bids each.
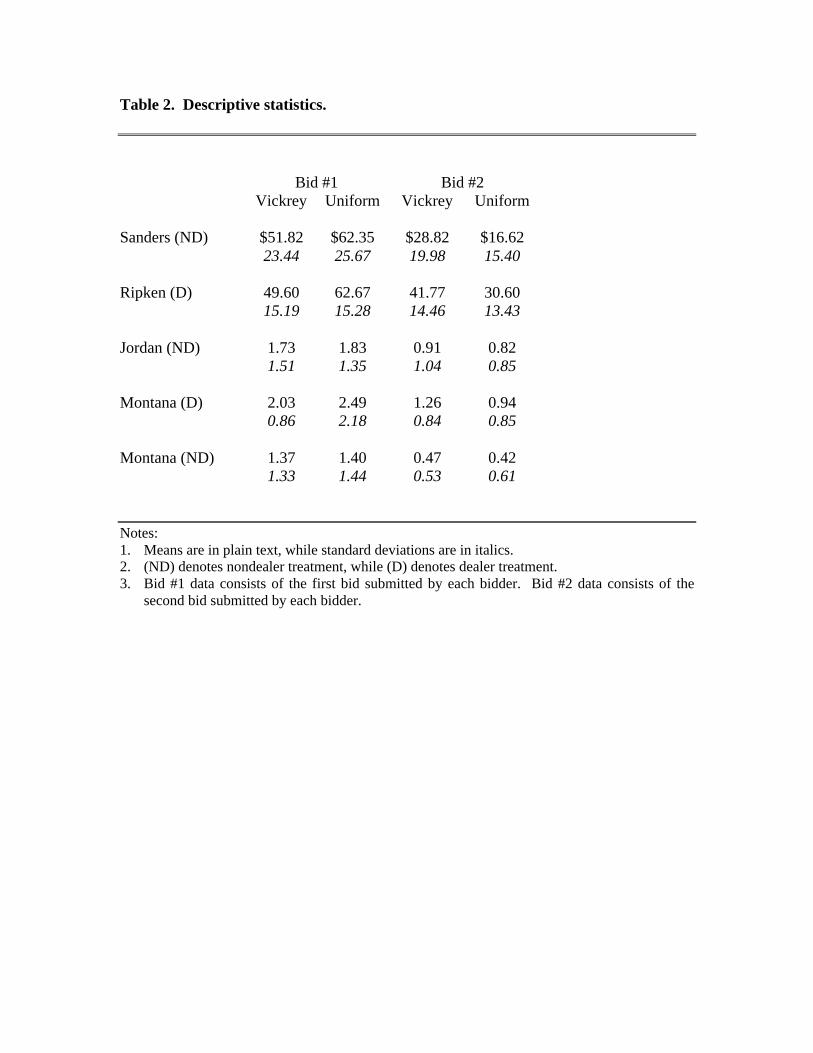
Table 2. Descriptive statistics.
Bid #1 Bid #2Vickrey Uniform Vickrey Uniform
Sanders (ND) $51.82 $62.35 $28.82 $16.6223.44 25.67 19.98 15.40
Ripken (D) 49.60 62.67 41.77 30.6015.19 15.28 14.46 13.43
Jordan (ND) 1.73 1.83 0.91 0.821.51 1.35 1.04 0.85
Montana (D) 2.03 2.49 1.26 0.940.86 2.18 0.84 0.85
Montana (ND) 1.37 1.40 0.47 0.421.33 1.44 0.53 0.61
Notes:1. Means are in plain text, while standard deviations are in italics.2. (ND) denotes nondealer treatment, while (D) denotes dealer treatment.3. Bid #1 data consists of the first bid submitted by each bidder. Bid #2 data consists of the
second bid submitted by each bidder.
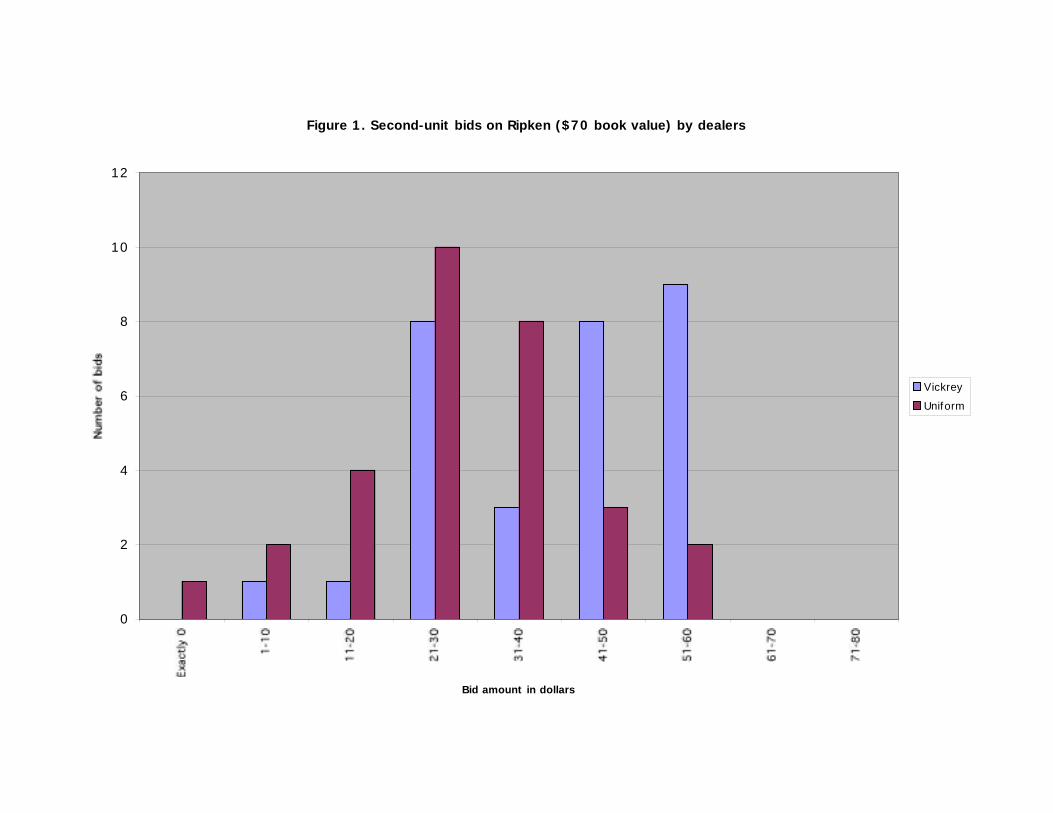
Figure 1. Second-unit bids on Ripken ($70 book value) by dealers
0
2
4
6
8
10
12
Bid amount in dollars
Vickrey
Uniform
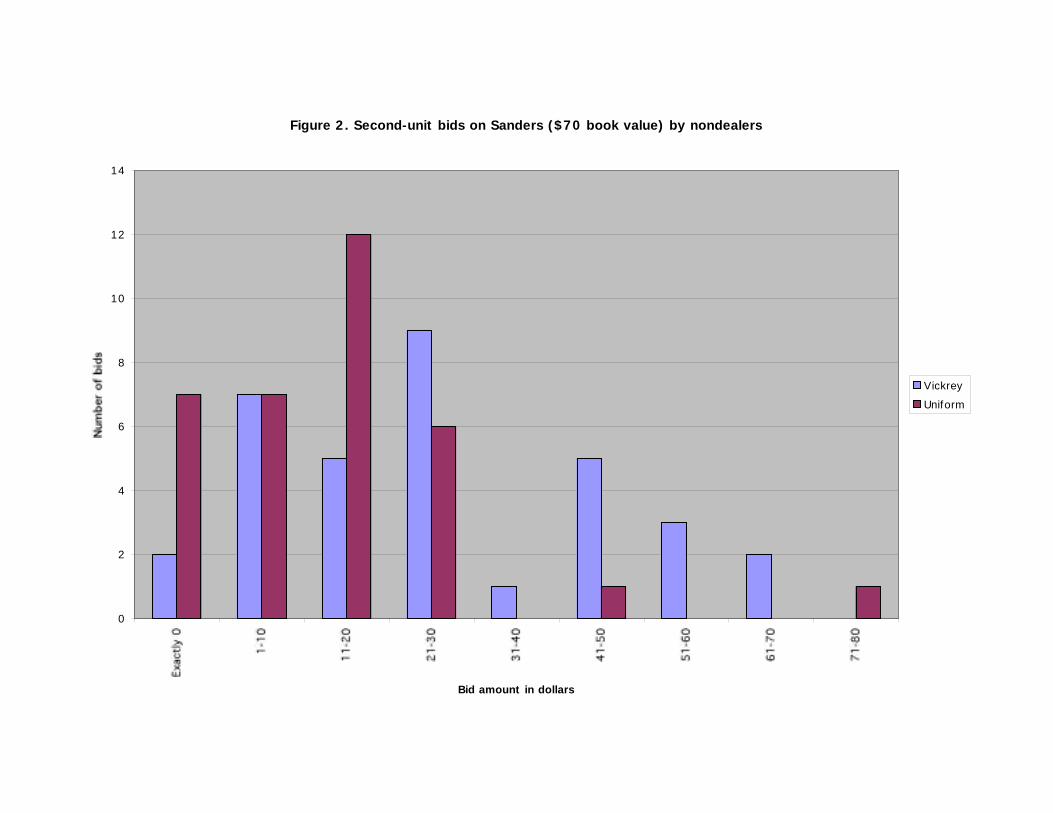
Figure 2. Second-unit bids on Sanders ($70 book value) by nondealers
0
2
4
6
8
10
12
14
Bid amount in dollars
Vickrey
Uniform

Figure 3. Second-unit bids on Jordan ($3 book value) by nondealers
0
2
4
6
8
10
12
14
16
18
Bid amount in dollars
Vickrey
Uniform

Figure 4. Second-unit bids on Montana ($3 book value) by nondealers
0
2
4
6
8
10
12
14
16
Bid amount in dollars
Vickrey
Uniform

Figure 5. Second-unit bids on Montana ($3 book value) by dealers
0
1
2
3
4
5
6
7
8
9
Bid amount in dollars
Vickrey
Uniform

Appendix 1. Subject Instructions for Uniform-Price Auction
Welcome to Lister’s Auctions. You have the opportunity to bid in an auction for two identicalsportscards. There are only two bidders in this auction; the other bidder will be randomly chosenfrom other participants at today’s card show. (If you are a card dealer you will be pairedrandomly with one other card dealer in your auction. If you are a non-dealer, you will be pairedwith one other non-dealer.)
The cards up for auction are two copies of the following card: Card A PSA 8
Auction Rules:
You are asked to submit two bids — one bid for each card. If you choose to place only one bid,your second bid will be counted as a bid of zero dollars.
Since there are two bidders, there will be a total of four bids submitted. The winning bids will bethe highest two from the group of four bids. For each card won, the purchase price is equal to theamount of the third-highest bid (that is, the highest losing bid).
I will order the four bids from highest to lowest in order to determine the winners of the twoitems.
For example, if the bids are ranked highest to lowest as follows:
$A$B$C$D
The bidder who bid $A wins one card and pays $C.The bidder who bid $B wins the second card and pays $C.
Note that one person might have submitted both of the top bids, and thus would buy both cards for $C each.
If a TIE occurs between $B and $C, I will flip a coin to determine the winner.
ExampleBefore you submit your actual bids, I would like you to work through an example. Consider acouple of bids that you might submit, and write the numbers here in these two blanks.
my 1st bid_____________ my 2nd bid_____________
Now make up a couple of bids that the other bidder might submit, and fill those numbers intothese blanks.
other bidder’s 1st bid____________ other bidder’s 2nd bid____________

Take the four bids and order them from highest to lowest:
highest bid:____ ____ ____ lowest bid:____
Now, determine how many cards you have won, how many cards the other bidder has won, andthe amount each of you has to pay. Fill those numbers in here.
number of cards I won______ amount I must pay______
number cards other bidder won______ amount other bidder must pay______
To assure that you understand how this auction mechanism operates, I will check your work afteryou complete this example.
Final TransactionAt 1PM I will determine the winners of each auction completed between 8AM and 12:30PM. Forthose auctions completed after 1PM I will determine the winners at 5PM. After the winners payme (cash or check) for the cards, the cards will be awarded to the winners. Note, regardless ofprice, the cards will be awarded to the winners. In case you cannot attend the “determination ofwinners” sessions, please provide your name, mailing address, and phone number below:
Name_____________________
Address_______________________________________________________________
Phone#____________________
If you are unable to attend at 1PM (or 5PM), I will contact you by phone. Upon receipt of yourcheck or cash, I will send you the cards that you won. All postage will be paid by Lister’sAuctions for cards mailed to winners.
Note that while this is a real auction for real cards, I plan to use data on the bids in this auction foreconomic research. I guarantee to sell both of the cards listed to the winners of this two-bidderauction, no matter what the final auction prices turn out to be. Your bids represent bindingcommitments to buy cards you win at the prices specified by the auction outcomes.
Good luck—please write your bids on the sheets provided.
Thanks for participating.

Appendix 2. Subject Instructions for Vickrey Auction
All text is identical to that of Appendix 1, with the exception of the Auction Rules and Examplesections, shown below:
Auction Rules:You are asked to submit two bids — one bid for each card. If you choose to place only one bid,your second bid will be counted as a bid of zero dollars.
Since there are two bidders, there will be a total of four bids submitted. The winning bids will bethe highest two from the group of four bids. For each card won, the purchase price will bedetermined as follows.
⟨ For the first unit you win, you pay an amount equal to the highest rejected bid which wasnot your own.
⟨ For the second unit you win, you pay an amount equal to the second-highest rejected bidwhich was not your own.
I will order the four bids from highest to lowest in order to determine the winners of the twoitems.
Example 1: if the bids are ranked highest to lowest as follows:
$A (from bidder 1)$B (from bidder 2)$C (from bidder 2)$D (from bidder 1)
Bidder 1 wins one card and pays $C. Bidder 2 wins the second card and pays $D.
Example #2. If bids are rank ordered as follows:
$A (from bidder 1)$B (from bidder 1)$C (from bidder 2)$D (from bidder 2)
Bidder 1 wins one card and pays $C. Bidder 1 wins the second card and pays $D.
Example #3. If bids are rank ordered as follows:
$A (from bidder 1)$B (from bidder 2)$C (from bidder 1)$D (from bidder 2)
Bidder 1 wins one card and pays $D. Bidder 2 wins the second card and pays $C.If a TIE occurs between $B and $C, I will flip a coin to determine the winner.
Example
Before you submit your actual bids, I would like you to work through an example. Consider acouple of bids that you might submit, and write the numbers here in these two blanks.
my 1st bid_____________ my 2nd bid_____________
Now make up a couple of bids that the other bidder might submit, and fill those numbers intothese blanks.
other bidder’s 1st bid____________ other bidder’s 2nd bid____________
Take the four bids and order them from highest to lowest:
highest bid:____ ____ ____ lowest bid:____
Now, determine how many cards you have won, how many cards the other bidder has won, andthe amount each of you has to pay. Fill those numbers in here.
number of cards I won______ amount I must pay______
number cards other bidder won______ amount other bidder must pay______
To assure that you understand how this auction mechanism operates, I will check your work afteryou complete this example.


![arXiv:2004.09029v1 [astro-ph.HE] 20 Apr 2020Thomas A. Prince,1 Eliot Quataert,20 Dan Reiley,6 Reed L. Riddle,6 Ben Rusholme,11 Yashvi Sharma,1 David L. Shupe, 11 Jesper Sollerman,](https://static.fdocuments.in/doc/165x107/5f365fb91ea0b048c2174b3c/arxiv200409029v1-astro-phhe-20-apr-2020-thomas-a-prince1-eliot-quataert20.jpg)


