
by Joana Filipa Lourenço Garcia Master Dissertation in ...
41
The Impact of Working Capital Management upon Companies’ Profitability: Evidence from European Companies by Joana Filipa Lourenço Garcia Master Dissertation in Finance and Taxation Supervised by: Professor Doutor Francisco Vitorino Martins Professor Doutor Elísio Brandão 2011
Transcript of by Joana Filipa Lourenço Garcia Master Dissertation in ...

The Impact of Working Capital Management upon Companies’
Profitability: Evidence from European Companies
by
Joana Filipa Lourenço Garcia
Master Dissertation in Finance and Taxation
Supervised by:
Professor Doutor Francisco Vitorino Martins
Professor Doutor Elísio Brandão
2011

i
Acknowledgments
The writing of this dissertation has been one of the most significant and challenging
academic experiences I have ever had to face. Without the support, patience and
guidance of the following people, this study would not have been completed.
I wish to thank, first and foremost, my Professor and supervisor, Francisco Vitorino
Martins. I am grateful for his knowledge sharing on empirical study, his constant
availability to guide me in the right direction and for giving me valuable suggestions
and critics.
I would like to show my gratitude to Professor Elísio Brandão for providing me with
important material on how to structure my dissertation, and the time spent monitoring
my work.
Additionally, I thank Professor António Cerqueira who has given me the insight needed
on DataStream database.
Lastly, and most importantly, this dissertation would not have been possible without the
loving support of my family, boyfriend and friends. Who have given me endless support
and helped maintain a positive energy throughout my dissertation.
It is a pleasure to thank all those who have made this dissertation possible.

ii
Abstract
Companies can use working capital management as an approach to influence their
profitability. This paper studies the impact of working capital management and its
components upon the profitability of European companies. Cash Conversion Cycle is
used as a comprehensive measure for working capital management and Gross Operating
Profitability used as a measure for profitability. This study is based on a sample of
2,974 non - financial companies listed in 11 European Stock Exchanges for a period of
12 years: 1998 - 2009. The results of GLS and OLS regression analysis found a
significant negative relationship between Receivables Collection Period, Inventory
Conversion Period, Payables Deferral Period, Cash Conversion Cycle and profitability.
This suggests that companies can improve their profitability by reducing the time span
during which working capital is tied up within the company.
An inverse relationship between liquidity measured by Current Ratio and profitability
was also found and an additional analysis revealed that different levels of liquidity lead
to differentiated impacts of the Cash Conversion Cycle upon operating profitability.
Keywords: Working Capital Management, Corporate Profitability, Cash Conversion
Cycle, European Countries

iii
Index
Acknowledgments ............................................................................................................. i
Abstract ............................................................................................................................. ii
Index ................................................................................................................................ iii
Index of Tables ................................................................................................................ iv
Acronyms .......................................................................................................................... v
1 Introduction ............................................................................................................... 1
2 Literature Review ...................................................................................................... 5
3 Methodology .............................................................................................................. 8
3.1 Data and Sample ..................................................................................................... 8
3.2 Hypotheses .............................................................................................................. 9
3.3 Variables ............................................................................................................... 10
3.4 Model Specifications ............................................................................................. 12
4 Empirical Results ..................................................................................................... 14
4.1 Descriptive Statistics ............................................................................................. 14
4.2 Correlation Analysis .............................................................................................. 15
4.3 Empirical Models .................................................................................................. 17
4.3.1 European Context ............................................................................................... 17
4.3.2 Countries ............................................................................................................ 23
4.3.3 Sector dummy .................................................................................................... 25
4.3.4 Time Period ........................................................................................................ 27
4.3.4 Additional Analysis ............................................................................................ 29
5 Conclusions ............................................................................................................. 31
References ....................................................................................................................... 33

iv
Index of Tables
Table 1: DataStream Codes .............................................................................................. 9
Table 2: Formulas of Variables and Abbreviations ........................................................ 10
Table 3: Descriptive Statistics ........................................................................................ 14
Table 4: Correlation Analysis ......................................................................................... 15
Table 5: Relationship between WCM and profitability (1998-2009): GLS with cross
section weights and pooled OLS methods ...................................................................... 18
Table 6: Relationship between WCM and profitability (1998–2009): Fixed Effects
regression models (fixed cross-section and fixed period) .............................................. 22
Table 7: Relationship between WCM and profitability by country (1998-2009): GLS
with cross section weights .............................................................................................. 24
Table 8: Relationship between WCM and profitability (1998-2009): GLS with cross
section weights method - sector dummy details ............................................................. 26
Table 9: Relationship between WCM and profitability (1998-2009): GLS with cross
section weights method – year dummy details ............................................................... 28
Table 10: Relationship between WCM and profitability (1998-2009): GLS with cross
section weights - different levels of liquidity ................................................................. 30

v
Acronyms
GLS Generalized Least Squares
OLS Ordinary Least Squares
WCM Working Capital Management
CCC Cash Conversion Cycle
GOP Gross Operating Profitability
RCP Receivables Collection Period
PDP Payables Deferral Period
ICP Inventory Conversion Period
LnS Logarithm of Sales (Size of Companies)
DR Debt Ratio
CR Current Ratio
FAR Financial Assets to Total Assets Ratio

1
1 Introduction
Studies on corporate finance generally focus on main decisions like capital structure,
dividend and capital budgeting. These issues imply the study of long term financial
decisions and have been receiving greater attention from researchers. Working capital is
also an important component in companies’ financial decision making. However, it
involves investment and financing in short term periods. Because of that working
capital has been seen as secondary in financial literature compared to long term
financing decisions.
Many studies try to show that optimal working capital management contributes in a
positive way to the creation of value. Thus, we should not overlook an appropriate
investment on working capital in financial decision making.
Financial objectives, such as sales and profit, are still a primary purpose for companies.
In other words, increasing their market value is the main goal. Working capital
management is a very important component of corporate finance because it directly
affects companies’ liquidity and profitability (Deloof, 2003; Eljelly, 2004; Raheman
and Nasr, 2007). Therefore, efficient management of working capital is a fundamental
part of the overall corporate strategy to create shareholder value. In general, companies
try to keep an optimal level of working capital that maximizes their value (Deloof,
2003; Afza & Nazir, 2007).
In this paper, following the line of research of Raheman and Nasr (2007), we study the
effects of working capital management upon the corporate performance of European
companies. Previous research analyzed those effects within the context of a particular
country. This paper´s contribution is to test the mentioned relationship at a broader level
– by using a set of European companies.
To the best of our knowledge, we are not aware of any paper that examines the
efficiency of working capital management of a set of European companies as a whole.
Thus, our analysis is based on a sample of 2,974 non-financial companies from 11
European countries for a period of 12 years: 1998 – 2009. We estimate our regressions
using the Generalized Least Squares (cross section weights) and Pooled Ordinary Least

2
Squares models. Our results are robust and find that working capital management
significantly affects operating profitability of European companies.
We also analyze whether the different components of working capital management have
a significant impact upon companies’ profitability and how does that impact occur.
Thus, this study helps examine the efficiency of European companies in managing their
receivables, inventory and payables and so it contributes to companies’ financial
management policies as well as to the financial literature on this theme.
The analysis was also carried out by country during the period already mentioned.
Furthermore, we study the relationship between liquidity and profitability of the
European companies as well as the interference that different levels of liquidity can
have upon working capital management and its relationship with profitability.
Working capital management and its implications are addressed before we proceed to
the next section.
Working capital management involves the decision on the amount and composition of
current assets and how to finance such assets. Current assets include all those assets that
in the normal course of business return to the form of cash within a short period of time,
ordinarily within a year, and such temporary investment as may be readily converted
into cash upon need (Raheman and Nasr, 2007).
Efficient working capital management involves planning and controlling current assets
and current liabilities to prevent the risk of a company’s inability to meet due short term
obligations on the one hand, and to avoid excessive investment in these assets on the
other hand (Eljelly, 2004). Many surveys have indicated that managers spend
considerable time on day-to-day problems that involve working capital decisions
(Raheman and Nasr, 2007). One reason for this is that current assets are short-lived
investments that are continually being converted into other types (RAO, 1989). With
regard to current liabilities, the company is responsible for paying these obligations on a
timely basis. Taken together, decisions on the level of different working capital
components become frequent, repetitive, and time consuming (Raheman and Nasr,
2007).

3
The way how working capital is managed can have a significant impact upon both the
liquidity and profitability of the company (Shin and Soenen, 1998; Dong and Su, 2010).
The ultimate goal of any company is to maximize profits. But, preserving its liquidity is
also an important objective (Shin and Soenen, 1998; Raheman and Nasr, 2007). It is not
a simple task for managers to make sure that in managing working capital, liquidity is
maintained in day-to-day operations and that, simultaneously, business operations run
efficiently and in a profitable manner (Zariyawati et al., 2009). Some decisions that tend
to maximize profitability tend to minimize the chances of appropriate liquidity.
Conversely, focusing almost entirely on liquidity will tend to reduce company’s
potential profitability (Mathuva, 2010). The dilemma in working capital management is
to achieve the desired balance between liquidity and profitability. One of the objectives
should not be achieved at the cost of the other because both have their importance.
Hence, working capital management should be given proper consideration and will
ultimately influence the company’s profitability (Raheman and Nasr, 2007; Dong and
Su, 2010).
Working capital has been regarded as the result of the time lag between the expenditure
for purchasing raw materials and the collection from the sale of the finished good (Dong
and Su, 2010). Thus, the Cash Conversion Cycle is a powerful measure for assessing
how well a company is managing its working capital. The longer this time lag, the
larger the investment in working capital (Deloof, 2003). Shorter cash conversion cycle
could be associated to high profitability because the longer the cash conversion cycle
the greater the need for expensive external financing. Therefore, by reducing the period
that cash is tied up in working capital, companies can operate more efficiently (Nobanee
and AlHajjar, 2009a).
Cash conversion cycle can be shortened by reducing the inventory conversion period
via processing and selling goods more quickly; or by decreasing the receivables
collection period via speeding up collections; or by lengthening the payables deferral
period through slowing down payments to suppliers (Nobanee, 2009). This increases
companies’ efficiency of internal operations and results on higher profitability and
higher market value.

4
Delaying payments to suppliers allows companies to assess the quality of the products
that were bought, and can be an inexpensive and flexible source of financing. But we
should bear in mind that late payment can have a very high implicit cost whenever early
payment discounts are available. Since, money is also locked up in working capital, the
greater the investment in current assets, the lower the risk but also the lower the
profitability obtained (Falope and Ajilore, 2009).
From another point of view, longer cash conversion cycle might increase profitability. It
can happen because large inventories and a generous trade credit policy may lead to
high sales. Larger inventories decrease stock-out risks. Trade credit may stimulate sales
because it allows customers to assess product quality before paying (Long, Maltiz and
Ravid, 1993; and Deloof and Jegers, 1996). However, corporate profitability might also
decrease with cash conversion cycle, if costs with higher investments in working capital
are higher and rise faster than the benefits of holding more inventories and granting
more inventories and trade credit to customers (Deloof, 2003). Moreover, shortening the
cash conversion cycle could harm the companies´ profitability; reducing the inventory
conversion period could increase the shortage cost; reducing the receivables collection
period could make the companies lose their good credit customers; and lengthening the
payable period could damage the companies’ credit reputation. Shorter cash conversion
cycle is associated with high opportunity costs, and longer cash conversion cycle is
associated with high carrying costs (Nobanee, 2009).
An optimal level of working capital would be that in which a balance between risk and
efficiency is attained, and both carrying costs and opportunity costs are minimized. It
requires continuous monitoring to maintain the proper level of the various components
of working capital, i.e., cash receivables, inventory and payables, etc.
The reminder of this paper proceeds as follows. The next section presents the literature
review. Section three deals with methodology, data, hypotheses and variables issues.
Then section four presents the empirical results. Finally the last section discusses and
concludes the findings of this study.

5
2 Literature Review
The effects of working capital management upon corporate performance have been the
focus of a substantial amount of theoretical and empirical research for many years and
in different environments. Traditional approach to the interaction between cash
conversion cycle and profitability posits that relatively long cash conversion periods
tend to decrease profitability (Samiloglu and Demirgunes, 2008). It means that reducing
working capital investment would positively influence the companies’ profitability by
reducing the proportion of current assets in total assets. Most studies in this area show
that companies can improve their profitability by shortening the cash conversion cycle
because they found a strong negative relationship between these two variables. Various
results were obtained when it comes to the relationship between different components
of the Cash Conversion Cycle and corporate profitability.
Shin and Soenen (1998) are an example of such studies. By using a COMPUSTAT
sample of 58,985 US company years covering the period 1975-1994, they found a
strong negative relationship between the length of the company’s net-trade cycle, used
to measure efficiency of working capital management, and its profitability. In addition,
shorter net trade cycles were associated with higher risk adjusted stock returns. Based
on their findings, they suggest that one possible way to create shareholder value is to
reduce company’s Net-Trade Cycle.
Deloof (2003) discussed that most companies had a large amount of cash invested in
working capital. It can therefore be expected that the way in which working capital is
managed will have a significant impact upon those company’s profitability. Using a
sample of 1,009 large Belgian non-financial companies during the period 1992-1996,
with correlation and regression tests, he found a significant negative relationship
between gross operating income and the number of days of accounts receivable,
inventories and accounts payable of Belgian companies. On the basis of these results, he
suggested that managers could create value for their shareholders by reducing the
number of days of receivables and inventories accounts to a reasonable minimum. The
negative relationship between accounts payable and profitability is consistent with the
view that less profitable companies wait longer to pay their bills.

6
Lazaridis and Tryfonidis (2006) studied the relationship between working capital
management and corporate profitability of listed companies in the Athens Stock
Exchange. They used a sample of 131 listed companies for the period 2001-2004. The
results from the regression analysis suggest that there is a statistical significant
relationship between profitability, measured through Gross Operating Profit, and the
Cash Conversion Cycle. From those results, these authors claim that managers could
create value for shareholders by handling correctly the cash conversion cycle and by
keeping each different component to an optimum level.
In the Pakistan context, Raheman and Nasr (2007) selected a sample of 94 Pakistani
companies listed on the Karachi Stock Exchange for a period of 6 years from 1999-
2004 to study the effects of different variables of working capital management
including Average Collection Period; Inventory Turnover in Days; Average Payment
Period; and the Cash Conversion Cycle upon Net Operating Profitability. The results of
this study showed that there was a strong negative relationship between the above
mentioned variables of working capital management and companies’ profitability.
Besides, they also showed a positive relationship between the size of the company,
measured by natural logarithm of sales, and profitability. A similar study by Falope and
Ajilore (2009) found similar results upon a sample of 50 Nigerian quoted non-financial
companies for the period 1996-2005. Furthermore, they found no significant variations
in the effects of working capital management between large and small companies.
Zariyawati et al. (2009) also examined the relationship between working capital
management and corporate profitability. Cash Conversion Cycle was used as a
measured for working capital management and the study was based on panel data for
1,628 company-years for the period 1996-2006 from six different economic sectors
listed in Bursa Malaysia. The coefficient results of Pooled OLS regression analysis
provided a strong negative significant relationship between Cash Conversion Cycle and
corporate profitability. This reveals that reducing cash conversion period results in
increased profitability. Thus, company managers should work on shortening cash
conversion cycle till optimal level is achieved.
Nobanee and AlHajjar (2009b) analyzed a sample of 2,123 Japanese non-financial
companies listed in the Tokyo Stock Exchange for the period 1990-2004 and concluded
7
that company managers can increase profitability by shortening the cash conversion
cycle, the receivables collection period and the inventory conversion period. The results
also suggested that extending the payables deferral period could increase profitability.
However, managers should be careful because extending the payables deferral period
could damage the company’s credit reputation and harm its profitability in the long run.
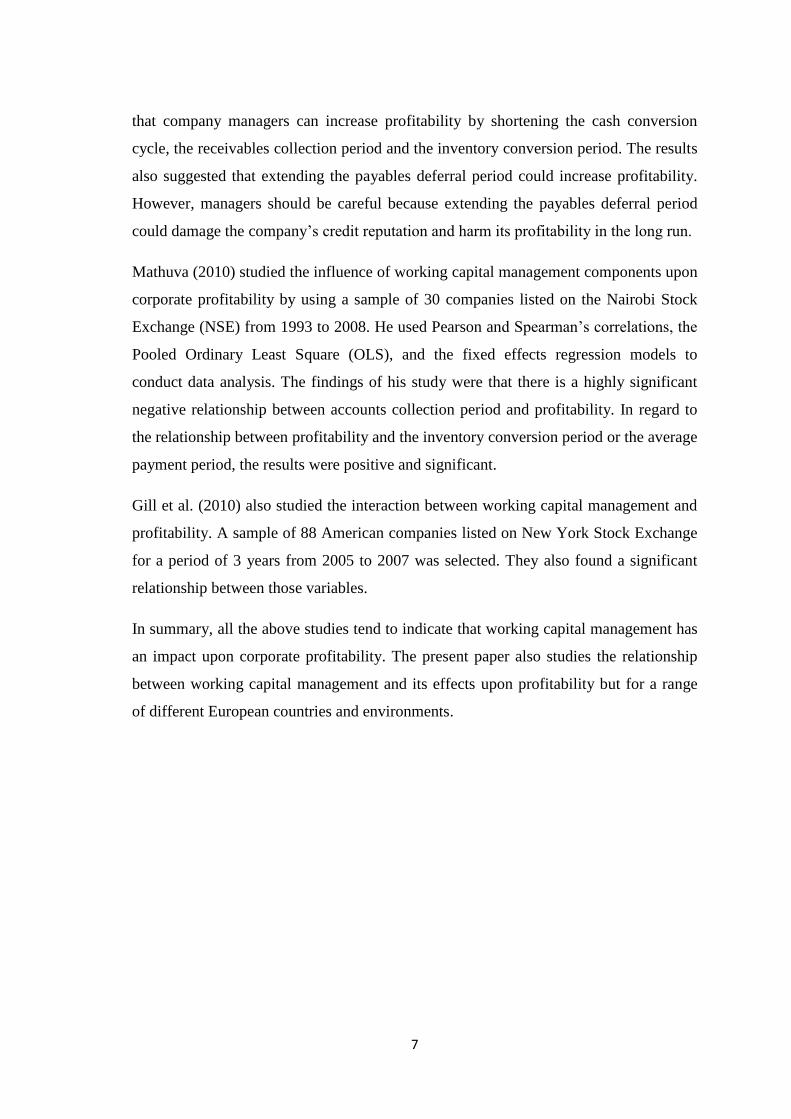
Mathuva (2010) studied the influence of working capital management components upon
corporate profitability by using a sample of 30 companies listed on the Nairobi Stock
Exchange (NSE) from 1993 to 2008. He used Pearson and Spearman’s correlations, the
Pooled Ordinary Least Square (OLS), and the fixed effects regression models to
conduct data analysis. The findings of his study were that there is a highly significant
negative relationship between accounts collection period and profitability. In regard to
the relationship between profitability and the inventory conversion period or the average
payment period, the results were positive and significant.
Gill et al. (2010) also studied the interaction between working capital management and
profitability. A sample of 88 American companies listed on New York Stock Exchange
for a period of 3 years from 2005 to 2007 was selected. They also found a significant
relationship between those variables.
In summary, all the above studies tend to indicate that working capital management has
an impact upon corporate profitability. The present paper also studies the relationship
between working capital management and its effects upon profitability but for a range
of different European countries and environments.

8
3 Methodology
This section presents the data and the hypotheses underlying the present study, as well
as the variables and model specifications used.
3.1 Data and Sample
The sample is based on data obtained from the DataStream database which consists of
financial statements from listed companies in various Europeans Stock Exchanges. For
each year listed companies were selected from 11 European Stock Exchanges. Namely
from the following: Euronext Amsterdam, Euronext Paris, Euronext Lisbon, Madrid
Stock Exchange (MAD), Euronext Brussels, Frankfurt Stock Exchange, Athens Stock
Exchange; London Stock Exchange; Warsaw Stock Exchange (GPW); Helsinki Stock
Exchange and Milan Stock Exchange.
The selected companies belong to different economic sectors. Those belonging to the
financial and securities sectors were excluded because their financial features and
investment in working capital are substantially different from non-financial companies.
Some companies with missing data were also removed from the sample.
Then, the different accounting variables needed for the study were extracted, by year
and by company. The data set included yearly data on sales; cost of goods sold;
accounts receivable; accounts payable; inventories; current assets; total assets; financial
assets; current liabilities, and total debt. Some of these data were used to calculate the
Receivables Collection Period, the Inventory Conversion Period, the Payables Deferral
Period and the Cash Conversion Cycle.
Observations with illogical values, for instance, negative or nil values of sales, cost of
goods sold, accounts receivable, accounts payable and inventories, were also excluded
from the sample.
The following table presents the variables extracted from DataStream and the
corresponding codes.
9
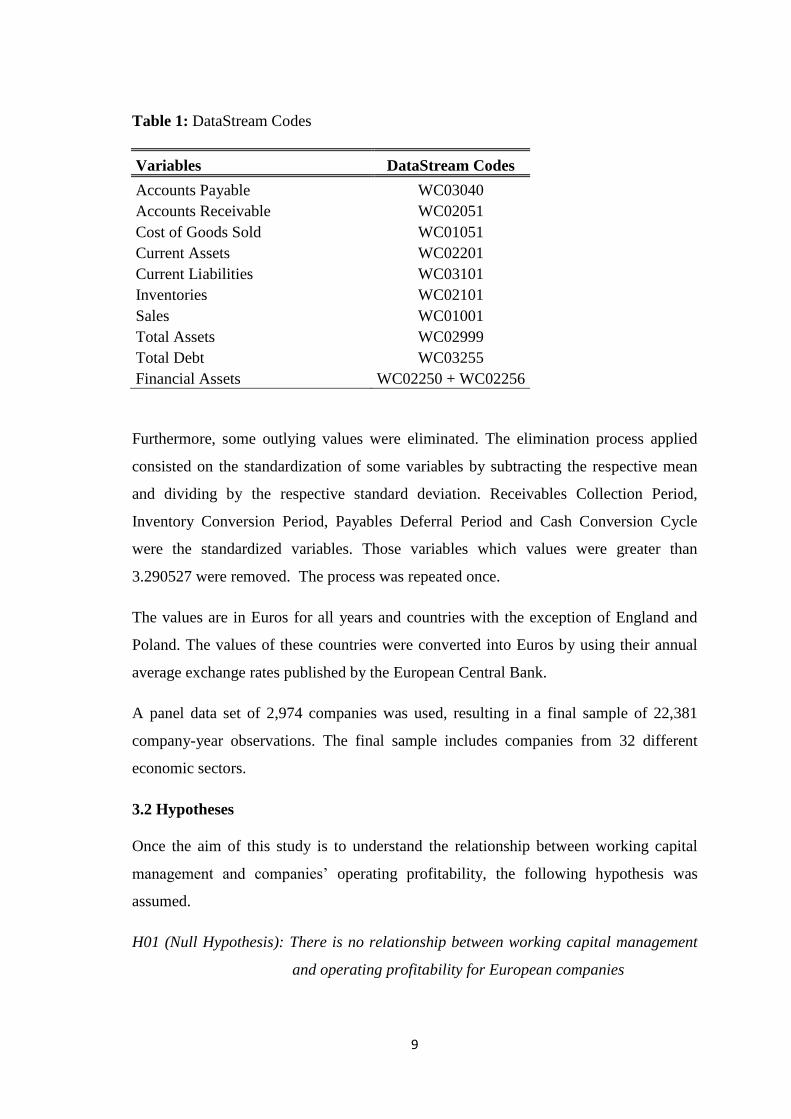
Table 1: DataStream Codes
Variables DataStream Codes
Accounts Payable WC03040
Accounts Receivable WC02051
Cost of Goods Sold WC01051
Current Assets WC02201
Current Liabilities WC03101
Inventories WC02101
Sales WC01001
Total Assets WC02999
Total Debt WC03255
Financial Assets WC02250 + WC02256
Furthermore, some outlying values were eliminated. The elimination process applied
consisted on the standardization of some variables by subtracting the respective mean
and dividing by the respective standard deviation. Receivables Collection Period,
Inventory Conversion Period, Payables Deferral Period and Cash Conversion Cycle
were the standardized variables. Those variables which values were greater than
3.290527 were removed. The process was repeated once.
The values are in Euros for all years and countries with the exception of England and
Poland. The values of these countries were converted into Euros by using their annual
average exchange rates published by the European Central Bank.
A panel data set of 2,974 companies was used, resulting in a final sample of 22,381
company-year observations. The final sample includes companies from 32 different
economic sectors.
3.2 Hypotheses
Once the aim of this study is to understand the relationship between working capital
management and companies’ operating profitability, the following hypothesis was
assumed.
H01 (Null Hypothesis): There is no relationship between working capital management
and operating profitability for European companies
10
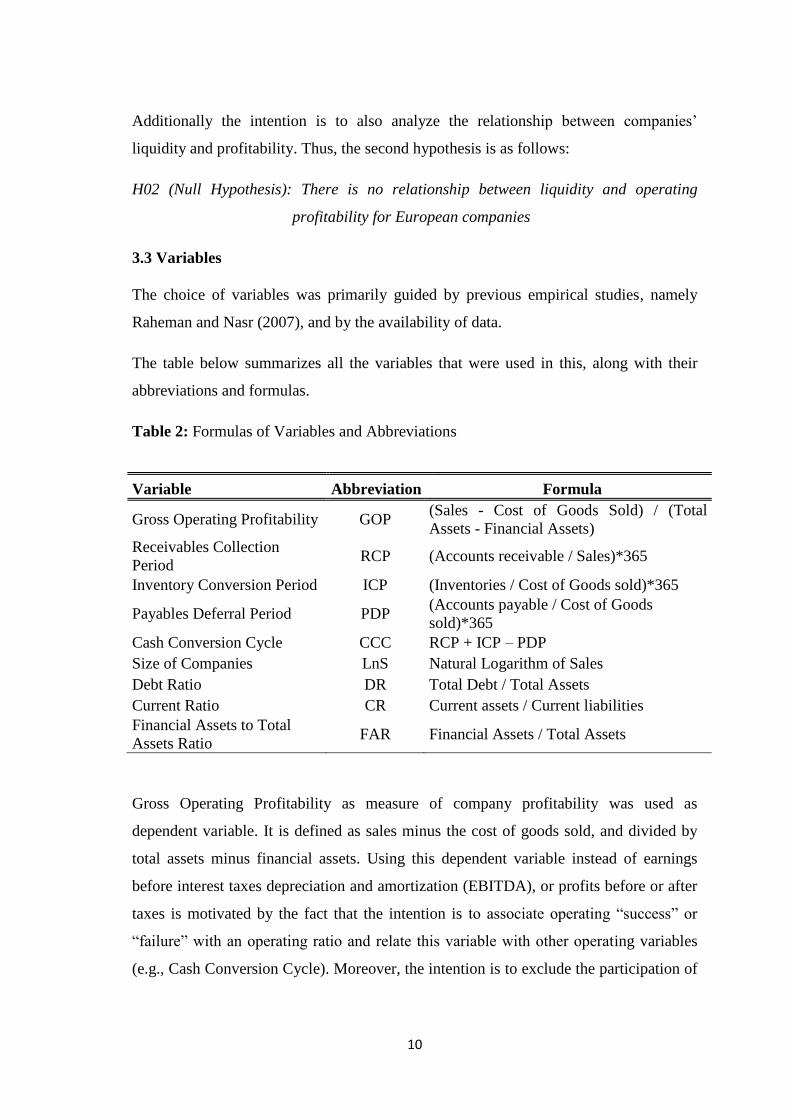
Additionally the intention is to also analyze the relationship between companies’
liquidity and profitability. Thus, the second hypothesis is as follows:
H02 (Null Hypothesis): There is no relationship between liquidity and operating
profitability for European companies
3.3 Variables
The choice of variables was primarily guided by previous empirical studies, namely
Raheman and Nasr (2007), and by the availability of data.
The table below summarizes all the variables that were used in this, along with their
abbreviations and formulas.
Table 2: Formulas of Variables and Abbreviations
Variable Abbreviation Formula
Gross Operating Profitability GOP (Sales - Cost of Goods Sold) / (Total
Assets - Financial Assets)
Receivables Collection
Period RCP (Accounts receivable / Sales)*365
Inventory Conversion Period ICP (Inventories / Cost of Goods sold)*365
Payables Deferral Period PDP (Accounts payable / Cost of Goods
sold)*365
Cash Conversion Cycle CCC RCP + ICP – PDP
Size of Companies LnS Natural Logarithm of Sales
Debt Ratio DR Total Debt / Total Assets
Current Ratio CR Current assets / Current liabilities
Financial Assets to Total
Assets Ratio FAR Financial Assets / Total Assets
Gross Operating Profitability as measure of company profitability was used as
dependent variable. It is defined as sales minus the cost of goods sold, and divided by
total assets minus financial assets. Using this dependent variable instead of earnings
before interest taxes depreciation and amortization (EBITDA), or profits before or after
taxes is motivated by the fact that the intention is to associate operating “success” or
“failure” with an operating ratio and relate this variable with other operating variables
(e.g., Cash Conversion Cycle). Moreover, the intention is to exclude the participation of

11
any financial activity from operational activity that might affect overall profitability,
thus financial assets are subtracted from total assets (Lazirdis and Tryfonidis, 2006).
With regards to independent variables, working capital management was measured by
using the Receivables Collection Period corresponding to the number of days of
accounts receivable; the Inventory Conversion Cycle corresponding to the number of
days taken to convert inventories into sales; the Payables Deferral Period corresponding
to the number of days of accounts payable, and the Cash Conversion Cycle.
Accounts receivable are customers who have not yet made their payment for goods or
services, which company has already provided. The goal of debtor management is to
minimize the time it takes to collect cash from customers. In this respect, the
Receivables Collection Period, used as a proxy for the collection policy, is calculated as
(Accounts receivable/Sales)*365.
Inventories are lists of stocks of raw materials, plus work in progress or finished goods
waiting to be consumed in production or to be sold. The Inventory Conversion Period
reflects the average number of days of stock held by a firm. It was used as a proxy for
the inventory policy, and is calculated as (Inventories/Cost of goods sold)*365. Longer
storage times represent a greater investment in inventories for a particular level of
operations.
Accounts Payable are suppliers whose invoices for goods or services have been
processed but who have not yet been paid. The Payables Deferral Period, used as a
proxy for the payment policy, reflects the average time it takes companies to pay their
suppliers. It is calculated as (Accounts payable/Cost of goods sold)*365.
The Cash Conversion Cycle is a proxy for working capital management efficiency. The
Cash Conversion Cycle is calculated by subtracting the Payables Deferral Period the
sum of the Inventory Conversion Period and the Receivables Collection Period. It has
been interpreted as a time interval between the cash outlays that arise during the
production of output and the cash inflows that result from the sale of the output and the
collection of the accounts receivable.

12
Other variables theoretically postulated as to influence companies’ profitability
performance were also considered as control variables in the model. These include Size
of Companies; Debt ratio used as a proxy for Leverage and is calculated by dividing
Total Debt by Total Assets; and ratio of financial assets to total assets. Current ratio,
which is calculated by current assets over current liabilities, was also included as a
control variable and it reflects a traditional measure of liquidity.
3.4 Model Specifications
The impact of working capital management upon corporate profitability was tested by
panel data methodology. The panel data methodology used has certain benefits like
using the assumption that companies are heterogeneous, more variability, less
colinearity between variables, more informative data, greater degree of freedom and
more efficiency (Baltagi, 2001). In panel data regression, several cross-sectional units
are observed over a period of time. This method is more useful in studying the
dynamics of adjustment, and is better able to identify and measure effects that are
simply not detectable in pure cross-sections or pure time-series data (Raheman & Nasr,
2007). Thus we can get more reliable estimates.
Consistent with previous studies, the impact of working capital management upon
corporate profitability was modelled using the following regression equations:
GOP = β0 + β1(RCPit) + β2(CRit) + β3(DRit) + β4(LnSit) + β5(FARit) + ε (I)
GOP = β0 + β1(ICPit) + β2(CRit) + β3(DRit) + β4(LnSit) + β5(FARit) + ε (II)
GOP = β0 + β1(PDPit) + β2(CRit) + β3(DRit) + β4(LnSit) + β5(FARit) + ε (III)
GOP = β0 + β1(CCCit) + β2(CRit) + β3(DRit) + β4(LnSit) + β5(FARit) + ε (IV)
Where the subscript i refer to companies, t represents years, and ε is the error term. The
variables are defined as described in table 2.
The equations specified above were estimated with Generalized Least Squares (cross
section weights) and Pooled Ordinary Least Squares models. Both models were also run
with sector, country and year dummies. The results of the fixed effects estimations are
reported in addition. The E-views software was used to carry out the analysis.

13
Before running the regressions, descriptive statistics and correlation analysis were
calculated. Correlation analysis shows the relationships between the different variables
considered in the study. However, one must be careful when interpreting the correlation
matrix because it presents simple bivariate correlations not taking into account other
variables that may influence the results. Besides it doesn’t allow identifying causes from
consequences.

14
4 Empirical Results
The results from this study are presented in this section. Firstly the descriptive analysis
is presented, followed by the Correlation analysis.
4.1 Descriptive Statistics
Table 3 presents the descriptive statistics of different variables considered in this
research.
Table 3: Descriptive Statistics
Mean Median Maximum Minimum Std. Dev. Observations
GOP 0.446074 0.304911 32.30418 -7.367600 0.616256 22381
RCP 95.51219 74.03830 2155.829 0.000000 83.60763 22381
ICP 81.34447 62.17033 713.4479 0.000000 89.35465 22381
PDP 75.79962 55.57951 673.7002 0.000000 73.88398 22381
CCC 101.0570 82.50170 2129.445 -596.6169 127.09921 22381
CR 1.936910 1.443687 173.7317 0.000000 2.879418 22381
DR 0.219687 0.198536 8.453125 0.000000 0.203582 22381
LnS 12.16316 12.00690 19.56011 1.609438 2.265329 22381
FAR 0.032571 0.007662 0.949376 -0.163853 0.072010 22381
The total number of observations is 22,381. Looking at table 3, we can see that Gross
Operating Profitability is on average 45% of (Total Assets – Financial Assets). The
Receivables Collection Period averages 96 days. The minimum amount of time taken by
companies to collect cash from customers is 0 days while the maximum time is 2,156
days. On average, it takes 81 days to sell inventory, with a standard deviation of 89. On
average, companies wait 76 days to pay their purchases. Here, the maximum time taken
by companies is 674 days, and minimum time is 0 days. On average, the companies in
this sample have a 101 days Cash Conversion Cycle. The median is 83 days.
Natural Logarithm of sales; Debt Ratio; Current Ratio and Financial Assets to Total
Assets were used as control variables. Current Ratio, a traditional measure of liquidity,
is on average 1.94, with a standard deviation of 2.88. The mean of Debt Ratio, which is
used to verify the relationship between debt financing and profitability, is 0.22, with a
standard deviation of 0.20. The maximum debt financing used by a company is 8.45,
which is uncommon but if we consider the hypothesis that companies can have negative
equity, it may be possible. The natural logarithm of sales measures the size of the

15
company and allows checking its relationship with profitability. The mean of this
variable is 12.16 and the standard deviation is 2.27. Lastly, information from descriptive
statistics shows that the mean value of financial assets to total assets ratio is 0.032, with
a standard deviation of 0.072. The share of financial assets in total assets records a
maximum of 95% and a minimum of -16%.
It should be noted that the sample includes a diversity of countries and sectors, with
their own characteristics, which influences results.
4.2 Correlation Analysis
Table 4 shows correlation coefficients of the dependent and independent variables. The
purpose of this analysis, as already mentioned, is to find out the relationship between
the different variables under consideration.
Table 4: Correlation Analysis
Correlation
Profitability GOP RCP ICP PDP CCC CR DR LnS FAR
GOP 1.00000
---
RCP -0.38721 1.000000
(0.0000) ---
ICP -0.06086 0.115784 1.00000
(0.0000) (0.0000) ---
PDP -0.02627 0.250459 0.22075 1.000000
(0.0001) (0.0000) (0.000) ---
CCC -0.28223 0.593620 0.65086 -0.26135 1.000000
(0.0000) (0.0000) (0.000) (0.0000) ---
CR -0.04998 0.054463 0.08638 -0.022357 0.109556 1.000000
(0.0000) (0.0000) (0.000) (0.0008) (0.0000) ---
DR -0.05099 0.001704 0.06234 0.052565 0.014397 -0.20294 1.00000
(0.0000) (0.7988) (0.000) (0.0000) (0.0313) (0.0000) ---
LnS 0.04099 -0.231067 -0.0303 -0.12064 -0.10321 -0.21357 0.16876 1.00000
(0.0000) (0.0000) (0.000) (0.0000) (0.0000) (0.0000) (0.0000) ---
FAR -0.06670 0.050007 -0.0213 0.022323 0.004908 -0.02652 0.06980 0.1010 1.000
(0.0000) (0.0000) (0.001) (0.0008) (0.4628) (0.0001) (0.000) (0.000) ---
The p-values are between parentheses.

16
Observing the frame, we can say that GOP is negatively related to RCP, ICP, PDP and
CCC. Regarding RCP, the results from the correlation analysis shows a negative
coefficient -0.387, with a p-value of 0.000. It indicates that there is a high significance
at α =1%. The negative correlation between RCP and GOP suggests that an increase of
the Receivables Collection Period will have a negative impact upon operating
profitability. Correlation results between Inventory Conversion Period and Gross
Operating Profitability also indicate the same type of result. The correlation coefficient
is negative and is highly significant. The coefficient is -0.06 and the p-value is 0.000. It
means that when the time span during which inventories remain within the company
increases, profitability decreases. The negative coefficient presented by PDP in relation
to GOP suggests that less profitable companies wait longer to pay their bills. The Cash
Conversion Cycle also has a negative coefficient -0.28 and the p-value is 0.000, which
is significant at α=1%. It implies that if the company is able to decrease its cash
conversion cycle, it can improve its operating profitability.
The Current Ratio, in the analysis, has a significant negative relationship with GOP.
The coefficient is -0.05 and the p-value is 0.000. It reveals the need of balance between
liquidity and profitability because these two objectives have an inverse relationship.
Company size, measured by the natural logarithm of sales, has a positive relation with
profitability. Its correlation coefficient is 0.04, and it is highly significant at α = 1%. It
shows that an increase in companies’ size increases their profitability. The remaining
control variables, in relation to GOP, also have negative and significant coefficients.
The results from the correlation analysis show that if companies are able to reduce the
time that accounts receivable are outstanding, plus the time span during which
inventories remain within the company, plus the time required for settling its accounts
payable, then working capital management will be efficient since it will lead to
increased operational profitability.

17
4.3 Empirical Models
This sub-section is divided into five parts. The first one provides the results of
econometric analysis undertaken at European level. The second reveals the coefficient
results of estimations by country. The third and fourth, show the details of the results
from the first part. Finally, the fifth part presents an additional analysis.
4.3.1 European Context
To evaluate the impact of working capital management upon corporate profitability,
Cash Conversion Cycle (as a comprehensive measure of working capital management),
as well as other alternative proxies (RCP, ICP and PDP) for working capital
management were regressed against Gross Operating Profitability. Accordingly, the
regression models presented in sub-section 3.4 were estimated by the GLS method with
cross section weights and Pooled OLS method with no weights. Sector, country and
year dummies were additionally included. For comparison purposes fixed effects
framework was also run. The regression results are reported in Table 5. For simplicity
the dummy coefficients were not shown in this table.

18
Table 5: Relationship between WCM and profitability (1998-2009): GLS with cross section weights and pooled OLS methods
Dependent Variable: GOP (Gross Operating Profitability)
Independent
Variables
GLS (Cross- section weights) GLS (Cross- section weights) Pooled OLS Pooled OLS
I II III IV I II III IV I II III IV I II III IV
Coeff. Coeff. Coeff. Coeff. Coeff. Coeff. Coeff. Coeff. Coeff. Coeff. Coeff. Coeff. Coeff. Coeff. Coeff. Coeff.
Intercept -0.009457 -0.10665*** -0.11202*** -0.07254*** 0.800161*** 0.388753*** 0.335527*** 0.503786*** 0.001686 -0.081143* -0.091517** -0.060677 0.94747*** 0.40379*** 0.39368*** 0.57238***
RCP -0.000586***
-0.00245***
-0.00065***
-0.00290***
ICP -0.00012***
-0.00029***
-0.00023***
-0.00036***
PDP -0.00016***
-8.30E05***
-0.00019***
-0.00014**
CCC -0.00022***
-0.00097***
-0.00027***
-0.0013***
CR -0.006679*** -0.00608*** -0.00609*** -0.00613*** -0.00928*** -0.01051*** -0.01070*** -0.00621*** -0.00822*** -0.00846*** -0.00909*** -0.00785*** -0.01069*** -0.01064*** -0.01191*** -0.0058***
DR -0.053589*** -0.05464*** -0.05363*** -0.04647*** -0.20394*** -0.20391*** -0.26288*** -0.22772*** 0.030540* 0.033867** 0.033630** 0.029670* -0.14994*** -0.18376*** -0.19431*** -0.1566***
LnS 0.017202*** 0.021609*** 0.021501*** 0.020684*** -0.00817*** 0.010053*** 0.012971*** 0.005738*** 0.017274*** 0.020625*** 0.019915*** 0.020510*** -0.01311*** 0.01252*** 0.01216*** 0.00597***
FAR -0.006929 -0.022036** -0.019222* -0.025483** -0.24737*** -0.51965*** -0.47648*** -0.40685*** 0.025897*** -0.008307 0.003611 -0.002729 -0.34249*** -0.59535*** -0.58051*** -0.5535***
Sector dummy yes yes yes yes no no no no yes yes yes yes no no no no
Country dummy yes yes yes yes no no no no yes yes yes yes no no no no
Year dummy yes yes yes yes no no no no yes yes yes yes no no no no
R-squared 0.776329 0.803138 0.798716 0.890938 0.656834 0.303473 0.151981 0.351780 0.459552 0.456279 0.455801 0.457590 0.158106 0.015328 0.012866 0.087089
Adj. R-squared 0.775768 0.802644 0.798211 0.890664 0.656758 0.303317 0.151791 0.351635 0.458197 0.454915 0.454436 0.456229 0.157918 0.015108 0.012646 0.086885
F-Value 1383.628*** 1626.343*** 1581.860*** 3256.536*** 8565.348*** 1949.732*** 802.0040*** 2428.522*** 338.9730*** 334.5328*** 333.8890*** 336.3046*** 840.397*** 69.6614*** 58.3262*** 426.899***
Observations 22381 22381 22381 22381 22381 22381 22381 22381 22381 22381 22381 22381 22381 22381 22381 22381
Notes: Symbols *, ** and *** denote significance at 10, 5 and 1% levels, respectively. The results were obtained by using the GLS with cross section weights and pooled OLS estimation methods.
Source: 1998-2009 survey data.

19
By analyzing the table it becomes clear that estimation results are more consistent when
sector, country and year dummies are included either by the OLS method or the GLS
method. Their R-squared are higher reflecting the increased explanatory power of
model. Estimation by Pooled OLS assumes that model parameters as given by β are
constant for all individuals in the sample. This assumption is quite restrictive.
Introducing dummy variables in the models one can capture the natural differences
(heterogeneity) among individuals.
When we use pooled data and cross sections greater than the time series, there may be a
problem of heteroskedasticity (changing variation after a short period) (Raheman &
Nasr, 2007). To counter this problem, the General Least Square model with cross
section weights can be used. In the regressions applied on this study, the common
intercept was calculated for all variables and assigned a weight.
Thus, taking into account issues of heteroskedasticity and heterogeneity of the
observations, let’s focus on the results of the GLS estimation with cross section weights
and sector, country and year dummies.
For all estimated models the control variables were included. In Model I, the
Receivables Collection Period in days was regressed against GOP. The results show that
the coefficients for all variables considered are highly significant except for the FAR
variable. In particular, the coefficient of the Receivables Collection Period is negative
and is highly significant at α = 1%. It indicates that an increase or decrease in the
number of days of accounts receivable will significantly affect profitability. As
mentioned by Mathuva (2010), the result can be interpreted as the less the time it takes
for costumers to pay their bills, the more cash is available to replenish inventory, hence
the higher the sales realized leading to higher corporate profitability.
By looking at the coefficients of the Current Ratio and Debt Ratio, a significant
negative relationship between them and GOP can be seen. Current ratio, as a measure of
liquidity, has a negative coefficient which means that it has an inverse relationship with
GOP. A leverage increase also implies a GOP decrease, as can be noted by the Debt
Ratio coefficient. Logarithm of Sales (LnS) used as a proxy for company size presents a
positive and significant coefficient, which is in agreement with most studies. This result

20
implies that an increase in sales has a positive impact on profitability, the same as
saying that larger size leads to greater profitability.
The ratio of financial assets to total assets has a negative coefficient, however it is not
significant.
The R-squared, which represents the proportion of the overall variance explained by the
variables included in the equation model, is 78% with an F-value of 1384 which is
highly significant.
The second regression (Model II) was run by using the Inventory Conversion Period in
days as an independent variable instead of RCP. The ICP’s coefficient is negative and
highly significant. This means that increasing the time during which inventories remain
in the company will adversely affect profitability. Current Ratio, Debt Ratio and FAR,
significantly affect profitability and have negative coefficients. FAR’s coefficient is
significant at α = 5%. Inversely, the variable LnS has a positive and highly significant
coefficient as in model I.
The adjusted R-squared is 80% and F-statistic is 1626 which reflects the highly
significance of the model.
The third column of Table 5 presents the estimation results from model III with
Payables Deferral Period as a measure of working capital management (independent
variable). The other variables are the control variables used in previous regressions. The
coefficient of PDP is negative and significant at α = 1%. The negative relationship
between the Payables Deferral Period and profitability is consistent with some studies
(Deloof, 2003, Lazaridis and Tryfonidis, 2006), which have interpreted that less
profitable companies wait longer to pay their bills. Control variables are highly
significant but the FAR variable is only significant at the level of 10%. The size of the
company has a positive impact upon its profitability while the Current Ratio and the
Debt Ratio have a negative influence. The F-Value is highly significant, with a value of
1582.
In the fourth model, we used the same control variables as in the previous models, and
Cash Conversion Cycle as an independent variable. This model shows that the

21
relationship between the Cash Conversion Cycle and the Gross Operating Profitability
is negative and statistically significant at the level of 1%. It implies that decreasing the
cash conversion cycle will positively affect profitability. This is in line with previous
research studies. The other variables in the model have the same signals as in previous
regressions and are also significant. The R-squared is 89%.
Estimation results by the OLS and by the GLS methods without considering dummy
variables for sector, country and year are similar. All measures for working capital
management (RCP, ICP, PDP and CCC) present negative and significant coefficients.
When the regressions are estimated either by the OLS or by the GLS method but taking
account the dummy variables, those measures equally affect profitability in a negative
and significant way. Current Ratio seems to have a negative impact upon operational
profitability. Its coefficient is negative and significant whatever the estimation method.
The coefficients signals for Debt Ratio and FAR differ from one and other estimation
method.
Concerning our hypotheses, we conclude that our first null hypothesis (H01) is rejected.
Thus, working capital management has a significant impact upon operating profitability
of European companies. We also reject our second null hypothesis (H02). It was found
that there is a negative relationship between liquidity, measured by Current Ratio, and
operating profitability of European companies.
Although the results are highly significant we should emphasize the fact that the
coefficients have low values, implying reduced variations in profitability.
The coefficient results from the OLS estimation method are higher than those obtained
by the GLS estimation. Thereby, variations in operating profitability are more
substantial.
Also for the purpose of comparison, fixed effects framework with fixed cross-section
and fixed period was estimated and the results are presented on the next table.
22
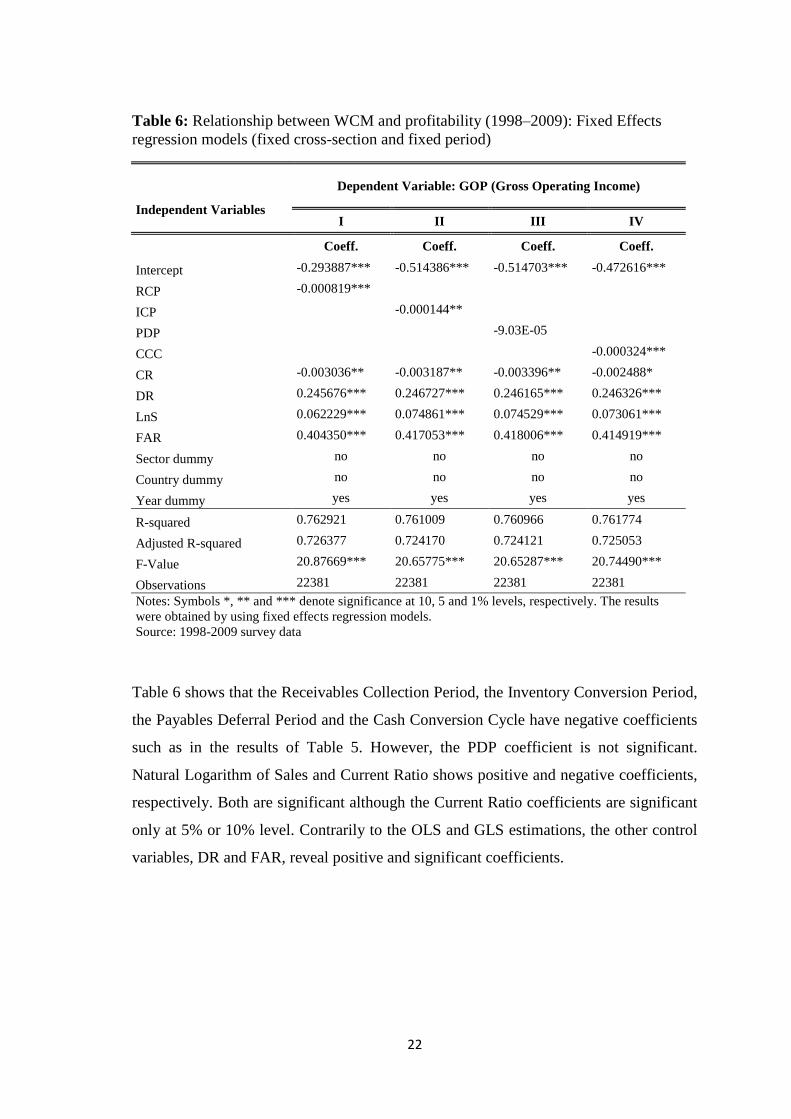
Table 6: Relationship between WCM and profitability (1998–2009): Fixed Effects
regression models (fixed cross-section and fixed period)
Dependent Variable: GOP (Gross Operating Income)
Independent Variables I II III IV
Coeff. Coeff. Coeff. Coeff.
Intercept -0.293887*** -0.514386*** -0.514703*** -0.472616***
RCP -0.000819***
ICP -0.000144**
PDP -9.03E-05
CCC -0.000324***
CR -0.003036** -0.003187** -0.003396** -0.002488*
DR 0.245676*** 0.246727*** 0.246165*** 0.246326***
LnS 0.062229*** 0.074861*** 0.074529*** 0.073061***
FAR 0.404350*** 0.417053*** 0.418006*** 0.414919***
Sector dummy no no no no
Country dummy no no no no
Year dummy yes yes yes yes
R-squared 0.762921 0.761009 0.760966 0.761774
Adjusted R-squared 0.726377 0.724170 0.724121 0.725053
F-Value 20.87669*** 20.65775*** 20.65287*** 20.74490***
Observations 22381 22381 22381 22381
Notes: Symbols *, ** and *** denote significance at 10, 5 and 1% levels, respectively. The results
were obtained by using fixed effects regression models.
Source: 1998-2009 survey data
Table 6 shows that the Receivables Collection Period, the Inventory Conversion Period,
the Payables Deferral Period and the Cash Conversion Cycle have negative coefficients
such as in the results of Table 5. However, the PDP coefficient is not significant.
Natural Logarithm of Sales and Current Ratio shows positive and negative coefficients,
respectively. Both are significant although the Current Ratio coefficients are significant
only at 5% or 10% level. Contrarily to the OLS and GLS estimations, the other control
variables, DR and FAR, reveal positive and significant coefficients.

23
4.3.2 Countries
As a second step of this research study, we tested if there are significant differences
among the countries in the sample in terms of the relationship Working Capital
Management – Profitability. Table 7 presents the estimation results of Model IV,
presented in 3.2 Section, for each country.

24
Table 7: Relationship between WCM and profitability by country (1998-2009): GLS with cross section weights
Dependent Variable: GOP (Gross Operating Profitability)
Independent
Variables
IV IV IV IV IV IV IV IV IV IV IV
Belgium England Finland France Germany Greece Italy Netherlands Poland Portugal Spain
Intercept -0.275791*** 0.813309*** 0.649446*** -0.085335*** 0.402164*** 0.309584*** 0.396771*** 0.442909*** -0.478407*** 0.163400*** 0.194781***
CCC -0.000164*** -0.000678*** -5.84E-05 -0.000321*** -0.000230*** -0.000331*** -8.07E-05*** -0.000994*** 0.000994*** -0.000234*** 3.86E-06
CR 0.023792*** -0.039796*** -0.016731*** 0.016526*** -0.006391*** -0.001072*** -0.018560*** 0.016219*** 0.055695*** 0.008675 -0.004891
DR -0.144951*** -0.122518*** -0.339304*** -0.150750*** -0.138287*** -0.099691*** -0.293209*** 0.268142*** 0.524804*** -0.142889*** -0.261556***
LnS 0.038413*** 0.023806*** -0.014841*** 0.026659*** -9.79E-06 -0.000347 0.003002** -0.005922*** -0.070030*** 0.000446 0.006966***
FAR 0.110914** -1.016980*** -0.470773*** -0.241749*** -0.030573 0.289900*** -0.129294*** 0.058391 -0.350909** 0.096856*** -0.153690***
Sector dummy no no no no no no no no no no no
Year dummy no no no no no no no no no no no
R-squared 0.608645 0.523253 0.312204 0.863934 0.097385 0.386742 0.213401 0.188785 0.693896 0.315753 0.334431
Adjusted R-squared 0.605658 0.522871 0.308758 0.863762 0.096408 0.385015 0.210729 0.184079 0.691648 0.304926 0.329915
F-Value 203.7347*** 1369.740*** 90.60230*** 5029.978*** 99.62775*** 224.0013*** 79.86940*** 40.12062*** 308.7461*** 29.16426*** 74.06451***
Observations 22381 22381 22381 22381 22381 22381 22381 22381 22381 22381 22381
Notes: Symbols *, ** and *** denote significance at 10, 5 and 1% levels, respectively. The results were obtained by using GLS with cross section weights estimation method.
Source: 1998-2009 survey data.

25
The results obtained were estimated by the GLS method with cross-section weights. The
sector and year dummies were not included because some countries do not have
sufficient observations to enable estimation with their consideration.
Observing the coefficient results of Model IV we may conclude that the Cash
Conversion Cycle has strongly significant coefficients in all countries, with the
exceptions of Finland and Spain. Regarding the signal of the coefficients, all the
countries have a negative signal except Poland and Spain. This is consistent with results
obtained in the first step of the study where all countries of the sample were included
together.
The results seem to suggest that shortening the cash conversion cycle of the European
companies under consideration leads an increased profitability. Curiously, the results
for Poland suggest the opposite.
The relationship between the control variables and Gross Operating Profitability is not
consistent for all countries in the sample.
In general, the results indicate that working capital management can be an approach to
be used by companies to influence their profitability. Shortening the cash conversion
cycle allows the optimization of capital lockup and process costs and thus companies’
profitability increases.
4.3.3 Sector dummy
The companies involved in this research study belong to different economic sectors.
The sample includes 32 different sectors. In order to observe differences between them,
Table 8 presents the details of the sector dummy coefficients for model IV estimated by
GLS not shown in Table 5. We must bear in mind that the coefficients were calculated
in relation to a reference category that comprises the sector, the country and the year.
Thus, interpretations should be made in relation to that category. The reference category
refers to the “Aerospace & Defense” sector, to Belgium, and to 1998.

26
Table 8: Relationship between WCM and profitability (1998-2009): GLS with cross
section weights method - sector dummy details
Dependent Variable: GOP (Gross Operating
Income)
Independent Variables IV
Coeff.
Intercept -0.072547***
CCC -0.000220***
CR -0.006134***
DR -0.046477***
LnS 0.020684***
FAR -0.025483**
Alternative Energy -0.090970***
Automobiles & Parts 0.055195***
Beverages 0.172626***
Chemicals 0.073549***
Construction & Materials 0.071228***
Electricity -0.073291***
Electronic & Electrical Equipment 0.145456***
Fixed Line Telecommunications 0.011362
Food & Drug Retailers 0.023561***
Food Producers 0.081917***
Forestry & Paper 0.036924***
Gas, Water & Multiutilities -0.126264***
General Industrials 0.075750***
General Retailers 0.306468***
Health Care Equipment & Services 0.106710***
Household Goods & Home
Construction 0.146158***
Industrial Engineering 0.094342***
Industrial Metals & Mining 0.030297***
Industrial Transportation -0.016374**
Leisure Goods 0.206357***
Mining -0.345113***
Mobile Telecommunications 0.125148***
Oil & Gas Producers -0.167613***
Oil Equipment & Services 0.067676***
Personal Goods 0.219004***
Pharmaceuticals & Biotechnology 0.057795***
Software & Computer Services 0.157424***
Support Services 0.205916***
Technology Hardware & Equipment" 0.091908***
Tobacco -0.180327***
Country dummy yes
Year dummy yes
R-squared 0.890938
Adj. R-squared 0.890664
F-Value 3256.536***
Observations 22381
Notes: Symbols *, ** and *** denote significance at 10, 5 and 1% levels, respectively.

27
The sectors General Retailers, Personal Goods and Support Services are those with
higher profitability in relation to the reference category. Their operating profitability is
higher by 31%, 22% and 21%, respectively.
Considering the sectors in the Technologies and Communications area (Electronic &
Electrical Equipment, Mobile Telecommunications, Software and Computer Services
and Technology Hardware & Equipment sectors) we conclude that their operating
profitability is higher than the reference category from 9% to 16%. However, the Fixed
Line Telecommunications sector does not have a significant difference.
It is notable that the sectors Mining, Tobacco and Oil & Gas Producers sectors show
estimates of operating profitability lower by 34%, 18% and 17%, respectively,
compared to the reference category.
4.3.4 Time Period
Presently we have been seeing great changes in the economic climate. The economic
crisis has hit many countries in the world and particularly in Europe. This has changed
the conditions for European companies to go with their business. Thereafter, it is also
interesting to study whether the economic changes over the last years had an impact on
companies’ profitability as measured by gross operation profitability.
The next table displays the details of year dummy coefficients of the GLS estimation
omitted in Table 4.

28
Table 9: Relationship between WCM and profitability (1998-2009): GLS with cross
section weights method – year dummy details
Dependent Variable: GOP (Gross Operating Profitability)
Independent Variables IV
Coeff.
Intercept -0.072547***
CCC -0.000220***
CR -0.006134***
DR -0.046477***
LnS 0.020684***
FAR -0.025483**
Sector dummy yes
Country dummy yes
1999 -0.017928***
2000 -0.014107***
2001 -0.029536***
2002 -0.027971***
2003 -0.037936***
2004 -0.028606***
2005 -0.057809***
2006 -0.055723***
2007 -0.062578***
2008 -0.103328***
2009 -0.137425***
R-squared 0.890938
Adj. R-squared 0.890664
F-Value 3256.536***
Observations 22381
Notes: Symbols *, ** and *** denote significance at 10, 5 and 1% levels, respectively.
The estimation results reflect the economic variation. As can be seen in Table 9,
operating profitability has decreased significantly over the last three years when
comparing with the reference category. The reference category is the same as mentioned
in sub-section 4.3.3. Comparing with 1998, 2008 shows lower profitability for European
companies by 10%. In 2009 the percentage is about 14% lower.

29
4.3.4 Additional Analysis
The Current Ratio was used as a measure of liquidity and showed negative coefficients
in all regressions (Table 5 and Table 6). Results suggest that profitability and liquidity,
the two main objectives for a company, have an inverse relationship. When the liquidity
position is better, this adversely affects the company’s profitability.
In this sub-section we study the interference that different levels of liquidity can have
upon the relationship working capital management and profitability. The way a
company manages its working capital and its impact upon operating profitability may
be influenced by many factors. The higher or lower levels of existing liquidity can be
one of those factors.
For the purpose of this complementary analysis the variable Current Ratio was divided
into three groups – Current Ratio I, Current Ratio II and Current Ratio III. Percentiles
were considered for the partition. The following model was then run:
GOP = β0 + β1(CCCit) + β2(CRIit*CCCit) + β3(CRIIIit*CCCit) + β4(DRit) + Β5(LnSit) +
+ β6(FARit) + ε (V)
Where the subscript i refer to companies, t represents years and ε is the error term. The
variable CRI is Current Ratio I and it corresponds to the first percentile (25%). The
variable CRIII is Current Ratio III and it corresponds to the last percentile (75%). The
remaining variables are defined as described in Table 2.
Current Ratio I represents companies with low liquidity levels while Current Ratio III
represents companies with higher liquidity values. Their Current Ratios are lower than
1,090596 and higher than 2,037854, respectively. The Current Ratio II group comprises
the observations which Current Ratios are situated between 1,090596 and 2,037854.
Table 10 shows the coefficient results for the GLS estimation method with cross section
weights of model V. Sector, country and year dummies were included.

30
Table 10: Relationship between WCM and profitability (1998-2009): GLS with cross
section weights - different levels of liquidity
Dependent Variable: GOP (Gross Operating Profitability)
Independent Variables V
Coeff.
Intercept -0.072764***
CCC -0.000214***
CRI*CCC -0.000181***
CRIII*CCC 6.70E-05***
CR -0.006394***
DR -0.033908***
LnS 0.021311***
FAR -0.011962
Sector dummy yes
Country dummy yes
Year dummy yes
R-squared 0.806241
Adjusted R-squared 0.805737
F-Value 1601.428***
Observations 22381
Notes: Symbols *, ** and *** denote significance at 10, 5 and 1% levels, respectively. The results were
obtained by using GLS with cross section weights estimation method.
Source: 1998-2009 survey data.
The results indicate that the Cash Conversion Cycle has a negative impact upon
profitability. However, this impact is more negative on companies with low liquidity
levels.
Thus, these results show that different levels of liquidity lead to differentiated impacts
of working capital management upon companies’ profitability.

31
5 Conclusions
This paper studied the relationship between working capital management and operating
profitability in 2,974 companies listed on 11 European Stock Exchanges, from 1998 to
2009. The results provided evidence that the Cash Conversion Cycle, as a measure of
working capital management, negatively affects Gross Operating Profitability. A
negative and significant relationship between the Receivables Collection Period,
Inventory Conversion Period, Payment Deferral Period and profitability was also found.
This indicates that companies can increase their profitability by shortening receivables,
inventory and payables periods. These findings are in line with many previous studies,
namely with those of Raheman and Nasr (2007), and Deloof (2003).
In general, the results from our analysis suggest that companies can rethink their
corporate financial management in order to boost their growth and subsequently the
creation of value for shareholders. Companies can direct their efforts towards their own
resources and bypass certain financial problems. By optimizing the time span during
which working capital is tied up in the company can be a way to improve profitability.
On the one hand, reducing that time releases liquidity which in turn affects the
company´s financial position. On the other hand, working capital management enables
other forms of financing because those financiers who focus on balance sheet structures
will invest on companies with solid positions and reducing the capital lockup
contributes towards that.
Concerning the relationship between company size (measured by the natural logarithm
of sales) and profitability, the results indicate that as size increases, operating
profitability tends to increase. Current Ratio and Debt Ratio presented negative impacts
upon companies’ profitability. The results of Financial Assets to Total assets were not
significant.
At a country level the relationship between working capital management and
profitability is negative and significant for all countries in the sample except for Poland,
Finland and Spain.

32
The findings also allowed us to check that the present economic environment had an
impact upon companies´ profitability. In recent years, the operating profitability of
European companies has been decreasing.
Additionally we studied whether different levels of liquidity lead to differentiated
impacts of the Cash Conversion Cycle upon operating profitability. The analysis
indicated that such impact is more negative for companies whose liquidity ratios are
low.
Future research could make an in-depth and extended analysis on the impact of working
capital management upon profitability. For instance, a research study at sector level
within the European context could be undertaken. The concept of factoring and credit
default of customers may interfere with the way companies manage their working
capital. Further studies could also address these issues.
In sum, the findings from this study suggest that companies can improve their
profitability by reducing their cash conversion cycle.

33
References
Baltagi, Badi (2001), Econometric Analysis of Panel Data, John Wiley & Sons,
Chichester.
Deloof M. (2003), “Does working capital management affect profitability of Belgian
firms?” Journal of Business Finance and Accounting, Vol. 30: 573-588.
Deloof M., and M. Jegers (1996), “Trade Credit, Product Quality, and Intragroup Trade:
Some European Evidence”. Financial Management 25: 945-968
Dong, Huynh Phuong and Jhy-tay Su (2010), “The Relationship between Working
Capital Management and Profitability: A Vietnam Case”, International Research
Journal of Finance and Economics, Issue 49, pp.59-67.
Eljelly A. (2004), “Liquidity-profitability tradeoff: an empirical investigation in an
emerging market”. International Journal of Commerce and Management, 14: 48-61.
Falope OI, Ajilore OT. (2009), “Working capital management and corporate
profitability: evidence from panel data analysis of selected quoted companies in
Nigeria”. Research Journal of Business Management, 3: 73-84.
Gill et al. (2010), “The relationship between working capital management and
profitability: Evidence from the United States”. Business and Economics Journal, Vol.
10
Lazaridis I, Tryfonidis D. (2006.), “Relationship between working capital management
and profitability of listed companies in the Athens stock exchange”. Journal of Financial
Management and Analysis, 19: 26-25.
Long M.S., I.B. Malitz and S.A Ravid (1993), “Trade Credit, Quality Guarantees, and
Product Marketability”. Financial Management 22: 117-127

34
Mathuva D. (2009), “The influence of working capital management components on
corporate profitability: a survey on Kenyan listed firms”. Research Journal of Business
Management, 3: 1-11.
Nazir, Mian Sajid and Talat Afza (2009), “Working Capital Requirements and the
Determining Factors in Pakistan”, Journal of Applied Finance, Vol. 15, Issue 4, pp. 28-
38
Nobanee and AlHajjar (2009a), “Working capital management, Operating cash flow
and Corporate performance” home page, in
http://papers.ssrn.com/sol3/papers.cfm?abstract_id=1471236 accessed on January 21,
2011
Nobanee and AlHajjar (2009b), “A note on working capital management and corporate
profitability of Japanese firms” home page, in
http://papers.ssrn.com/sol3/papers.cfm?abstract_id=1433243 accessed on June 16, 2011
Nobanee (2009), “Working capital management and Firm’s Profitability: An optimal
Cash Conversion Cycle” home page, in
http://papers.ssrn.com/sol3/papers.cfm?abstract_id=1471230 accessed on September 7,
2010
Raheman A, Nasr M. (2007), “Working capital management and profitability – case of
Pakistani firms”. International Review of Business Research Papers, 3: 279-300.
Rao, R. K. S. (1989), Fundamentals of Financial Management, 3rd Ed. Macmillan
publishers, pp 550-644
Samiloglu F., Demirgunes K. (2008), “The effect of working capital management on
firm profitability: Evidence from Turkey”. The International Journal of Applied
Economics and Finance 2: 44-50

35
Shin HH, Soenen L. (1998), “Efficiency of working capital management and corporate
profitability”. Financial Practice and Education, Vol. 8: 37-45.
Zariyawati et al. (2009), “Working Capital Management and Corporate Performance:
Case of Malaysia”, Journal of Modern Accounting and Auditing, Vol. 5, Issue 11, pp.
47-54.