By: Ivan Zinger and Cherami Wichmann Research · PDF fileIvan Zinger and Cherami Wichmann...
100
The Psychological Effects of 60 days in Administrative Segregation By: Ivan Zinger and Cherami Wichmann Research Branch Correctional Service of Canada March 1999
Transcript of By: Ivan Zinger and Cherami Wichmann Research · PDF fileIvan Zinger and Cherami Wichmann...

The Psychological Effects of 60 days in Administrative Segregation
By:
Ivan Zinger
and
Cherami Wichmann
Research BranchCorrectional Service of Canada
March 1999

i
ACKNOWLEDGEMENTS
This research could not have been conducted without the full support of Collins
Bay, Kingston and Millhaven institutions. Wardens, Segregation Unit Managers and
front-line staff were instrumental in facilitating the implementation of this research
project. Moreover, many dedicated CSC psychologists provided assistance to this
project. Without the support of Daryl Kroner, Wagdy Loza, Jeremy Mills, Ralph
Serin and David Simourd, this project would not have been possible. As well, we
thank the three research assistants, Petrina Lemieux, Erin McCormick, and Jennifer
van de Ven, who diligently collected the data and displayed a great deal of flexibility
in working around the daily operational priorities of segregation units. Finally, we
thank the offenders who, in spite of difficult circumstances, participated in this study.
Their willingness to share their views and personal experiences was essential in
seeing this study to fruition.

ii
EXECUTIVE SUMMARY
Participants in this longitudinal study included 60 inmates from Kingston,
Collins Bay and Millhaven Penitentiaries who had either been (a) voluntarily or
involuntarily placed in administrative segregation and remained in segregation for
60 days (quasi-experimental group; n = 23), or (b) randomly selected from the
general inmate population and remained in the general inmate population for 60
days (comparison group; n = 37). Participants initially completed written
psychological tests and took part in a structured interview that assessed their overall
mental health and psychological functioning. The same procedure was undertaken
30 days later and again 60 days later. Segregated offenders had similar education,
offence history and criminogenic needs than non-segregated offenders. However,
segregated offenders had distinct personalities, Neuroticism, Extroversion,
Openness (NEO) and were higher risk cases, Statistical Information on Recidivism
(SIR Scale) than non-segregated offenders. Overall, segregated offenders had
poorer mental health and psychological functioning. However, there was no
evidence that over a period of 60 days the mental health and psychological
functioning of segregated offenders significantly deteriorated.

iii
TABLE OF CONTENTS
ACKNOWLEDGEMENTS................................................................................................i
EXECUTIVE SUMMARY.................................................................................................ii
TABLE OF CONTENTS.................................................................................................iii
LIST OF APPENDICES................................................................................................ vii
LIST OF TABLES......................................................................................................... viii
THE PSYCHOLOGICAL EFFECTS OF 60 DAYS IN SEGREGATION ................. 1
INTRODUCTION ................................................................................................................. 1
NEGATIVE EFFECTS VERSUS NO NEGATIVE EFFECTS ................................................ 2
Negative Effects ...................................................................................................... 2
No Negative Effects................................................................................................ 5
EVALUATION OF EXISTING RESEARCH ON SEGREGATION: A REVIEW OF
METHODOLOGICAL SHORTCOMINGS .............................................................................. 8
1. Reliance on Qualitative Data (e.g., Casual Observations, Interviews and
Anecdotes) ................................................................................................................ 8
2. Conditions of Confinement............................................................................. 9
3. Relevance of Field and Laboratory Experiments on Sensory
Deprivation…. .........................................................................................................11
4. Selection of Subjects .....................................................................................13
5. Reasons for Segregation ..............................................................................16
6. Attrition .............................................................................................................17
7. Reliance on Cross-sectional and Longitudinal Research .......................17
8. Duration and Indeterminate Nature of Stay................................................18
9. Lack of Comparison Group...........................................................................19
10. Offender/Staff Interaction and the Punitive Reality of Segregation.........19
11. Personality.......................................................................................................21

iv
12. Other Factors...................................................................................................21
HYPOTHESES...............................................................................................................23
METHOD .........................................................................................................................24
DESIGN AND PROCEDURES..........................................................................................24
Participants ............................................................................................................24
Testing and Procedures......................................................................................24
MEASURES....................................................................................................................25
Aggression Questionnaire (AQ; Buss & Perry, 1992).......................................27
Balanced Inventory of Desirable Responding (BIDR; Paulhus, 1984) ..........28
Beck Depression Inventory - Short Form (BDI-S; Beck & Beck, 1972)..........29
Brief Symptom Inventory (BSI; Derogatis, 1992)...............................................30
Holden Psychological Screening Inventory (HPSI; Holden, Mendonca,
Mazmanian, & Reddon, 1992) .............................................................................31
Hopelessness Scale (BHS; Beck & Steer, 1988)..............................................32
Interview Assessment ............................................................................................32
NEO Personality Inventory (NEO-FFI; Costa & McCrae, 1992)......................33
Shipley Institute of Living Scale-Revised (Shipley, 1940) ...............................33
State-Trait Anxiety Inventory (Spielberger, 1983) .............................................34
Additional Data Collection ....................................................................................35
Physical Conditions ............................................................................................35
Offender Intake Assessment..............................................................................35
RESULTS .......................................................................................................................37
DESCRIPTIVE FINDINGS ................................................................................................37
Conditions of Confinement...................................................................................37
Participation and Attrition ......................................................................................37
Demographics ........................................................................................................39
Age .......................................................................................................................39
Race .....................................................................................................................40

v
Education.............................................................................................................40
Criminal History...................................................................................................41
Case Needs.........................................................................................................42
SIR Scale .............................................................................................................42
I.Q..........................................................................................................................43
Personality ...........................................................................................................44
Social Desirability...............................................................................................44
MENTAL HEALTH AND PSYCHOLOGICAL FUNCTIONING: OFFENDERS WHO
COMPLETED THREE SESSIONS ...................................................................................45
Aggression Questionnaire ....................................................................................46
Beck Depression Inventory - Short Form............................................................47
Brief Symptom Inventory.......................................................................................47
Holden Psychological Screening Inventory .......................................................47
Hopelessness Scale..............................................................................................47
State-Trait Anxiety Inventory.................................................................................48
WAIS Digit Span and Digit Symbol.....................................................................48
SEGREGATED OFFENDERS WHO COMPLETED THREE SESSIONS VERSUS
SEGREGATED OFFENDERS WHO COMPLETED ONE OR TWO SESSIONS. ................48
Voluntary Versus Involuntary Cases ...................................................................49
Interview Assessment ............................................................................................49
Ten-point Rating Scales.....................................................................................49
Suicide Ideation...................................................................................................51
Segregation Experience ....................................................................................51
DISCUSSION .................................................................................................................52
GENERALIZATION ISSUES..............................................................................................52
Personality...............................................................................................................56
Psychological Effects.............................................................................................57
Policy Issues ...........................................................................................................60
Future Direction and Conclusion.......................................................................63

vi
REFERENCES ..............................................................................................................67

vii
LIST OF APPENDICES
Appendix A. Consent Form..........................................................................................79
Appendix B. Information Form.....................................................................................80
Appendix C. Debriefing ................................................................................................81
Appendix D. Session 1 Interview for Segregated Inmates.......................................82
Appendix E. Checklist of Physical Conditions of Confinement................................88

viii
LIST OF TABLES
Table 1: Meaures Used in This Study.......................................................................26
Table 2: Conditions of Confinement in Segregation at Collins Bay, Kingston andMillhaven Penitentiaries...............................................................................37
Table 3: Number of Completed Sessions Broken down by Group and Institutions38
Table 4: Breakdown of Institutions and Reason for Segregation by Type ofSegregation..................................................................................................39
Table 5: Education OIA Indicators for Segregated and Non-segregated Offenders........................................................................................................................40
Table 6: Offence History (Past and Current) of Segregated and Non-SegregatedOffenders.......................................................................................................41
Table 7: Need Domains at OIA for Segregated and Non-Segregated Offenders42
Table 8: Percentage Distribution of SIR Risk Groups for Segregated and Non-Segregated Offenders.................................................................................43
Table 9: NEO-FFI Sub-scores for Segregated and Non-Segregated Offenders 44
Table 10: Session Means of Measures for Segregated (n = 23) and Non-Segregated (n =37) Offenders Who Completed All Three Sessions.....46
Table 11: Session Means and Respective Standard Deviations of InterviewAssessment Questions for Segregated (n = 23) and Non-Segregated (n=37) Offenders Who Completed All Sessions..........................................50

1
THE PSYCHOLOGICAL EFFECTS OF 60 DAYS IN SEGREGATION
Introduction
The percentage of segregated offenders has more than doubled in the last ten
years1 (Pierson, 1988), now representing approximately 5.5% of federally
sentenced offenders in Canada (Kane, 1997). However, there has been little
research conducted concerning these offenders. Moreover, the literature on
segregation is sparse, conflicting, rife with speculations, and based upon far-
fetched extrapolations and generalizations (Barak-Glantz, 1983; Brodsky & Scogin,
1988; Suedfeld et al., 1982; Wormith et al.,1988).
Unfortunately, controversy surrounding the issue of the effects of segregation
on offenders has developed based on this inadequate body of research, resulting in
two positions, which are virtually polar opposites. Some researchers describe
segregation as “cruel and unusual punishment” and psychologically damaging,
whereas others provide evidence that segregation has little, if any, negative
psychological effect on offenders. The conclusions of these two assessments are
strikingly opposed and difficult, if not impossible, to reconcile.
1 Gendreau et al., (1985) trace increasing reliance on Protective Custody (PC) and administrativesegregation to several factors: the diminished authority of prison administrators; increaseddemands for drugs; increased media coverage of crimes; overcrowding; outmoded classificationsystems; the increase in first-time federally sentenced offenders; the deinstitutionalization ofmental health patients; the relative solitude of PC units compared to the general population; thegrowth of offender prison gangs; police and court practices designed to encourage accomplicesto testify against each other in exchange for more favorable dispositions; correctional staff’sattitudes at the institutional receptions; increased willingness and ability of offenders to sue fordamages; the likelihood of prison officials to be held personally liable for injuries by offenders intheir care; and the increased public scrutiny of prison administrations and increased publicconcerns for human rights violations.

2
To favour one of the two opposing views concerning the impact of segregation
on offenders may have important policy implications in areas such as: (a) the level
and frequency of monitoring and assessment required for offenders in segregation
(mandatory vs. upon request); (b) programming to reduce mental health
deterioration (need for, and type of, intervention programs); and (c) the adequacy of
current assessment strategies (what aspects of psychosocial functioning are
important to assess, and which are less impacted by segregation).
This document contains three sections: 1) a review of the literature concerning
the psychological effects of segregation highlighting the two opposing positions; 2)
a review of the methodological issues with respect to segregation research; and 3)
the findings of a research project which addressed the shortcomings of the existing
literature.
Negative Effects Versus No Negative Effects
Negative Effects
Several authors argue that segregation has severe negative psychological
effects on inmates. These authors, primarily lawyers and clinical psychologists,
have mainly relied upon interviews of segregated inmates and anecdotes to draw
their conclusions. For example, Jackson (1983) interviewed numerous segregated
inmates, and concluded that segregation was “the most individually destructive,
psychologically crippling and socially alienating experience that could conceivably
exist within the borders of the country” (p. 243). He recounted many instances
where segregation was, in his opinion, responsible for the development of
psychoses (auditory and visual hallucinations, and delusions) and where
segregation drove some offenders to self-inflict serious injuries, or to commit
suicide.

3
Toch (1975) relied on excerpts of interviews with segregated inmates and
concluded that there are some inmates whose tolerance for isolation is low. These
inmates react to segregation with “surges of panic, despair, or rage. They lose
control, break down, regress” (Toch, 1975; p.38).
Grassian (1983) also utilized interviews to assess the effects of segregation
on fourteen inmates who were involved in a “cruel and unusual punishment” civil
action. Grassian (1983) observed similar symptoms as those reported in the
American and German correctional literature of the 18th and early 19th centuries.
He reported the following damaging effects of segregation:
1) sensory disturbances: perceptual distortions and loss of perceptual
constancy, in some cases without hallucinations; 2) ideas of reference and
paranoid ideation short of overt delusions; 3) emergence of primitive
aggressive fantasies, which remained ego-dystonic and with reality-testing
preserved; 4) disturbances of memory and attention short of overt
disorientation and confusional state; and 5) de-realization experiences
without massive dissociative regression. (p. 1453)
Haney (1993) assessed the mental health of Pelican Bay Special Handling
Unit inmates whose conditions of confinement are very similar to those found in
traditional segregation. Interviews revealed that inmates were “deprived of human
contact, touch and affection for years on end” (p. 4), and that the operational
procedures employed by correctional staff are designed to reinforce and maintain
these deprivations. Haney (1993) argues that these deprivations can precipitate
various forms of psychopathology, and worsen pre-existing psychiatric conditions.
Moreover, although inmates’ coping skills in segregation vary, few escape
unscathed by the experience.

4
Korn (1988) argues that conditions of confinement in the High Security Unit
(HSU) at Lexington (Kentucky) amounted to an “egregious violation of the rights of
citizens and a massive abuse of power by the state” (p. 8). He also describes the
conditions of confinement in this unit as similar in many respects to conditions found
in traditional segregation. Korn (1988) contends that women inmates confined in
this unit are depersonalized, denied individuality, denied personal autonomy,
sexually abused, humiliated, and forced into hopelessness. He suggests that the
conditions of confinement at the HSU at Lexington elicit claustrophobia, rage,
severe depression, hallucination, withdrawal, blunting of affect, and apathy.
Moreover, his research reports that women inmates housed in this unit experienced
physical reactions, such as loss of appetite and weight, exacerbation of pre-existing
medical problems, visual disturbances, dizziness, and heart palpitations.
Benjamin and Lux (1975) reviewed testimony of segregated adult and young
offenders and concluded that emotional illness and aggression are byproducts of
segregation. Two years later, they stated that there is “overwhelming evidence that
solitary confinement alone, even in the absence of physical brutality or unhygienic
conditions, can produce emotional damage, decline in mental functioning and even
the most extreme forms of psychopathology, such as depersonalization,
hallucination and delusions” (Benjamin and Lux, 1977, p. 268). They take the
position that placing an inmate in solitary confinement for a substantial length of time
(e.g., anything more than a few “cooling off” hours) amounts to “a criminal act far
worse than the original crime the prisoner committed in society, and worse than the
wide variety of disciplinary breaches which the prisoner may commit while in prison”
(p. 296). They argue that the devastating effects of long-term solitary are so severe
that the practice should be abolished. They affirm that solitary confinement: (1)
causes severe and possibly permanent mental deterioration and emotional
damage; (2) results in anger, hostility, and further violence; and (3) is implicated (in
some cases) in death by suicide.

5
Zubek, Bayer, and Shephard (1969) found that solitary confinement affects
physiological and psychological health. They assigned 66 university students for
one week to three conditions: (1) confinement, (2) confinement and social isolation,
and (3) control. Although the majority remained unaffected on standardized
measures, differences were found on a self-reported retrospective questionnaire,
including visual experiences of a hallucinatory-like nature, inefficient thought
processes, subjective restlessness, and anxiety. The authors concluded that “it is
clear that the various experimental conditions become increasingly less tolerable as
one proceeds from confinement, to social isolation, and finally to perceptual
deprivation” (p. 629).
Brodsky and Scogin (1988) reported similar findings. They interviewed 45
segregated inmates about their confinement in solitary confinement, and reported
alarming negative psychological and physiological harm on the Omnibus Stress
Questionnaire (Jones, 1976) and an isolation effects checklist. Inmates reported a
high prevalence of symptoms, such as feelings of nervousness (84%), headaches
(61%), talking to self (68%), hallucinations and delusions (42%), confusion (65%),
irrational anger (71%), nightmares (42%), and sleeping problems (61%).
Miller and Young (1997) administered the Brief Symptom Inventory
(Derogatis, 1975) to a group of ten offenders who were segregated for
administrative reasons and another group of ten offenders who were segregated for
disciplinary reasons. They compared the two groups to ten offenders who were
incarcerated in the general inmate population. They concluded that as inmates’
living restrictions increase, their level of psychological distress also increases.
No Negative Effects
There is a small body of empirical literature that provides evidence that
segregation produces few, if any negative psychological effects on inmates.
6
Support for this view stems primarily from the research of Gendreau and his
colleagues. For example, Gendreau et al. (1968a) undertook a study to examine
whether sensory deprived individuals attempt to seek increased stimulation. They
assigned 10 inmates for seven days to a severe sensory deprived condition and 10
inmates to a control condition. They found that the deprived inmates did not desire
a greater amount of sensory input subsequent to the perceptual deprivation
compared to the control group. The authors concluded that inmates could easily
adapt to the deprived situation.
In another study, Gendreau et al. (1968b) randomly assigned 16 students to
either isolation or a non-isolation condition for seven days. They found no
significant changes on visual and auditory skill tests. Gendreau et al. (1970) found
that monotonous confinement for two days did not result in differences in
discriminatory conditioning among inmates. Gendreau et al. (1972) found that
solitary confinement of inmates for seven days produced significant changes in their
EEG frequency and visually evoked potentials. Although they did not hypothesize as
to whether these changes were harmful, the authors argue that physiological
changes are simply related to inmates’ good ability to adapt to sensory deprivation.
Ecclestone, Gendreau, and Knox (1974) found that inmates’ personality constructs
in solitary confinement for ten days increased in stability compared with non-
confined inmates. The effect was stronger for “good” connotation constructs (e.g.,
understanding, honesty, successful, easy going, like me) than “bad” ones (e.g.,
stubborn, violent, unstable, pessimistic, insecure). Measures of plasma cortisol
levels failed to show that solitary confinement was more stressful than normal
institutional life.
Gendreau and Bonta (1984) responded to Jackson’s (1983) accusations that
segregation amounted to “cruel and unusual punishment”, calling them grossly
inflammatory and unfounded. They reviewed the empirical literature on sensory
deprivation, and concluded that “experimental studies examining the effects of

7
solitary confinement on inmates for up to 10 days and retrospective studies have
found little debilitating effects upon inmates” (p. 471). Eleven years later, they
reexamined the effects of incarceration with special attention to conditions of
confinement (Bonta & Gendreau, 1995). They again concluded that the
psychological empirical literature on sensory deprivation reveals no deleterious
effects of solitary confinement.
Other researchers who have investigated the effects of segregation have
reported similar findings to Gendreau and his colleagues. For example, Suedfeld et
al. (1982) assessed 26 inmates who experienced segregation and compared them
with 17 inmates who did not. Although they reported that increased time or
increased number of times in segregation were associated with inhibition, anxiety,
lack of self-insight, submissiveness, depression, hostility, suspicion, distrustfulness,
self-centeredness, and immaturity, they concluded that their data did not support the
claim that solitary confinement is “overwhelmingly aversive, stressful, or damaging
to the inmates” (p. 335).
A further study by Walters et al. (1963) randomly assigned 40 inmates to
either a segregation condition or the general inmate population for four days. They
found that the isolation produced some changes in subjective feelings (e.g.,
increased anxiety), but did not result in mental or psychomotor deterioration or
increased susceptibility to social influence. They concluded, “the deleterious
consequences of social isolation have been too greatly emphasized” (p. 772).

8
Evaluation of Existing Research on Segregation: A Review ofMethodological Shortcomings
The above review of the literature on the effects of segregation illustrates the
difficulty in reconciling the two opposing views of this debate. However, it appears
that supporters of one view often fail to appreciate the findings of the opposing view,
as well as to recognize the limitations of their own findings when drawing their
conclusions. The following review of methodological issues highlights the current
unsatisfactory state of the literature on the effects of segregation. As noted
previously, the ability to generalize the results of these studies is affected to varying
degrees by improper attention to methodological shortcomings of the research
conducted.
1. Reliance on Qualitative Data (e.g., Casual Observations, Interviews andAnecdotes)
Many authors use anecdotal evidence to support their claims (Benjamin & Lux,
1975, 1977; Brodsky & Scogin, 1988; Grassian, 1983; Jackson, 1983; Korn, 1988).
These authors often take selected powerful excerpts from interviews or the
testimony of segregated offenders or mental health professionals who had contacts
with segregated offenders to provide general evidence of the harmful effects of
segregation. Some rely on testimony on the use of isolation in the 19th century to
produce corroborative evidence of the harmful effects of segregation in today’s
North American correctional context (Grassian, 1983; Immarigeon, 1992; Luise,
1989). Others use case law of successful, and at times unsuccessful, human rights
litigation to depict the general conditions of confinement and treatment of
segregated offenders, as well as the ensuing psychological and physical harm
(Benjamin & Lux, 1977; Birkinshaw, 1981; Jackson, 1983; Luise, 1989).

9
The evidence of the damaging effects of segregation on offenders brought
forward by these authors is very disturbing, and cannot be ignored. However,
because of the nature of the methodology relied upon by these authors, it is often
unclear whether the pathologies displayed by some segregated offenders were
directly attributable to the conditions of confinement in segregation or whether prior
to their segregation these offenders displayed similar pathologies in the general
offender population or in the community (Gendreau & Bonta, 1984).
In addition, Suedfeld and colleagues (1982) found that some authors
inappropriately use findings from case studies of persons who experienced severe
abuse and sensory deprivation to illustrate the damaging effects of segregation.
Testimony of tortured political and war prisoners who were denied food, clothing,
medical assistance and procedural fairness are at times relied upon to provide
corroborative evidence of damaging effects of segregation in contemporary North
American correctional settings (Benjamin & Lux, 1975; Korn, 1988). Such
comparisons have been judged to be absurd, and the generalization of the findings
of these case studies questioned (Gendreau & Bonta, 1984; Suedfeld et al., 1982).
Isolation in a political or war camp is not comparable to the highly regulated and
formalized procedures for imposing segregation on offenders in North American
penitentiaries. Conditions of confinement, procedural safeguards, and the level of
safety and security provided to the offenders differ to such an extent that a
comparison is clearly inappropriate (Gendreau & Bonta, 1984; Suedfeld et al.,
1982).
2. Conditions of Confinement
One of the problems with segregation research stems from a difficulty in
defining the constructs being evaluated. Many terms, such as administrative
segregation, dissociation, isolation, seclusion, protective custody and solitary

10
confinement are used, often interchangeably, to describe various restrictive
environments. These terms encompass a wide range of conditions of confinement
in which restrictions on freedom of association and freedom of movement may vary,
and in which levels of perceptual deprivation, sensory deprivation and social
isolation may also vary. There is such a diversity in the nature of conditions of
confinement used in segregation research that lumping all studies together under
the same “solitary confinement” label has been judged to be inappropriate
(Suedfeld et al., 1982).
Many authors recognize the importance of the environment with respect to its
impact upon the segregation experience and the difficulty associated with
generalizing results (Grassian, 1983). Conditions of confinement and daily routine
vary so greatly among correctional institutions (Kane, 1997; Vantour, 1975) that
results derived from one institutional setting may not be applicable to others. For
example, the frequency and quality of interactions with staff or other offenders, the
physical layout of segregation cells (e.g., solid doors, cell size, etc.), the size of the
exercise yard, the availability of recreational equipment and hobby items, and the
access to personal effects, programs and services, may all impact on the
segregation experience. As a result, the majority of studies describe, at great
length, the conditions of confinement and the daily routine of segregated offenders
being studied.
Many authors have reviewed the proliferation of control units in the United
States and abroad in an attempt to determine their effects on offenders’ mental and
physical health (Birkinshaw, 1981; Coyle, 1987; Dowker & Good, 1993; Korn, 1988;
Immarigeon, 1992). The establishment of control units in the United States
originated in 1963 when a penitentiary in Marion (Illinois) was built to replace
Alcatraz (Coyle, 1987). Since then, more than 33 States have comparable Marion-
like facilities (Immarigeon, 1992). Control units provide a good illustration of the
difficulty in defining the constructs being evaluated. Although correctional authorities
do not formally recognize control units as segregation units, and although they

11
sometimes impose fewer restrictions on offenders than in traditional segregation
units, they often impose many similar conditions of confinement (Coyle, 1987;
Dowker & Good, 1993; Immarigeon, 1992; Korn, 1988). For example, Dowker and
Good (1993) describe some of the defining features of these institutions. Offenders
are confined in small cells for 22 or 23 hours per day. The cells are often equipped
with solid steel doors, which prevent any communication between offenders.
Further, often these institutions are equipped with remote electronic sliding doors,
which minimize, if not eliminate, most contact with correctional staff. There are no
congregate dining, exercise, or religious services, and few, if any, work
opportunities.
3. Relevance of Field and Laboratory Experiments on Sensory Deprivation
Most of the experimental studies on segregation come from the field of
sensory deprivation. Gendreau and his colleagues have generated and evaluated
many theories and hypotheses on sensory deprivation in the correctional context.
For example, Gendreau and colleagues examined whether: isolated prisoners show
higher arousal potential because of a lower arousal level induced by solitary
confinement (Gendreau et al., 1972); segregation enhances learning (Gendreau et
al., 1970); isolated subjects desire a lower level of stimulation (visual and auditory
sensory input) after a deprivation experience (Gendreau et al., 1968a); and stress
levels, as indicated by adrenocortical activity, can detect whether solitary
confinement is harmful (Ecclestone et al., 1974).
Others have commented upon or tested theories and hypotheses of sensory
deprivation in the correctional context as well. For example, Benjamin and Lux
(1977) argue that segregation is harmful because it dramatically reduces levels of
needed stimulation. Dowker and Good (1993) believe that offenders who are
segregated for long periods of time may be deprived of necessary meaningful

12
human contacts, and, as a result, these offenders have difficulties in coping with
normal social situations again.
Suedfeld et al. (1982) argue that the comparison between field or laboratory
experiments on isolation and stimulus reduction and today’s typical North American
segregation environment is inappropriate. They contend that it is highly
questionable whether the typical segregation unit in fact imposes much reduction in
stimulus input. They state that most segregated offenders can communicate with
guards and other offenders and have access to reading material, mail, lawyers,
other visitors, and frequently possess radios and television sets. However,
Gendreau and Bonta (1984) argue that the conditions of confinement in many of the
sensory deprivation and isolation experiments are more severe than those found in
today’s segregation units. They argue that, since these field and laboratory
experiments show little support for the position that sensory deprivation and
isolation are damaging, the conclusions drawn from these studies are especially
informative and relevant.
Zubek, Bayer, and Shephard (1969) define the concept of segregation in a
more detailed manner, arguing that it is comprised of three main components:
social isolation, sensory deprivation, and confinement. They believe that the nature
and the extent of all three components can vary significantly. Moreover, they
contend that it is often unclear whether and how one component or a combination of
components affect offenders’ health. The nature and the extent of (1) the contacts
with staff and other offenders, (2) the level of sensory deprivation (e.g., television,
adequate reading material, programs and service, etc.), and (3) the overall
conditions of confinement, may all affect offenders differently. Zubek, Bayer, and
Shephard (1969) suggest that typical perceptual deprivation experiments
inappropriately encompass social isolation and confinement. As a result, these
studies cannot provide answers as to which component affects offenders’ mental
health and functioning (i.e., the dependent variable). On the other hand, Scott and

13
Gendreau (1969) argue that “sensory deprivation (absolute), perceptual deprivation
(relative) and social isolation are three degrees of the same issue” (p. 337).
4. Selection of Subjects
4.1 Use of Volunteers. Experimental studies on segregation rely primarily on
volunteers who agree to be segregated for a fixed period of time. Some authors
have been reluctant to accept results of studies, which have relied on volunteers
(Arbour, 1996; Jackson, 1983; Vantour, 1975). Walters et al. (1963) believe that
the problem with using volunteers is that they are apparently not too frightened by
the prospect of facing a few days of isolation, and they may have personality
characteristics and past experiences which enable them to cope with, and remain
unaffected by, segregation.
Approximately half of all offenders placed in segregation are confined against
their will (Kane, 1997). In addition, it is questionable whether “voluntary”
segregation is truly voluntary. Arguably, most offenders would prefer to remain in
the general offender population if the threat to their personal safety was to be
removed. Nonetheless, some authors claim that, based on their “clinical
experience”, offenders who initially strongly object to being placed in segregation
appear to adapt as well as offenders who voluntarily request it (Ecclestone et al.,
1974; Gendreau et al., 1972).
In addition to the issue of using volunteers, the use of alternative populations
may also lead to limited generalization of findings. For example, the use of
university students who, in general, exhibit good adjustment, stable personality, and
higher levels of intelligence, education, and socioeconomic status may not lead to
accurate comparisons with the segregated offender population. Suedfeld et al.
(1982) argue that attempting to use findings from these sources as an indication of
14
what one can expect from offenders in segregation is inappropriate because it is
not relevant to the phenomenon being evaluated. The high prevalence of severe
mental disorders among segregated offenders' (Hodgins & Cote, 1991) makes any
comparison with university student samples somewhat questionable.
4.2 Use of Offenders Involved in Human Rights Violation Litigation. Some studies
on the negative effects of segregation have relied on segregated offenders who
were involved in lawsuits alleging violations of their constitutional rights (Brodsky &
Scogin, 1988; Grassian, 1983). Brodsky and Scogin (1988) conducted a study on
the effects of segregation in a unit, which was under litigation for human rights
violations. They found high rates of reported anger (86%), physical symptoms
(79%), sleep disturbance (64%), anxiety (45%), and depression (36%) among
segregated offenders. Grassian (1983) interviewed 15 offenders who were
involved in a class action suit against the Department of Corrections for alleged
violation of their Eighth Amendment provisions protecting them against “cruel and
unusual punishment”. Although his study argued that no offender knowingly
exaggerated negative symptoms, he found severe perceptual changes, affective
disturbances, and rapid subsidence of symptoms on termination of isolation in the
majority of the offenders, and disturbances of thought content and problems of
impulse control in a minority of cases.
Subjects involved in human rights violation litigation may have a special
interest in demonstrating that their conditions of confinement have negative
psychological and physiological effects. Therefore, the results of studies that rely on
such offenders will always remain questionable. Further, Suedfeld et al. (1982)
suggest that offenders engaged in litigation are perhaps not representative of
average offenders; their reactions to segregation may not be the norm. Similarly,
Gendreau and Bonta (1984) question the reliability of information of case studies
performed by Jackson (1983). They suggest that many of Jackson’s interviewed
offenders were notorious (e.g., Andy Bruce and Don Oag), far from representative,

15
and had filed an inordinately large number of grievances, legitimate or otherwise,
against the prison system.
4.3 Screening-out Subjects with Psychiatric History. A significant proportion of
segregated offenders have a psychiatric history (Hodgins & Cote, 1991; Motiuk &
Blanchette, 1997). However, some studies purporting to examine the impact of
segregation have screened-out such subjects (Ecclestone et al., 1974; Gendreau et
al., 1972). As a result, findings from these studies may be difficult to apply to the
population of segregated offenders.
Hodgins and Cote (1991) report that in their sample of 32 long term
segregated offenders, 31% suffered from some kind of severe lifetime mental
disorder (25% schizophrenia, 3.1% major depression, and 3.1% bipolar disorder).
The rate of schizophrenia among this sample was more than three times the rate of
the disorder among non-segregated offenders. However, the rate of major
depression in their sample was lower than the rate in the general offender
population. This suggests that non-disruptive mentally ill offenders may remain in
the general offender population, whereas offenders who are “disturbed and
disruptive” are isolated from the general offender population.
Wormith, Tellier, and Gendreau (1988) evaluated the attributes of offenders in
protective custody (PC) in a provincial institution. PC offenders typically can
associate between themselves but do not have access to the same level of
programs, services, and privileges offered to the general offender population. They
found that PC offenders were more likely to have a history of psychiatric problems.
They suggest that PC offenders’ psychological weaknesses and idiosyncratic
behaviours may not be well tolerated by the general offender population, and it
appears that inappropriate behaviours are often punished regardless of the
underlying basis for the conduct (Carriere, 1989; Gendreau, Tellier, & Wormith,
1985; Rold, 1992). Consequently, numerous offenders with mental disorders are
segregated (Gendreau et al., 1985; Rold, 1992).

16
Little research has focused on the effects of segregation on offenders with
psychiatric conditions. Many authors argue that segregation can exacerbate some
existing psychiatric conditions (Haney, 1993; Hodgins & Cote, 1991; Wadeson &
Carpenter, 1976). For example, Wadeson and Carpenter (1976) concluded that
segregation stimulates hallucinatory activity and provokes paranoia among some
mental health patients.
The existence of psychiatric disturbance may very well be a defining
characteristic of the population of segregated offenders. Moreover, findings from
the studies reviewed above underline the importance of not restricting research
samples to those without a history of psychiatric disorders.
5. Reasons for Segregation
Offenders may voluntarily request segregation or be involuntarily segregated
for a multitude of reasons (Kane, 1997; Gendreau et al., 1985; Wormith et al.,
1988). The most common reasons given by offenders for seeking various forms of
PC and segregation include: conflicts in the general population (e.g., gambling and
drug debts); the nature of the offender’s offense (e.g., sexual offender); suspected of
being an informant; personality problems; phobias (including fear of gays); being the
target of sexual aggression; and escaping the crowded and often violent
atmosphere of maximum security (Gendreau et al.,1985).
Approximately fifty percent of segregation placements are involuntary (Kane,
1997). Research on segregation thus far has failed to assess the effects of long
term segregation on these offenders. Such an omission has rendered
generalization of findings even more difficult. For example, the underlying reasons
for segregating offenders may influence their abilities to cope with the experience
(Weinberg, 1967). Whether they view their placement in segregation as a result of

17
their own behaviour or as the result of being an innocent victim of circumstances
beyond their control may influence their ability to cope with the more restrictive
regime of segregation.
6. Attrition
Some segregation studies reported attrition among subjects participating in
the experimental condition (i.e., segregation), and provided little, if any, explanations
(Ecclestone et al., 1974; Walters et al., 1963; Weinberg, 1967; Zubek et al., 1969).
For example, Ecclestone, Gendreau, and Knox (1974) reported a 32% attrition rate,
and Weinberg (1967) reported a 68% attrition rate. Even when more than adequate
monetary incentives are provided, attrition has been reported (Bexton, Heron, &
Scott, 1954; Zubek et al., 1969).
Attrition is a major drawback to psychological research in general. However,
the problem with attrition is especially relevant to the evaluation of the psychological
effects of segregation. Subjects who decide to no longer participate in the
experiment may be the same individuals who would not cope well with the
conditions of segregation and would be negatively affected by them.
7. Reliance on Cross-sectional and Longitudinal Research
Cross-sectional research is inadequate for evaluating the effects of
segregation. Results of cross-sectional segregation research are limited to the
identification of differences between groups (segregated and non-segregated).
The results of this type of research do not allow for inferences concerning the
causes of these differences (Suedfeld et al., 1982). Nevertheless, after conducting
a cross-sectional study and observing poorer mental and physical health among

18
segregated offenders than among non-segregated offenders, some authors have
quickly attributed the cause of such poorer health to segregation (Brodsky &
Scogin, 1988; Miller & Young, 1997). The possibility that segregated offenders
already were of poorer mental and physical health prior to their segregation must at
least be considered as an alternative explanation in cross-sectional studies.
8. Duration and Indeterminate Nature of Stay
Another problem with current experimental studies on segregation surrounds
the issue of the length and indeterminate nature of the stay (Jackson, 1983;
Suedfeld et al., 1982). In previous experimental research, the length of stay is
limited to ten days or less (e.g., 2 days: Gendreau et al., 1970; 4 days: Walters et
al., 1963; 5 days: Weinberg, 1967; 7 days: Gendreau et al., 1972; Gendreau et al.,
1968a; 1968b; Zubek et al., 1969; 10 days: Ecclestone et al., 1974). Moreover,
volunteers for these studies know exactly when the experiment will end, and that they
can end their participation at will.
The reality of segregation is that the length of stay is always unknown, and
more than 80% of offenders spend more than 10 days in segregation at any one
time (Kane, 1997). Suedfeld et al. (1982) argues that making general statements
on the effects of segregation without qualifying the length of stay is inappropriate.
Bonta and Gendreau (1995) specifically state that their conclusion that segregation
is not detrimental only applies to periods of segregation of 10 days or less. As
these studies confirm, generalizing the results of experimental studies beyond 10
days is questionable.
19
9. Lack of Comparison Group
Some studies utilizing structured and non-structured interviews with
segregated offenders have failed to include a comparison group of non-segregated
offenders (Brodsky & Scogin, 1988; Grassian, 1983). Brodsky and Scogin (1988)
interviewed 45 segregated offenders about their confinement in solitary confinement
but did not include a control group. Although they reported disturbing negative
psychological and physiological effects, since no comparison group was included,
the results are of little value because it remains undetermined whether offenders in
the general offender population would have reported similar effects about their
confinement in the general offender population.
10. Offender/Staff Interaction and the Punitive Reality of Segregation
Several authors have suggested that the relationship between staff and
offenders is an important factor which may affect how offenders cope with
segregation (Benjamin & Lux, 1977; Bonta & Gendreau, 1995; Carriere, 1989; Ellis,
1993; Gendreau & Bonta, 1984; Korn, 1988; Suedfeld et al., 1982; Vantour, 1975;
Wormith et al.,1988). Offenders may be more affected by the way they are treated
by correctional staff than by the conditions of confinement typically found in North
American segregation units (Bonta & Gendreau, 1995; Gendreau & Bonta, 1984;
Vantour, 1975). For example, Vantour (1975) argues that negative psychological
impacts of segregation are attributable not so much to the physical environment per
se, but to events surrounding the confinement, including:

20
the reason for being segregated; the process by which the prisoner is
segregated; the physical facilities and routine; the lack of contact with staff and
other prisoners; the length of the period of segregation; the uncertainty as to
when a prisoner will be released; and the process by which the prisoner is
returned to the population. (p. 65)
Similarly, Gendreau and Bonta (1984) argue that negative effects of solitary
confinement may be more the result of:
the fact [offenders] were not given clear criteria as to why they were placed in
solitary, their review process was amorphous, and they were not certain as to
how they could improve behaviorally so as to eventually leave. They claimed
they were also gratuitously harassed in petty ways by the guards. (p.474)
Bonta and Gendreau (1995) argue that there is some evidence that when
offenders are treated capriciously by management or correctional staff,
psychological stress can result even in the most humane of prison environments.
Harassment, physical roughness, enforcement and non-enforcement of rules, and
unpredictable withholding of privileges may play a greater role than complaints
about physical conditions, the social isolation and the sensory deprivation
associated with segregation (Suedfeld et al., 1982).
Many authors have found that contrary to legislative and policy provisions, the
management of administrative segregation is based on a punitive philosophy, and
that segregated offenders have fewer rights, privileges, and access to programs
and services than offenders in the general offender population (Arbour, 1996;
Carriere, 1989; Gendreau et al., 1985; Kane, 1997; Tellier, Wormith, & Gendreau,
1984; Vantour, 1975). For example, Arbour (1996) concluded that the Correctional
Service of Canada’s management of administrative segregation was not in
accordance with the law and its policies, and demonstrated a systemic “prison
culture which did not value individual rights” (p. xiii).
21
Wormith, Tellier, and Gendreau (1988) reported that correctional employees
often have negative views towards, and discriminate against, segregated offenders.
They found that PC offenders complained about the attitudes of correctional staff
towards them and the adverse psychological effects of being in PC, whereas
offenders in the general population were more likely to complain about institutional
living conditions, rules, and regulations. Similarly, Carriere (1989) states that PC
offenders are often treated in a demeaning manner by correctional staff. Further, he
contends that segregated offenders are treated as maximum-security offenders
regardless of the security risk they pose.
For generalization purposes, the evaluation of the effects of segregation must
include real interactions between staff and offenders, and should not be limited to
courteous interactions typically found in laboratory experiments.
11. Personality
The offenders’ personality or temperament may play a role in how they will be
affected by segregation. Some personality characteristics may reduce tolerance for
segregation, while other characteristics may enhance it (Suedfeld et al., 1982;
Walters et al., 1963). Little, if any, research on the effects of segregation has
focused on personality. Assessment of personality must be included in segregation
research in order to identify offenders’ abilities and predisposition's to cope with
segregation.
12. Other Factors

22
Segregation may have detrimental parole consequences, reduce an
offender’s chances of being admitted to a halfway house, and affect an offender’s
security classification (Carriere, 1989; Gendreau et al.,1985; Tellier, Wormith, &
Gendreau, 1984). Knowledge of these consequences may negatively affect how
offenders adapt to segregation. Further, an offender who was housed in a single
cell prior to segregation may be reassigned to a “double-bunked” cell after a
placement in segregation. This future loss of privacy may also affect how offenders
cope with the experience of segregation.
Other complaints may also influence the segregation experience such as cold
food and delayed response to requests for assistance (e.g., medication, telephone
calls, counselors, reading material, etc.) (Suedfeld et al., 1982). In the segregation
environment, these complaints cannot be viewed as trivial because they are often
the only distractions available to break the monotony of the segregation experience.

23
HYPOTHESES
1. Segregation for up to 60 days will negatively affect the mental health and
psychological functioning of offenders.
a. It will lead to increase internalizing symptoms (e.g., depression, anxiety,
hopelessness, and suicide ideation).
b. It will lead to increase externalizing symptoms (e.g., hostility, aggression,
and anger).
2. Segregation for up to 60 days will negatively affect offenders’ physical
functioning. That is, it will lead to increased reporting of somatic symptoms
(e.g., sleep patterns, heart palpitations, and loss of appetite and weight), and
decreased vigor-activity.
3. Segregation for up to 60 days will impact on offenders’ perception and cognitive
functioning. It will have a negative effect on specific cognitive processes (e.g.,
memory disturbances and problems with attention).
4. The experience of segregation will lead to a devaluation of interpersonal
relationships.
5. Involuntarily segregated offenders will be more affected by segregation than
voluntarily segregated offenders.

24
METHOD
Design and Procedures
Participants
Participants included offenders from Kingston, Collins Bay and Millhaven
Penitentiaries who had either been (a) placed in administrative segregation and
remained in segregation for 60 days (quasi-experimental group), or (b) randomly
selected from the general offender population and remained in the general offender
population for 60 days (comparison group). Data were collected over an eight-
month period beginning in October 1997.
Testing and Procedures
Senior psychologists at the selected institutions supervised the data
collection. The Psychologists selected and trained/oriented three research
assistants (RAs) concerning institutional security protocols and the use of the
psychological testing instruments. The RAs were graduates or students of
psychology (one 4th year student, one MA candidate, and one MA).
Offenders who were just placed in administrative segregation (voluntary and
involuntary) and provided their informed consent (see Appendices A and B for the
consent and information forms), were asked to complete written psychological tests
and take part in a structured interview. After each session, participants were
debriefed (see Appendices C and D). The same procedure was undertaken 30
days later and again 60 days later if the offenders remained segregated. Non-
segregated offenders were selected at random and underwent the same testing
procedures at the same intervals.

25
Measures
The initial testing session (session one) lasted approximately two hours. In
addition to the battery of tests, which were utilized at each session, the initial
session included a general measure of intelligence and a short personality
inventory. Because performance on these additional instruments was not expected
to fluctuate over 60 days, these measures were administered only once. The follow-
up assessments conducted at 30 days (session two) and 60 days (session three)
were therefore shorter, each lasting approximately one hour. The comparison group
underwent the same testing procedure as the segregated group.
The measures, which were selected for use in this study, were chosen based
on several criteria. Measures were selected which possessed acceptable
psychometric properties, had a short administration time, and had been previously
used with offender samples. Consideration was also given to measures, which had
been used in previous segregation research. Table 1 illustrates the list of
measures, which were selected for use in this study and their respective alphas.

26
Table 1: Measures Used in This Study
Measures (Initial Assessment Only) AlphaInterview Assessment N/ANEO Personality Inventory (Short Form) Neuroticism .84 Extraversion .70 Openness .61 Agreeableness .71 Conscientiousness .80Shipley N/A
Measures (All Three Sessions) AlphaAggression Questionnaire .89Balanced Inventory of Desirable Responding (shortform)
.69*
Beck Depression (abbreviated) .89Brief Symptom Inventory Somatization .86 Obsessive-compulsive .83 Interpersonal .79 Depression .84 Anxiety .83 Hostility .85 Phobic Anxiety .80 Paranoid Ideation .80 Psychoticism .66Holden Psychological Screening Inventory .84Hopelessness Scale .89Interview Assessment N/AState-trait Anxiety Inventory (State-short form) .83WAIS Sub-test: Digit Span N/AWAIS Sub-test: Digit Symbol N/A
Note. * Items 4, 7 & 9 were removed to improve psychometric properties.

27
Aggression Questionnaire (AQ; Buss & Perry, 1992)
The Aggression Questionnaire is a widely used self-report measure of
externalizing behaviours and feelings. This 29-item instrument is rated on a 5-point
scale of least to most characteristics. There are four subscales: Physical
Aggression; Verbal Aggression; Anger; and Hostility. This scale has been used with
offender samples (e.g., Williams et al., 1996).
Although this measure is relatively new, there is strong evidence for its
reliability. The alpha coefficients of internal consistency for the subscales have
been reported to range from .72 to .89 (Archer, Kilpatrick, & Bramwell, 1995; Buss
& Perry, 1992). Test-retest reliability over a nine-week period has been reported to
range from .72 to .80 (Buss & Perry, 1992). Although there is a relatively small
number of items per scale, the coefficients indicate that the stability over time is
adequate.
Convergent validity has been reported. Aspects of temperament and other
traits have been found to correlate strongly with relevant subscales, as well as with
perceptions of others (Buss & Perry, 1992). In addition, the Verbal, Anger, and
Physical Scales of the AQ have been reported to be highly correlated with similar
scales on the Aggression Inventory (Archer et al., 1995). The validity of the measure
has been supported by the ability of the Physical Aggression subscale to predict
enjoyment of fights and willingness to join in a fight, but not to perceptions of others’
hostility (Russell, 1995; Russell & Arms, 1995). The Anger subscale was able to
predict those who would expect a riot to ensue due to insults (Russell & Arms,
1995).

28
Balanced Inventory of Desirable Responding (BIDR; Paulhus, 1984)
The BIDR is composed of 40 items, which are rated on a 7-point scale. This
instrument has two subscales: Self-Deception and Impression Management. The
Self-Deception Scale assesses self-motivated biased responding that portrays the
respondent more positively. The Impression Management Scale assesses other-
motivated responding, that is, attempting to present a favourable impression on
others. This measure has been used with offender samples (e.g., Kroner &
Weekes, 1995).
Convergent validity of this scale has been supported by the report of a
significant relationship between the subscales of this instrument and the Marlowe-
Crowne Social Desirability Scale (Dutton & Hemphill, 1992). Socially desirable
responding as measured by this scale has also been negatively associated with
reports of committing violence and verbal aggression on the Conflict Tactics scale,
as well as reported feelings of anger on the Multidimensional Anger Inventory
(Dutton & Hemphill, 1992). Discriminant validity has been suggested by the finding
that those with different personal ideals (i.e., ingratiators, exemplifiers, and
intimidators) scored differently on the Impression Management subscale (Verkasalo
& Lindeman, 1994).
The psychometric properties of this measure have been examined with
offender samples. Kroner and Weekes (1996) reported the existence of three
factors within an offender sample: Impression Management (IM); Denial of the
Negative (DN; unwillingness to admit undesirable characteristic to the self), and;
Over-Confident Rigidity (OCR; self-perception of infallibility and rigidity). The
internal consistency of the three-factor solution ranged from .58 (OCR, 9 items) to
.84 (IM, 17 items). The DN and the OCR scales have been found to discriminate
between offenders who admit and those who deny or partially deny committing their
offences. Moreover, the IM and OCR scales have been found to differentiate

29
between intake and upcoming release offenders. The five items, which loaded
most strongly on these three scales, were selected, creating a 15 item short form of
the BIDR.
Beck Depression Inventory - Short Form (BDI-S; Beck & Beck, 1972)
The BDI is a widely used instrument, designed to measure the severity of
cognitive, behavioural and physiological symtomatology in depression over the last
week. For each item, four alternative statements which reflect differential severity
regarding functioning are provided. This measure has been used with offender
samples (e.g., Coleman et al., 1992; Day, 1993; Eyestone & Howell, 1994;
Gudjonsson, 1984; McGuire et al., 1995; Smyth, Ivanoff, & Jang, 1994). Although
the full version has 21 items, there is a short form available, which is composed of
13 items (BDS-S; Beck & Beck, 1972). The BDI-S was selected for use in the
present study.
The psychometric properties of this instrument (both forms) are strong, and
there is a high concordance between the BDI and the BDI-S. Beck and colleagues
(Beck & Beck, 1972; Beck, Rial, & Rickles, 1974) reported correlation's of .89 to
.97 between the two forms. The short form has also been found to be correlated
well with clinician’s ratings of depression (Beck & Beck, 1972; Beck et al., 1974;
Scogin et al., 1988; Stukenberg et al., 1990).
The internal consistency of this instrument is good as alpha coefficients have
been reported to range from .74 to .90 (Beck & Beamesdorfer, 1974; Foelker et al.,
1987; Gould, 1982; Leahy, 1992; Scogin et al., 1988; Vredenberg et al., 1985).
Although the initial use of the BDI-S dictated an uni-dimensional solution, others
have reported the existence of two factors (Leahy, 1992; Foelker et al., 1987;
Reynolds & Gould, 1981; Volk et al., 1993).
30
However, there is some indication that the BDI-S suffers from poor accuracy,
identifying a high number of false positives (poor specificity; Volk, Pace, &
Parchman, 1993). Using a cut-off point of 8, the sensitivity and specificity of the
BDI-S have been reported at .71 to .79 and .77 to .83 respectively (Nielson &
Williams, 1980; Stukenberg et al., 1990).
Brief Symptom Inventory (BSI; Derogatis, 1992)
This 53-item inventory was designed to screen for psychological symptom
status in the last week. This measure is essentially a short form of the Symptom
Checklist - 90 - Revised (SCL-90-R), and correlation's between the two forms are
reported to be high (e.g., .92 to .98; Derogatis, 1992). This instrument takes about
10 minutes to complete, and yields 9 primary dimension scores (Somatization;
Obsessive-Compulsive; Interpersonal Sensitivity; Depression; Anxiety; Hostility;
Phobic Anxiety; Paranoid Ideation; and Psychoticism). In addition there are three
global indices (Global Severity; Positive Symptom Distress Index; and Positive
Symptom Total). This measure has been used with offender samples (e.g., Boulet
& Boss, 1991; Singer et al., 1995), and in segregation research (e.g., Miller, 1994).
The scales demonstrated good internal consistency, with alpha coefficients
reported to range from .71 to .89 (Boulet & Boss, 1991; Broday & Mason, 1991;
Derogatis & Melisaratos, 1983). Test-retest reliability is also excellent with a range
from .68 to .91 for the subscales (Derogatis & Melisaratos, 1983).
This scale has demonstrated concurrent validity with (1) assessments of
negative affect, life satisfaction, and affect intensity (Sheldon, 1994), (2) the Beck
Anxiety Inventory (Osman et al., 1993), (3) the Cognition Checklist (Osman et al.,
1995), and (4) the MMPI (Boulet & Boss, 1991). Discriminant validity has also been
demonstrated for normative groups compared to: those with Hoarding problems

31
(Frost, Krause, & Steketee, 1996); sexually dysfunctional patients (Derogatis &
Meyer, 1979); and violent men in relationships (Gavazzi, Julian, & McKenry, 1996).
Moreover, this measure is sensitive to treatment effects (Piersma, Reaume, &
Boes, 1994).
Holden Psychological Screening Inventory (HPSI; Holden, Mendonca,Mazmanian, & Reddon, 1992)
This 36-item inventory, which measures psychosocial adjustment, is rated on a
5-point scale. In addition to providing a total score, this is used to assess three
higher order components of psychopathology: Psychiatric Symtomatology
(psychotic processes, anxiety and somatic concerns), Social Symtomatology
(inadequate or deviant socialization and impulse expression) and Depression
Symtomatology (feelings of pessimism, poor self-esteem, and social introversion).
This instrument has been used with offender samples (e.g., Holden & Grigoriadis,
1995; Reddon et al., 1996).
The alpha coefficients of internal consistency have been reported to range
from .66 to .90 for the subscales and total score (Holden, 1991; Holden et al., 1992).
This scale has also been found to have convergent validity with staff ratings (Holden
et al., 1992). Moreover, the HPSI has been found to be sensitive to the effects of
psychological interventions (Reddon et al., 1996). The subscales of the HPSI have
also shown concurrent validity with the MMPI-2 and the BPI (Holden & Grigoriadis,
1995), and the NEO Five Factor Inventory (Costa & McCrae, 1989; Holden, 1992).

32
Hopelessness Scale (BHS; Beck & Steer, 1988)
This 20-item T/F scale measures negative experiences and pessimism
concerning the future. Hopelessness is thought to be interrelated with the constructs
of depression, and to be a good predictor of suicidal ideation (Ivanoff & Jang, 1991;
Steer et al., 1993). This measure has been used with offender samples (e.g.,
Ivanoff & Jang, 1991; Power & Beveridge, 1990; Smyth et al., 1994).
The internal consistency of this scale is good. Alpha coefficients have been
reported to be between .82 and .93 (Beck & Steer, 1988), and item-total
correlations ranged from .39 to .76 (Beck et al., 1974). The construct of
hopelessness has been hypothesized to be state-like (as opposed to a trait), and
thus, unstable. Due to this factor, test-retest reliabilities have been relatively low,
ranging from .66 to .94 (Beck & Steer, 1988; Holden & Fekken, 1988).
Concurrent validity has been reported between this measure and indicators of
suicide risk (Lennings, 1992). Concurrent validity has been shown with clinical
ratings of hopelessness (Beck et al., 1974) and with other tests which measure
negative attitudes about the future (Beck et al., 1974). Evidence for discriminant
validity has been presented (e.g., differentiating heroin-addicted from alcoholic
women; Beck, Steer & Shaw, 1984). Finally, this measure is sensitive to treatment
effects (Beck et al., 1974).
Interview Assessment
A structured interview was developed (see Appendix D for the session 1
interview for segregated inmates) and was administered at each testing session.
The initial interview was more comprehensive and required an additional five
minutes of testing time. Aspects of the interview have been taken from existing

33
scales and interviews, and cover the following areas which were not assessed by
the other psychological measures: present feelings; history of segregation (e.g.,
priors, reasons); significant events happening over the last week - stressors; time
allotment; social relationships; suicidal ideation; and social and interpersonal skills.
Neuroticism, Extroversion, Openness, Personality Inventory (NEO-FFI; Costa &McCrae, 1992)
The NEO was designed to assess the “big five” personality constructs:
Neuroticism; Extroversion; Openness; Agreeableness; and Conscientiousness. The
NEO has been used previously with offender samples (e.g., Lehne, 1994). The long
form of this inventory is composed of 181 items. However, for this investigation the
short form was selected. This version is composed of 60 items rated on a 5-point
scale.
The NEO (short form) is relatively new and few studies of the psychometric
properties of this measure have been reported. The manual, however, presents
adequate evidence of the psychometric properties. Internal consistency is reported
to be acceptable, with alpha coefficients ranging from .73 to .95 (Costa & McCrae,
1992; Holden & Fekken, 1994) for the subscales. Support for the construct validity
of this scale has been reported with the HPSI (Holden, 1992).
Shipley Institute of Living Scale-Revised (Shipley, 1940)
The Shipley, also known as the Shipley-Hartford Retreat Scale, is a widely
used screening measure of overall intellectual ability. This instrument consists of a
40 item (multiple choice) Vocabulary subtest and 20 item (open-ended) Abstract
Reasoning subtest. The Shipley yields six summary scores: vocabulary;
34
abstraction; total test; conceptual quotient; abstraction quotient; and an estimate of
IQ. This instrument has been used with offender samples (e.g., Fowles & Tunick,
1986; Hooper & Evans, 1984; Ingram et al., 1985; Sutker & Moan, 1973; Wood,
Conn, & Harrison, 1977), and in segregation research (Walters et al., 1963;
Weinberg, 1967).
Shipley (1940) provided evidence for the internal consistency of the scales
(.87 for Abstractions to .92 for Total test). Test -retest reliability for periods of three
months have been reported to range from .57 to .88 for the factors (Ruiz & Krauss,
1967; Shipley 1940).
Validity has been examined in terms of the relationship of the Shipley with the
Wechsler Adult Intelligence Scale (WAIS, entire test as well as subscales), and the
Wechsler-Bellevue Intelligence Test (Fowles & Tunick, 1986; Frisch & Jessop,
1989; Heinemann et al., 1985; Retzlaff, Slicner, & Gibertini, 1986; Shipley, 1940;
Weiss & Schell, 1991). Concurrent validity has also been supported with this scale
and the Hemmon-Nelson Tests of Mental Ability (Watson et al., 1992). The
discriminant validity of the Shipley has also been presented (identifying disruptive
youths; Hooper & Evans, 1984).
State-Trait Anxiety Inventory (Spielberger, 1983)
This measure is composed of 40 items which assess two distinct but related
aspects of anxiety: (a) state anxiety: transitory, subjective (nervousness, worry, high
arousal), and a function of situational stress; and (b) trait anxiety: relatively stable
differences in anxiety proneness (how one perceives or approaches stressful
situations). Respondents indicate how they feel ”right now” based on a four point
scale. This measure has been used extensively in research with clinical populations
and with offender samples (e.g., Lutz, 1990; Segal, Hobfoll & Cromer, 1984).

35
The internal consistency of this measure is high; coefficient alphas have been
reported at .87 (Knight, Waal-Manning, & Spears, 1983; Spielberger, 1983), and
Kuder-Richardson (KR-20) correlations (split-half and odd-even) have been
reported to range from .45 to .85 (Metzger, 1976). As would be expected, the test-
retest correlation coefficients are low (r = .16 to .62) for the State scale, indicating
that this measure is sensitive to fluctuations due to situational variations (Metzger,
1976; Nixon & Steffeck, 1977; Spielberger, 1983).
The state scale has been found to differentiate persons who were facing a
stressful situation from those who were not (Metzger, 1976). Convergent validity
has been reported with measures of depression (MMPI, BHS, and the BDI; Novy et
al., 1993).
For this study a six-item short form was used. This short form has been found
to display acceptable reliability and validity. In fact, the scores provided by the short
form in previous research are similar to those of the long form (Matreau & Bekker,
1992).
Additional Data Collection
Physical Conditions
Research assistants gathered information on the physical layout of the
segregation units (see Appendix E for the conditions of confinement checklist).
Offender Intake Assessment
All offenders sentenced to penitentiaries (i.e., for prison terms exceeding two
years) must complete the Offender Intake Assessment (OIA) prior to their
penitentiary placement. In most instances, the OIA lasts eight weeks, and allows

36
CSC to render informed decisions with respect to placement, classification, and
programming. During the OIA, information on offenders is collected and stored on
the computerized Offender Management System (OMS).
OIA information was retrieved on offenders’ current and past criminal history
and the seven need domains (Employment, Marital/Family, Associates, Substance
Abuse, Community Functioning, Personal/Emotional and Attitude). Offenders’
scores on the Statistical Information on Recidivism (SIR) were also retrieved. The
SIR score provides an estimate of the probability that an individual will re-offend
within three years after release. Each offender’s total score on the SIR scale can
range from –30 (very poor risk) to + 27 (very good risk). There is evidence that the
SIR Scale possess good reliability and validity (Bonta, Harman, Hann, & Cormier,
1996; Bonta, Pang, & Wallace-Capretta, 1995; Hann & Harman, 1989). Further,
this scale has shown a good ability to predict release outcome (Hann & Harman,
1988; Motiuk & Porporino, 1989).
It should be noted that sex offenders and homicide offenders, as a group,
score favourably on this scale as they are considerably older than the general prison
population and typically have less exposure to the Criminal Justice System (Motiuk
and Blanchette, 1997).
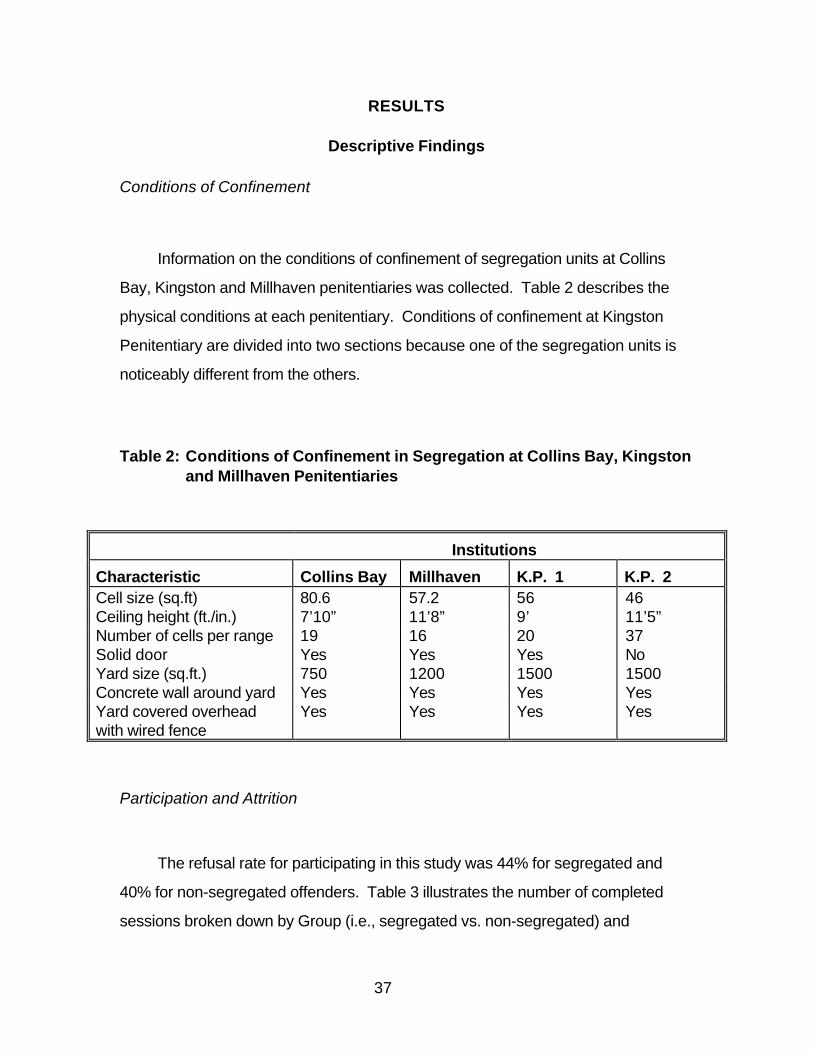
37
RESULTS
Descriptive Findings
Conditions of Confinement
Information on the conditions of confinement of segregation units at Collins
Bay, Kingston and Millhaven penitentiaries was collected. Table 2 describes the
physical conditions at each penitentiary. Conditions of confinement at Kingston
Penitentiary are divided into two sections because one of the segregation units is
noticeably different from the others.
Table 2: Conditions of Confinement in Segregation at Collins Bay, Kingstonand Millhaven Penitentiaries
Institutions
Characteristic Collins Bay Millhaven K.P. 1 K.P. 2Cell size (sq.ft) 80.6 57.2 56 46Ceiling height (ft./in.) 7’10” 11’8” 9’ 11’5”Number of cells per range 19 16 20 37Solid door Yes Yes Yes NoYard size (sq.ft.) 750 1200 1500 1500Concrete wall around yard Yes Yes Yes YesYard covered overheadwith wired fence
Yes Yes Yes Yes
Participation and Attrition
The refusal rate for participating in this study was 44% for segregated and
40% for non-segregated offenders. Table 3 illustrates the number of completed
sessions broken down by Group (i.e., segregated vs. non-segregated) and

38
institutions. It shows that 83 segregated offenders and 53 non-segregated
offenders participated in this study. However, complete data for all three sessions
(60 days) were only available for 23 segregated and 37 non-segregated offenders.
The loss of participants from the segregated group was primarily due to
releases to the general offender population or transitional units (i.e., protective
custody), or transfers to other institutions. True attrition, the refusal to participate in
a subsequent session, occurred in nine cases (10.8%). It should be noted that true
attrition included cases in which offenders expressed their intent to participate in the
study but their conduct jeopardized the personal safety of the RAs (e.g., threats, and
one incident in which an offender attempted to grab a RA). The average elapsed
time after placement in segregation for session one, two and three was 3.6, 29.8
and 57.8 days respectively.
For non-segregated offenders, the loss of participants was mainly due to
transfers to other institutions and placement in segregation. True attrition occurred
in only two cases (3.8%).
Table 3: Number of Completed Sessions (S.1, S.2, & S.3) broken down byGroup and Institutions
Segregated (n=83) Non-Segregated (n=53)
Institution S.1 S.2 S.3 S.1 S.2 S.3
Collins Bay 31 8 7 19 16 16Kingston 19 12 11 20 17 14Millhaven 33 12 5 14 13 7
Total 83 32 23 53 46 37

39
Table 4 shows a breakdown of institutions and the legal reasons for placement
in administrative segregation. Initially (i.e., upon placement), 39% (n = 32) of
segregated offenders were voluntary cases whereas 61% (n = 51) were involuntary
cases. Moreover, voluntary cases were all seeking protection, whereas the majority
of involuntary cases (71%, n = 36) were legally placed in administrative segregation
for jeopardizing the safety of other offenders, staff, or the security of the institution.
Noteworthy, after 60 days the percentage of voluntary cases increased to 57% (n =
13) and the percentage of involuntary cases decreased to 43% (n = 10).
Table 4: Breakdown of Institutions and Reason for Segregation by Typeof Segregation
VoluntarySection 31*
InvoluntarySection 31*
Institution (1) (2) (3) Total (1) (2) (3) Total Collins Bay 4 0 0 4 6 17 4 27 Kingston 15 0 0 15 1 3 0 4 Millhaven 13 0 0 12 2 16 2 2
Total 32 0 0 32 (39%) 9 36 6 51 (61%)Note. * Section 31 of the CCRA provides the reasons for placement in administrative segregation:(1) an offender’s own safety is in danger; (2) an offender may jeopardize the safety of others or thesafety of the penitentiary; and (3) an offender may interfere with a criminal investigation or with aserious disciplinary matter.
Demographics
Age
Using t-tests, segregated offenders were found to be younger (M = 28.9) than
non-segregated offenders (M = 32.20, t (134) = 2.66, p < .01). The age of
segregated and non-segregated offenders ranged from 20 to 54 years old.
Bivariate correlation analyses showed that Age was not significantly correlated with
any measure (i.e., dependent variable).

40
Race
The Offender Intake Assessment (OIA) was used to provide background
information on the offenders. OIA information on race was available on 119
offenders: 66% of offenders were Caucasian; 25% black; 7% aboriginal, and; 3%
from other visible minority groups. Among segregated offenders (n = 73), the
percentage of Caucasians, blacks, aboriginal and other visible minority groups was
64%, 27%, 7% and 1% respectively.
Education
OIA information was used to assess the educational background of offenders.
Using chi-square analyses, Table 5 indicates that segregated and non-segregated
offenders did not significantly differ in educational background.
Table 5: Education OIA Indicators for Segregated and Non-segregatedOffenders
Non- Seg. Seg.χχ 2 Sign.
OIA Indicator % (n=39) % (n=54)
Under Grade 8 23.1 27.8 0.26 ns Under Grade 9 51.3 56.6 0.26 ns No High School Diploma 84.6 83.0 0.04 ns Learning Difficulty 26.3 33.3 0.52 ns Learning Disability 21.1 22.6 0.03 ns

41
Criminal History
OIA data also provided criminal history information for 131 offenders. As table
6 shows, chi-square analyses reveal no significant difference between segregated
and non-segregated offenders on past and current offence history. Similar non-
significant findings were obtained on history of disciplinary infractions (χ2 (1, N = 84)
= 1.93, p = 0.17), escape/UAL (χ2 (1, N = 91) = 0.95, p = 0.33) and failure on
conditional releases (χ2 (1, N = 91) = 0.95, p = 0.39).
Table 6: Offence History (Past and Current) of Segregated and Non-Segregated Offenders
OffencesNon- Seg.
% (n=49)
Seg.% (n=82) χχ 2 Sign.
Homicide 10.2 15.9 0.83 ns Robbery/Assault 76.3 82.5 0.54 ns Sexual Assault 15.8 15.8 0.00 ns Property 31.4 33.3 0.04 ns Drugs 16.3 14.6 0.07 ns Other* 34.2 45.6 1.23 ns
Note. * e.g., arson, weapon and forcible confinement.
With respect to session one segregated offenders (n = 83), nine were serving
life sentences (11%). The average sentence length (excluding life sentences; n =
74) imposed by the Courts for their index offence was 6.97 years.
Of the 53 session one non-segregated offenders, 13 offenders were serving
life sentences (25%). The average sentence length (excluding life sentences; n =
40) imposed by the Courts for their index offence was 5.98 years.
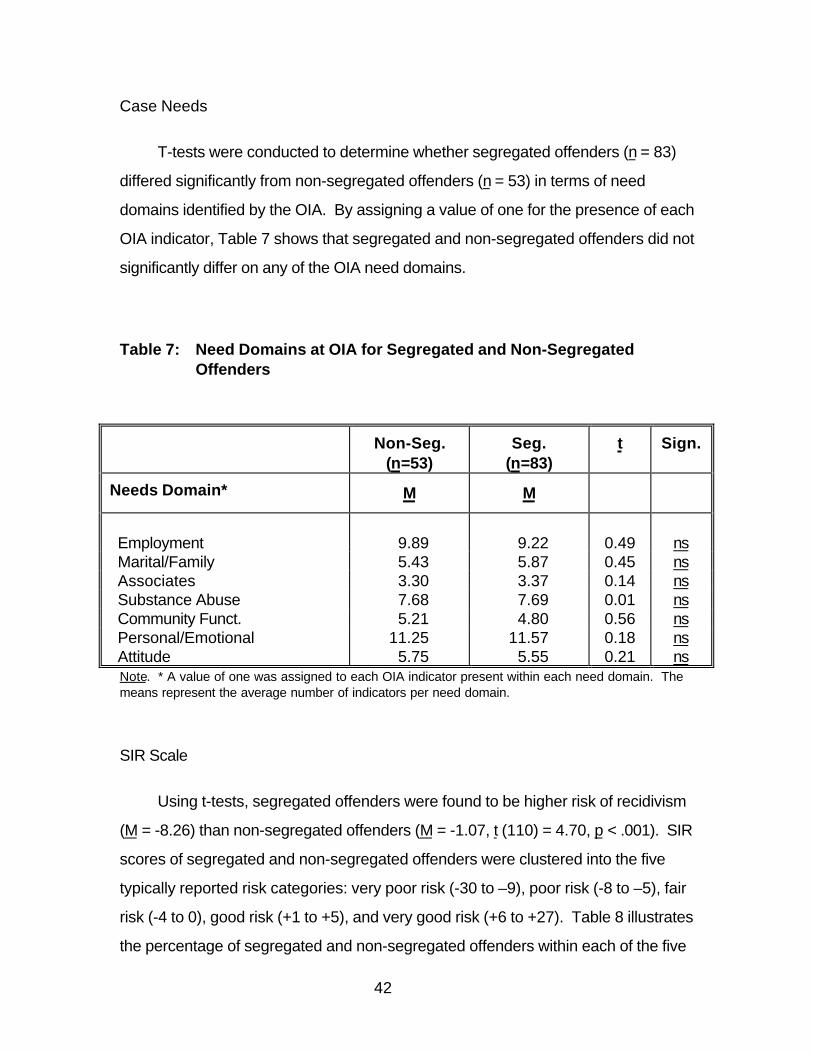
42
Case Needs
T-tests were conducted to determine whether segregated offenders (n = 83)
differed significantly from non-segregated offenders (n = 53) in terms of need
domains identified by the OIA. By assigning a value of one for the presence of each
OIA indicator, Table 7 shows that segregated and non-segregated offenders did not
significantly differ on any of the OIA need domains.
Table 7: Need Domains at OIA for Segregated and Non-SegregatedOffenders
Non-Seg.(n=53)
Seg.(n=83)
t Sign.
Needs Domain* M M
Employment 9.89 9.22 0.49 ns Marital/Family 5.43 5.87 0.45 ns Associates 3.30 3.37 0.14 ns Substance Abuse 7.68 7.69 0.01 ns Community Funct. 5.21 4.80 0.56 ns Personal/Emotional 11.25 11.57 0.18 ns Attitude 5.75 5.55 0.21 ns
Note. * A value of one was assigned to each OIA indicator present within each need domain. Themeans represent the average number of indicators per need domain.
SIR Scale
Using t-tests, segregated offenders were found to be higher risk of recidivism
(M = -8.26) than non-segregated offenders (M = -1.07, t (110) = 4.70, p < .001). SIR
scores of segregated and non-segregated offenders were clustered into the five
typically reported risk categories: very poor risk (-30 to –9), poor risk (-8 to –5), fair
risk (-4 to 0), good risk (+1 to +5), and very good risk (+6 to +27). Table 8 illustrates
the percentage of segregated and non-segregated offenders within each of the five

43
risk categories. It shows that 80.9% (n = 55) of segregated offenders were grouped
in the poor and very poor risk categories compared to only 45.4% (n = 20) for non-
segregated offenders. Conversely, 54.6% (n = 24) of non-segregated offenders
were grouped in the fair, good, and very good risk categories compared to only
19.1% (n = 13) of segregated offenders.
Table 8: Percentage Distribution of SIR Risk Groups for Segregated andNon-Segregated Offenders
Non-Segregated Segregated
Risk Grouping n (%) n (%)
Very Poor 10 (22.7) 41 (60.3) Poor 10 (22.7) 14 (20.6) Fair 9 (20.5) 2 (2.9) Good 4 (9.1) 8 (11.8) Very Good 11 (25.0) 3 (4.4)
Total 44 (100) 68 (100)
I.Q.
Estimates of I.Q. from the Shipley Institute of Living Scale-Revised (Shipley,
1940) were compared for segregated and non-segregated offenders. Non-
segregated offenders (M = 97.25) possessed higher estimates of I.Q. than
segregated offenders (M = 89.70, t (131) = 2.93, p < .01). Bivariate correlation
analyses revealed that the estimate of I.Q. was significantly correlated with the
WAIS Digit Symbol (r = .27, p < .01) and Digit Span (r = .48, p < .01) but unrelated
to other measures.

44
Personality
Table 9 shows the differences between segregated and non-segregated
offenders on the “big five” personality constructs as assessed by the NEO
Personality Inventory (NEO-FFI; Costa & McCrae, 1992). Segregated offenders
scored higher on Neuroticism (t (125) = 3.73, p < .001), and lower on Extraversion (t
(129) = 2.26, p < .05), Openness (t (127) = 3.09, p < .01), Agreeableness (t (121) =
2.99, p < .01) and Conscientiousness (t (127) = 3.54, p < .001) than non-
segregated offenders.
Table 9: NEO-FFI Sub-scores for Segregated and Non-SegregatedOffenders
Seg. (n=83) Non-Seg. (n=53) t (df)
Factors (T-Scores) M M
Neuroticism*** 54.9 48.4 3.73 (125)
Extraversion* 45.9 50.0 2.26 (129)
Openness** 49.0 53.5 3.09 (127)
Agreeableness 41.6 47.4 2.99 (121)
Conscientiousness*** 45.2 51.2 3.54 (127)
Note. *p <.05, ** p < .01, *** p < .001
Social Desirability
A between/within-subject repeated measures univariate analyses was
performed on the sample of 60 offenders who completed all three sessions
(segregated (n = 23) and non-segregated offenders (n = 37)) using the BIDR as a

45
dependent variable (DV). Non-segregated offenders showed significant higher
scores of impression management and self-deception than segregated offenders
(F(1, 58) = 11.36, p < .001, η2 = .16). Although the BIDR was significantly
correlated with all dependent variables, due to the relationship between the BIDR
and the independent variable Group (i.e., segregated versus non-segregated
offenders), the BIDR was not used as a covariate for subsequent analyses.
Segregated and non-segregated offenders displayed significantly increased
scores on impression management and self-deception across time (F(2, 116) =
3.68, p < .05, η2 = .06). However, the ANOVA revealed no significant Time (i.e.,
session 1, 2 & 3) by Group interaction.
Mental Health and Psychological Functioning: Offenders Who CompletedThree Sessions
Between/within-subject repeated measures univariate analyses were
performed on the sample of 60 offenders who completed all three sessions
(segregated (n = 23) and non-segregated offenders (n = 37)) using the eight
measures as dependent variables (DVs). Table 10 presents the means and
respective standard deviations for each of the eight measures for all three sessions.

46
Table 10: Session Means of Measures for Segregated (n = 23) and Non-Segregated (n =37) Offenders Who Completed All Three Sessions(S.1, S.2, & S.3)
Means (SD)
DV Group S.1 S.2 S.3
AggressionQuestionnaire
Seg.Non-Seg.
77.6 (14.2)68.2 (14.2)
71.5 (17.7)66.9 (18.6)
72.1 (21.2)65.5 (20.0)
Beck DepressionSeg.Non-Seg.
8.8 (7.3)5.5 (5.6)
6.3 (6.0)4.6 (5.8)
6.6 (5.5)3.9 (5.0)
Brief SymptomInventory
Seg.Non-Seg.
0.92 (0.18)0.58 (0.46)
0.62 (0.39)0.44 (0.42)
0.62 (0.44)0.38 (0.40)
HPSISeg.Non-Seg.
52.4 (15.6)40.9 (12.1)
46.7 (11.6)39.2 (10.5)
49.3 (11.2)37.8 (12.6)
HopelessnessScale
Seg.Non-Seg.
5.3 (4.6)4.3 (4.3)
3.6 (3.6)3.1 (4.4)
4.3 (4.3)2.8 (4.3)
State-traitAnxiety Inventory
Seg.Non-Seg.
13.4 (4.4)12.0 (3.4)
12.1 (4.0)9.8 (3.5)
13.1 (4.5)9.6 (3.3)
WAISDigit Span1
Seg.Non-Seg.
8.7 (2.9)9.6 (2.5)
9.5 (2.8)9.5 (2.6)
9.5 (3.1)10.1 (2.3)
WAISDigit Symbol1
Seg.Non-Seg.
7.8 (2.4)8.7 (2.3)
9.0 (3.1)9.9 (3.0)
9.4 (3.3)10.5 (2.9)
Note. 1 Indicates scaled scores.
Aggression Questionnaire
The Analysis of Variance (ANOVA) on the AQ revealed no significant main
effect or interaction.

47
Beck Depression Inventory - Short Form
Both segregated and non-segregated offenders reported significantly fewer
depressive symptoms across time (F(2,116) = 8.3, p < .001, η2 = .13). The
ANOVA revealed no significant interaction (Time by Group).
Brief Symptom Inventory
Segregated offenders reported significantly more depressive symptoms than
non-segregated offenders (F(1,58) = 5.67, p < .05, η2 = .09). In addition, both
segregated and non-segregated offenders reported significantly fewer depressive
symptoms across time (F(2,116) = 19.57, p < .001, η2 = .25). The ANOVA
revealed no significant interaction.
Holden Psychological Screening Inventory
Segregated offenders reported significantly more problems in psychosocial
adjustment than non-segregated offenders (F(1,58) = 11.40, p < .001, η2 = .16). As
well, segregated and non-segregated offenders reported significantly fewer
problems in psychosocial adjustment across time (F(2,116) = 6.27, p < .01, η2 =
.10). The ANOVA revealed no significant interaction.
Hopelessness Scale
Segregated and non-segregated offenders did not significantly differ on this
measure. However, segregated and non-segregated offenders indicated

48
significantly less hopelessness across time (F(2,116) = 10.19, p < .001, η2 = .15).
The ANOVA revealed no significant interaction.
State-Trait Anxiety Inventory
Segregated offender displayed significantly more state anxiety than non-
segregated offenders (F(1,58) = 8.09, p < .01, η2 = .12). Further, segregated and
non-segregated offenders displayed significantly less state anxiety across time
(F(2,116) = 7.63, p < .001, η2 = .11). The ANOVA revealed no significant
interaction.
WAIS Digit Span and Digit Symbol
Performance on the Digit Symbol improved significantly across time (F(2,116)
= 5.44, p < .01, η2 = .09). The ANOVA revealed no significant interaction.
Performance on the Digit Symbol improved significantly across time (F(2,116) =
22.56, p < .001, η2 = .28). The ANOVA revealed no significant interaction.
Segregated Offenders Who Completed Three Sessions Versus SegregatedOffenders Who Completed One or Two Sessions
It was hypothesized that offenders who remain in segregation for longer
periods of time would display more mental health and psychological functioning
problems than those who are more quickly reintegrated into the general offender
population. Therefore, using the eight measures as DVs, t-tests were performed to
evaluate whether offenders who stayed in segregation for all three sessions (n = 23)
49
differed from segregated offenders who were released or transferred after session
one or two (n = 51). True attrition cases (n = 9) were removed from the analyses
because they could have been part of the group of offenders who stayed in
segregation for all three sessions.
No significant difference was found between offenders who stayed in
segregation for all three sessions (n = 23) and segregated offenders who were
released or transferred after session one or two (n = 51).
Voluntary Versus Involuntary Cases
Using the eight measures as DVs, t-tests were completed to evaluate whether
voluntary (n = 32) and involuntary (n = 51) cases differed in mental health and
psychological functioning. Again, no significant difference was found between
voluntary and involuntary cases.
Interview Assessment
Ten-point Rating Scales
A structured interview was conducted at each session. Table 11 shows the
means and respective standard deviations at each session for the five ten-point
scale questions. The mean represents the average score on the ten-point scale
questions with one being negative and ten being positive.

50
Table 11: Session Means and Respective Standard Deviations of InterviewAssessment Questions for Segregated (n = 23) and Non-Segregated (n =37) Offenders Who Completed All Sessions (S.1,S.2, & S.3)
Means (SD)
Questions Group S.1 S.2 S.3
How are you feelingtoday?
Seg.Non-Seg.
5.5 (2.0)6.3 (2.2)
6.0 (2.3)6.4 (2.1)
5.9 (2.3)6.6 (1.8)
How important do youthink it is to havefriends?
Seg.Non-Seg.
6.4 (2.7)7.9 (2.4)
6.9 (2.5)7.9 (2.7)
6.4 (2.7)7.5 (2.9)
Do you have anyproblem with sleeping?
Seg.Non-Seg.
6.3 (2.5)4.0 (3.4)
5.0 (3.1)3.1 (2.8)
5.3 (2.7)3.1 (2.7)
Do you have anyproblem with appetite?
Seg.Non-Seg.
3.1 (2.5)2.7 (2.7)
3.6 (3.0)2.6 (2.7)
3.7 (2.9)2.6 (2.5)
Do you have anyproblem concentration?
Seg.Non-Seg.
3.6 (2.5)3.0 (2.1)
3.5 (2.8)2.9 (2.1)
3.9 (2.5)3.1 (2.4)
For each of the five questions, repeated measures univariate analyses were
performed. No main effect or interaction was found on the following four questions:
how are you feeling today?; how important you think it is to have friends?; do you
have any problem with appetite?, and; do you have any problem with concentration.
With respect to the question on sleeping, segregated offenders reported
significantly more sleeping problems that non-segregated offenders (F (1,58) =
12.64, p < .001, η2 = .18). Moreover, segregated and non-segregated offenders
reported significantly fewer problems across time (F (2,116) = 4.04, p < .05, η2 =
.07). An ANOVA revealed no significant interaction.
51
Suicide Ideation
Offenders were asked questions on suicide ideation. Offenders who
completed all three sessions (n = 60) were asked if they ever thought of committing
suicide. At session one, 40% (n = 9) of segregated and 33% (n = 12) of non-
segregated offenders responded “yes”. When asked if they ever attempted
suicide, 22% (n = 5) of segregated and 29% (n = 11) of non-segregated offenders
said “yes”.
At each session, offenders were asked if they thought of committing suicide in
the last week: 17% (n = 4) of segregated offenders answered “yes” at session one,
4% (n = 1) at session two, and 4% (n = 1) at session three. As for non-segregated
offenders, 14% (n = 5), 11%(n = 4) and 3% (n = 1) answered “yes” respectively.
Segregation Experience
Offenders who completed all three sessions (n = 60) were asked if they have
ever been placed in segregation in the past. The vast majority of segregated (96%,
n = 22) and non-segregated offenders (87%, n = 32) reported having being in
segregation before. When asked how many times they have been placed in
segregation, segregated offenders (M = 11.5) reported almost twice as many times
than non-segregated offenders (M = 6.3).

52
DISCUSSION
Generalization Issues
For several reasons, this study represents the most comprehensive
empirical review of the psychological effects of administrative segregation in
today’s Canadian federal correctional context. To begin with, this study applied the
rigour of an experimental longitudinal design to a “real” segregation environment.
Participants were actual inmates and not volunteers who agreed to be segregated
for a fixed period of time. As such, the sample included actual inmates (some with
existing psychiatric conditions and others who feared for their personal safety) who
were voluntarily or involuntarily placed for periods up to 60 days in administrative
segregation pursuant to the current administrative segregation process. They were
segregated under “real” conditions of confinement, which included partial isolation
and sensory deprivation. In addition, the participants were confronted with all of the
uncertainties surrounding their segregation, such as (a) when the segregation
period will end, (b) whether they will be transferred to another institution or returned
to the general inmate population, and (c) whether their stay in segregation will affect
their security classification, chances for parole or cell assignment. As well, some
offenders may have been confronted with correctional employees who may have a
punitive approach to managing segregated inmates. All these factors potentially
affect one’s experience of segregation and were not considered by studies using
students or inmates who voluntarily agreed to be segregated for a fixed period if
time. This study, therefore, examined the psychological effects of today’s
administrative segregation in federal corrections, and its results cannot be
construed as unrealistic extrapolations of scenarios, which are too remote from the
“real” experience.
Surprisingly, although various forms of administrative segregation have been
used for decades, if not centuries, there has been only one longitudinal study

53
previously conducted using an approximation of the empirical approach used in this
study. Weinberg (1967) assessed the effects of segregation on 20 inmates who
were involuntary placed in administrative segregation. The study, an unpublished
doctorate dissertation, was however limited to a segregation period of only five
days, and reported a 68% attrition rate among the experimental group. Again, no
other study has been completed using offenders in a “real” segregation context.
The fact that the current longitudinal study was conducted with offenders who
were subjected to “real” segregation conditions of confinement clearly enhances its
ability to be generalized. Other factors should also be considered when assessing
the issue of generalization of findings. Firstly, this study was conducted at several
sites making the findings less subject to undue influence by factors such as the
conditions of confinement, the cultural environment of a particular institution, or
specific events and incidents.
Secondly, the penitentiaries selected have historically been perceived as
some of the toughest in the country. These penitentiaries have some of the largest
segregation units and heavily rely on administrative segregation to manage their
difficult and high-risk inmate populations. It was therefore expected that segregated
offenders in those penitentiaries would be more likely to be affected by the harsher
realities of some of Canada’s toughest penitentiaries.
Thirdly, the participation rate in this study was not atypical of studies which rely
on inmates for subjects and which do not offer any incentive for participation (e.g.,
money). The true attrition rate among the segregated group was also relatively low
(10.8%) for a longitudinal study. It is important to note that none of the attrition was
attributable to offenders being incapable of participating in the study because of
high-risk of attempting to commit suicide or episodes of delusion or hallucination.
Although always a concern, the rate and nature of the attrition in this study does not
significantly undermine its ability to be generalized.

54
Fourthly, this study relied on multiple assessments of mental health and
psychological functioning of offenders (i.e., externalizing/aggression,
internalizing/interpersonal distress, psychiatric symtomatology, and cognitive
ability). This approach provided a more comprehensive assessment of potential
psychological effects of administrative segregation, and is consistent with preferred
contemporary psychological and psychiatric assessment practices (DSM-IV, 1994).
For example, Zamble (1992) argues that a variety of measures of behaviours,
cognitions and emotional experiences are needed to assess coping. Neglecting to
rely on such a wide spectrum of measures may result in a failure to detect significant
psychological effects.
Finally, non-segregated offenders scored significantly higher on a measure of
impression management than segregated offenders. Arguably, since segregated
offenders did not show significant signs of mental health and psychological
deterioration and were more accurate in their responses than non-segregated
offenders, the results of this study are more convincing.
The above mentioned factors enhance the level of confidence in the results of
this research. However, there are clear limitations to this study, which may reduce
the generalizability of the findings. Firstly, a large number of offenders in both
segregated (96%) and non-segregated (87%) groups had previously experienced
segregation. Secondly, the findings are limited to 60 days in administrative
segregation, and any extrapolation to lengthier stays would be inappropriate. It is
important to note however that statistical data collected by the Correctional Service
of Canada (Laplante, 1998) indicate that during the period of June 1997 to May
1998, 93% of involuntary cases and 69% of voluntary cases were released prior to
the 60 day regional review. This fact suggests that a majority of offenders are
segregated for periods of less than 60 days; therefore, the findings of this study are
very relevant to the Canadian federal context. Although not examined in this study, it

55
is also relevant to note that 60 days in segregation is twice the maximum length of
time that can be legally imposed for serious disciplinary infractions in Canadian
federal penitentiaries.
Thirdly, as stated above, the three penitentiaries selected in this study are
among the toughest medium and maximum-security institutions in the country.
These penitentiaries rely heavily on administration segregation to control their
inmate populations, which are composed of high-risk and high-need federally
sentenced offenders. The results of this study should be limited to such inmate
populations. Further, the findings of this study may be less applicable to other
jurisdictions, such as the United States, in which segregated offenders typically
remain in administrative or disciplinary segregation for much longer periods of time,
and often under harsher conditions of confinement (Coyle, 1987; Dowker & Good,
1993; Immarigeon, 1992; Korn, 1988).
Finally, it would also be inappropriate to extend the findings of this study to
aboriginal (Bertrand, 1996) and women offenders (Korn, 1988). The realities and
experiences of women and aboriginal offenders may affect their ability to adapt and
cope with segregation. It is hoped that current initiatives undertaken by the
Correctional Service of Canada will provide information on the psychological effects
of segregation with these offenders.

56
Personality
It was expected that certain personality types would react to the segregation
experience differently. Although no deterioration was found, differences in
personality between segregated and non-segregated offenders were found. These
differences have been suggested in the PC and segregation literature, but have
seldom been assessed using standardized measures, such as the NEO Personality
Inventory (Gendreau, Tellier, & Wormith, 1985; Hodgins & Cote, 1991; Rold, 1992).
The NEO was developed to operationalize the five-factor model of personality,
a representation of the structure of traits developed over the last forty years
(Digman, 1990). Costa and McRae (1990) found that since 1985, research using
the NEO has demonstrated that the five factors can account for the major
dimensions in personality questionnaires designed to measure, inter alia, the DSM-
III-R personality disorders. Segregated offenders were found to score higher on
Neuroticism (N) than non-segregated offenders. Costa and McCrae (1992)
explained that “the general tendency to experience negative affects such as fear,
sadness, embarrassment, anger, guilt, and disgust is the core of the N domain” (p.
14). They also suggest that neurotic individuals tend to cope more poorly with
stress than others. Although segregated offenders were found to score higher on
Neuroticism and may, therefore, be ill equipped to cope with the stress associated
with segregation, the findings of this study suggest that they nonetheless adapted
and coped well with the segregation experience.
Segregated offenders scored significantly lower on Extraversion (i.e., less
sociable, likely to prefer large groups, assertive, active and less talkative),
Openness (i.e., less active imagination, sensitivity, attentiveness to inner feelings,
intellectual curiosity, and independence of judgment), Agreeableness (i.e., less
altruistic and sympathetic to others and eager to help them, and more egocentric,

57
skeptical of others’ intentions, and competitive rather than cooperative), and
Conscientiousness (i.e., less strong-willed and determined) than non-segregated
offenders. Arguably, these trait patterns depict individuals, which have personalities
that may bring them at odds with non-segregated offenders as well as correctional
staff. The general inmate population may not tolerate offenders with such
personality patterns. Due to their lack of assertiveness, general tendency to
experience negative affects, and overall poorer mental health and psychological
functioning, segregated offenders may be more easily victimized or less apt at
adapting and coping with prison life.
Psychological Effects
Overall, both segregated and non-segregated offenders reported better
mental health and psychological functioning over time. This finding is common in
studies which rely on repeated-measures designs and has been primarily attributed
to practice effects (Pedhazur, 1982). For example, Zamble (1992) found that
offenders’ emotional states generally improve over time. Participants lose interest
in answering repeatedly to identical questions and tend to report less problems
overtime.
Although there is an alternative explanation to account for these overall
improvements in mental health and psychological functioning, it is less plausible. It
is unlikely that these improvements in both segregated and non-segregated groups
were attributable to significant events, which occurred in all three penitentiaries.
During the eight-month data collection phase, research assistants could not identify
any event which could have had positively affected prison life for both segregated
and non-segregated offenders and account for the overall improvements.
Therefore, the improvements in mental health and psychological functioning of both
segregated and non-segregated offenders should be viewed as artifacts of
repeated testing.

58
It was hypothesized that as a group segregated offenders overall would report
greater mental health and psychological functioning problems than non-segregated
offenders. This hypothesis was supported by the fact that segregated offenders
indicated significantly more internalized problems, interpersonal distress and
psychiatric symptoms than non-segregated offenders. Segregated offenders also
displayed significantly more depressive symptoms, problems in psychosocial
adjustment, and transient anxiety than non-segregated offenders. These results are
consistent with many cross-sectional and qualitative studies (Brodsky & Scogin,
1988; Grassian 1983; Hodgins & Cote, 1991; Wormith, Tellier & Gendreau, 1988;
Rold, 1992). It is important to reaffirm that these between group differences may
not be attributed to placement in administrative segregation.
The most important questions raised in this study were whether the poor
mental heath of segregated offenders was attributable to segregation or whether
segregated inmates already were of poorer mental heath prior to their segregation.
The hypothesis that the mental health and psychological functioning of segregated
inmates would deteriorate over a period of 60 days in segregation was not
supported. The ANOVAs performed on each of the eight measures did not reveal
any deterioration. These results can be interpreted in two ways: (a) segregated
offenders generally adapted and coped well with the conditions of today’s Canadian
federal administrative segregation; or (b) the segregated inmates did not perceive
the conditions of their confinement as threatening or stressful and therefore were not
affected by them.
On one hand, there is no shortage of researchers, ourselves included, who
have observed or reacted strongly to the conditions of confinement of segregated
inmates (e.g., 23 out of 24 hours of cell confinement, small yard size, lack of
programs and services, constant state of idleness, etc.). However, on the other
hand, other researchers have commented on all the distractions, programs and

59
services that are available in segregation units in Canadian penitentiaries (e.g., TV,
radios, books, computers, exercise period often with the company of other
offenders; Suedfeld et al., 1982). Moreover, the Task Force Reviewing
Administrative Segregation (Kane, 1997) was confronted with many correctional
staff who thought segregation units were “too comfortable” for offenders. They often
suggested, contrary to current legal and policy provisions, that the conditions of
confinement should be made more harsh in order to discourage offenders from
requesting segregation and to provide an “incentive” for segregated inmates to
reintegrate into the general inmate population.
Another explanation to account for these results could be that the
environment that offenders were in before segregation was such that it was viewed
more negatively than the conditions of confinement in segregation. If that is the
case, it suggests that the correctional authorities must take further steps to ensure
that the general inmate population is safe and secure.
Nonetheless, regardless of the possible explanations to account for the lack
of deterioration, this study is somewhat encouraging because it provides evidence
that segregation for 60 days as currently administered in Canadian penitentiaries
does not negatively affect offenders’ mental health and psychological functioning.
In sum, analogous to the effects of administrative segregation, Zamble and his
colleagues have repeatedly found that psychological functioning was remarkably
stable over time in prison, and that contrary to the expectations of proponents of the
prisonization theory, marked psychological deterioration is not a necessary
consequence of long term imprisonment (Zamble, 1992; Zamble & Porporino,
1988, 1990; Zamble, Porporino, & Kalotay, 1984). Perhaps what Zamble and his
colleagues have characterized as “the deep freeze” (Zamble 1992; Zamble &

60
Porporino, 1988, 1990) is also an appropriate description of what typically happens
to inmates placed in administrative segregation for periods of up to 60 days.
Policy Issues
It was anticipated that this research would have important policy implications
in areas such as: (a) the level and frequency of monitoring and assessment required
for inmates in segregation (mandatory vs. upon request); (b) programming to
reduce mental health deterioration (the need for, and type of, intervention
programs); and (c) the adequacy of current assessment strategies (what aspects of
psychosocial functioning are important to assess, and which are less impacted by
segregation). Since detrimental effects were not found, the policy implications are
somewhat less significant than anticipated .
First, with regard to monitoring and assessment of segregated offenders,
psychologists are required by policy to assess segregated offenders every 30 days,
and health care workers and wardens are required to make daily visits to
segregation units. Although this study revealed no evidence of detrimental effects,
the 30-day requirement should be preserved, as well as the daily visits by health
care workers and wardens. Arguably, reducing the few contacts segregated
offenders currently enjoy could have negative consequences. It could be that regular
contact itself is an important factor reducing the likelihood of deterioration.
Moreover, this research only suggests that the possibility of negative effects is likely
to be an exception rather than the norm. Since the findings of this study do not
preclude in any way the possibility that some offenders may in fact be negatively
affected by segregation, close monitoring should continue.
Due to their overall poorer mental health and psychological functioning, it
may be appropriate as a “best practice” for psychologists to meet with all offenders

61
placed in segregation. This could serve to establish a baseline for subsequent
evaluations of mental health and psychological deterioration and to provide support
for segregated inmates at times of crisis. In addition, since segregated offenders
were found to have poorer mental health and psychological functioning, employees
working with segregated offenders may benefit from special training on mental
health issues.
Interestingly, the 30-day policy requirement also stipulates that psychologists
must assess “inmates’ capacity to remain in segregation”. This criterion implicitly
demands that psychologists predict future mental health deterioration. The findings
of this research, as well as the existing literature on segregation, do not provide any
information on what should be assessed or relied upon when making such a
prediction. In fact, making such a prediction with any reasonable degree of
accuracy may well be impossible at this time. The policy criterion is unrealistic and
it may be more appropriate to limit the assessment of segregated inmates to their
current mental health and psychological functioning.
Second, it was expected that this research would provide specific areas of
mental health and psychological functioning which needed particular attention when
conducting assessment and monitoring of segregated offenders. But again, since
this study did not detect detrimental effects, little can be said in the way of policy on
what aspects of mental health and psychological functioning should be carefully
scrutinized. However, some general comments can be made regarding
psychological assessments.
Currently, psychologists utilize a standard form which highlights general
mental health issues (e.g., risk of suicidal or self-injury, depression, anxiety,
aggression, psychosis, mania) when completing their 30-day assessments.
However, how to assess each component is left to the psychologist’s discretion.
Typically, psychologists conduct a brief semi-structured interview with the

62
segregated offender. It may be appropriate as a “best practice” to conduct more
elaborate assessment procedures to ensure that minor or perhaps less obvious
deterioration can be detected and documented.
Finally, the findings of this study have programming implications for
segregated offenders. Andrews, Zinger, Hoge, Bonta, Gendreau, and Cullen
(1990) performed a meta-analysis, which is a quantitative and objective review of
primary research (Cook & Leviton, 1980), on the effectiveness of correctional
programs. They found that treatment programs conducted in accordance with the
following three empirically-based clinical principles of successful rehabilitation
(Andrews, Bonta & Hoge, 1990) significantly reduced recidivism rates: the risk
principle, the need principle, and the responsivity principle. The risk principle
involves matching levels of treatment with the risk level of the offender. Higher risk
cases should receive more intensive services whereas lower risk cases should
receive minimal services. Since segregated offenders were found to be higher risk
cases than non-segregated offenders, programs delivered to segregated offenders
should be intensive to maximize success.
The second principle, the need principle, requires programs, which are
intended to reduce recidivism to target empirically based correlates of criminal
behaviour. Andrews and Bonta (1994) have emphasized the importance of
targeting variables such as antisocial attitudes, pro-criminal associates, and
temperamental and personality factors. Although the primary concern with providing
programs to segregated offenders is to facilitate their reintegration into the general
inmate population, if such reintegration cannot occur quickly, intensive treatment
programs that target variables that are known to be linked to criminal conduct
should be introduced.
Lastly, the responsivity principle refers to the delivery of programs in a style
and mode consistent with the learning ability and learning style of the offender

63
(Andrews & Bonta, 1994). Social learning and cognitive-behavioral approaches
have been identified as the approaches, which best reduce recidivism. Andrews et
al. (1990) has demonstrated that these approaches have consistently generated
better results. The distinct personality patterns of segregated offenders may be
important to consider and assess when delivering treatment programs to them.
Future Direction and Conclusion
Because this study is one of the very few empirical longitudinal studies which
has evaluated the effects of segregation, additional research is obviously needed.
On a personal note, it is easy to understand why so little research of this kind has
been completed. It is costly, time consuming and requires a great deal of
dedication and collaboration from various actors. Support from the correctional
authorities is required, and data collection necessitates a great deal of support from
research assistants, psychologists, wardens, segregation unit managers and staff.
Moreover, segregation units have typically insufficient interview and hearing rooms
to accommodate everyone, let alone researchers. Segregation Review Boards,
Independent Chairpersons and the National Parole Board often rely on space
available in segregation units to hold hearings; psychologists need to conduct
psychological assessments; parole officers (i.e., case management officers) are
required to meet with segregated offenders to, inter alia, update correctional plans;
and, lawyers must occasionally meet with segregated offenders. As well, staff
managing segregation units need to ensure that segregated offenders get their
showers and daily hour of exercise. This may seen trivial, but with limited staff
managing large segregation units which house many “incompatible” offenders and
which only possess one or two exercise yards and shower facilities, the level of
activities in segregation units is surprising. Working around these priorities and
under strict and elaborate security protocols makes this type of research venture
quite difficult. To conduct further research in this area, correctional authorities

64
should encourage their psychologists, who are already required to monitor and
assess segregated offenders, to perform additional research. Correctional
psychologists could easily conduct longitudinal segregation research if correctional
authorities provide them with opportunities to pursue their research interest and
some resources. A decentralized operational research function brings great
benefits to correctional authorities.
It is obvious that research evaluating the effects of segregation beyond 60
days is also needed. Once again, it would be ill advised to attempt to extrapolate
the findings of this study (a) beyond 60 days of administrative segregation, and (2)
to other jurisdictions. For example, the findings of this study are somewhat
irrelevant to current segregation practices in the United States where offenders can
be segregated for years for disciplinary infractions with virtually no distractions,
human contacts, services or programs.
The difference between the personality of segregated and non-segregated
offenders is an important finding. Although many have suggested that segregated
offenders’ psychological weaknesses and idiosyncratic behaviours were not well
tolerated by the general inmate population (Carriere, 1989; Gendreau, Tellier, &
Wormith, 1985; Rold, 1992; Wormith, Tellier, & Gendreau, 1988); the personality of
segregated offenders had seldom been assessed. Whether a distinct personality
profile may increase an offender’s risk of being placed in administrative
segregation should be further examined using more comprehensive measures of
personality.
Although this research revealed no evidence that administrative segregation
for periods of up to 60 days was damaging, the findings of this study should not be
used to legitimize the practice of administrative segregation. As Johnston and Toch
(1983) have remarked, “science is a hard game to play where policy implications
are immediate and where we are concerned about the consequences of our

65
findings” (p. 16). Administrative segregation remains a management tool, which
are grossly overused in Canadian penitentiaries. Regardless of whether offenders
adapt and cope well with the segregation experience, it is not healthy for anyone to
idle aimlessly in a cell for 23 out of 24 hours a day; it simply is not a constructive way
of serving a sentence; and, it is likely to impede attempts to rehabilitate and safely
reintegrate offenders into society.
Although it will always remain a legitimate management tool to effectively
deal with problematic situations and individuals, its current use is perhaps
symptomatic of the Correctional Service Canada’s inability to reduce tensions and
resolve conflicts in the prison context. Administrative segregation has clearly
become the number one way of managing inmates and “doing business”. Laplante
(1998) reported that during the period between June 1, 1997 and May 31, 1998, out
of an inmate population that averaged 13,504 offenders, 6,848 placements in
administrative segregation took place. Of these, 2534 (37%) offenders were
placed in segregation more than once during that same period, and a staggering
4314 (63%) offenders were new placements. Such high reliance needs to be
carefully examined. Moreover, the costs associated with processing these
offenders in accordance to due process requirement are extraordinary (i.e.,
paperwork, enhanced security and staffing, and reviews by wardens, Segregation
Review Boards and Regional Headquarters, etc.). It is time to rethink conflict
resolution in Canada’s penitentiaries.
Implementing alternative/appropriate dispute resolution processes on a large
scale is the most promising initiative to reduce the disproportionate number of
segregation cells and units in Canada’s federal correctional system. Providing the
tools to resolve conflicts and fostering a correctional environment respectful of
human rights is the only way to breakdown this over-reliance on administrative
segregation for managing offenders. Breaking the vicious cycle of relying on

66
administrative segregation to reduce tensions and resolve conflicts should be the
number one priority for the Correctional Service of Canada.

67
REFERENCES
Andrews, D.A., & Bonta, J. (1994). The Psychology of Criminal Conduct.Cincinnati: Anderson Publishing.
Andrews, D.A., Bonta, J., & Hoge (1990). Classification for effectiverehabilitation: Rediscovering psychology. Criminal Justice and Behavior, 17, 19-52.
Andrews, D.A., Zinger, I., Hoge, R.D., Bonta, J., Gendreau, P., & Cullen, F.T.(1990). Does correctional treatment work? A psychologically informed meta-analysis. Criminology, 28, 369-404.
Arbour L. (Commissioner), Commission of Inquiry into Certain Events atPrison for Women in Kingston (Ottawa: Queen’s printer, April 1996).
Archer, J., Kilpatrick, G., & Bramwell, R. (1995). Comparison of twoaggression inventories. Aggressive Behavior, 21, 371-380.
Barak-Glantz, I.L. (1983). Who’s in the “hole”? Criminal Justice Review, 8,29-37.
Beck, A. T., & Beamesdorfer, A. (1974). Assessment of depression: Thedepression inventory. Modern Problems in Pharmacopsychiatry, 7, 151-169.
Beck, A. T., & Beck, R. W. (1972). Screening depressed patients in familypractice: A rapid technique. Postgraduate Medicine, 52, 81-85.
Beck, A. T., Rial, W. Y., & Rickles, K. (1974). Short form of depressioninventory: Cross-validation. Psychological Reports, 34, 1184-1186.
Beck, A. T., & Steer, R. A. (1988). Manual for the Beck Hopelessness Scale.New York: Psychological Corporation.
Beck, A. T., Steer, R. A., & Shaw, B. F. (1984). Hopelessness in an alcohol-and heroin-dependant women. Journal of Clinical Psychology, 40, 602-606.
Beck, A. T., Weissman, A., Lester, D., & Trexler, L. (1974). The measurementof pessimism: The Hopelessness Scale. Journal of Consulting and ClinicalPsychology, 42, 861-865.
68
Benjamin, T.B., & Lux, K. (1977). Solitary confinement as punishment.California Western Law Review, 13, 265-296.
Benjamin, T.B., & Lux, K. (1975). Constitutional and psychologicalimplications of the use of solitary confinement: Experience at the Maine StatePrison. Clearinghouse Review, 9, 83-90.
Bertrand, M.-A. (1996). Women in prison, a comparative study. CaribbeanJournal of Criminology and Social Psychology, 1(1), 38-58.
Bexton, W.H., Heron W., & Scott, T.H. (1954). Effects of decreased variationin the sensory environment. Canadian Journal of Psychology, 8, 70-76.
Birkinshaw, P. (1981). The control unit regime: Law and order in prison.Howard Journal, 20, 69-80.
Bonta, J., Harman, W.G., Hann, R.G., & Cormier, R.B. (1996). The predictionof recidivism among federally sentenced offenders: A re-validation of the SIR scale.Canadian Journal of Criminology, Jan., 61-79.
Bonta, J., Pang, B., & Wallace-Capretta, S. (1995). Predictors of recidivismamong incarcerated female offenders. Prison Journal, 75:3, 277-294.
Bonta, J., & Gendreau, P. (1995). Reexamining the cruel and unusualpunishment of prison life. In T.J. Flanagan (Ed.), Long-term Imprisonment: Policy,Science, and Correctional Practice (pp. 75-94). Thousand Oaks, CA: Sage.
Boulet, J., & Boss, M. W. (1991). Reliability and validity of the Brief SymptomInventory. Psychological Assessment, 3, 433-437.
Broday, S. F., & Mason, J. L. (1991). Internal consistency of the BriefSymptom Inventory for counseling-center clients. Psychological Reports, 68, 94.
Brodsky, S.L., & Scogin, F.R. (1988). Offenders in protective custody: Firstdata on emotional effects. Forensic Reports, 1, 267-280.
Buss, A. H., & Perry, M. (1992). The aggression questionnaire. Journal ofPersonality and Social Psychology, 63, 452-459.
Carriere, K.D. (1989). Protective custody in Canada: A review of researchand policy responses. Canadian Criminology Forum, 10, 17-25.

69
Coleman, E., Cesnik, J., Moore, A. M., & Dwyer, S. M. (1992). Exploratorystudy of the role of psychotropic medications in the treatment of sex offenders.Journal of Offender Rehabilitation, 18 (3-4), 75-88.
Costa, P. T., Jr., & McCrae, R. R. (1989). The NEO-PI/NEO-FFI ManualSupplement. Odessa, FL: Psychological Assessment Resources.
Costa, P. T., Jr., & McCrae, R. R. (1990). Personality disorders and the five-factor model of personality. Journal of Personality Disorders, 4, 362-371.
Costa, P. T., Jr., & McCrae, R. R. (1992). Revised NEO PersonalityInventory and NEO Five-factor Inventory Professional Manual. Odessa, FL:Psychological Assessment Resources.
Coyle, A.G. (1987). The management of dangerous and difficult prisoners.Howard Journal, 26, 139-152.
Day, A. (1993). Brief prescriptive psychotherapy for depression with anincarcerated young offender. Journal of Offender Rehabilitation, 19 (1-2), 75-87.
Derogatis, L. R. (1992). The Brief Symptom Inventory (BSI): Administration,Scoring, and Procedures Manual II. Towson, MD: Clinical PsychometricsResearch.
Derogatis, L. R., & Melisaratos, N. (1983). The Brief Symptom Inventory: Anintroductory report. Psychological Medicine, 13, 596-605.
Derogatis, L. R., & Meyer, J. K. (1979). A psychological profile of the sexualdysfunctions. Archives of Sexual Behavior, 8, 201-223.
Derogatis, L. R. (1975). Brief Symptom Inventory. Baltimore: ClinicalPsychometric Research.
Diagnostic and Statistical Manual of Mental Disorders (1994). (Washington:American Psychiatric Association).
Digman, J.M. (1990). Personality structure: Emergence of the five-factormodel. Annual Review of Psychology, 41, 417-440.
Dowker, F., & Good, G. (1993). The proliferation of control unit prisons in theUnited States. Journal of Prisoners on Prisons, 4, 95-110.

70
Dutton, D. G., & Hemphill, K. J. (1992). Patterns of socially desirableresponding among perpetrators and victims of wife assault. Violence and Victims,7, 29-39.
Ecclestone, C.E.J., Gendreau, P., & Knox, C. (1974). Solitary confinement ofprisoners: An assessment of its effects on offenders’ personal constructs andandrenocortical activity. Canadian Journal of Behavioral Science, 6, 178-191.
Ellis, J. (1993). Security officer’s role in reducing offender problem behaviors.Journal of Offender Rehabilitation, 20, 61-72.
Eyestone, L. L., & Howell, R. J. (1994). An epidemiological study of attention-deficit hyperactivity disorder and major depression in a male prison population.Bulletin of the American Academy of Psychiatry and the Law, 22, 181-193.
Foelker, G. A., Shewchuk, R. M., Niederehe, G. (1987). Confirmatory factoranalysis of the short form Beck Depression Inventory in elderly community samples.Journal of Clinical Psychology, 43, 111-118.
Fowles, G. P., & Tunick, R. H. (1986). WAIS-R and Shipley estimated IQcorrelations. Journal of Clinical Psychology, 42, 647-649.
Frisch, M. B., & Jessop, N. S. (1989). Improving WAIS-R estimates with theShipley-Hartford and Wonderlic Personell Tests: Need to control for reading ability.Psychological Reports, 65, 923-928
Frost, R. O., Krause, M. S., & Steketee, G. (1996). Hoarding and obsessive-compulsive symptoms. Behavior Modification, 20, 116-132.
Gavazzi, S. M., Julian, T. W., & McKenry, P. C. (1996). Utilzation of the BriefSymptom Inventory to discriminate between violent and nonviolent male relationshippartners. Psychological Reports, 79, 1047-1056.
Gendreau, P., & Bonta, J. (1984). Solitary confinement is not cruel andunusual punishment: People sometimes are! Canadian Journal of Criminology,26, 467-478.
Gendreau, P.E., Freedman, N., Wilde, G.J.S., & Scott, G.D. (1968a).Stimulation seeking after seven days of perceptual deprivation. Perceptual andMotor Skills, 26, 547-550.
Gendreau, P.E., Freedman, N., Wilde, G.J.S., & Scott, G.D. (1972). Changesin EEG alpha frequency and evoked response latency during solitary confinement.Abnormal Psychology, 79, 54-59.

71
Gendreau, P.E., Horton, J.G., Hooper, D.G., Freedman, G.J.S., & Scott, G.D.(1968b). Perceptual deprivation and perceptual skills: Some methodologicalconsiderations. Perceptual and Motor Skills, 27, 57-58.
Gendreau, P., McLean, R., Parsons, T., Drake, R., & Ecclestone, J. (1970).Effect of two days’ monotonous confinement on conditioned eyelid frequency andtopography. Perceptual and Motor Skills, 31, 291-293.
Gendreau, P., Tellier, M.-C., & Wormith, J.S. (1985). Protective custody: Theemerging crisis within our prisons. Federal Probation, 44, 55-63.
Gould, J. (1982). A psychometric investigation on the standard and short fromBeck Depression Inventory. Psychological Reports, 5, 1167-1170.
Grassian, S. (1983). Psychopathological effects of solitary confinement.American Journal of Psychiatry, 140, 1450-1454.
Gudjonsson, G. H. (1984). Attribution of blame for criminal acts and itsrelationship with personality. Personality and Individual Differences, 5, 53-58.
Haney, C. (1993). “Infamous punishment”: The psychological consequencesof isolation. National Prison Project Journal, 8, 3-7, 21.
Hann, R., & Harman, W. (1989). Release Risk Prediction: A Test of theNuffield Scoring System for Native and Female Offenders. Ottawa: Ministry of theSolicitor General of Canada.
Heinemann, A. W., Harper, R. G., Friedman, L. C., & Whitney, J. (1985). Therelative utility of the Shipley-Hartford Scale: Prediction of WAIS-R IQ. Journal ofClinical Psychology, 41, 547-551.
Hodgins, S., & Cote, G. (1991). The mental health of penitentiary offenders inisolation. Canadian Journal of Criminology, 33, 175-182.
Holden, R. R. (1991, June). Psychometric properties of the HoldenPsychological Screening Inventory (HPSI). Paper presented at the annualconvention of the Canadian Psychological Association, Calgary.
Holden, R. R. (1992). Associations between the Holden PsychologicalScreening Inventory and the NEO Five Factor Inventory in a non-clinical sample.Psychological Reports, 71, 1039-1042.

72
Holden, R. R., & Fekken, G. C. (1994). The NEO five factor inventory in aCanadian context: Psychometric properties for a sample of university women.Personality and Individual Differences, 17, 441-444.
Holden, R. R. , & Grigoriadis, S. (1995). Psychometric properties of theHolden Psychological Screening Inventory for a psychiatric offender sample.Journal of Clinical Psychology, 51, 811-819.
Holden, R. R., Mendonca, J. D., Mazmanian, D., & Reddon, J. R. (1992).Clinical construct validity of the Holden Psychological Screening Inventory (HPSI).Journal of Clinical Psychology, 48, 627- 633.
Hooper, F. A., & Evans, R. G. (1984). Screening for disruptive behavior ofinstitutionalized juvenile delinquents. Journal of Personality Assessment, 48, 159-161.
Immarigeon, R. (1992). The marionization of American prisons. NationalPrison Project Journal, 7, 1-5.
Ingram, J. C. et al., (1985). Recidivism, perceived problem-solving abilities,MMPI chars, and violence: A study of Black and White incarcerated male adultoffenders. Journal of Clinical Psychology, 41, 425-432.
Ivanoff, A., & Jang, S. J. (1991). The role of hopelessness and socialdesirability in predicting suicidal behavior: A study of prison offenders. Journal ofConsulting and Clinical Psychology, 59, 394-399.
Jackson, M. (1988). Justice behind the Walls: A Report of the Canadian BarAssociation Committee on Imprisonment and Release. Ottawa: Canadian BarAssociation.
Jackson, M. (1983). Prisoners of isolation: Solitary confinement in Canada.Toronto: University of Toronto Press.
Johnson, R., & Toch, H. (1983). Introduction. In R. Johnson, & H. Toch. ThePains of Imprisonment. Beverly Hills: Sage Publications.
Kane, D. (Chair) (1997). Commitment to Legal Compliance, Fair Decisionsand Effective Results. Ottawa: Correctional Service Canada.
Knight, R. G., Waal-Manning, H. J., & Spears, G. F. (1983). Some norms andreliability data for the State-Trait Anxiety Inventory and the Zung Self-RatingDepression Scale. British Journal of Clinical Psychology, 22, 245-249.

73
Korn (1988). The effects of confinement in the high security unit at Lexington.Social Justice, 15(1), 1-20.
Kroner, D. G., & Weekes, J. R. (1996). Balanced Inventory of DesirableResponding: Factor structure, reliability, and validity with an offender sample.Personality and Individual Differences, 21, 323-333.
Laplante, J. (September, 1998). Paper presented at the Conference entitledThe Reasonable Alternative. Kingston: Correctional service of Canada.
Leahne, G. K. (1994). The NEO-PI and the MCMI in the forensic evaluation ofsex offenders. In P. T. Costa and T. A. Widiger (Eds.), Personality Disorders andthe Five-factor Model of Personality (pp. 175-188). Washington, DC: AmericanPsychological Association.
Leahy, J. M. (1992). Validity and reliability of the Beck Depression Inventory-short form in a group of adult bereaved females. Journal of Clinical Psychology,48, 64-68.
Lennings, C. J. (1992). Suicide and time perspective: An examination ofBeck and Yufit’s suicide-risk indicators. Journal of Clinical Psychology, 48, 510-516.
Luise (1989). Solitary confinement: Legal and psychological considerations.Criminal and Civil Confinement, 15, 301-324.
Lutz, S. J. (1990). Effect of relaxation training on sleep, state anxiety and, andsick call in a jail population. Journal of Prison and Jail Health, 9, 55-71.
Matreau, T. M., & Bekker, H. (1992). The development of a six-item short-formof the state scale of the Spielberger State-Trait Anxiety Inventory (STAI). BritishJournal of Clinical Psychology, 31, 301-306.
McGuire, J., Broomfield, D., Robinson, C., & Rowson, B. (1995). Short-termeffects on probation programs: An evaluative study. International Journal ofOffender Therapy and Comparative Criminology, 39, 23-42.
Metzger, R. L. (1976). A reliability and validity study of the State-Trait AnxietyInventory. Journal of Clinical Psychology, 32, 276-278.
Miller, H. A. (1994). Reexamining psychological distress in the currentconsitions of segregation. Journal of Correctional Health Care, 1, 39-53.
74
Miller, H. A., & Young, G.R. (1997). Prison segregation: administrativedetention remedy or mental health problem. Criminal Behaviour and MentalHealth, 7, 85-94.
Motiuk, L.L., & Blanchette, K. (1997). Case Characteristics of SegregatedOffenders in Federal Corrections. Ottawa, ON: Correctional Service of Canada.
Motiuk, L.L., & Porporino, F. (1989). Offender Risk/needs Assessment: AStudy of Conditional Releases. Ottawa, ON: Correctional Service of Canada.
Nielson, A. C., & Williams, T. W. (1980). Depression in ambulatory medicalpatients: Prevalence by self-report questionnaire and recognition by nonpsychiatricphysicians. Archives of General Psychiatry, 37, 399.
Nixon, G. F., & Steffeck, J. C. (1977). Reliability of the state-trait anxietyinventory. Psychological Reports, 40, 357-358.
Novy, D. M., Nelson, D. V., Goodwin, J., & Rowzee, D. (1993). Psychometriccomparability of the State-trait anxiety inventory for different ethnic subpopulations.Psychological Assessment, 5, 343-349.
Osman, A., Barrios, F. X., Aukes, D., Osman, J. R., & Markway, K. (1993).The Beck Anxiety Inventoyr: Psychometric properties in a community population.Journal of Psychopathology and Behavioral Assessment, 15, 287-297.
Osman, A., Besett, T. M., Osman, J. R., Troutman, J. A., & Grittman, L. (1995).Systematic evaluation of psychometric properties of the Cognition Checklist withcollege students. Psychological Reports, 76, 523-528.
Paulhus, D. L. (1984). Two-component models of socially desirableresponding. Journal of Personality and Social Psychology, 46, 598-609.
Pedhazur, E.J. (1982). Multiple Regression in Behavioral Research. NewYork: Harcourt Brace College Publishers.
Piersma, H. L., Reaume, W. M., & Boes, J. L. (1994). The Brief SymptomInventory (BSI) as an outcome measure for adult psychiatric inpatients. Journal ofClinical Psychology, 50, 555-563.
Pierson, T.A. (1988). Use of protective custody: How different systemsrespond. Corrections Today, 50, 150, 152, 154.
75
Power, K. G., & Beveridge, L. (1990). The effects of custody in a Scottishdetention centre on offenders’ self-esteem. International Journal of OffenderTherapy and Comparative Criminology, 34(3), 177-186.
Reddon, J. R., Pope, G. A., Friel, J. P., Sinha, B. K. (1996). Leisuremotivation in relation to psychosocial adjustment and personality in young offendersand high school samples. Journal of Clinical Psychology, 52, 679-685.
Retzlaff, P., Slicner, N., & Gibertini, M. (1986). Predicting WAIS-R scoresfrom the Shipley Institute of Living Scale in a homogeneous sample. Journal ofClinical Psychology, 42, 357-359.
Reynolds, W. M., & Gould, J. W. (1981). A psychometric investigation of thestandard and short form Beck Depression Inventory. Journal of Consulting andClinical Psychology, 49, 306-307.
Rold, W.J. (1992). Consideration of mental health factors in offenderdiscipline. Journal of Prison and Jail Health, 11, 41-49.
Ruiz, R. A., & Krauss, H. H. (1967). Test-retest reliability and practice effectwith the Shipley-Institute of Living Scale. Psychological Reports, 20, 1085-1086.
Russell, G. W. (1995). Personalities in the crowd: Those who would escalatea sports riot. Aggressive Behavior, 21, 91-100.
Russell, G. W., & Arms, R. L. (1995). False consensus effects, physicalaggression, anger, and willingness to escalate a disturbance. AggressiveBehavior, 21, 381-386.
Scogin, F., Beutler, L., Corbishley, A., & Hamblin, D. (1988). Reliability andvalidity of the short form Beck Depression Inventory with older adults. Journal ofClinical Psychology, 44, 853-856.
Scott, G.D., & Gendreau, P. (1969). Psychiatric implications of sensorydeprivation a maximum security prison. Canadian Psychiatric AssociationJournal, 14, 337-340.
Segal, B, Hobfoll, S. S., & Cromer, F. (1984). Alcohol use by juvenileoffenders. International Journal of the Addictions, 19, 541-549.
Sheldon, K. M. (1994). Emotionality differences between artists andscientists. Journal of Research in Personality, 28, 481-491.

76
Shipley, W. C. (1940). A self-administering scale for measuring intellectualimpairment and deterioration. Journal of Psychology, 9, 371-377.
Singer, M. I., Bussey, J., Song, L. Y., & Lunghofer, L. (1995). Thepsychological issues of women serving time in jail. Social Work, 40, 103-113.
Smyth, N. J., Ivanoff, A., & Jang, S. J. (1994). Changes in psychologicalmaladaptation among offender parasuicides. Criminal Justice and Behavior, 21,357-365.
Spielberger, C. D. (1983). Manual for the State-Trait Anxiety Inventory STAI(Form Y). Palo Alto, CA: Consulting Psychologist Press.
Steer, R. A., Beck, A. T., Brown, G. K., & Beck, J. S. (1993). Classification ofsuicidal and nonsuicidal outpatients: A cluster-analytic approach. Journal of ClinicalPsychology, 49, 603-614.
Stukenberg, K. W., Dura, J. R., & Kiecolt-Glaser, J. K. (1990). Depressionscreening scale validation in an elderly, community dwelling population.Psychological Assessment, 2, 134-138.
Suedfeld, P., Ramirez, C, Deaton, J., & Baker-Brown, G. (1982). Reactionsand attributes of prisoners in solitary confinement. Criminal Justice and Behavior,9:3, 303-340.
Sutker, P. B., & Moan, C. E. (1973). Prediction of socially maladaptivebehavior within a state prison system. Journal of Community Psychology, 1, 74-78.
Tellier, C., Wormith, S., & Gendreau, P. (1989). Protective Custody: TheEmerging Crisis Within the Prison System (Working Paper). Ottawa: SolicitorGeneral Canada.
Toch, H. (1992). Living in Prison: The Ecology of Survival. Washington:American Psychological Association.
Vantour, J.A. (1975). Report of the Study Group on Dissociation. Ottawa:Solicitor General Canada.
Verkasalo, M., & Lindeman, M. (1994). Personal ideals and socially desirableresponding. European Journal of Personality, 8, 385-393.

77
Volk, R. J., Pace, T. M., & Parchman, M. L. (1993). Screening for depressionin primary care patients: Dimensionality of the short form of the Beck DepressionInventory. Psychological Assessment, 5, 173-181.
Vredenberg, K., Krames, L., & Flett, G. L., (1985). Re-examining the BeckDepression Inventory: The long and the short of it. Psychological Reports, 56, 767-778.
Wadeson, H., & Carpenter, W.T. (1976). Impact of seclusion roomexperience. Journal of Nervous Mental Disease, 163, 318-328.
Walters, R.H., Callagan, J.E., & Newman, A.F. (1963). Effect of solitaryconfinement on prisoners. American Journal of Psychiatry, 119, 771-773.
Watson, C. G., Plemel, D., Schaefer, A., Raden, M., Alfano, A. M., Anderson,P. E. D., Thomas, D., & Anderson, D. (1992). The comparative concurrent validitiesof the Shipley Institute of Living Scale and the Hemmon-Nelson Tests of MentalAbility. Journal of Clinical Psychology, 47, 233-239.
Weinberg, M.M. (1967). Effects of Partial Sensory Deprivation onInvoluntary Subjects. Unpublished doctoral dissertation, Michigan State University.
Weiss, J. L., & Schell, R. E. (1991). Estimating WAIS-R IQ from the ShipleyInstitute of Living Scale: A replication. Journal of Clinical Psychology, 47, 558-561.
Williams, T. Y., Boyd, J. C., Cascardi, M. A., Poythress, N. (1996). Factorstructure and convergent validity of the Aggression Questionnaire in an offenderpopulation. Psychological Assessment, 8, 398-403.
Wood, R. W., Conn, D. C., & Harrison, H. D. (1977). The efficacy of usingShipley-Hartford scores to predict to predict WAIS IQ in a penal population.Quarterly Journal of Corrections, 1, 39-41.
Wormith. J.S., Tellier, M.-C., & Gendreau, P. (1988). Characteristics ofprotective custody offenders in a provincial correctional centre. Canadian Journalof Criminology, 30, 39-58.
Zamble, E. (1992). Behavior and adaptation in long-term prison offenders:Descriptive longitudinal results. Criminal Justice and Behavior, 19:4, 409-425.
Zamble, E., & Poporino, F.J. (1988). Coping, Behavior, and Adaptation inPrison Offenders. New York: Springer-Verlag.

78
Zamble E., & Poporino, F.J. (1990). Coping, imprisonment, and rehabilitation:Some data and their implications. Criminal Justice and Behavior, 17, 53-70.
Zamble, E., Poporino, F.J., & Kalotay, J. (1984). An Analysis of Coping inPrison Offenders. Programs Branch User Report no. 1984-77. Ottawa: Ministry ofthe Solicitor General of Canada.
Zubek, J.P., Bayer, L, & Shephard, J.M. (1969). Relative effects of prolongedsocial isolation and confinement: Behavioral and EEG changes. Journal ofAbnormal Psychology, 74, 625-631.

79
APPENDIX A: CONSENT FORMI _____________________________, have been asked to take part in a study onthe psychological effects of incarceration. I understand that this study is beingconducted by the Research Branch of the Correctional Service of Canadacoordinated by Ivan Zinger, Research Officer. The purpose and method of thisstudy have been explained to me, and I understand the explanation. I have beengiven the opportunity to ask questions about the study, and am satisfied with theresponses I was given.I understand that participation in this study will include up to three sessions in whichan interview will be conducted and questionnaires filled out. I have been madeaware that these sessions will be about 60 to 90 minutes in length. Furthermore, Iunderstand that I may refuse to continue with the study, or answer questions at anytime.There is no penalty if I choose not to participate, nor will participation be consideredin any kind of release decision.I understand that the information gathered in this study will be kept confidential. Ialso understand that my answers will be coded in such a way that I can not beidentified in any report of the results. However, part of the study will includequestions about my mental health, such as the presence of suicidal thoughts. If itbecomes clear during the interview that you are suicidal, I understand that apsychologist will be notified. I also understand that I may be approached in thefuture concerning further evaluations of my psychological health.This project has passed ethics approval boards both at Carleton University andCorrectional Service of Canada (CSC). If you have any concerns regarding thisproject you may contact Ivan Zinger at CSC [(613) 947-4979] or Dr. Andrews atCarleton University [(613) 520-2662]. If you have ethical concerns about the study,you may also contact the Chair of the Psychology Department, Dr. Matheson [(613)520-2600, ext. 7513] or the head of the Ethics Committee, Dr. Gick [(613) 520-2600, ext. 2664] at Carleton University.
I agree to take part in this study ____(or)I do not want to take part in this research _______________________________ ______________Signature of Participant Date
I, the undersigned, have defined and fully explained the above to theparticipant in detail, and to the best of my knowledge, it was understood.
___________________________ ______________Signature of Researcher Date

80
APPENDIX B: INFORMATION FORM
The purpose of this study is to determine how offenders’ in segregation and in thegeneral population think and feel about many different areas of their lives. Thisstudy is being conducted at your institution for Correctional Service of Canada.In this study, we will interview offenders, and ask them to fill out severalquestionnaires at three points in time. For segregated offenders, the initial sessionwill occur shortly after placement in segregation. Two additional sessions will follow,one at 30 days and one at 60 days after placement. Not all offenders will be able toparticipate in all three sessions because many will be returned to the generalpopulation or transferred. For offenders in the general population, three sessionswill be held, an initial one, and two other sessions at 30 and 60 days afterwards.The purpose of this study is to collect information on the thoughts and feelings ofoffenders, and to examine how prisons may affect people. The findings from thisstudy may be used later to determine how to improve the system. So if you decideto co-operate, not only will you be helping us, but you may be helping to shapechanges in the prison system. At the same time, you need to be aware that we areonly collecting information; we will have no power to help you with any problems youmay have, and no ability to offer you treatment. You must go through acceptedchannels for those things. In addition, we can not offer you money, or rewardsbased on your participation. However, we can provide you with a copy of the resultswhen the study is finished.All answers provided by offenders will be strictly confidential, there will be no namesattached to any of the answers. Your responses will not be shared with any personsother than those directly involved with the study (researchers), nor will they be usedfor purposes other than research without your further consent. This confidentially isguaranteed by the Canadian Human Rights Act, and it will be respected.We would appreciate your co-operation in this study. If you agree to participate inthis study, you may be approached in the future concerning further evaluations ofyour psychological health. This project has passed ethics approval boards both atCarleton University and Correctional Service of Canada (CSC). If you have anyconcerns regarding this project you may contact Ivan Zinger at CSC [(613) 947-4979] or Dr. Andrerws at Carleton University [(613) 520-2662]. If you have ethicalconcerns about the study, you may contact the Chair of the Psychology Department,Dr. Matheson [(613) 520-2600, ext. 7513] or the head of the Ethics Committee, Dr.Gick [(613) 520-2600, ext. 2664] at Carleton University.

81
APPENDIX C: DEBRIEFING
Over the last two months you have participated in a study concerned with the effectsof long term segregation on offenders. This project came about for several reasons,the most important of which was that previous research has yielded conflictingfindings regarding the impact of long-term segregation on offenders. Some authorsreport that segregation has minimal negative effect, yet others report that majormental health deterioration may occur with extended periods of segregation.The purpose of this study was to explore the possible effects of segregation onpsychological functioning in areas such as depression, suicide ideation, andinteraction with others. We looked at changes in mental health and psychosocialfunctioning over a sixty day period. In order to determine if these changes were dueto the experience of segregation, we also assessed the health of non-segregatedoffenders over the same period. A comparison between the two groups(segregated and non-segregated offenders) will provide us with a clearerunderstanding of the effects of long-term segregation.Findings from this study may be used to guide programming, and the developmentof intervention strategies for offenders placed in segregation. It is hoped that thisproject will not only lead to reduced risk of disturbances in offenders’ mental health,it will also function to increase CSC psychologists’ provision of services tosegregated offenders.A research report will be available by Fall 1998. If you would like a copy of thereport at that time, please contact the Info Centre at CSC Research Branch [(613)947-8871]. If you have any concerns regarding this project you may contact IvanZinger at CSC [(613) 947-4979] or Dr. Andrews at Carleton University [(613) 520-2662]. If you have ethical concerns about the study, you may contact the Chair of thePsychology Department, Dr. Matheson [(613) 520-2600, ext. 7513] or the head ofthe Ethics Committee, Dr. Gick [(613) 520-2600, ext. 2664] at Carleton University.

82
APPENDIX D: SESSION 1 INTERVIEW FOR SEGREGATED INMATES
Date of Interview (yy/mm/dd): ____/_____/_____Subject Number:________Subject’s Full Name: ________________________________________Subject’s FPS Number: ________________Date of Birth (yy/mm/dd): ____/_____/_____Institution: Collin’s Bay ___ Millhaven ___ KP ___Cell Type: Normal ___ Dry ___ Video-monitored ___Legal Grounds for Placement: a. type: voluntary ____ involuntary ____b. reason: inmates own safety jeoperdized ____ inmate jeopardizing safety of others ____
inmate may interfere with ongoing investigation ____
I want to ask you about a number of areas of your life today. We are goingto be talking about how you feel about your life and circumstances. If at anypoint you feel uncomfortable answering a question you may refuse toanswer. Before we begin, I need to tell you that although the informationyou provide today will be confidential, there are limits. I have an obligation todisclose any information you may provide if it’s in regards to your safety orthat of the institution. These areas include suicide plans, plans of escape,injury to others and the general security of the institution. Do you have anyquestions before we begin?Let’s start out with some general questions...
General Well-Being
1. On a scale of 1 to 10 with 1 being the very worst and 10 being the very best:a. what is the very worst you have ever felt? ____b. what is the very best you have ever felt? ____c. how you are feeling today? ____
Life on the Outside
First I would like to talk about life on the outside, and ask you some generalquestions about your health.
Mental Health Functioning
2. Have you ever been in a psychiatric hospital/ward for a long period of time (minimum of 1 month)? Yes Noif YES,a. for what? _________________________________

83
b. for how long (months)? ____________3. Have you ever seen a psychologist, psychiatrist , or counselor (other than for court)? Yes Noif YESa. for what? (diagnosis or symptoms) ___________________
4. Have you ever been on any psychiatric medication?if YES,a. for what? _________________________________b. for how long (months)? ____________
5. How many times have you ever had a head injury, lost consciousness or blackedout? Never # of times ____if HAS,a. did you have to go to the hospital? Yes No
6. How far did you get in school (grade)? ____if LESS than Gr. 11a. how old were you when you quit? ____
7. Were you ever placed in special classes at school? Yes Noif YES,a. what for? _______________________
Social Relationships
I would like to talk about your relationships on the outside.
8. On a scale of 1 to 10 with 1 being extremely unimportant and 10 being extremelyimportant, rate how important you think it is to have friends. ____
9. When you were on the outside, what were your living arrangements? Did you:a. live with a spouse (include. common law)b. live with a spouse and childrenc. with other family membersd. live with friendse. live alonef. other (specify): _____________________
10. How would you characterize your friendships when you were on the outside?a. no friendsb. some casual friendsc. some casual and some close friendsd. many close friends

84

85
Casual friends are those who you do not spend a lot of time with, those withwhom you have a passing acquaintance. These are the people you wouldstop and talk to on the street, but who you do not rely on or expect to bethere for you.
Close friends on the other hand you see more often, they are the ones youwould most prefer to spend your time with. You feel like you can trust themwith private ideas and details, and who trust you too. Close friends know lotsabout each other, and can be counted on in a tight spot.
11. On a scale of 1 to 10 with one being extremely unhappy and dissatisfied and 10being the happiest you could be, you wouldn’t change a thing, how did you feelabout your social relationships in general? ____
Segregation Experiences
I would like to talk about your experiences in prison. I am going to ask youquestions about segregation, your treatment, and your life in general whileincarcerated.
12. Have you ever been in segregation before? Yes Noif YES,a. how many times? _____b. average number of days ____
13. What events or circumstances led to your placement in segregation this time? (specify) ________________________________________________
____________________________________________________________ ____________________________________________________________
14. On a scale of 1 to 10 with 1 being grossly unfair and 10 being extremely fair,a. rate the fairness of the process by which you were placed in segregation ____b. rate the fairness of the system ____
15. On a 10 point scale, with 1 being much worse and 10 being much better,a. generally, rate the way you are treated by staff now you are in
segregation ____;b. generally, rate the way you were treated by staff when you were in the
general population ____
16. How long do you think you’ll be in here? _____ (days)

86
Suicide Ideation
At different points in our lives, nearly everyone feels bad or thinks thatthings are going poorly. Sometimes these feelings are very strong, and mayeven lead people to consider whether or not they want to go on. I would liketo ask you some questions about these kinds of feelings.
17(a) Have you ever been so down or depressed you’ve thought of hurtingyourself? Yes No
17(b) Have you ever been so down or depressed you’ve thought of committing suicide?Yes No
if YES,i. how often in the last year? ______ii. rate the severity of these thoughts on a scale of 1 to 10 with 1 being a passing thought, briefly considered and 10 being a very serious thought - in which you had decided the method you would use and had made preparations. ____iii. were you (usually) under the influence (alcohol/drugs) at the time? Yes No
18. Have you ever thought about how you would do it? (method) _________
19. Have you thought about committing suicide in the last week? Yes Noif YES,
rate the severity of these thoughts on a scale of 1 to 10 with 1 being a passing thought, briefly considered and 10 being a very serious thought in which you had decided the method you would use and had made preparations. ____ (if serious problem for method - if a realistic method, note it)
20. Have you ever attempted suicide? Yes Noif YES,a. how many times? _____
b. were you under the influence (alcohol/drugs) at the time? Yes Noc. any recent attempts (i.e., last 6 months)? Yes Nod. how did you do it?(list methods)______________________________e. why were you unsuccessful? _________________________________
IF RECENT THOUGHTS OF SUICIDE WERE DISCLOSED, PLEASE NOTIFYTHE SENIOR PSYCHOLOGIST IN WRITING AND BY TELEPHONE

87
Life in Prison
Now I want to talk a bit more specifically about your life in prison.
Social Relationships
21. How would you characterize your friendships in here?a. no friendsb. some casual friendsc. some casual and some close friendsd. many close and casual friends
22. On a scale of 1 to 10 with one being extremely unhappy and dissatisfied and 10 being the happiest you could be, you wouldn’t change a thing, how do you feel about your social relationships, in here? ____
Somatic Problems
23. For the following questions, I would like you use a 10 point rating scale to indicate possible problems in several areas. On a scale of 1 to 10 with one being no problem at all, and 10 being a very severe problem, do you have any problems with:? (specify)
a. sleeping: ________________________________________________b. anger: __________________________________________________c. concentration: ____________________________________________d. memory: ________________________________________________e. appetite: ________________________________________________f. interaction with others: _____________________________________g. other: __________________________________________________
24. Aside from sleeping, how much time in the average week do you spend on:a. School, or programs _____ hours/weekb. Visits and writing letters _____ hours/weekc. Watching TV, listening to radio or music? _____ hours/weekd. Hobbycraft _____ hours/weeke. Recreation: _____ hours/week (describe)_____________________f. Other _____ hours/week (describe)_____________________
Debriefing
Thank you for your time and assistance with this project. If you experiencedany distress as a result of your participation in this study, you may requestto see a psychologist.

88
I want to remind you that the responses you provided to these questionstoday will be kept confidential and will not impact in any way on a releasedecision.
With this project, we hope to improve our understanding about the effects oflong-term segregation. Although your particular comments will not bereported, they will help us in this endeavor.
If you are still in segregation when the next interview sessions areconducted, I very much hope you will agree to participate. Do you have anyquestions?

89
APPENDIX E: CHECKLIST OF PHYSICAL CONDITIONS OF CONFINEMENT
Institution Name: _________________________ Date: _____________Filled out by: _____________________________
A. Cell descriptions:
1. Typical Segregation Cell:a. Dimensions
i. size: _____(approx. sq. ft.) ceiling height: _____(ft.) ii. number of cells (in seg. unit): ____iii. % of cells currently double-bunked ____%iv. power outlets?: Yes No
b. Windowi. size: ___ by ___ (in.)ii. able to open? Yes No
c. Doori. double door? Yes Noii. solid door? Yes Noiii. window in door? Yes No
if YES,size: ___ by ___ (in.)
2. Other Types of Cells:
Dry Cells:a. Dimensions
i. size: _____(approx. sq. ft.) ii. ceiling height: _____(ft.) iii. number of cells: ___ iv. power outlets?: Yes No
b. Window i. size: ___ by ___ (in.)
c. Door i. double door? Yes No ii. solid door? Yes No iii. window in door? Yes No if YES, size: ___ by ___ (in.)

90
Video-Monitored Cells:a. Dimensions
i. size: _____(approx. sq. ft.) ii. ceiling height: _____(ft.) iii. number of cells: ___ iv. power outlets?: Yes No
b. Window i. size: ___ by ___ (in.) ii. able to open? Yes No
c. Door i. double door? Yes No ii. solid door? Yes No iii. window in door? Yes No if YES, size: ___ by ___ (in.)
B. Yard:1. Size: _____(approx. sq. ft.) 2. Sides: Concrete Walls Fence Other: _____________3. Overhead: Partially Covered Open
Comments: _______________________________________________
C. General:1. Common Area? Yes No2. Number of : interview/visitor rooms: ___3. Telephone in Cell? Yes NoComments:________________________________________________