By Hendrik G. van Oss - USGS
35
CEMENT—2000 17.1 CEMENT By Hendrik G. van Oss Domestic survey data and tables were prepared by Nicholas Muniz, statistical assistant, and the world production table was prepared by Regina R. Coleman, international data coordinator. As the binding agents in concrete and mortars, hydraulic cements are key construction materials. Hydraulic cements are those that can set and harden under water and are dominated by varieties that can be loosely grouped as portland cement and masonry cement. Only portland and masonry cements are covered in this report. In 2000, U.S. production of portland and masonry cements, combined, continued a multiyear trend of new annual records with a 2.2% increase to 87.8 million metric tons (Mt) (table 1). Output of clinker—the unground intermediate product of cement manufacture—increased by almost 3% to a new record of 78.1 Mt. The United States continued to rank third in the world in overall hydraulic cement output, behind China (about 36% of the world’s total) and India; world output was about 1.6 billion metric tons (Gt). Domestic consumption of cement again reached new record levels, but the growth in 2000 was significantly slower than annual rates over the period 1995-99 and reflected weakness in the overall U.S. economy. Apparent consumption of cement in 2000 (calculated as production plus imports minus exports minus the change in yearend stocks) rose only by 1.5% to 110.5 Mt; it had grown by 5.2% in 1999 (table 1). Cement consumption measured as sales to final domestic customers increased by 1.0% to 109.7 Mt (table 9); the growth rate was only one-fifth of that of the previous year. The large production shortfall in 2000, as in previous years, continued to be met by imports of cement and clinker but at a slightly lower level overall; it was the first decline since 1992. Exports, in contrast, rose in 2000 but remained an almost insignificant component of total cement commerce. Cement prices were virtually unchanged during the year. The total ex-factory value of annually reported cement sales to final domestic customers rose by 2.6% to $8.3 billion (table 1). If the unit value of the cement is applied to the larger, monthly-based sales tonnages in table 9, the total rises to $8.6 billion but is an increase of only 1.2%. By using typical cement-in-concrete mix ratios, the delivered value of concrete, excluding mortar, in the United States was estimated to be at least $37 billion in 2000. Portland and masonry cements are based upon portland cement clinker, made up mostly of calcium silicates and manufactured by controlled high-temperature burning in a kiln of a measured blend of calcareous rocks (usually limestone) and, as needed, lesser quantities of siliceous, aluminous, and ferrous materials. The clinker is finely ground together with a small (generally about 5%) amount of calcium sulfate in the form of gypsum and/or anhydrite to make (straight) portland cement. Straight portland cement can be sold directly to concrete manufacturers or other customers, converted at the cement (or concrete) plant into a blended (portland) cement product of similar properties by adding other cementitious or pozzolanic (siliceous materials requiring added lime to become cementitious) extenders, or mixed with such plasticizing materials as ground limestone or lime to make masonry-type cements used in mortar. A full listing of cement varieties included within the portland cement designation as used in this report is given in table 16. Although included within the portland cement designation in this report, data showing blended cements separately from the other forms of portland cement are available within the monthly cement reviews of the Cement in the 20th Century In 1900, the hydraulic cement industry of the United States was less than a century old, and until that year, its output had been dominated by natural and pozzolanic cements. Portland cement had been manufactured domestically since only the early 1870s, and by 1900, its output of 1.46 million metric tons had just exceeded that of natural and pozzolanic cements (1.22 million tons, combined) for the first time. In 1900, hydraulic cement production was valued at $19.4 million. Cement was being manufactured at 114 plants, 50 of which produced portland cement. Total world cement production was probably only about 60 million tons, of which 44 million tons was in Europe. Cement consumption in the United States totaled 3.07 million tons in 1900, or about 24 kilograms per person. About 13% of the total cement consumed was imported, mostly from Europe. Most of the consumption was for concrete blocks and mortars. In 2000, production of cement reached 87.8 million tons, valued at about $6.9 billion; about 95% of output was portland cement. Output was from 116 plants, most of which were owned by European-based multinational corporations. Consumption of cement totaled 109.7 million tons, or about 380 kilograms per person; the 22-million-ton production deficit was met by imports from around the world. The dramatic increase in production and consumption during the course of the century reflected increasing diversity of use of concrete in large office buildings, houses, roads, bridges, sewers, and dams. Except for major disruptions during the Great Depression and World War II, production had risen fairly continuously, reaching about 30 million tons by 1928 and again by 1947, surging through the 1950s onwards to about 78 million tons in 1973, fluctuating at lower levels over the period 1974-93, and resuming steady growth thereafter. World production in 2000 totaled about 1.6 billion tons, almost 60% of which was from Asia; China and India together contributed 40%.
Transcript of By Hendrik G. van Oss - USGS

CEMENT—2000 17.1
CEMENTBy Hendrik G. van Oss
Domestic survey data and tables were prepared by Nicholas Muniz, statistical assistant, and the world production table wasprepared by Regina R. Coleman, international data coordinator.
As the binding agents in concrete and mortars, hydrauliccements are key construction materials. Hydraulic cements arethose that can set and harden under water and are dominated byvarieties that can be loosely grouped as portland cement andmasonry cement. Only portland and masonry cements arecovered in this report. In 2000, U.S. production of portland andmasonry cements, combined, continued a multiyear trend ofnew annual records with a 2.2% increase to 87.8 million metrictons (Mt) (table 1). Output of clinker—the ungroundintermediate product of cement manufacture—increased byalmost 3% to a new record of 78.1 Mt. The United Statescontinued to rank third in the world in overall hydraulic cementoutput, behind China (about 36% of the world’s total) and India;world output was about 1.6 billion metric tons (Gt).
Domestic consumption of cement again reached new recordlevels, but the growth in 2000 was significantly slower thanannual rates over the period 1995-99 and reflected weakness inthe overall U.S. economy. Apparent consumption of cement in2000 (calculated as production plus imports minus exportsminus the change in yearend stocks) rose only by 1.5% to 110.5Mt; it had grown by 5.2% in 1999 (table 1). Cementconsumption measured as sales to final domestic customersincreased by 1.0% to 109.7 Mt (table 9); the growth rate wasonly one-fifth of that of the previous year. The large productionshortfall in 2000, as in previous years, continued to be met byimports of cement and clinker but at a slightly lower leveloverall; it was the first decline since 1992. Exports, in contrast,rose in 2000 but remained an almost insignificant component oftotal cement commerce. Cement prices were virtually
unchanged during the year. The total ex-factory value ofannually reported cement sales to final domestic customers roseby 2.6% to $8.3 billion (table 1). If the unit value of the cementis applied to the larger, monthly-based sales tonnages in table 9,the total rises to $8.6 billion but is an increase of only 1.2%. Byusing typical cement-in-concrete mix ratios, the delivered valueof concrete, excluding mortar, in the United States wasestimated to be at least $37 billion in 2000.
Portland and masonry cements are based upon portlandcement clinker, made up mostly of calcium silicates andmanufactured by controlled high-temperature burning in a kilnof a measured blend of calcareous rocks (usually limestone)and, as needed, lesser quantities of siliceous, aluminous, andferrous materials. The clinker is finely ground together with asmall (generally about 5%) amount of calcium sulfate in theform of gypsum and/or anhydrite to make (straight) portlandcement. Straight portland cement can be sold directly toconcrete manufacturers or other customers, converted at thecement (or concrete) plant into a blended (portland) cementproduct of similar properties by adding other cementitious orpozzolanic (siliceous materials requiring added lime to becomecementitious) extenders, or mixed with such plasticizingmaterials as ground limestone or lime to make masonry-typecements used in mortar. A full listing of cement varietiesincluded within the portland cement designation as used in thisreport is given in table 16. Although included within theportland cement designation in this report, data showingblended cements separately from the other forms of portlandcement are available within the monthly cement reviews of the
Cement in the 20th Century
In 1900, the hydraulic cement industry of the United Stateswas less than a century old, and until that year, its output hadbeen dominated by natural and pozzolanic cements. Portlandcement had been manufactured domestically since only theearly 1870s, and by 1900, its output of 1.46 million metrictons had just exceeded that of natural and pozzolanic cements(1.22 million tons, combined) for the first time. In 1900,hydraulic cement production was valued at $19.4 million. Cement was being manufactured at 114 plants, 50 of whichproduced portland cement. Total world cement productionwas probably only about 60 million tons, of which 44 milliontons was in Europe. Cement consumption in the United Statestotaled 3.07 million tons in 1900, or about 24 kilograms perperson. About 13% of the total cement consumed wasimported, mostly from Europe. Most of the consumption wasfor concrete blocks and mortars.
In 2000, production of cement reached 87.8 million tons,valued at about $6.9 billion; about 95% of output was portland
cement. Output was from 116 plants, most of which wereowned by European-based multinational corporations. Consumption of cement totaled 109.7 million tons, or about380 kilograms per person; the 22-million-ton productiondeficit was met by imports from around the world. Thedramatic increase in production and consumption during thecourse of the century reflected increasing diversity of use ofconcrete in large office buildings, houses, roads, bridges,sewers, and dams. Except for major disruptions during theGreat Depression and World War II, production had risenfairly continuously, reaching about 30 million tons by 1928and again by 1947, surging through the 1950s onwards toabout 78 million tons in 1973, fluctuating at lower levels overthe period 1974-93, and resuming steady growth thereafter.World production in 2000 totaled about 1.6 billion tons,almost 60% of which was from Asia; China and India togethercontributed 40%.
U.S. GEOLOGICAL SURVEY MINERALS YEARBOOK—200017.2
U.S. Geological Survey (USGS) Mineral Industry Surveysseries, starting with January 1998. Excluded from the portlandand masonry categories and from this report are such hydrauliccement varieties as pure pozzolan cements [especially so-calledslag cement, which is simply ground granulated blast furnaceslag (GGBFS)] and aluminous cements. These cements containno portland cement clinker and, cumulatively, make up only asmall fraction of the U.S. cement market.
The bulk of this report incorporates data compiled fromUSGS annual questionnaires sent to individual cement andclinker manufacturing plants and associated distributionfacilities and import terminals (some independent of U.S.cement manufacturers). For 2000, responses were receivedfrom 143 of 144 facilities canvassed, which included allproducers, covering 100% of actual production and more than99% of sales. For 1999, responses were received from 139 of141 facilities canvassed, including all but 1 small producer, andcovering more than 99% of total U.S. production and sales. Two tables (9 and 10) of this report are based on monthlyshipment surveys of the cement-producing companies andimporters, for which the response rate was 100% for both years. Trade data are from the U.S. Census Bureau. The worldhydraulic cement production data (table 23) were derived fromdata collected by USGS country specialists from a variety ofsources.
As in previous years, significant tonnage differences existbetween the annual (survey) sales totals for portland cementlisted in tables 1 and 11 through 16 and the larger monthly-survey-based totals listed in tables 9 and 10. The differences,amounting to 5.3 Mt in 1999 and 4.0 Mt in 2000, likelyrepresent imported cement handled by certain terminals actingindependently of the manufacturing plants; althoughincorporated within the monthly data set, some of theseterminals’ sales appear to be missing from the annual survey. Accordingly, the monthly data are believed to be the morecomplete measure of cement consumption. The equivalentdiscrepancy for masonry cement is insignificant, likely becauselittle of this material is imported.
Where required to protect proprietary information, State dataare combined within groupings or districts, generallycorresponding to census districts or subsets thereof. To provideadditional market information, some major cement-producingStates have been subdivided along county lines; the countybreakouts are given in table 2.
There were three significant ownership changes within theU.S. cement industry in 2000. In June, Australian-owned CSRAmerica, Inc. (owner of Miami, FL, cement producer CSRRinker Materials, Inc.) purchased Florida Crushed Stone Co.,which operates a dry plant at Brooksville, FL. Two monthslater, Greek producer Titan Cement S.A. purchased the assets ofAnglo American plc’s subsidiary Tarmac America, Inc., therebygaining full control of Roanoke Cement Co. in Virginia (inwhich Titan was already a joint-venture partner) and PennsucoCement Co. in Florida. Titan also owned Essex Cement Co., aNew Jersey-based cement importer. By far the most importantownership transfer, however, took place at the end ofSeptember, when Cemex S.A. de C.V. of Mexico (CEMEX)announced its purchase of Southdown, Inc., the second largestU.S. cement producer and (hitherto) the largest U.S.-ownedcement company. Prior to this purchase, CEMEX’s onlyproduction facility in the United States was the Balcones Plant
(formerly operated under the name Sunbelt Cement Co.) inTexas, and the company owned large import terminals inCalifornia and Arizona. With the purchase of Southdown,CEMEX gained control of a dozen more plants spreadthroughout the country—namely at Brooksville, FL;Charlevoix, MI; Clinchfield, GA; Demopolis, AL; Fairborn,OH; Knoxville, TN; Kosmosdale, KY; Lyons, CO; Odessa, TX;Pittsburgh, PA; Victorville, CA; and Wampum, PA—as well asa number of terminals. The Kosmosdale and Pittsburgh plantswere joint ventures with Lone Star Industries, Inc. (25%).
Early in the year, Lafarge, the world’s second largest cementproducer, launched a well publicized hostile takeover bid forBritish company Blue Circle Industries, a major rival world andU.S. cement producer. Had it been successful, the mergerwould have made Lafarge the largest cement producer in theworld and the United States. The bid failed when, in May, BlueCircle shareholders rejected Lafarge’s bid.
Legislation and Government Programs
Economic Issues.—Government economic policies andprograms affecting the cement industry chiefly are thoseaffecting cement trade, interest rates, and public sectorconstruction spending. In terms of trade, the major issue in2000 remained that of antidumping tariffs against Japan andMexico and a related voluntary restraint (import price)agreement with Venezuela that were imposed in the early 1990sfollowing complaints in the late 1980s by a large coalition ofU.S. producers. On March 6, 2000, the U.S. Department ofCommerce (DOC) released its determination for the (eighth)review period covering August 1997 to July 1998; the dumpingmargin for the period was set at 45.84% (Southern Tier CementCommittee, 2000a). Pursuant to a World Trade Organizationagreement, which became effective in 1995 and which requireda sunset review after 5 years to determine the necessity ofcontinued antidumping tariffs, a review was begun in mid-1999of the antidumping remedies imposed on Japan, Mexico, andVenezuela. On June 27, 2000, the DOC issued the results of itspart of the sunset review (as to whether dumping wouldcontinue or resume if tariffs were removed). The determinationwas that dumping would continue/resume at high margins by allthree countries (Southern Tier Cement Committee, 2000b). Thesecond investigation under the sunset review process wasconducted by the U.S. International Trade Commission (ITC)and was to determine whether or not dumping, if continued orresumed, would cause injury to the U.S. cement industry. OnOctober 5, the ITC concluded its investigation, determining, ona majority vote, that injury would occur if dumping resumed orcontinued by Japan and Mexico. Accordingly, the antidumpingremedies against these two countries would be maintained foranother 5 years. However, in a unanimous vote, the ITCterminated the antidumping remedy (pricing agreement) againstVenezuela (Southern Tier Cement Committee, 2000c). Theruling on Mexico was a surprise to some analysts who hadspeculated that continued injury to the industry from Mexicancement imports would be difficult to prove following thewithdrawal in late 1999 of Southdown, Inc., a major proponentof the original tariffs, from the industry coalition that wassupporting the continuation of the antidumping remedies. Southdown had cited the strong U.S. cement market conditionsin recent years and substantial control of imports by U.S.

CEMENT—2000 17.3
producers as evidence that the tariffs were no longer needed. Itwas unclear whether CEMEX, the main Mexican companytargeted by the antidumping order on Mexican cement, wouldappeal the ITC ruling based on a change of circumstancesfollowing its purchase of Southdown.
In terms of Government funding of construction projects, thecement industry had anticipated much higher spending levels in1999 and 2000 on road and related infrastructure repair andconstruction as a result of the signing into law in June 1998 ofthe Transportation Equity Act for the 21st Century (TEA-21). This law authorized $216.3 billion in funding for the 6-yearperiod from 1998 to 2003 for the purpose of upgrading thecountry’s transportation infrastructure. The level of fundingexceeded previous spending levels by an average of about 44%per State, and the bill contained substantial funding guarantees. Funding provided for various facets of highways, including newroads and bridges and existing infrastructure upgrades andrepair, totals about $173 billion, of which about 95% wasguaranteed. Estimates varied as to how much added cementconsumption [typically 6 million to 8 million metric tons peryear (Mt/yr)] would result from full-level TEA-21 spending, butnowhere near this level of added consumption had materializedas of yearend 2000. It appeared that the impact of delays inState funding (for cofunded projects) and of lag times betweenproject initiation and actual cement consumption was greaterthan had been anticipated.
Environmental Issues.—Both mining and manufacturing areinvolved in cement production. As shown in table 6,approximately 140 Mt/yr of raw materials are directly orindirectly mined in the United States to produce cement, and theclinker that is imported converts to another almost 8 Mt/yr ofraw materials, albeit mined outside the country. Calcareousfeeds, such as limestone, make up about 85% of the rawmaterials mined by the cement companies themselves; most ofthe remaining materials are obtained locally as well. Inaddition, as shown in table 7, the cement industry burnssignificant quantities of fossil fuels. Most mines and quarriessupplying the cement industry are open pit operations. Environmental issues affecting mining of cement raw materialsare mostly local and are common to most surface mines; theyinclude potential problems with dust, increased sediment loadsto local streams, noise, and ground vibrations from blasting. Ofgreater concern, however, are the environmental impacts of thecement manufacturing process itself, most of which stem fromthe manufacture of clinker.
In 2000, U.S. clinker kilns burned about 15 Mt of fossiland/or other organic fuels (table 7). In the debate over climatechange, the impact of greenhouse gases on atmosphericwarming is a major issue. The most common greenhouse gas iscarbon dioxide (CO2), and fuel combustion and calcination ofcarbonate (limestone) feed in the clinker kilns both generatelarge quantities of this gas. Calcination basically follows theequation: CaCO3 6 CaO + CO28. Although precisedeterminations of CO2 emissions by the U.S. industry areunavailable from the companies themselves, reasonableestimates (within 5% to 10%) of the emissions for the industryoverall can be made based on certain assumptions as to thecomposition of the raw materials and fuels consumed and theclinker produced. These assumptions are explained in moredetail in the 1999 and earlier editions of this report, butgenerally, the production of 1 metric ton (t) of clinker releases
0.51 t of CO2, and the combustion of fuels releases on the orderof 0.4 to 0.5 t of CO2, depending on the types of fuel consumedand the pyroprocessing technology used. Thus, approximately1 t of CO2 is released per ton of clinker, and very slightly less(because of the added gypsum) per ton of straight (unblended)portland cement. Based on the clinker production shown intable 5, the U.S. industry released about 77 Mt of CO2 in 2000. Additionally, U.S. cement plants consumed electricity (table 8)equivalent to about 7 to 8 Mt of CO2, but this “emission”generally would be assigned to the electrical power industry.
Although dwarfed by the collective CO2 emissions ofpowerplants and motor vehicles, the cement industry is one ofthe largest remaining industrial sources of this gas and isperhaps the largest single industrial source (or possibly secondto the iron and steel industry) of CO2 not derived from thecombustion of fuels. Because of this ranking, the cementindustry receives more attention concerning its CO2 emissionsthan it would like, notwithstanding the fact that its CO2emissions are only about 1.5% of the U.S. total (U.S.Environmental Protection Agency, 2001, p. ES-4). The concernof the cement industry with CO2 continues to be the possibilitythat the Government, either under the obligations ofinternational environmental treaties or by its own volition, willseek to substantially reduce the cement industry’s emissions bysuch means as the imposition of carbon taxes, the enactment ofemissions quotas, or the requirement that low(er) emissionsproduction technologies be used.
As discussed in more detail in the 1999 edition of this report,the Kyoto Protocol, signed at the United Nations FrameworkConvention on Climate Change held in Kyoto, Japan, in 1997,calls for reductions in CO2 output by countries to levelssubstantially below those in 1990, to be achieved by 2012. Asof yearend 2000, the U.S. Congress had not ratified the protocolnor had most of the other signatories. To meet its KyotoProtocol target (7% below 1990 emissions levels), the UnitedStates would need to reduce its emissions by 20% or more by2012 from what they would potentially be at current emissionsgrowth rates. Roughly similar reductions would apply to othercountries bound by the protocol. Given that the overwhelmingmajority of nonagricultural emissions of CO2 are from theburning of fossil fuels, any major reductions in CO2 emissionswould have to be through proportional reductions in energyconsumption, and the economic ramifications of this could besubstantial. Most objections to the Kyoto Protocol revolvedaround the fact that only the so-called developed countrieswould be bound by it (although all the others would beencouraged to reduce emissions), leaving them at economicdisadvantage to countries not so bound. Various proposals foremissions trading, and receiving credit for so-called carbon-sinks, have been debated to reduce the potential economicimpacts. In late November, the Sixth Conference of the Partiesto the United Nations Framework Convention on ClimateChange was held in the Hague (a followup meeting to that inKyoto in 1997) to discuss these proposals, but no agreementwas achieved.
There has been substantial interest in developing precise andauditable inventories of CO2 and other greenhouse gasemissions to aid emissions reduction strategies. In mid-2000,the Intergovernmental Panel on Climate Change released its so-called good practices methodologies, designed to calculatenational emissions levels (Intergovernmental Panel on Climate
U.S. GEOLOGICAL SURVEY MINERALS YEARBOOK—200017.4
Change, 2000).For the U.S. cement industry, mandated major reductions in
CO2 emissions could require shutting a number of older plants,especially those operating wet kilns, and/or upgrading plantequipment to more efficient technologies. Upgrading, forvarious reasons, is already underway at many plants but is anexpensive process. Mandated emissions reductions could forceplants to burn less carbon-intensive fuel, for example, naturalgas rather than coal. Many U.S. cement plants already are ableto switch among a variety of fuels, but large-scale shifts ofcement plants and other fuel-intensive facilities (e.g.,powerplants) to natural gas could lead to local shortages andprice increases for that fuel. An alternative emissions-reductionstrategy, market permitting, would be to increase the output ofblended cements and perhaps allow the addition of smallamounts of inert extenders (as bulking agents) in straightportland cement. Either strategy would reduce the clinker (andhence emissions) component of the finished cement, which inturn would reduce total emissions by the cement industry or atleast constrain emissions increases if cement demand (andoutput) grows. A major shift to blended cements could lead tolocal shortages of suitable pozzolans, as well as increased pricesfor them. The U.S. concrete industry is itself a significant directconsumer of pozzolans, which are used as a partial substitute forportland cement in ready-mixed concrete and some otherconcrete mixes. A recent review of CO2 emissions reductionstrategies, focusing on reductions of specific energyconsumption, is given in Martin, Worrell, and Price (1999). Cement kilns are considered to be an environmentally benignway of burning a variety of hazardous and nonhazardouswastes, owing to the very high temperatures at which clinker ismade and the long residence times of materials in the kiln. Awaste fuel that has received recent attention in Europe is bonemeal, which has become abundant through the necessity ofslaughtering vast numbers of diseased livestock and which,from such contaminated sources, is unusable for most otherapplications (Whitehorn, 2001).
Another approach to reducing emissions from clinkermanufacture is to use a noncarbonate source for some of theCaO in the kiln feed. A process patented by Texas Industries,Inc. (TXI), and known as CemStar, makes use of ferrous(particularly steel) slag as a CaO raw material in the kiln feed. As noted in a review by Perkins (2000), use of CemStarincreases clinker output by as much as 10% or more, withcommensurate reductions in unit CO2 emissions. The processhas been licensed to a number of plants and is reflected in thesteel slag consumption data in table 6.
Other emissions of the cement industry include cement kilndust (CKD), nitrogen and sulfur oxides (NOx and SOx,respectively), and dioxins and furans. The U.S. EnvironmentalProtection Agency issued regulations concerning these andother emissions from the industry in 1999, but most of theseregulations were still under one form or another of review ordebate in 2000. Except for CKD (virtually all of which iscaptured and a majority of which is recycled to the kilns), thecement industry is not considered a major source of thesepollutants compared with a number of other industries. Thecement industry is nonetheless concerned about new emissionslimits and prescribed monitoring methods, namely the degreethat they can or cannot be realistically implemented and/or theemissions controlled. Many plants are already improving their
burning systems to reduce NOx emissions; a review of methodsto do this is given by Wahlquist (2000).
Production
In 2000, cement was produced in 37 States and in PuertoRico. All of the facilities were in the private sector with theexception of one plant (Dacotah Cement Co.) that was State-owned. At yearend 2000, about 79% of U.S. portland cementoutput and 85% of its production capacity were foreign-owned,a major increase from the 68% foreign ownership status atyearend 1999 and mostly owing to the CEMEX purchase ofSouthdown. In addition to the portland and masonry cementplants, there were several grinding facilities that producedGGBFS from unground slag from domestic or foreign sources. When ground, this material (GGBFS) is sold to the cement andconcrete industries as a cementitious additive; it is also knownas “slag cement,” but the use of this term is confusing as italready refers to a specific type of high GGBFS-content blendedportland cement. GGBFS plants will not be dealt with in thisreport except to the extent that their product makes its way intoblended cements, and with respect to the fact that all or most ofthem could grind clinker instead, should market conditions sowarrant.
Although, technically, there were no new (greenfields) plantopenings in 2000, a facility in Florida that had commencedclinker production in late December 1999 had its first outputand sales of portland cement in January 2000 and reached fullcapacity production levels (clinker and cement) later during theyear. One small grinding facility that had in recent years onlybeen operated as a terminal resumed grinding on an intermittentbasis. New plants are planned or are under construction inColorado, Florida, Missouri, New York, and Texas.
Following the startup of clinker production at yearend 1999,Florida Rock Industries, Inc., had its first production and salesof portland cement from its new 0.68-Mt/yr Newberry, FL,plant in January 2000, a project reviewed by Cohrs (2001). Thefacility reached full output levels after several months of ramp-up operations. Suwannee American Cement Co. received someof its environmental permits to construct a greenfields plant nearBranford, FL (Portland Cement Association, 2000b).
Many existing plants had expansion projects completedduring the year or which were within 1 to 2 years of completion. A few of the larger projects will be mentioned here. Ash GroveCement Co. was replacing the two wet kilns at its Chanute, KS,facility with a single dry kiln of about 1.5 Mt/yr capacity; thework was expected to be completed by mid-2001 (Ash GroveCement Co., 2001). Blue Circle was adding a new kiln line atits Calera, AL, plant, with a completion date anticipated for2002 (World Cement, 2000). The company also commissioneda new slag grinding mill at its Detroit, MI, clinker-grindingplant. Early in the year, Holnam, Inc., fired up its newlyconstructed second kiln line at its Midlothian, TX, plant. Thenew line doubled the plant’s existing capacity to 2 Mt/yr(Arthur, 2000). Essroc Cement Corp. was planning to expandthe capacity of its Speed, IN, plant by 75% by converting itslong dry kiln to short dry technology. The work was anticipatedto be completed around yearend 2001 (International CementReview, 2000a). At yearend, Holnam broke ground for a new2,000 Mt/yr dry kiln to replace the existing pair of wet kilns atits Holly Hill, SC, plant. The kiln was expected to come online
CEMENT—2000 17.5
in mid-2003. Holnam was also constructing a new 1.9 Mt/yrdry kiln line to replace the three existing wet lines (totalcapacity 0.77 Mt/yr) at its Florence, CO, facility; the new linewas targeted to start production in early to mid-2001. Atyearend, Holnam announced its decision to proceed with aproject to build a 4 Mt/yr greenfields cement plant in St.Genevieve County, MO. This would be the largest single kilnline in the country (Cement Americas, 2001). Lehigh PortlandCement Co. was replacing the four long dry kilns at its UnionBridge, MD, plant with a new, single, dry precalciner kiln. Thenew line was due to be fired in early 2001 (Barzoloski, 2000). At midyear, Lone Star completed the conversion of itsGreencastle, IN, wet kiln to semidry technology, thereby almostdoubling its capacity to 1.17 Mt/yr. This was the first semidryline in the country (Mining Engineering, 2001). In August, RCCement Co. brought online a new finish mill at its SignalMountain Cement Co. subsidiary in Tennessee; the project’snew 0.72-Mt/yr kiln line was due to be fired up in early 2001, atwhich time the existing pair of wet kilns would be shut down(Maranzana, 2000). RC’s subsidiary River Cement Co. wasplanning to expand the capacity of its Selma, MO, plant byabout 0.4 Mt/yr (Portland Cement Association, 2000a). Late inthe third quarter, Southdown, Inc. (prior to its takeover byCEMEX), completed the kiln line upgrade of the KosmosCement plant in Louisville, KY; announced in 1999; the plant isa joint ventured with Lone Star. Work on the new finish mill atTXI’s Midlothian, TX, was completed late in the year and thecompany expected to have the plant’s new kiln fired in January2001. This will increase the plant’s capacity to about 2.5 Mt/yr(International Cement Review, 2000b).
Portland Cement.—Portland cement was manufactured in theUnited States in 2000 at a total of 115 plants out of 116claiming clinker grinding capacity (the remaining plantproduced only GGBFS). There were also two portland cementplants in Puerto Rico. Seven of the portland-cement-producingfacilities were only grinding plants (that did not produce theirown clinker); one of these was operated only intermittentlyduring the year, and several also ground slag in addition toclinker. The regional distribution of these plants, cementproduction and capacities, and yearend cement stockpiles arelisted in table 3.
In 2000, production of portland cement rose by 2.4% to 83.5Mt, a new record but still well below total consumption (table9). Further, the production was slightly enhanced (0.27%) bythe added production day (2000 was a leap year). Theproduction shortfall continued to be met by imports (tables 18-22). As shown in table 3, portland cement production increaseswere noted in all but 10 districts. The decreases were all indistricts accessible to imported cement. The top five producingStates, in descending order, continued to be California, Texas,Pennsylvania, Michigan, and Missouri.
Cement (grinding) capacity increased by 6.0% to 103.4 Mt asa result of upgrades at several plants; large increases werereported in a dozen districts, and only four districts showeddecreases. Capacity utilization was high virtually everywhere,although it fell slightly (to 80.7% utilization) for the countryoverall. Where the annual utilization rates appeared to be lowor had fallen significantly, the cause was generally the comingon-stream of additional capacity, which was fully counted butnot fully used during the year. Florida remained a case in point,with a new plant starting its grinding mill in January 2000
(clinker production commenced at yearend 1999) and upgradescoming on-line at other facilities. The capacity utilizationfigure is understated because it is calculated using only theproduction of portland cement, whereas the grinding capacitiesreported by the plants include that for masonry cement. Ifmasonry cement production (table 4) is included, nationalgrinding capacity utilization in 2000 recalculates to 84.9%,compared with 88.1% in 1999. Given the fact that reportedcapacities take into account shutdowns only for routinemaintenance, the capacity utilization rates shown are likelyclose to full practical operational levels.
The 2000 district and national annual grinding capacitiesexceeded, sometimes by large amounts, the correspondingclinker production capacities listed in table 5. This is owing toa number of factors. Some districts have dedicated grindingfacilities that import all of their clinker. It is generally easierand cheaper for an integrated plant to add grinding capacitythan to add clinker capacity. Extra grinding capacity allows aplant to quickly increase product output and to change cementformulations by the expedient of importing clinker and/orcementitious additives. The exceptionally large excess grindingcapacity in Michigan in part reflects restricted cement-shippingcapabilities of one plant during the winter—all of its cementmust be made (ground) and shipped during the open-watermonths.
The grinding capacity declines shown in a few districts maysimply represent temporary mill shutdowns during upgradeprojects or the permanent retirement of obsolete grindingequipment. In some years, declines may also reflect the transferof some grinding capacity to nonclinker applications where thereporting company chose not to consider it as available forcement.
Yearend 2000 stockpiles of portland cement were 11% higherthan at yearend 1999; although this change affects the apparentconsumption statistics in table 1, it has little significance for thecement industry itself. Shifts in stockpiles can result frombuildups or drawdowns related to maintenance and upgradeshutdowns of mills, changes in sales volumes, interruptions todelivery schedules, and the conversion of one type of cement toanother higher tonnage type (such as portland converted toblended cement).
Although the sales of various types of portland cement arelisted, split out, on table 16, data are not collected on the actualproduction of the different varieties of portland cement. However, it is likely that the production, for most types, is atleast somewhat proportional to the sales in table 16, both inrelative percentage and absolute tonnage terms, after adjustmentfor sales of imported cement (see tables 18-22). The importadjustment can only be approximate, because import tariffnumbers only allow differentiation of clinker from hydrauliccement, and within hydraulic cement, differentiation onlyamong gray portland (this would include most of the table 16listings), white portland, aluminous cement, and “other”hydraulic cement. In terms of the gray portland imports, it maybe assumed that the majority qualifies as Types I or II (importsinto southern California include a lot of Type V). An importadjustment for white cement is made difficult because ofproblems with the import data (see the “Values” subsectionunder the “Consumption” section below). Finally, imports feedstockpiles, not just sales. The import cautions notwithstanding,it can at least be stated that production of Types I and II (or

U.S. GEOLOGICAL SURVEY MINERALS YEARBOOK—200017.6
hybrids thereof) accounted for about 90% of total portlandcement output.
Portland cement producers in the United States ranged fromthose having a single, perhaps very small, plant to large,multiplant corporations having in excess of 10% of total U.S.capacity. The ranking of these companies in terms ofproduction and capacity is complicated by how one defines theterm “company;” some entities are subsidiaries of commonparent corporations and some plants are jointly owned by two ormore companies. If companies having common parents arelumped under the larger subsidiary’s name, and if the jointventures are apportioned, the top 10 companies at yearend 2000,in descending order of production, were Holnam, CEMEX(Southdown), Lafarge, Lehigh, Ash Grove, Blue Circle, Essroc,Lone Star, RC Cement, and TXI. Together, these accounted for72% and 69% of total U.S. production and production capacity,respectively, and all except Ash Grove and TXI were foreign-owned as of yearend.
Masonry Cement.—Production of masonry cement(including plastic and portland lime cements) fell by 1% to 4.3Mt in 2000 (table 4), following an almost 10% increase theprevious year. Unlike portland cement, masonry cementproduction was virtually identical to its reported domesticconsumption, and very little of that consumed was imported(table 9). The data in both tables 4 and 9, however,underrepresent true production and consumption levels ofmasonry cement, because it is common for masonry cement(particularly the portland lime variety) to be made at the job siteitself, from purchased portland cement and lime. There are nodata on this jobsite activity, but it is likely to be substantial. Thereported production decline reflects lackluster demand duringthe year (see “Consumption” section below) and cold-weather-induced work delays towards yearend. In 2000, all but 5% ofthe masonry cement was reported by cement companies ashaving been made directly from clinker rather than starting froma finished portland cement. This ratio has not varied much inrecent years.
Clinker.—Table 5 lists district-level information on clinkerproduction, capacity, capacity utilization, and yearendstockpiles. Output of clinker increased by 2.8% to 78.1 Mt in2000, yet another record. As with cement, clinker production in2000 reflected a 0.3% increase owing to the 1-day longer leapyear. The increase was widespread, with only a few districts(Illinois, Kentucky, Mississippi, and Tennessee; Arizona andNew Mexico; and northern California) showing declines, andmost of these were small. As in 1999, clinker was produced bya total of 111 integrated cement plants, operating 201 kilns. Two of these plants and kilns were in Puerto Rico. About 70%of the plants used dry-process kiln technology. Two facilitiesoperated both wet and dry kilns, and one facility completed itskiln conversion during the year from wet to semidry technology(listed as dry in table 5).
California, Texas, Pennsylvania, Missouri, and Michigan, indescending order, remained the top five clinker-producingStates in 2000. Combining companies as much as possibleunder common ownership, the top 5 companies had 49% oftotal U.S. clinker production and capacity, and the top 10companies had about 72% of both. The top 10 companies, indescending order of production, were CEMEX (includingSouthdown), Holnam (remained first in capacity, however),Lafarge, Lone Star, Lehigh, Ash Grove, Essroc, Blue Circle, RC
Cement, and TXI.Apparent clinker capacity increased by 4.0% to 89.3 Mt/yr; as
with production, the capacity statistic benefited from theadditional workday in 2000. Capacity utilization fell slightly to87.5% (from 88.5% in 1999), but there continued to be onlyvery few districts that showed utilization rates below 85%. Thelow rate in Indiana was due to a kiln conversion (upgrade)shutdown for part of the year. With few exceptions, thecapacity utilization rates depict an industry at full practicableproduction levels nationwide.
Annual clinker capacity and capacity utilization data aresensitive to reporting errors related to the classification of kilndowntimes. For each kiln, apparent annual capacity iscalculated as the reported daily capacity times the “expectedworking year,” which is the full year (366 days in 2000) minusthe number of days that the kiln was shut down for routinemaintenance. Emergency shutdowns, scheduled shutdowns forplant upgrades, and those for slow market conditions are notcounted, except to the extent that they overlap the days plannedfor routine maintenance. Typically, one or two outages, totaling1 to 4 weeks, are scheduled for annual routine maintenance, andthis work mostly revolves around replacement or repair of therefractory brick linings in kiln and other pyroprocessingequipment. Company interpretations vary, however, as to whatshould be counted as routine maintenance, and thoseinterpretational differences affect the length of the expectedworking year and hence the calculated annual capacity. Thisdowntime uncertainty or sensitivity means that small changes inregional annual capacity or capacity utilization have little, ifany, statistical significance. This differs from the grinding(cement) capacity data noted earlier, which are directly reportedby the plants. The daily clinker capacities listed in table 5should be viewed with caution as they are particularly sensitiveto propagation of rounding errors.
Within the above constraints, average plant clinker capacityin 2000 was 0.82 Mt/yr, up by 3.7%, and average kiln capacitywas 0.45 Mt/yr, up by 4.4%. Plants operating only dry(including one semidry plant) process kilns produced 75.5% ofthe total clinker (table 7), those operating wet kilns accountedfor 22.5% of the clinker, and the two plants that operate bothtypes of kilns contributed the remainder. The dry kilncontribution in 1999 was 73.7%.
Yearend 2000 clinker stockpiles totaled 5.3 Mt, up by 1.5 Mt,but the significance of this is uncertain. Clinker stocks aregenerally built up ahead of planned kiln shutdowns, most butnot all of which are held in the winter months. Some clinker isalso imported. Nevertheless, the yearend increase in 2000 is inline with reported monthly clinker production increases late inthe year (and in all other months except May) combined with an11% drop in portland cement sales in November and a 17%drop in December. The stockpile increase, combined with anincrease in production, is consistent with the decline of 0.8 Mtin clinker imports for the year (table 22).
Raw Materials and Energy Consumed in CementManufacture.—Nonfuel raw materials used for cementmanufacture may be divided into materials used to make theclinker and those added subsequently in the grinding phase(finish mill) to make the cement itself. The differentiation isprimarily of environmental interest; materials used to makeclinker are burned in the kiln and are associated with variouschemical changes and emissions; those used in the finish mill

CEMENT—2000 17.7
are merely comminuted. Table 6 lists these materials as well asthe amount of imported (foreign) clinker ground. About 1.7 t ofnonfuel raw materials are needed to make 1 t of clinker, and theratio also approximately holds to make portland cement(provided that the foreign clinker used to make cement is alsoback-converted to raw materials). Limestone or othercalcareous materials account for about 87% of the total rawmaterials required. The mass ratios among various major rawmaterials were essentially the same for 2000 and 1999. Thelisting of materials under headers like “Calcareous” and“Siliceous” is to some degree artificial because many of the rawmaterials supply more than one oxide.
The clinker versus cement differentiation of nonfuel rawmaterials is subject to reporting errors, as this was not requestedprior to the 1998 survey and some plants remain unaccustomedto it. Accordingly, some of the increases in 2000 may simplyreflect improved reporting rather than a net change in trueconsumption. Additionally, some materials may beinconsistently classified from year to year or among plants. Forexample, one plant’s limestone might be another’s cement rock;likewise with clay and shale and among the several ferrousslags. Furthermore, some materials are generally not routinelyfully measured by the plant, most notably CKD, where thecomponent automatically recycled to the kiln is generallyunmeasured. Accordingly, the CKD consumption listed in table6 (clinker column) is substantially too low. Increasingenvironmental interest in CKD may lead the industry to beginmeasuring this material more completely in the future.
Among the siliceous raw materials, some of the pozzolansappear to be out of balance with the sales (as a proxy forproduction) of blended cements listed in table 16. This is trueespecially for GGBFS, consumption of which is much too highfor the sales of the appropriate blended cement. Theexplanation for this is that most of this slag was not consumedby the cement industry to make blended cements but was usedas a grinding aid in States that allow an addition of a minoramount (up to about 3%) of GGBFS within Type I portland. However, the amount of GGBFS listed in table 6 is perhapsonly 10% of the true consumption of this material by,ultimately, the concrete (especially ready-mixed) producers,who buy GGBFS directly from slag processors and blend it as apartial portland cement substitute into their concrete mixes. Likewise, the amount of fly ash listed in the table 6 cementcolumn is but a small fraction of the roughly 9 Mt/yr of thismaterial purchased directly by the concrete industry for use as acement extender (American Coal Ash Association, 1999). Itshould be reiterated that table 6 reflects consumption by thecement producers, not the concrete manufacturers. The largeincrease in steel slag consumption (for clinker) in table 6appears to reflect the increasing popularity of the CemStarprocess developed by TXI, as discussed earlier.
Table 7 lists the consumption of fuels by type of kiln process. Many cement plants are able to switch among a variety ofprimary fuel types, and many routinely burn a mix of fuels. It isdifficult to analyze changes in the ratios among fuels on anational basis, save that the high costs of petroleum-based fuelsand natural gas in 2000 led to widespread shifts back to coaland increased use of solid and liquid wastes. The decline in useof waste tires is surprising but may reflect unreported problemswith environmental permits held or sought by specific plants. Itcould also represent data omissions or misinclusion of tires in
the “Solid” waste rather than “Tires” category.As in past years, dry plants produced the majority of the
clinker and consumed the majority of fuels (although less fuelper ton of clinker), with the exception of wet processconsumption of liquid waste fuels. High production costsassociated with the wet kiln process made the cost savingsachievable through use of liquid wastes (which the plants arepaid to take) very attractive, and the very long residence timesin the kilns made for environmentally efficient burning of thismaterial.
Table 8 lists the consumption of electricity by the cementindustry, differentiated by process type. As expected, dryprocess plants had a higher average unit electricity consumptionthat wet kilns, reflecting the complex array of fans and blowersassociated with modern dry kilns. The average unitconsumption for dry plants increased slightly in 2000, possiblyreflecting the inclusion of one semidry plant that was convertedfrom wet technology during the year. The large increase in unitconsumption by plants operating both wet and dry kilns is oflittle significance, as it represents only two plants. The increaselisted for grinding plants, which follows a decrease in 1999,may reflect increased output of GGBFS from some of theseplants. Slag-processing plants have higher unit electricityconsumption levels than do cement mills because slag is harderto grind and is ground finer than clinker.
Consumption
Apparent consumption of cement is listed in table 1 and roseby 1.5% in 2000 to 110.5 Mt. Although apparent consumptionis a standard statistic for comparing consumption of variouscommodities, the measure of consumption preferred by thecement industry for its market analyses (because the data areavailable monthly and are sourced directly from the cementcompanies) is that of cement sales or shipments to finalcustomers. These monthly data are listed totaled for 1999 and2000 in tables 9 and 10. Consumption (sales) in 2000 ofportland and masonry cement rose by 1.0% to 109.7 Mt. Thedefinition of “final customer” is left to the reporting cementproducer, but is generally understood to include concretemanufacturers, building supply dealers, constructioncontractors, and the like. The monthly data are collected interms of the destination of sales (location of final customer, i.e.,consumption by State), and by State or country of origin(manufacture). Although the monthly reports differentiatebetween portland cement and (portland-based) blended cement,both are included in the term “portland cement” in this report(including table 9).
Tables 11 through 16 list various annual survey data on orderived from shipments of cement reported by cementproducers and import terminals. Some of the data, especiallythose in tables 12 and 13, look superficially similar to the datain tables 9 and 10, but there are important differences betweenthe two data sets, particularly for portland cement. Tables 9 and10 show the larger totals, and these data are believed to be morecomplete (especially regarding imported cement) and thus abetter measure of true consumption levels. Tables 9 and 10 alsoshow the true location of the sales (customers) for the cement;however, the cement could have been sourced elsewhere. Incontrast, the regional data in tables 12 through 16 simply reflectthe location of the reporting facilities, not their customers nor

U.S. GEOLOGICAL SURVEY MINERALS YEARBOOK—200017.8
necessarily where the cement was manufactured.Examination of the data for Michigan and Ohio will illustrate
the interpretational difference between the two data sets. Michigan consumed 3.5 Mt of portland cement in 2000 (table9), but Michigan producers shipped almost 5.8 Mt (table 12) tofinal customers, not necessarily all in Michigan. Michigan wasthus a net exporter of cement. Ohio consumed 3.9 Mt ofportland cement, but its producers (and terminals) shipped only1.2 Mt (table 12). Ohio was thus a net importer of cement. Nonproducing States like New Jersey import all of the cementthey consume (table 9).
National Consumption.—In 2000, portland cementconsumption grew by only 1.1% (compared with 5.0% in 1999)but still achieved a new record of 105.3 Mt (table 9). Theimported cement component of this fell by 2.5% to 21.9 Mt; thedecline was mainly because of domestic production increases,but imports still were about 21% of total consumption. However, the cement import volumes understate the importanceof imports, because the country also brought in 3.8 Mt ofclinker (table 22), equivalent to about 3.9 Mt of portlandcement, so the true import dependence for portland cement in2000 was closer to 25%. Masonry cement consumptiondeclined by 0.5% to 4.3 Mt from the record level of 1999. Theimport component of this was only about 1%.
Because cement is a key construction material, growth incement consumption reflects trends in construction spending. Overall construction spending levels increased by 2.1% in 2000(relative to revised 1999 data) to $706.9 billion (constant 1996dollars), according to U.S. Census Bureau data quoted by thePortland Cement Association (2001). Within this total,residential construction grew by 2.1% to $323.7 billion, ofwhich single-family dwellings accounted for $204.8 billion, upby 1.1%. Despite continued very low mortgage rates, theresidential construction growth rate in 2000 was modestcompared with the 6% level seen in 1999 and reflected agenerally slowing economy; much of the growth was inresidential improvements rather than new units. Privatenonresidential construction grew by 3.6% to $179.7 billion,powered by a 12.0% increase in office construction to $47.6billion. This performance likely reflects the long lead times onorders placed in 1999 or earlier. Industrial construction fell by6.2% to $27.4 billion and followed a 17.2% drop in 1999. Public sector construction spending was essentially stagnant(down by 0.2%) in 2000 at $151.8 billion. Public buildingconstruction increased by 2.8% to $70.4 billion. The importantroad construction component of public spending fell by 3.6% to$45.2 billion, a disappointment given the anticipated increase inspending related to TEA-21 funding, and the 8.8% (revised)spending increase in 1999. The explanation, in part, was that ahigher than anticipated percentage of TEA-21 work during 2000was for repairs rather than for more concrete-intensive newconstruction. Further, the slowing general economy wasapparently hurting State revenues and hence State contributionsto projects that involved joint State and Federal fundingsources.
In contrast with recent years, the growth rate in overallconstruction spending in 2000 was higher than that, in tonnageterms, of portland plus masonry cement consumption. In thelatter half of the 1990s, an increase in “penetration rate” (tons ofcement consumed per million dollars of construction spending)was seen more or less each successive year. The improved
penetration rate was generally credited to promotional efforts bythe cement industry, in some years aided by moderate (relativeto other construction materials) cement price increases. Forexample, in 1996, $1 million in construction spending “bought”147.9 t of cement, and in 1999, $1 million (in 1996 dollars)“bought” 156.7 t of cement. Despite the virtually stagnantcement prices in 2000 (see “Values” subsection that follows),the penetration rate per $1 million (1996 dollars) declined to155.2 t. The reasons for the decline are unclear, but probablyinclude a combination of factors. Ignoring speculation onconstruction spending data accuracy (caused by to reportingdelays, for example) and the likelihood of revisions to the 2000inflation rates, major factors could be lag times in constructionschedules relative to payment reporting, construction design(i.e., use of concrete versus competing construction materials),construction categories (e.g., single family versus multiplefamily dwellings versus roads versus factories, etc.), and type ofwork (e.g., concrete-intensive new construction versus lessconcrete-intensive repairs). Regarding the type of work, itmight be speculated that, in a slowing economy, newconstruction might be deferred in favor of repairs to existingstructures. Another factor, although difficult to quantify, is thefact that even the USGS monthly cement surveys do not capture100% of the cement imports, but these missing imports arebeing consumed nonetheless. If this missing material amountedto just 1 Mt more in 2000 than in 1999, the penetration rate for2000 would be unchanged from that in 1999. Yet anotherfactor, also difficult to quantify, is that the true totalconsumption of hydraulic cement in the United States wouldinclude that of cementitious or pozzolan extenders boughtdirectly by the concrete producers. These extenders have beenmentioned in the raw materials discussion in the “Production”section and also will be discussed in the “Types of PortlandCement Consumed” subsection that follows; the tonnagesinvolved (especially pre-1998) are not known with certainty, butwould likely be in the range of 7 Mt/yr to 12 Mt/yr for theperiod 1996-2000. Finally, total construction spending involvesmany material and other costs (e.g., labor) besides those forcement or concrete.
Table 9 lists consumption of portland cement by State, andthe general origins of the (total) cement consumed. About halfof the States showed consumption declines, although many ofthese were small and likely would have registered a net increasefor the year but for cold-weather-induced declines almostnationwide in November and December. Consumptionincreases were maintained in most of the strong-performingStates of recent previous years, although strong increases (of 0.1Mt or more) were seen only in California, Colorado, Florida,Nevada, and Virginia. Texas, usually a strong performer,managed to eke out a modest increase courtesy of the northernhalf of the State. Overall, in contrast with recent years,consumption in the southeastern Atlantic and Gulf Coast Stateswas generally weak throughout the year, notably southern Texas(except during the summer). Several of the Rocky MountainStates, notably Utah, showed a slowdown in consumption,although Nevada remained very strong. Consumption groupedby census district is listed in table 10. In terms of portlandcement, the 10 largest consuming States, in declining order,were California, Texas, Florida, Ohio, Illinois, Michigan,Georgia, Pennsylvania, Arizona, and New York. Thesecombined had 53.5% of the U.S. total consumption.

CEMENT—2000 17.9
Consumption of masonry cement also declined in about halfof the States, but most of the declines were small. As noted inthe “Production” section, data for masonry cement sales to finalcustomers (table 9) underrepresent true consumption because itis common for masonry cement to be mixed from components atthe job site rather than being brought in as a finished product. Also, the data exclude the output of a small number of smallmasonry cement blending plants, which are treated instead asfinal customers for portland cement. The very small (reported)consumption decline is likely because of to late year coldweather construction delays compared with the warmer 1999winter.
Table 11 lists portland cement shipments to final customers interms of transportation method. As in previous years, bulkdeliveries by truck directly from plants or via terminalscontinued to dominate deliveries to customers. In contrast,railroad and waterborne transport were the most importantmethods of shipping cement from plants to terminals.
Values.—Tables 12 through 14 list mill net values providedby the plants and import terminals for their total shipments todomestic final customers of gray portland cement, whitecement, and masonry cement. Because value data are highlyproprietary and some companies express misgivings aboutproviding value data of any type, values are not requested forshipments by individual types of portland cement. However,the tonnages shipped, by type, are reported (table 16). For thevalue of total shipments, no distinction is made between bulkand container (bag) shipments; however, container shipmentswould be expected to have higher unit values. Regional valuesfor white cement have been lumped with those for gray portlandcement, with the exception of the national total for white intable 14. Fewer than 10% of respondents to the 2000 surveydeclined to provide mill net value data—a modest improvementfrom the 1999 survey. Where value data were not provided,values supplied by plants in the same market area wereaveraged and applied as an estimate.
Mill net values for integrated plants can be defined as the(sales) value at, or free on board (f.o.b.), the manufacturingplant, including any packaging charges but excluding anydiscounts and shipping charges to the final customers. Forindependent terminals, particularly import terminals, theequivalent statistic sought would be the terminal net value. Inthe case of imports, this would essentially represent the cost,insurance, and freight (c.i.f.) value of the imports plusunloading and storage costs plus the terminal’s markup.
Because the values listed in table 12 incorporate more thanone type of portland cement, in both bulk and bag shipments,and some overall estimates, readers are cautioned that the valueslisted should be considered to be estimates, even though theyare presented unrounded. Indeed, the mill net values are betterviewed as price indices for cement, suitable for crudecomparisons among regions and during time. Most especially,the unit value data cannot be viewed as actual shopping pricesfor cement. The data for portland cement are assumed to bedominated by bulk sales of the Types I and II varieties.
The average mill net value of portland cement in 2000 was$77.34 per ton, up by only 0.2%— a change of no statisticalsignificance. Combined with a 2.4% increase in shipmenttonnage (table 12), the total value of shipments rose by 2.6% to$7.8 billion. The same average unit value applied to the largerportland sales tonnage in table 9 yields a total value of $8.1
billion, up by 1.4%. The lower percentage increase in the valueof the table 9 sales reflects the inclusion therein of a highertonnage of (inexpensive) imported material than in table 12. Although the tonnage of imported cement grew by 0.7% in2000, the unit value of the imports fell by 2.2% to $49.57 perton (tables 18-22). Another constraint on portland cementprices continued to be that ready-mixed concrete companies(customers), for cost and performance reasons, were using asubstantial fraction of cementitious or pozzolanic extenders intheir mixes, which they would blend themselves, and were thusbuying less straight or blended portland cement than they wouldhave otherwise. By comparison with the average customs value(comparable to mill net plus, possibly, shipping to the exportterminal) of imported gray portland cement, which was $35.50per ton (table 20), and which is a rough indicator of sales pricesin foreign countries, U.S. sales prices were very high by worldstandards. This made the United States a very attractive exporttarget for many foreign producers.
Table 13 lists masonry cement sales and values in terms of thelocation of the reporting facilities. The average unit value ofsales rose by 4.1% to $107.42 per ton and total sales rose by2.6% to $459 million ($465 million for the volume in table 9). It should be noted, however, that the mill net values formasonry cement contain more component estimates than thosefor portland cement, and for a number of respondents, themasonry cement mill net values appear to have been reported ona bulk-equivalent basis instead of being inclusive of baggingcharges.
Table 14 is a summary of cement unit values for the countryoverall. The data for white cement should be viewed withcaution because there are only a few producers and importers ofthis product, and a significant share of white cement sales tofinal customers is as (marked up) resales by gray cementcompanies. Additionally, white cement includes a largercomponent of relatively costly package shipments, of importedmaterial, and of estimates overall. Thus, the 4% unit mill netvalue decrease in 2000 to $159.45 per ton, if real, may not bestatistically significant. A discussion of prices for importedwhite cement is given in the “Foreign Trade” section thatfollows.
The only data for domestic delivered prices for cement arethose for Type I portland (per short ton) and masonry cement(per 70-pound bag) published monthly by the journalEngineering News-Record. The data represent a survey ofcustomers, which most likely are ready-mixed concreteproducers for portland cement and building supply depots formasonry cement, in 20 U.S. cities. The 20-city averagedelivered price in 2000 for Type 1 portland cement converts to$88.79 per metric ton, up by 1.7%, and ranged by only $1.29per ton during the year. In contrast to some recent years, pricesdeclined in the fourth quarter from their summer highs,reflecting cold-weather-related construction activity declines inthe winter. The $12.18 difference between the EngineeringNews-Record average price and the average mill net value forgray portland cement in table 14 is an indicator of theapproximate average delivery charge for bulk cement. This wassignificantly higher than the $10.86 per ton delivery differentialin 1999 and likely reflects, at least in part, the higher fuel costsin 2000. District variations in mill net values in table 12 do notparallel very well the variations among Engineering News-Record prices for comparably located cities, possibly reflecting
U.S. GEOLOGICAL SURVEY MINERALS YEARBOOK—200017.10
local transportation and related variables and the fact that themill net regionality (table 12) reflects the location of the surveyrespondent, not the customer. The Engineering News-Record20-city average for masonry cement in 2000 was $6.23 per bag,which literally converts to $196.21 per ton and which was a26% increase from the price in 1999. The average price and theprice shift both greatly exceed the $107.42 per ton (up by 4%)mill net value shown in tables 13 and 14. The large differencesfor masonry cement would seem excessive, even accounting fora large component of packaging, handling, and (higher) deliverycharges, and may reflect price reporting inaccuracies in either orboth surveys.
Cement Customer Types.—Data on (portland) cement usageis collected on the basis of the types of customers to whom thecement is sold (table 15) rather than the direct application itself. The distinction is that a given customer, although classified inone category, may in fact have used the cement in more thanone way. The data in table 15, as with values, areapproximations. The main reason for this is that the surveysrequest more details (user categories) than many respondentsare able to provide. Although much improved in recent years’surveys, there remain a number of companies or plants thateither do not track their customers by user type at all or do soonly broadly. A persistent problem is that of overlap ofcategories, the most common example of which is in cases where the customer is a ready-mixed concrete producer that isalso engaged in road paving. The dilemma for the respondent iswhether to assign the sales to the “Ready-mixed concrete” or tothe “Contractors—road paving” subcategory on the form orwhether to attempt a split. Further, for several user categories,the subset “Other” commonly gets used as a catch-all insteadand is thus overused. Where estimates are made, either by thecompanies themselves or by the USGS, there is a bias towardsthe major usage categories; the minor categories are, therefore,likely underrepresented. As with the shipment data in table 12,the regional divisions in table 15 are the locations of therespondents, not the customers.
Notwithstanding these limitations, a number of comments oncement user types in 2000 can be made. As in past years, thedominance of ready-mixed concrete producers in the cementmarket is very evident. Ready-mixed concrete companiespurchased almost 75 Mt of portland cement in 2000, or almost74% of total sales, although there is undoubtedly significantoverlap with the almost 5 Mt assigned to road pavingcontractors (table 15, footnote 5) and with the 1 Mt assigned tothe “Government and miscellaneous” category. Compared withthe respective levels in 1999, the ready-mixed tonnage in 2000was up by 3.4%, the road paving category was down by 18%,and the two combined increased by 1.8%. Because the ready-mixed plus road paving combination would be expected toclosely track the 2.4% increase in total (all categories) portlandcement sales, some of the ready-mixed tonnage would be betterassigned to the road paving category. That the road pavingtonnage is likely too low is further supported by the 3.6%decline in road and highway construction spending notedearlier. A transfer of just 0.9 Mt, either all from the ready-mixed category or split 50-50 with the “other or unspecified”contractor subcategory, to the road paving category wouldshrink the road paving tonnage decline for the year to 3.6%. But this would not be statistically justified given that the overallerror range in the table 15 data likely exceeds this adjustment
amount significantly. Further, the tonnages do not reflect someof the imported cement used by ready-mixed concretecompanies and road pavers.
Portland cement sales to concrete product manufacturersincreased by 10.4% to 13.5 Mt, with sales to brick and blockmanufacturers up by 9.1% to 6.1 Mt; precast concretecompanies, up by 22% to 3.1 Mt; and pipe manufacturers up by8.2% to 1.7 Mt (table 15, footnote 4). These growth ratesexceed those for building construction noted earlier, but thismay not be suspicious given the large component of valueadded in building construction. Overall consumption bycontractors fell by almost 13% to about 7.1 Mt, with largepercentage declines seen in all the specific categories, not justroad paving (table 15, footnote 5). These declines, again, seemto be out of step with the construction spending levels notedearlier but in part may reflect consumption of imported cementnot captured by the annual survey. Sales to building materialsdealers fell by 16.3% to 3.5 Mt, which would appear to be outof phase with the increased spending levels for residentialconstruction; the decline probably, at least partially, reflectsincomplete reporting.
The general category “Oil well, mining, waste” lumps minorcategories that are prone to underrepresentation. Portlandcement sales to customers engaged in oil well drilling were upby 41% to 1.2 Mt (table 15, footnote 6), although the rate ofchange is out of line with the almost 80% increase, to 1.0 Mt, insales of oil well cement (table 16). The discrepancy is hard toevaluate because the user tonnage is likely underreported, andordinary types of portland cement (e.g., Types I, II), which tendto get assigned to major use categories, can be used for shallowoil wells in lieu of specialized oil well cements. A largeincrease in such sales was expected, however, given highercrude petroleum prices and drilling levels during the year. There was an almost 48% increase in the average weekly BakerHughes (oil and gas drilling) rig count for 2000 (Oil & GasJournal, 2001). Reported sales to mining companies fell by28%, but the data are likely incomplete and subject to largerelative errors because of the small tonnages involved. A largedecrease in 2000, however, was expected given generallydepressed metal commodity prices during the year andanecdotal accounts of mine closures and layoffs. Cement isused by mining companies as an agglomeration agent for heapleaches and in concrete for machinery foundations and forbackfill of underground excavations.
Types of Portland Cement Consumed.—Sales to finalcustomers of varieties falling within the broad definition ofportland cement are listed in table 16. In 2000, Types I and II,combined, accounted for 88% of total portland sales, a typicalproportion though slightly lower than in 1999. As noted in theintroduction, the annual survey tonnages (e.g., table 16) aresmaller by several million tons than those derived from themonthly surveys. It is believed that most of the “missing” tonsare imports, and it is known that the great majority of cementimports are of Type I and II portland. Accordingly, the entriesfor Types I and II and the grand totals in table 16 could beaugmented by about 5 Mt and 4 Mt in 1999 and 2000,respectively. Minor augmentations would also be justified forthe white cement and Type V categories. Reported sales ofType V portland cement jumped by 46% in 2000, but much ofthis increase can be accounted for by a reclassification of someType I and II material made and sold in California based on its
CEMENT—2000 17.11
actual chemical performance (Type V cements exhibit highsulfate resistance).
Blended cement sales in 2000 grew by 8.6% to 1.3 Mt,representing 1.3% of total portland cement sales, about the sameas in 1999. The 2000 sales (table 16) of blended cements areslightly higher than those derived from the monthly surveys (1.2Mt and 1.2% of total portland plus blended sales), but thedifference appears to be of little statistical significance. Overall,the proportion of total blended to total portland cement saleshave remained virtually unchanged during the past severalyears, despite anecdotal evidence that concrete producers(particularly of ready-mixed product) have increased their useof cementitious extenders during this period. Evidently,although blended cement paste is becoming more popular withthe concrete producers and their customers for cost andperformance reasons, the concrete companies find it cheaper todo their own purchasing of extenders and their own blendingrather than purchasing blended cements from the cementcompanies.
Notwithstanding similar total blended cement sales tonnagesduring the years, the ratios among specific types of blendedcement have been variable. In 2000, sales of blends containingnatural pozzolans fell by almost 16% (relative to levels in 1999)to 0.2 Mt; those of blends containing GGBFS rose almost by29% to about 0.4 Mt; sales of blends with fly ash rose by 27%to 0.4 Mt; and sales of miscellaneous blended cements (e.g.containing CKD or silica fume) dropped by 9% to 0.3 Mt. Incontrast, sales in 1999 (relative to 1998) of natural pozzolanblended cements declined by 19%; blends with GGBFS were upby 81%; those with fly ash were down by 27%; and those withmiscellaneous pozzolans rose by 47%. For the 2000 blendedcement sales, the tonnages listed are in line with the rawmaterials consumption (for cement rather than clinker) shown intable 6, except for blends with GGBFS and “Other pozzolans.” The comparisons assume a typical pozzolan content in blendedcement of 15% to 30% and that none of the pozzolanconsumption in table 6 was for masonry cements. For GGBFS,the consumption for cement listed in table 6 is two to threetimes the amount needed to make the blended cement sold (table16). The excess represents material used in the finish mills as agrinding aid; this is permitted within Type-I portlanddesignations in some States provided that the slag content in thecement does not exceed about 3%. Although actualconsumption data were lacking, based on the reported capacitiesof various slag-grinding facilities, it may be estimated that theamount of GGBFS consumed to make cement (table 6) is likelyonly about 10% of that which ultimately makes its way intoconcrete. Likewise, the amount of ash consumed for cement isonly a small fraction of the 9 Mt reported as consumed forcement (other than for clinker) and concrete manufacture in1999 (American Coal Ash Association, 1999) and probably in2000 (actual 2000 data are unavailable); the inference is thatmost of this consumption is directly by the concretemanufacturers.
White portland cement sales increased by about 5%, but someof the cement may represent material that was actually soldwithin a white or colored masonry product. Oil well cementsales rose by almost 80%, reflecting substantially increaseddrilling activities during the year.
Foreign Trade
Tables 17 through 22 list trade data from the U.S. CensusBureau. Exports of hydraulic cement and clinker (table 17)increased in 2000 but, excepting sales to Canada, wereessentially insignificant, and overall, the exports continued to beof almost no consequence to the U.S. cement economy. Almostall of the exported material was cement.
The U.S. cement economy continued to be significantlyimport dependent, although total imports of hydraulic cementand clinker (tables 18-19) declined by 2.3% to 28.7 Mt(including Puerto Rico). This was the first annual decline since1992 and reflected a combination of a slowing growth indemand and an increase in domestic production capacity. Theimport tonnage decrease was in stark contrast to increases of22% in 1999, 37% in 1998, and 24% in 1997. The 2000tonnage represents approximately 25% of the total world tradein cement and clinker, based on global estimates (InternationalCement Review, 2001). The average unit c.i.f. value of importsfell by 1.4% to $48.72 per ton; the decline was a combination ofa 4.0% decrease in base (customs) value to $37.44 per ton andan 8.4% increase in combined shipping (mostly fuel-related)and insurance costs to $11.28 per ton.
The hydraulic cement component of imports (derived bysubtracting clinker imports in table 22 from the table 18 data)totaled 24.9 Mt, virtually unchanged from that in 1999. Grayportland cement imports were 95.7% of this total and were upby only 0.7% (table 20). The c.i.f. value of gray portlandcement imports fell by 2.3% to $46.65 per ton, within which thecustoms value fell 5.1% to $35.50 per ton, and the freight andinsurance charges rose by 7.7% to $11.15 per ton. In 1999, thecustoms value had fallen by 4.7% and the shipping charges hadrisen by almost 10%. The total c.i.f. value of gray portlandimports fell by 1.7% to $1.11 billion. Customs values in 2000ranged from $21.13 per ton for cement from the Philippines to$51.81 per ton for Canadian cement. Shipping charges rangedfrom $3.43 per ton from Canada (railroad) to $24.07 per tonfrom the Philippines, but there was considerable overlap ofshipping charge rates among various source countries andregions and the cement landing points (table 19); because of thisoverlap and the large number of variables within shippingcharges, no firm shipping charge trends could be discerned. Asnoted in the “Values” subsection, the customs values listed aremuch lower than the U.S. mill net and/or terminal net values ofportland cement sold to final customers (tables 12 and 14),making the United States an attractive market for surplusforeign production, and making it relatively easy for U.S.importers to absorb rising transportation costs, even for materialsourced from vast distances.
Although Thailand replaced Canada as the largest singlesource of hydraulic cement and clinker imports combined, in2000, Canada remained the largest source of gray portlandcement (table 20). Gray portland imports from Canada fell by3.5% in 2000 to 3.9 Mt. Thailand was second, with 3.6 Mt, upby 16.3%. China, which had been second in 1999, was thirdwith 3.3 Mt, down by 19.3%.
White cement imports are listed in table 21, and rose byalmost 12% during the year to 0.92 Mt. The unit value (c.i.f.)rose by 1.2% to $110.70 per ton. However, this average valueand several of the specific country annual average values appearto be too low (see, for example, the entries for Norway and

U.S. GEOLOGICAL SURVEY MINERALS YEARBOOK—200017.12
various Asian countries), reflecting very low unit values oncertain individual monthly shipments (not shown). Likewise,the import tonnage appears to be too high. Unless reflectingdumped material, the most likely explanation for the low unitvalues is that the data include some gray portland cement,supposed to be reported under the Harmonized Tariff Scheduleof the United States (HTS) code 2523.29.00 or that theimporters mistakenly invoiced under the white cement HTScode (2523.21.00). Coding errors are difficult to verify, butpast experience indicates that they do occur, thoughinfrequently. Apart from the low overall value, evidence formisinclusion of gray cement is also found in some pricedifferences between imported gray and white portland cement. For example, the 2000 imports of white cement from Indonesiacalculate to a (suspiciously low) unit value (c.i.f.) of $54.61 perton, which was only $10.43 per ton more than the unit value forimported Indonesian gray portland cement. This white cementpremium is far smaller than normal, even considering expectedgeneral variability because of the imports perhaps comprising amix of bulk and bag shipments. For U.S. cement importsoverall, the premium for white cement was $64.05 per ton, andthat for overall sales (table 14), $82.84 per ton. Finally, thewhite cement import tonnage appears to be out of line with themarket for this material. Although the white cement market isvery difficult to analyze—it being a fairly specialized productthat is sensitive to a relatively small number of individualconstruction projects—the import tonnage increase exceeds theconstruction spending trends noted earlier. A final indication ofproblems with the white cement import data is that the totalimport volume exceeds the total white portland cement salesvolume in table 16, which is inclusive of sales of domesticallyproduced material. The excess appears to be much larger thancould be reasonably accommodated by apportioning someimports to masonry cement sales (not included in table 16) or toyearend stockpiles. However, despite misgivings about some ofthe entries in table 21, the data therein for at least the majorcountry sources calculate to realistic unit values and thus appearto be accurate. In 2000, Mexico was the largest source of whitecement imports, followed by Canada, Denmark, and Spain.
Imports of clinker are listed in table 22. Total imports in2000 fell by 17.7% to 3.8 Mt, and the unit c.i.f. value of theimports rose by 1.8% to $43.13 per ton. However, the data forboth years are bolstered by the inclusion of a small quantity ofvery expensive aluminous cement clinker from France, thecement from which has very different applications than thosefor portland cement. If the French material is removed, the totalremaining imports drop to 3.7 Mt (down by 17.1%), at a unitcustoms value of $29.41 per ton (down by 3.7%), and a unitc.i.f. value of $40.13 per ton (up by 2.2%).
Thailand continued to be the largest country source of theclinker imports, followed by Canada, which had been the largestsource in 1999. The remaining major suppliers of clinker to theUnited States, in decreasing order, were Turkey, Colombia,China, and the Republic of Korea; neither Korea nor Turkeyhad supplied clinker to the United States in 1999. Excludingaluminous cement clinker, customs values for imported clinkerranged from $18.70 per ton for Chinese material to $51.42 perton for imports from Canada. Thailand clinker had an averagecustoms value of $19.82 per ton. Because of shipping costs, theprice range was less extreme on a c.i.f. basis: Chinese clinkerwas $27.22 per ton, Canadian clinker was $53.67 per ton, and
Thailand clinker was $35.10 per ton.Imports of cement and clinker, by customs district of entry,
are listed in table 19. New Orleans continued to be by far thebusiest entry point for both cement and clinker; Detroit hadbeen the largest clinker import venue in 1999. Much of thematerial coming into New Orleans was destined to betransferred onto barges for transport up the Mississippi Riversystem. In terms of serving local markets, the largest cement-importing States were California, Florida, and Texas.
World Review
Individual country cement production data are listed in table23. The data for some countries may include their exports ofclinker. Although the data are supposed to include all forms ofhydraulic cement, the data for the United States are for portlandplus masonry cement only, and the data for some other countriesalso may not be all inclusive. Because data for many countriesare estimated, the annual world totals (which have beenrounded) must be viewed as estimates. As estimated, worldhydraulic cement production increased by about 2.5% in 2000to 1.64 Gt.
With production reported at 583.2 Mt, China was by far thelargest cement producer in the world in 2000. Although precisedata are lacking, India was in second place, and the UnitedStates was in third. The remainder of the top 15 cement-producing countries in 2000, in decreasing order, were Japan,the Republic of Korea, Brazil, Germany, Italy, Turkey, Russia,Thailand, Mexico, Spain, Indonesia, and Egypt. These top 15countries accounted for about 75% of total world productionand much of the growth in world production in the past decade. China alone, since 1995, has increased its output by 107 Mt/yr.
On a regional basis, Asia again accounted for about 59% ofthe world total production. This region, particularly SoutheastAsia, was slowly recovering from the economic crisis thatbegan in late 1997, and local cement production andconsumption levels among the major cement economiesincreased in 2000; consumption, however, had yet to recover toprecrisis levels. This meant that there were still substantialregional cement surpluses available for export at low baseprices. Because of higher fuel (hence transportation) costs andgenerally weaker economies in the export target countries(particularly the United States), the cost advantage of importingcement from Southeast Asia was somewhat less than in 1999.
Europe retained its position as the second largest producingregion; Western Europe accounted for 11.6% of worldproduction, and Eastern Europe, 2.6%. North America,including Mexico, was the third largest producing region, with8.1% of the total, and Latin America and the Caribbean had5.4% of world output (this would be 7.3% if Mexico wereincluded here). The Middle East, including Turkey, produced6.3% of the world’s cement, and Africa contributed 4.4%. Countries of the former Soviet Union produced only 2.9% ofthe world’s cement in 2000 but had a great deal of surplusproduction capacity available.
There continued to be a large number of cement plantconstruction and/or modernization projects throughout theworld, in many regions spurred by privatization programs andby the need for plants to conform to increasingly universal andstricter environmental standards. Much of the internationalinvestment was by a few major international cement companies,

CEMENT—2000 17.13
most based in Europe. For the most part, these were the samecompanies that controlled the U.S. cement industry. Geographic diversification of holdings was seen as anadvantage, as it allowed a spreading of investment risk amongmany countries, a market share in regions of large economicgrowth potential, and access to a diversity of supply sources asneeded. Many of the new plants under construction were verylarge, and many were geared, at least partly, to exports.
Outlook
Cement industry analysts at yearend were anticipating fairlystagnant or declining market conditions in 2001, followed by asmall decline in demand for the next year or two, followed by aresumption in steady demand growth, albeit at modest rates of1% to 3% per year, for the next few years thereafter. Thepessimistic short-term outlook was based in part on the cold-weather-induced drastic falloff in cement consumption inNovember and December 1999 and a general slowdown in theU.S. economy, which looked not to be short-lived. Having beendisappointed in 1999 and 2000 by highway construction levelsthat fell well short of predictions under the TEA-21 fundingscenarios, the industry was adopting a wait-and-see attitudetowards highway spending levels in 2001 though remainingoptimistic that the TEA-21 funding would eventually generatelarge cement sales.
New plant and/or capacity expansion projects planned orunderway in the United States total about 25 Mt/yr of newcapacity coming on-line by 2005. Whether or not all of theseprojects come to fruition, significant capacity additions arecertain. These additions likely will substantially reduce theneed for imported cement and clinker, although plenty of thismaterial was expected to remain available at attractive baseprices. With the termination of antidumping remedies againstVenezuela, it was expected that imports from that country couldincrease at the expense of material from other regionalexporters.
Although there was little expectation that the Kyoto Protocolwould be ratified, the industry expected that pressures to reduceemissions of CO2 and that other pollutants would increase, and several companies were taking steps to adopt proactive policieson their plants’ environmental performances.
References Cited
American Coal Ash Association, 1999, 1999 coal combustion product (CCP)production and use (short tons): Alexandria, VA, American Coal AshAssociation fact sheet, 2 p.
Arthur, Steve, 2000, Holnam—Building for the future: World Cement, v. 31,no. 12, p. 50-54.
Ash Grove Cement Co., 2001, Ash Grove sets the pace: International CementReview, May, p. 51-57.
Barzoloski, Alfred, 2000, Colossal progress: World Cement, v. 31, no. 5, p. 38-39.
Cement Americas, 2001, Holnam gets the go ahead for new Missouri plant: Cement Americas, March-April, p. 12-14.
Cohrs, C.O., 2001, The next generation: International Cement Review, June, p.55-60.
Intergovernmental Panel on Climate Change, 2000, CO2 emissions fromindustry, ch. 3 of Good practice guidance and uncertainty management innational greenhouse gas inventories: Hayama, Japan, Institute for GlobalEnvironmental Strategies, p. 3.1-3.29.
International Cement Review, 2000a, Italcimenti to expand: InternationalCement Review, August, p. 12.
———2000b, New capacity brings down Texas prices: International Cement
Review, December, p. 8.———2001, Back to the future: International Cement Review, February, p. 15-
19.Maranzana, Michele, 2000, Technological efficiency: World Cement, v. 31, no.
5, p. 40-44.Martin, Nathan, Worrel, Ernst, and Price, Lynn, 1999, Energy efficiency and
carbon dioxide emissions reduction opportunities in the U.S. cement industry: Berkeley, CA, Ernest Orlando Lawrence Berkeley National Laboratory reportno. LBNL-44182, 40 p.
Mining Engineering, 2001, Greencastle expands, uses new production process: Mining Engineering, v. 53, no. 1, January, p. 31-33.
Oil & Gas Journal, 2001, Baker Hughes rig count: Oil & Gas Journal, v. 99.2,January 8, p. 77.
Perkins, David, 2000, Increased production and lower emissions: WorldCement, v. 31, no. 12, December, p. 57-59.
Portland Cement Association, 2000a, Cement industry update: Monitor, v. 10,no. 1, January, p. 2.
———2000b, Cement industry update: Monitor, v. 10, no. 2, February, p. 2.———2001, Construction put in place: Monitor, v. 11, no. 4, p. 16.Southern Tier Cement Committee, 2000a, Commerce Department determines
high dumping margin on cement imports from Mexico for eighth consecutiveyear: Washington, DC, King & Spaulding press release, March 7, 2 p.
———2000b, Commerce Department determines that heavy dumping of cementimports from Mexico and Venezuela will resume if existing antidumpingrelief is revoked: Washington, DC, King & Spaulding press release, June 29,2 p.
———2000c, U.S. International Trade Commission votes in sunset review ongray portland cement to continue the U.S. antidumping orders on importsfrom Mexico and Japan: Washington, DC, King & Spaulding press release,October 5, 3 p.
U.S. Environmental Protection Agency, 2001, Executive summary, in Inventoryof U.S. greenhouse gas emissions and sinks—1990-1999: Washington, DC,U.S. Environmental Protection Agency, p. ES 1—ES-26.
Wahlquist, Craig, 2000, NOx reduction and destruction: World Cement, v. 31,no. 10, p. 84-89.
Whitehorn, Anna, 2001, Adding fuel to the fire: International Cement Review,March, p. 69-70.
World Cement, 2000, Blue Circle expansion: World Cement, v. 31, no. 2, p. 5.
GENERAL SOURCES OF INFORMATION
U.S. Geological Survey Publications
Cement. Ch. in Mineral Commodity Summaries, annual.Cement. Ch. in Minerals Yearbook, annual.Cement. Mineral Industry Surveys, monthly.
Other
American Portland Cement Alliance, Washington, DC.Cement. Ch. in Mineral Facts and Problems, U.S. Bureau of
Mines Bulletin 675, 1985.Cement Americas, bimonthly.
North American Cement Directory: Intertec Publishing,Chicago, annual. Concrete Products, monthly.Engineering News-Record, weekly.International Cement Review, monthly.Portland Cement Association, Skokie, IL, The Monitor,
monthly. U.S. and Canadian Portland Cement Industry: Plant
Information Summary, annual.Rock Products, monthly.World Cement, monthly. World Cement Directory. The European Cement Association,
Brussels, Belgium, 1996.Zement-Kalk-Gyps International, monthly.
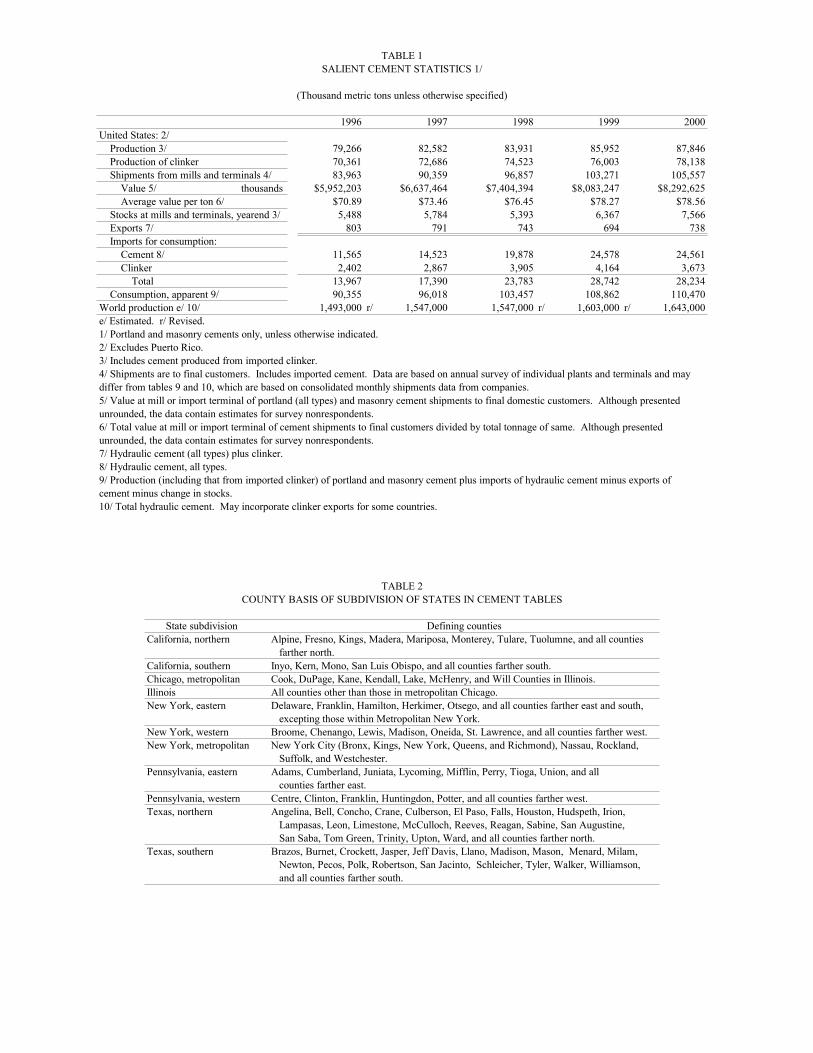
TABLE 1SALIENT CEMENT STATISTICS 1/
(Thousand metric tons unless otherwise specified)
1996 1997 1998 1999 2000United States: 2/ Production 3/ 79,266 82,582 83,931 85,952 87,846 Production of clinker 70,361 72,686 74,523 76,003 78,138 Shipments from mills and terminals 4/ 83,963 90,359 96,857 103,271 105,557 Value 5/ thousands $5,952,203 $6,637,464 $7,404,394 $8,083,247 $8,292,625 Average value per ton 6/ $70.89 $73.46 $76.45 $78.27 $78.56 Stocks at mills and terminals, yearend 3/ 5,488 5,784 5,393 6,367 7,566 Exports 7/ 803 791 743 694 738 Imports for consumption: Cement 8/ 11,565 14,523 19,878 24,578 24,561 Clinker 2,402 2,867 3,905 4,164 3,673 Total 13,967 17,390 23,783 28,742 28,234 Consumption, apparent 9/ 90,355 96,018 103,457 108,862 110,470World production e/ 10/ 1,493,000 r/ 1,547,000 1,547,000 r/ 1,603,000 r/ 1,643,000e/ Estimated. r/ Revised.1/ Portland and masonry cements only, unless otherwise indicated.2/ Excludes Puerto Rico.3/ Includes cement produced from imported clinker.4/ Shipments are to final customers. Includes imported cement. Data are based on annual survey of individual plants and terminals and maydiffer from tables 9 and 10, which are based on consolidated monthly shipments data from companies.5/ Value at mill or import terminal of portland (all types) and masonry cement shipments to final domestic customers. Although presentedunrounded, the data contain estimates for survey nonrespondents.6/ Total value at mill or import terminal of cement shipments to final customers divided by total tonnage of same. Although presented unrounded, the data contain estimates for survey nonrespondents.7/ Hydraulic cement (all types) plus clinker.8/ Hydraulic cement, all types.9/ Production (including that from imported clinker) of portland and masonry cement plus imports of hydraulic cement minus exports of cement minus change in stocks.10/ Total hydraulic cement. May incorporate clinker exports for some countries.
TABLE 2COUNTY BASIS OF SUBDIVISION OF STATES IN CEMENT TABLES
State subdivision Defining countiesCalifornia, northern Alpine, Fresno, Kings, Madera, Mariposa, Monterey, Tulare, Tuolumne, and all counties
farther north.California, southern Inyo, Kern, Mono, San Luis Obispo, and all counties farther south.Chicago, metropolitan Cook, DuPage, Kane, Kendall, Lake, McHenry, and Will Counties in Illinois.Illinois All counties other than those in metropolitan Chicago.New York, eastern Delaware, Franklin, Hamilton, Herkimer, Otsego, and all counties farther east and south,
excepting those within Metropolitan New York.New York, western Broome, Chenango, Lewis, Madison, Oneida, St. Lawrence, and all counties farther west.New York, metropolitan New York City (Bronx, Kings, New York, Queens, and Richmond), Nassau, Rockland,
Suffolk, and Westchester.Pennsylvania, eastern Adams, Cumberland, Juniata, Lycoming, Mifflin, Perry, Tioga, Union, and all
counties farther east.Pennsylvania, western Centre, Clinton, Franklin, Huntingdon, Potter, and all counties farther west.Texas, northern Angelina, Bell, Concho, Crane, Culberson, El Paso, Falls, Houston, Hudspeth, Irion,
Lampasas, Leon, Limestone, McCulloch, Reeves, Reagan, Sabine, San Augustine, San Saba, Tom Green, Trinity, Upton, Ward, and all counties farther north.
Texas, southern Brazos, Burnet, Crockett, Jasper, Jeff Davis, Llano, Madison, Mason, Menard, Milam, Newton, Pecos, Polk, Robertson, San Jacinto, Schleicher, Tyler, Walker, Williamson, and all counties farther south.

TABLE 3PORTLAND CEMENT PRODUCTION, CAPACITY, AND STOCKS IN THE UNITED STATES, BY DISTRICT
(Thousand metric tons unless otherwise specified)
1999 2000Capacity 1/ Stocks Capacity 1/ Stocks
Plants Produc- Finish Percentage at Plants Produc- Finish Percentage atDistrict active 2/ tion 3/ grinding utilized yearend 4/ active 2/ tion 3/ grinding utilized yearend 4/
Maine and New York 4 3,285 3,756 87.5 237 5 3,140 3,846 81.6 313Pennsylvania, eastern 5/ 7 4,710 5,205 90.5 263 7 4,685 5,374 87.2 251Pennsylvania, western 4 1,980 2,222 89.1 107 4 1,950 2,540 79.8 183Illinois 4 2,939 3,507 83.8 193 4 2,861 3,787 75.5 290Indiana 4 2,511 3,052 82.2 190 4 2,634 3,456 76.2 303Michigan 5 5,813 7,663 75.8 418 5 5,785 7,881 73.4 411Ohio 2 1,132 1,515 74.7 65 2 1,034 1,497 69.1 73Iowa, Nebraska, South Dakota 5 4,092 5,452 75.1 342 5 4,255 5,479 77.7 424Kansas 4 1,974 2,085 94.7 133 4 1,983 2,085 95.1 206Missouri 5 4,910 5,330 92.1 589 5 4,884 5,186 94.2 634Florida 7 3,497 6,355 55.0 411 7 3,753 6,817 55.1 411Georgia, Virginia, West Virginia 4 2,712 3,396 79.8 190 4 3,042 4,656 65.3 209Maryland 3 1,728 1,837 94.1 97 3 1,756 1,992 88.2 107South Carolina 3 2,610 3,335 78.3 80 3 2,912 3,361 86.6 172Alabama 5 4,301 5,005 85.9 267 5 4,337 5,020 86.4 331Kentucky, Mississippi, Tennessee 4 2,361 2,631 89.8 172 4 2,209 3,545 62.3 191Arkansas and Oklahoma 4 2,650 3,162 83.8 183 4 2,663 3,162 84.2 281Texas, northern 5/ 6 4,203 4,878 86.2 242 6 4,752 6,012 79.0 370Texas, southern 5 4,479 4,840 92.6 212 5 4,515 4,842 93.2 247Arizona and New Mexico 3 2,238 2,336 95.8 83 3 2,175 2,336 93.1 111Colorado and Wyoming 4 2,128 2,428 87.7 147 4 2,253 2,453 91.9 133Idaho, Montana, Nevada, Utah 7 2,781 3,306 84.1 222 7 2,818 3,415 82.5 260Alaska and Hawaii 1 254 499 50.9 49 1 286 288 99.5 27California, northern 3 2,770 2,862 96.8 159 3 2,811 2,880 97.6 124California, southern 5/ 8 7,519 8,315 90.4 395 8 8,066 9,015 89.5 334Oregon and Washington 4 1,999 2,598 77.0 238 4 1,953 2,498 78.2 170 Total or average 6/ 115 81,577 97,568 83.6 5,902 7/ 116 83,514 103,426 80.7 6,564 7/Puerto Rico 2 1,825 2,065 88.4 34 2 1,664 2,065 80.6 331/ Reported annual grinding capacity based on fineness necessary to grind individual plants' normal product mixes, making allowance for downtime required forroutine maintenance.2/ Includes one plant that reported portland cement (clinker) grinding capacity but no production of portland cement.3/ Includes cement produced from imported clinker.4/ Includes imported cement. Includes mills and terminals.5/ Includes data for white cement.6/ Data may not add to totals shown because of independent rounding.7/ Total stocks include inventory, not included on a district basis, held by independent importers.
TABLE 4MASONRY CEMENT PRODUCTION AND STOCKS IN THE UNITED STATES, BY DISTRICT
(Thousand metric tons unless otherwise specified)
1999 2000Stocks Stocks
Plants at Plants atDistrict active Production 1/ yearend 2/ active Production 1/ yearend 2/
Maine and New York 4 122 18 4 130 11Pennsylvania, eastern 6 219 35 6 225 41Pennsylvania, western 4 111 13 4 99 16Indiana 4 W 51 4 444 62Michigan 5 283 31 5 296 37Ohio 2 85 17 2 92 27Iowa, Nebraska, South Dakota 3 W 6 3 W 10Kansas 2 W W 2 W WMissouri 1 W W 1 W WFlorida 4 494 40 5 543 35Georgia, Virginia, West Virginia 5 370 46 5 331 36See footnotes at end of table.

TABLE 4--ContinuedMASONRY CEMENT PRODUCTION AND STOCKS IN THE UNITED STATES, BY DISTRICT
(Thousand metric tons unless otherwise specified)
1999 2000Stocks Stocks
Plants at Plants atDistrict active Production 1/ yearend 2/ active Production 1/ yearend 2/
Maryland 3 110 19 3 78 19South Carolina 3 421 32 3 411 25Alabama 4 429 56 4 401 57Kentucky, Mississippi, Tennessee 3 W W 3 83 6Arkansas and Oklahoma 4 138 13 4 142 25Texas, northern 4 153 10 4 156 9Texas, southern 3 108 7 3 112 7Arizona and New Mexico 3 W 6 3 W WColorado and Wyoming 2 W W 2 W WIdaho, Montana, Nevada, Utah -- -- (3/) 1 W WAlaska and Hawaii 1 3 (3/) 1 3 --California 6 417 4/ 14 4/ 6 484 18 Total 5/ 76 4,375 6/ 466 7/ 78 4,332 6/ 492W Withheld to avoid disclosing company proprietary data; included in "Total." -- Zero.1/ Includes cement produced from imported clinker.2/ Includes imported cement.3/ Less than 1/2 unit.4/ Includes data for southern California only. Northern California data are withheld.5/ Data may not add to totals shown because of independent rounding. Includes withheld districts.6/ Production directly from clinker accounted for almost 94% of the total in 1999 and 95% in 2000. Production from portland cement accounted for the remainder.7/ Total stocks include inventory, not shown on a district basis, held by independent importers.
TABLE 5CLINKER CAPACITY AND PRODUCTION IN THE UNITED STATES IN 2000, BY DISTRICT
(Thousand metric tons unless otherwise specified)
Averagedays of
Active plants 1/ routine Apparent PercentageProcess used Number Daily mainte- annual Produc- of capacity Yearend
District Wet Dry Both Total of kilns capacity nance capacity 2/ tion utilized stocks 3/Maine and New York 3 1 -- 4 5 10.4 39.2 3,411 3,090 90.6 133Pennsylvania, eastern 2 5 -- 7 14 15.2 24.4 5,101 4,590 90.0 189Pennsylvania, western 3 1 -- 4 8 6.1 23.0 2,110 1,964 93.1 235Illinois -- 4 -- 4 8 8.4 19.6 2,829 2,484 87.8 276Indiana 1 3 4/ -- 4 8 10.2 26.0 3,430 2,544 74.2 186Michigan 1 2 -- 3 8 13.5 23.0 4,604 4,347 94.4 346Ohio 1 1 -- 2 3 3.5 24.7 1,196 1,038 86.7 66Iowa, Nebraska, South Dakota -- 4 1 5 9 13.6 25.7 4,632 3,983 86.0 282Kansas 2 2 -- 4 11 5.6 19.5 1,958 1,789 91.4 207Missouri 2 3 -- 5 7 14.0 24.9 4,662 4,558 97.8 315Florida 1 4 -- 5 7 12.6 23.0 4,315 3,472 80.5 226Georgia, Virginia, West Virginia 1 3 -- 4 7 10.6 29.3 3,608 2,937 81.4 209Maryland 1 2 -- 3 7 5.5 29.0 1,871 1,654 88.4 52South Carolina 2 1 -- 3 7 8.7 16.9 3,015 2,507 83.2 162Alabama -- 5 -- 5 6 14.1 17.8 4,808 4,161 86.5 264Kentucky, Mississippi, Tennessee 2 2 -- 4 5 8.8 17.6 3,038 2,132 70.2 336Arkansas and Oklahoma 2 2 -- 4 10 7.7 19.0 2,665 2,526 94.8 89Texas, northern 3 3 -- 6 15 16.4 20.4 5,752 4,607 80.1 165Texas, southern -- 4 1 5 6 13.4 22.0 4,606 4,266 92.6 230Arizona and New Mexico -- 3 -- 3 9 6.5 17.4 2,240 2,184 97.5 151Colorado and Wyoming 1 3 -- 4 7 7.0 12.0 2,463 2,182 88.6 180Idaho, Montana, Nevada, Utah 3 4 -- 7 9 8.7 20.7 3,014 2,786 92.4 192Alaska and Hawaii -- -- -- -- -- -- -- -- -- -- 35See footnotes at end of table.

TABLE 5--ContinuedCLINKER CAPACITY AND PRODUCTION IN THE UNITED STATES IN 2000, BY DISTRICT
(Thousand metric tons unless otherwise specified)
Averagedays of
Active plants 1/ routine Apparent PercentageProcess used Number Daily mainte- annual Produc- of capacity Yearend
District Wet Dry Both Total of kilns capacity nance capacity 2/ tion utilized stocks 3/California, northern -- 3 -- 3 3 8.7 33.0 2,872 2,721 94.7 145California, southern -- 8 -- 8 17 26.2 26.1 8,979 7,897 88.0 560Oregon and Washington 1 2 -- 3 3 6.3 35.3 2,085 1,721 82.5 88 Total or average 5/ 32 75 2 109 199 261.5 23.0 89,264 78,138 87.5 5,321Puerto Rico -- 2 -- 2 2 5.9 34.0 1,964 1,518 77.3 252-- Zero.1/ Includes white cement plants.2/ Calculated on a per-kiln basis using 366 days (leap year) minus reported days for routine maintenance and multiplied by the reported unrounded daily capacity.3/ Includes imported clinker.4/ Includes one semidry plant.5/ Data may not add to totals shown because of independent rounding.
TABLE 6RAW MATERIALS USED IN PRODUCING CLINKER AND CEMENT IN THE UNITED STATES 1/ 2/
(Thousand metric tons)
1999 2000Raw materials Clinker Cement 3/ Clinker Cement 3/
Calcareous: Limestone (includes aragonite, marble, chalk, coral) 91,021 1,138 93,947 1,263 Cement rock (includes marl) 23,981 r/ 149 r/ 21,820 133 Cement kiln dust 4/ 305 112 351 155 Lime 5/ 10 46 19 49 Other -- -- 21 225Aluminous: Clay 4,770 23 4,205 8 Shale 3,679 -- 3,743 3 Other (includes staurolite, bauxite, aluminum dross, 387 -- 400 -- alumina, and other)Ferrous, iron ore, pyrites, millscale, other 1,259 -- 1,310 --Siliceous: Sand and calcium silicate 2,959 4 3,142 -- Sandstone, quartzite, other 745 -- 925 -- Fly ash 1,521 85 1,679 88 Other ash, including bottom ash 760 -- 930 -- Granulated blast furnace slag -- 349 -- 303 Other blast furnace slag 97 -- 43 -- Steel slag 591 -- 805 -- Other slags 45 -- 12 10 Natural rock pozzolans 6/ -- 16 -- 40 Other pozzolans 7/ 38 4 38 8Other: Gypsum and anhydrite -- 4,643 -- 4,655 Clinker, imported 8/ -- 4,607 -- 4,573 Other, n.e.c. -- 51 -- 46 Total 9/ 132,169 r/ 11,227 r/ 133,391 11,558r/ Revised. -- Zero.1/ Includes Puerto Rico.2/ Nonfuel materials only.3/ Includes portland, blended, and masonry cements.4/ Data are probably underreported.5/ Data are probably underreported on the basis of reported volumes of masonry cements.6/ Includes pozzolana and burned clays and shales.7/ Includes diatomite, other microcrystalline silica, silica fume, and other pozzolans, whether or not used as such.8/ Outside purchases by domestic plants; excludes purchases of domestic clinker.9/ Data may not add to totals shown because of independent rounding.

TABLE 7CLINKER PRODUCED AND FUEL CONSUMED BY THE CEMENT INDUSTRY IN THE UNITED STATES, BY PROCESS 1/ 2/
Clinker produced Fuel consumed Waste fuelQuantity Percent- Coal 3/ Coke Petroleum coke Oil Natural gas Tires Solid Liquid
Plants (thousand age (thousand (thousand (thousand (thousand (thousand (thousand (thousand (thousandKiln process active metric tons) of total metric tons) metric tons) metric tons) liters) cubic meters) metric tons) metric tons) liters)
1999: Wet 34 18,912 24.5 2,394 123 410 25,313 137,105 90 241 819,209 Dry 75 57,014 73.7 6,610 220 1,183 108,509 r/ 433,682 586 575 86,319 Both 2 1,411 1.8 202 -- 29 -- 82,349 9 -- -- Total 4/ 111 77,337 100.0 9,206 343 1,622 133,822 r/ 653,136 685 816 905,5272000: Wet 32 17,911 22.5 2,409 96 390 32,513 51,482 106 149 801,288 Dry 77 60,172 75.5 7,479 346 920 91,153 206,729 259 867 127,799 Both 2 1,574 2.0 208 -- 41 -- 80,049 8 -- -- Total 4/ 111 79,656 100.0 10,095 442 1,351 123,666 338,261 374 1,016 929,087r/ Revised. -- Zero.1/ Includes portland and masonry cement. Excludes grinding plants.2/ Includes Puerto Rico.3/ All reported to be bituminous.4/ Data may not add to totals shown because of independent rounding.
TABLE 8ELECTRIC ENERGY USED AT CEMENT PLANTS IN THE UNITED STATES, BY PROCESS 1/
Electric energy used AverageGenerated at plant Purchased Total Finished consumption
Quantity Quantity Quantity cement 2/ (kilowatt-(million (million (million produced hours per ton
Number kilowatt- Number kilowatt- kilowatt- (thousand of cementPlant process of plants hours) of plants hours) hours) Percentage metric tons) produced)
1999: Integrated plants: Wet -- -- 34 2,859 2,859 23.5 21,789 131 Dry 4 486 75 8,601 9,087 74.6 61,804 147 Both -- -- 2 238 238 2.0 1,652 144 Total or average 3/ 4 486 111 11,699 12,185 100.0 85,245 143 Grinding plants 4/ -- -- 5 154 154 -- 2,368 65 Exclusions 5/ -- -- 3 -- -- -- 165 --2000: Integrated plants: Wet -- -- 32 2,685 2,685 21.4 20,544 131 Dry 4 497 77 9,095 9,592 76.6 64,930 148 Both -- -- 2 249 249 2.0 1,593 157 Total or average 3/ 4 497 111 12,029 12,526 100.0 87,067 144 Grinding plants 4/ -- -- 6 164 164 -- 2,294 71 Exclusions 5/ -- -- 2 -- -- -- 149 ---- Zero.1/ Includes Puerto Rico.2/ Includes portland and masonry cements.3/ Data may not add to totals shown because of independent rounding.4/ Excludes plants that reported production only of masonry cement.5/ Tonnage of cement produced by plants that reported production of masonry cement only. One plant reported portland cement grinding capacity and so is included in table 3.
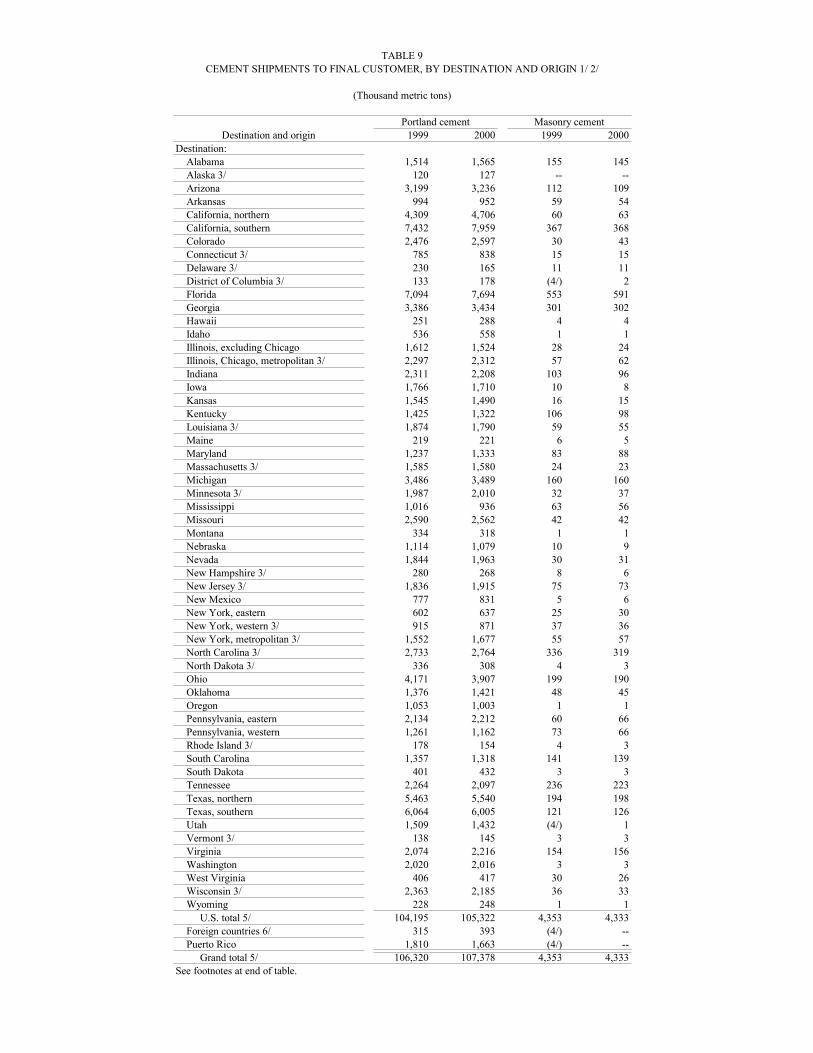
TABLE 9CEMENT SHIPMENTS TO FINAL CUSTOMER, BY DESTINATION AND ORIGIN 1/ 2/
(Thousand metric tons)
Portland cement Masonry cementDestination and origin 1999 2000 1999 2000
Destination: Alabama 1,514 1,565 155 145 Alaska 3/ 120 127 -- -- Arizona 3,199 3,236 112 109 Arkansas 994 952 59 54 California, northern 4,309 4,706 60 63 California, southern 7,432 7,959 367 368 Colorado 2,476 2,597 30 43 Connecticut 3/ 785 838 15 15 Delaware 3/ 230 165 11 11 District of Columbia 3/ 133 178 (4/) 2 Florida 7,094 7,694 553 591 Georgia 3,386 3,434 301 302 Hawaii 251 288 4 4 Idaho 536 558 1 1 Illinois, excluding Chicago 1,612 1,524 28 24 Illinois, Chicago, metropolitan 3/ 2,297 2,312 57 62 Indiana 2,311 2,208 103 96 Iowa 1,766 1,710 10 8 Kansas 1,545 1,490 16 15 Kentucky 1,425 1,322 106 98 Louisiana 3/ 1,874 1,790 59 55 Maine 219 221 6 5 Maryland 1,237 1,333 83 88 Massachusetts 3/ 1,585 1,580 24 23 Michigan 3,486 3,489 160 160 Minnesota 3/ 1,987 2,010 32 37 Mississippi 1,016 936 63 56 Missouri 2,590 2,562 42 42 Montana 334 318 1 1 Nebraska 1,114 1,079 10 9 Nevada 1,844 1,963 30 31 New Hampshire 3/ 280 268 8 6 New Jersey 3/ 1,836 1,915 75 73 New Mexico 777 831 5 6 New York, eastern 602 637 25 30 New York, western 3/ 915 871 37 36 New York, metropolitan 3/ 1,552 1,677 55 57 North Carolina 3/ 2,733 2,764 336 319 North Dakota 3/ 336 308 4 3 Ohio 4,171 3,907 199 190 Oklahoma 1,376 1,421 48 45 Oregon 1,053 1,003 1 1 Pennsylvania, eastern 2,134 2,212 60 66 Pennsylvania, western 1,261 1,162 73 66 Rhode Island 3/ 178 154 4 3 South Carolina 1,357 1,318 141 139 South Dakota 401 432 3 3 Tennessee 2,264 2,097 236 223 Texas, northern 5,463 5,540 194 198 Texas, southern 6,064 6,005 121 126 Utah 1,509 1,432 (4/) 1 Vermont 3/ 138 145 3 3 Virginia 2,074 2,216 154 156 Washington 2,020 2,016 3 3 West Virginia 406 417 30 26 Wisconsin 3/ 2,363 2,185 36 33 Wyoming 228 248 1 1 U.S. total 5/ 104,195 105,322 4,353 4,333 Foreign countries 6/ 315 393 (4/) -- Puerto Rico 1,810 1,663 (4/) -- Grand total 5/ 106,320 107,378 4,353 4,333See footnotes at end of table.
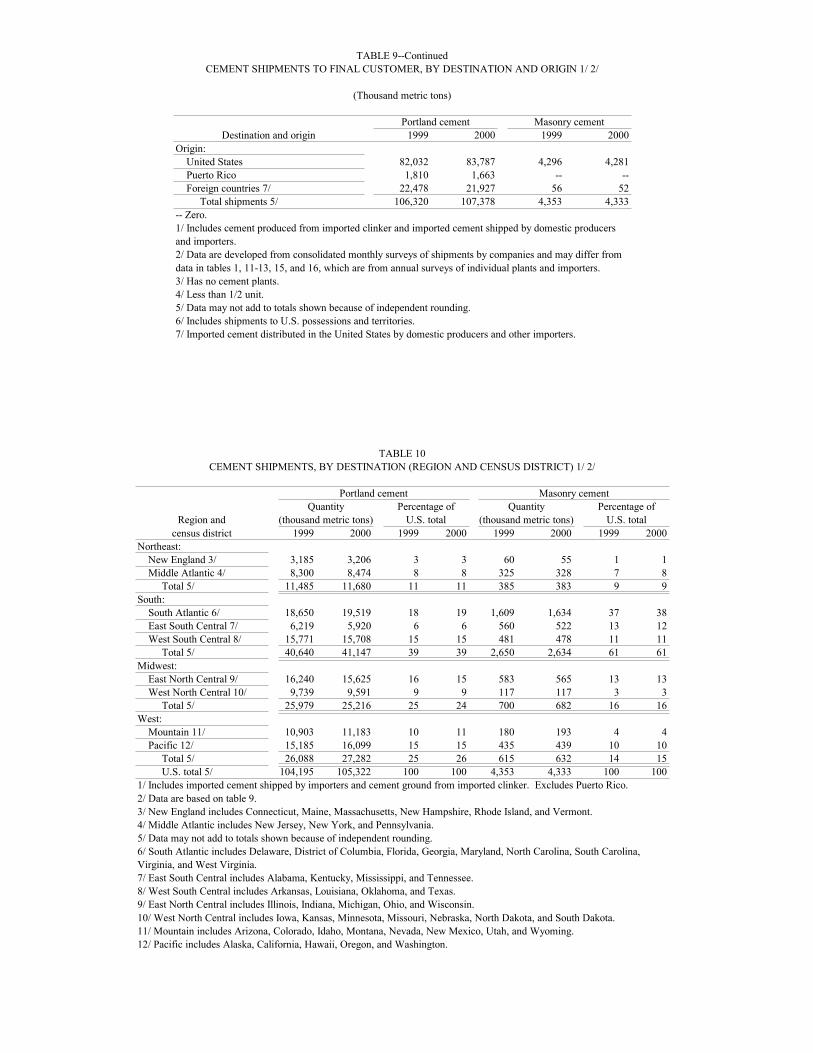
TABLE 9--ContinuedCEMENT SHIPMENTS TO FINAL CUSTOMER, BY DESTINATION AND ORIGIN 1/ 2/
(Thousand metric tons)
Portland cement Masonry cementDestination and origin 1999 2000 1999 2000
Origin: United States 82,032 83,787 4,296 4,281 Puerto Rico 1,810 1,663 -- -- Foreign countries 7/ 22,478 21,927 56 52 Total shipments 5/ 106,320 107,378 4,353 4,333-- Zero.1/ Includes cement produced from imported clinker and imported cement shipped by domestic producersand importers.2/ Data are developed from consolidated monthly surveys of shipments by companies and may differ from data in tables 1, 11-13, 15, and 16, which are from annual surveys of individual plants and importers.3/ Has no cement plants.4/ Less than 1/2 unit.5/ Data may not add to totals shown because of independent rounding.6/ Includes shipments to U.S. possessions and territories.7/ Imported cement distributed in the United States by domestic producers and other importers.
TABLE 10CEMENT SHIPMENTS, BY DESTINATION (REGION AND CENSUS DISTRICT) 1/ 2/
Portland cement Masonry cementQuantity Percentage of Quantity Percentage of
Region and (thousand metric tons) U.S. total (thousand metric tons) U.S. totalcensus district 1999 2000 1999 2000 1999 2000 1999 2000
Northeast: New England 3/ 3,185 3,206 3 3 60 55 1 1 Middle Atlantic 4/ 8,300 8,474 8 8 325 328 7 8 Total 5/ 11,485 11,680 11 11 385 383 9 9South: South Atlantic 6/ 18,650 19,519 18 19 1,609 1,634 37 38 East South Central 7/ 6,219 5,920 6 6 560 522 13 12 West South Central 8/ 15,771 15,708 15 15 481 478 11 11 Total 5/ 40,640 41,147 39 39 2,650 2,634 61 61Midwest: East North Central 9/ 16,240 15,625 16 15 583 565 13 13 West North Central 10/ 9,739 9,591 9 9 117 117 3 3 Total 5/ 25,979 25,216 25 24 700 682 16 16West: Mountain 11/ 10,903 11,183 10 11 180 193 4 4 Pacific 12/ 15,185 16,099 15 15 435 439 10 10 Total 5/ 26,088 27,282 25 26 615 632 14 15 U.S. total 5/ 104,195 105,322 100 100 4,353 4,333 100 1001/ Includes imported cement shipped by importers and cement ground from imported clinker. Excludes Puerto Rico.2/ Data are based on table 9.3/ New England includes Connecticut, Maine, Massachusetts, New Hampshire, Rhode Island, and Vermont.4/ Middle Atlantic includes New Jersey, New York, and Pennsylvania.5/ Data may not add to totals shown because of independent rounding.6/ South Atlantic includes Delaware, District of Columbia, Florida, Georgia, Maryland, North Carolina, South Carolina,Virginia, and West Virginia.7/ East South Central includes Alabama, Kentucky, Mississippi, and Tennessee.8/ West South Central includes Arkansas, Louisiana, Oklahoma, and Texas.9/ East North Central includes Illinois, Indiana, Michigan, Ohio, and Wisconsin.10/ West North Central includes Iowa, Kansas, Minnesota, Missouri, Nebraska, North Dakota, and South Dakota.11/ Mountain includes Arizona, Colorado, Idaho, Montana, Nevada, New Mexico, Utah, and Wyoming.12/ Pacific includes Alaska, California, Hawaii, Oregon, and Washington.
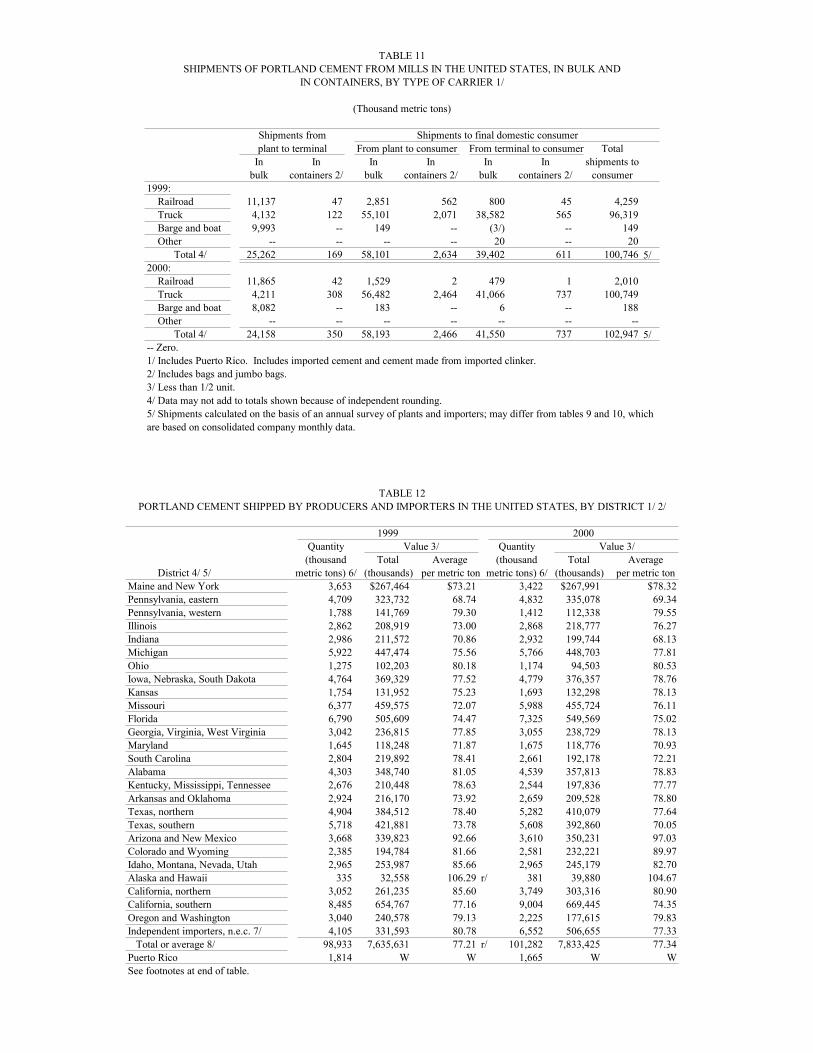
TABLE 11SHIPMENTS OF PORTLAND CEMENT FROM MILLS IN THE UNITED STATES, IN BULK AND
IN CONTAINERS, BY TYPE OF CARRIER 1/
(Thousand metric tons)
Shipments from Shipments to final domestic consumerplant to terminal From plant to consumer From terminal to consumer Total
In In In In In In shipments tobulk containers 2/ bulk containers 2/ bulk containers 2/ consumer
1999: Railroad 11,137 47 2,851 562 800 45 4,259 Truck 4,132 122 55,101 2,071 38,582 565 96,319 Barge and boat 9,993 -- 149 -- (3/) -- 149 Other -- -- -- -- 20 -- 20 Total 4/ 25,262 169 58,101 2,634 39,402 611 100,746 5/2000: Railroad 11,865 42 1,529 2 479 1 2,010 Truck 4,211 308 56,482 2,464 41,066 737 100,749 Barge and boat 8,082 -- 183 -- 6 -- 188 Other -- -- -- -- -- -- -- Total 4/ 24,158 350 58,193 2,466 41,550 737 102,947 5/-- Zero.1/ Includes Puerto Rico. Includes imported cement and cement made from imported clinker.2/ Includes bags and jumbo bags.3/ Less than 1/2 unit.4/ Data may not add to totals shown because of independent rounding.5/ Shipments calculated on the basis of an annual survey of plants and importers; may differ from tables 9 and 10, whichare based on consolidated company monthly data.
TABLE 12PORTLAND CEMENT SHIPPED BY PRODUCERS AND IMPORTERS IN THE UNITED STATES, BY DISTRICT 1/ 2/
1999 2000Quantity Value 3/ Quantity Value 3/(thousand Total Average (thousand Total Average
District 4/ 5/ metric tons) 6/ (thousands) per metric ton metric tons) 6/ (thousands) per metric tonMaine and New York 3,653 $267,464 $73.21 3,422 $267,991 $78.32Pennsylvania, eastern 4,709 323,732 68.74 4,832 335,078 69.34Pennsylvania, western 1,788 141,769 79.30 1,412 112,338 79.55Illinois 2,862 208,919 73.00 2,868 218,777 76.27Indiana 2,986 211,572 70.86 2,932 199,744 68.13Michigan 5,922 447,474 75.56 5,766 448,703 77.81Ohio 1,275 102,203 80.18 1,174 94,503 80.53Iowa, Nebraska, South Dakota 4,764 369,329 77.52 4,779 376,357 78.76Kansas 1,754 131,952 75.23 1,693 132,298 78.13Missouri 6,377 459,575 72.07 5,988 455,724 76.11Florida 6,790 505,609 74.47 7,325 549,569 75.02Georgia, Virginia, West Virginia 3,042 236,815 77.85 3,055 238,729 78.13Maryland 1,645 118,248 71.87 1,675 118,776 70.93South Carolina 2,804 219,892 78.41 2,661 192,178 72.21Alabama 4,303 348,740 81.05 4,539 357,813 78.83Kentucky, Mississippi, Tennessee 2,676 210,448 78.63 2,544 197,836 77.77Arkansas and Oklahoma 2,924 216,170 73.92 2,659 209,528 78.80Texas, northern 4,904 384,512 78.40 5,282 410,079 77.64Texas, southern 5,718 421,881 73.78 5,608 392,860 70.05Arizona and New Mexico 3,668 339,823 92.66 3,610 350,231 97.03Colorado and Wyoming 2,385 194,784 81.66 2,581 232,221 89.97Idaho, Montana, Nevada, Utah 2,965 253,987 85.66 2,965 245,179 82.70Alaska and Hawaii 335 32,558 106.29 r/ 381 39,880 104.67California, northern 3,052 261,235 85.60 3,749 303,316 80.90California, southern 8,485 654,767 77.16 9,004 669,445 74.35Oregon and Washington 3,040 240,578 79.13 2,225 177,615 79.83Independent importers, n.e.c. 7/ 4,105 331,593 80.78 6,552 506,655 77.33 Total or average 8/ 98,933 7,635,631 77.21 r/ 101,282 7,833,425 77.34Puerto Rico 1,814 W W 1,665 W WSee footnotes at end of table.
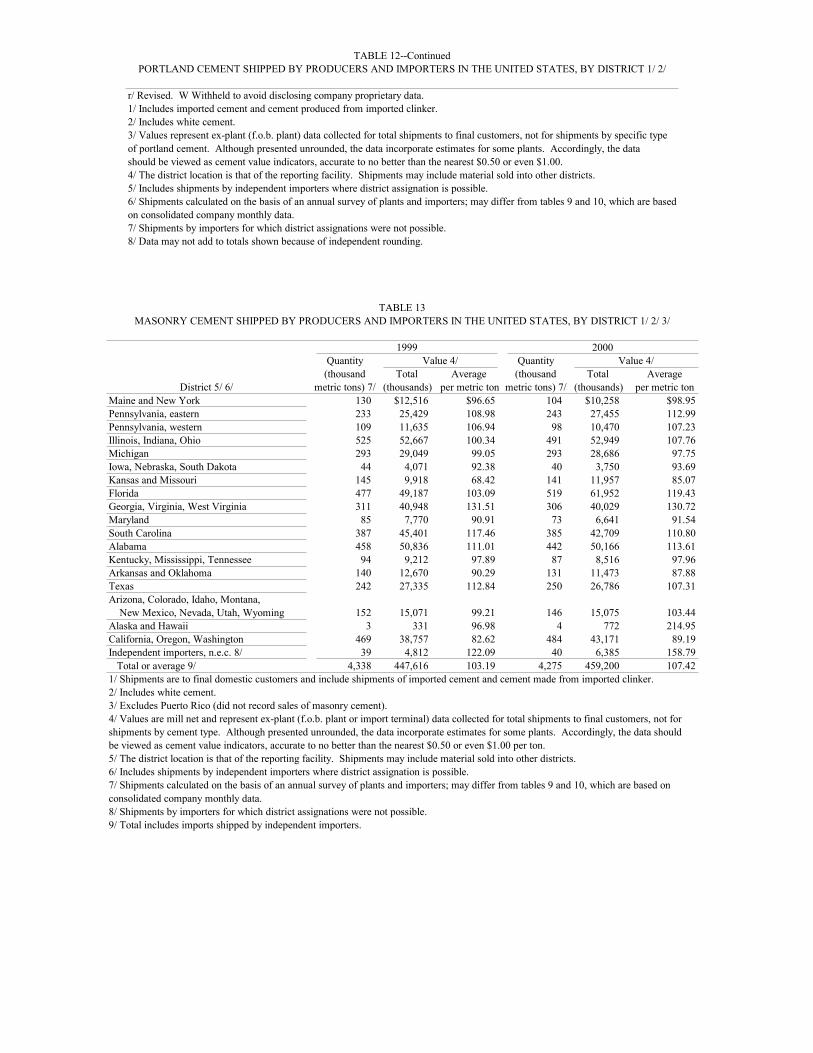
TABLE 12--ContinuedPORTLAND CEMENT SHIPPED BY PRODUCERS AND IMPORTERS IN THE UNITED STATES, BY DISTRICT 1/ 2/
r/ Revised. W Withheld to avoid disclosing company proprietary data.1/ Includes imported cement and cement produced from imported clinker.2/ Includes white cement.3/ Values represent ex-plant (f.o.b. plant) data collected for total shipments to final customers, not for shipments by specific typeof portland cement. Although presented unrounded, the data incorporate estimates for some plants. Accordingly, the data should be viewed as cement value indicators, accurate to no better than the nearest $0.50 or even $1.00.4/ The district location is that of the reporting facility. Shipments may include material sold into other districts.5/ Includes shipments by independent importers where district assignation is possible.6/ Shipments calculated on the basis of an annual survey of plants and importers; may differ from tables 9 and 10, which are basedon consolidated company monthly data.7/ Shipments by importers for which district assignations were not possible.8/ Data may not add to totals shown because of independent rounding.
TABLE 13MASONRY CEMENT SHIPPED BY PRODUCERS AND IMPORTERS IN THE UNITED STATES, BY DISTRICT 1/ 2/ 3/
1999 2000Quantity Value 4/ Quantity Value 4/(thousand Total Average (thousand Total Average
District 5/ 6/ metric tons) 7/ (thousands) per metric ton metric tons) 7/ (thousands) per metric tonMaine and New York 130 $12,516 $96.65 104 $10,258 $98.95Pennsylvania, eastern 233 25,429 108.98 243 27,455 112.99Pennsylvania, western 109 11,635 106.94 98 10,470 107.23Illinois, Indiana, Ohio 525 52,667 100.34 491 52,949 107.76Michigan 293 29,049 99.05 293 28,686 97.75Iowa, Nebraska, South Dakota 44 4,071 92.38 40 3,750 93.69Kansas and Missouri 145 9,918 68.42 141 11,957 85.07Florida 477 49,187 103.09 519 61,952 119.43Georgia, Virginia, West Virginia 311 40,948 131.51 306 40,029 130.72Maryland 85 7,770 90.91 73 6,641 91.54South Carolina 387 45,401 117.46 385 42,709 110.80Alabama 458 50,836 111.01 442 50,166 113.61Kentucky, Mississippi, Tennessee 94 9,212 97.89 87 8,516 97.96Arkansas and Oklahoma 140 12,670 90.29 131 11,473 87.88Texas 242 27,335 112.84 250 26,786 107.31Arizona, Colorado, Idaho, Montana, New Mexico, Nevada, Utah, Wyoming 152 15,071 99.21 146 15,075 103.44Alaska and Hawaii 3 331 96.98 4 772 214.95California, Oregon, Washington 469 38,757 82.62 484 43,171 89.19Independent importers, n.e.c. 8/ 39 4,812 122.09 40 6,385 158.79 Total or average 9/ 4,338 447,616 103.19 4,275 459,200 107.421/ Shipments are to final domestic customers and include shipments of imported cement and cement made from imported clinker.2/ Includes white cement.3/ Excludes Puerto Rico (did not record sales of masonry cement).4/ Values are mill net and represent ex-plant (f.o.b. plant or import terminal) data collected for total shipments to final customers, not forshipments by cement type. Although presented unrounded, the data incorporate estimates for some plants. Accordingly, the data shouldbe viewed as cement value indicators, accurate to no better than the nearest $0.50 or even $1.00 per ton.5/ The district location is that of the reporting facility. Shipments may include material sold into other districts.6/ Includes shipments by independent importers where district assignation is possible.7/ Shipments calculated on the basis of an annual survey of plants and importers; may differ from tables 9 and 10, which are based onconsolidated company monthly data.8/ Shipments by importers for which district assignations were not possible.9/ Total includes imports shipped by independent importers.
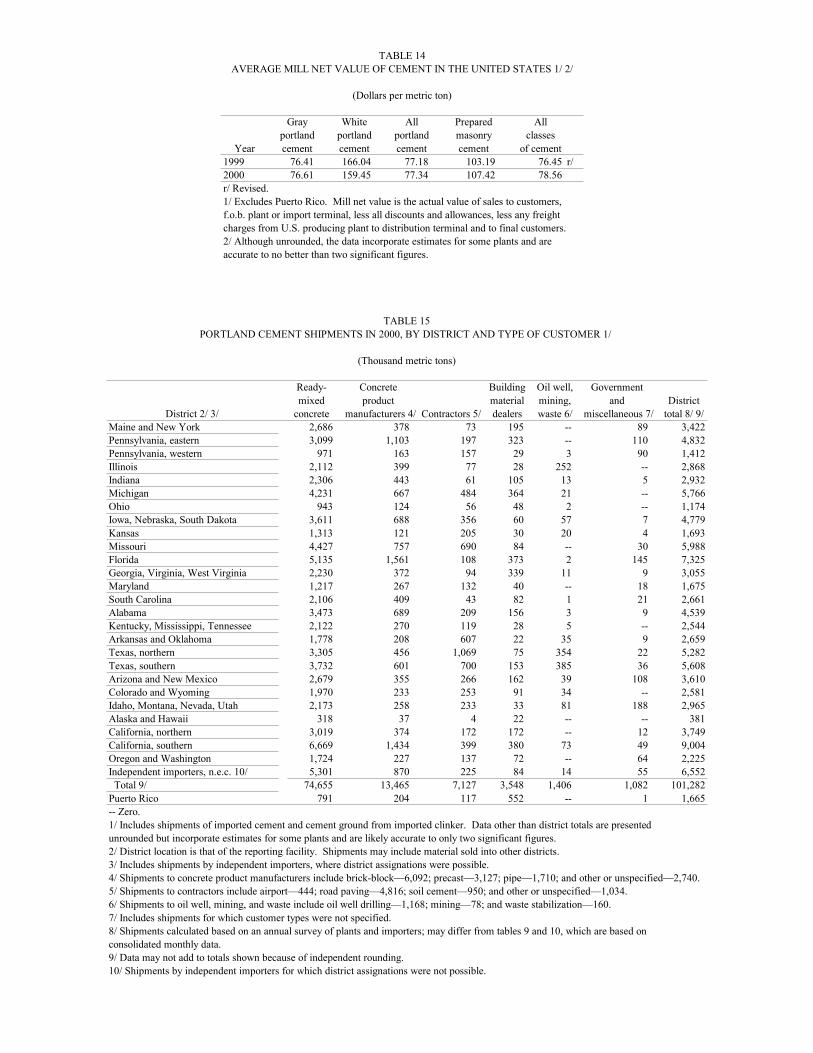
TABLE 14AVERAGE MILL NET VALUE OF CEMENT IN THE UNITED STATES 1/ 2/
(Dollars per metric ton)
Gray White All Prepared Allportland portland portland masonry classes
Year cement cement cement cement of cement1999 76.41 166.04 77.18 103.19 76.45 r/2000 76.61 159.45 77.34 107.42 78.56r/ Revised.1/ Excludes Puerto Rico. Mill net value is the actual value of sales to customers,f.o.b. plant or import terminal, less all discounts and allowances, less any freightcharges from U.S. producing plant to distribution terminal and to final customers.2/ Although unrounded, the data incorporate estimates for some plants and areaccurate to no better than two significant figures.
TABLE 15PORTLAND CEMENT SHIPMENTS IN 2000, BY DISTRICT AND TYPE OF CUSTOMER 1/
(Thousand metric tons)
Ready- Concrete Building Oil well, Governmentmixed product material mining, and District
District 2/ 3/ concrete manufacturers 4/ Contractors 5/ dealers waste 6/ miscellaneous 7/ total 8/ 9/Maine and New York 2,686 378 73 195 -- 89 3,422Pennsylvania, eastern 3,099 1,103 197 323 -- 110 4,832Pennsylvania, western 971 163 157 29 3 90 1,412Illinois 2,112 399 77 28 252 -- 2,868Indiana 2,306 443 61 105 13 5 2,932Michigan 4,231 667 484 364 21 -- 5,766Ohio 943 124 56 48 2 -- 1,174Iowa, Nebraska, South Dakota 3,611 688 356 60 57 7 4,779Kansas 1,313 121 205 30 20 4 1,693Missouri 4,427 757 690 84 -- 30 5,988Florida 5,135 1,561 108 373 2 145 7,325Georgia, Virginia, West Virginia 2,230 372 94 339 11 9 3,055Maryland 1,217 267 132 40 -- 18 1,675South Carolina 2,106 409 43 82 1 21 2,661Alabama 3,473 689 209 156 3 9 4,539Kentucky, Mississippi, Tennessee 2,122 270 119 28 5 -- 2,544Arkansas and Oklahoma 1,778 208 607 22 35 9 2,659Texas, northern 3,305 456 1,069 75 354 22 5,282Texas, southern 3,732 601 700 153 385 36 5,608Arizona and New Mexico 2,679 355 266 162 39 108 3,610Colorado and Wyoming 1,970 233 253 91 34 -- 2,581Idaho, Montana, Nevada, Utah 2,173 258 233 33 81 188 2,965Alaska and Hawaii 318 37 4 22 -- -- 381California, northern 3,019 374 172 172 -- 12 3,749California, southern 6,669 1,434 399 380 73 49 9,004Oregon and Washington 1,724 227 137 72 -- 64 2,225Independent importers, n.e.c. 10/ 5,301 870 225 84 14 55 6,552 Total 9/ 74,655 13,465 7,127 3,548 1,406 1,082 101,282Puerto Rico 791 204 117 552 -- 1 1,665-- Zero.1/ Includes shipments of imported cement and cement ground from imported clinker. Data other than district totals are presentedunrounded but incorporate estimates for some plants and are likely accurate to only two significant figures.2/ District location is that of the reporting facility. Shipments may include material sold into other districts.3/ Includes shipments by independent importers, where district assignations were possible.4/ Shipments to concrete product manufacturers include brick-block—6,092; precast—3,127; pipe—1,710; and other or unspecified—2,740.5/ Shipments to contractors include airport—444; road paving—4,816; soil cement—950; and other or unspecified—1,034.6/ Shipments to oil well, mining, and waste include oil well drilling—1,168; mining—78; and waste stabilization—160.7/ Includes shipments for which customer types were not specified.8/ Shipments calculated based on an annual survey of plants and importers; may differ from tables 9 and 10, which are based onconsolidated monthly data.9/ Data may not add to totals shown because of independent rounding.10/ Shipments by independent importers for which district assignations were not possible.
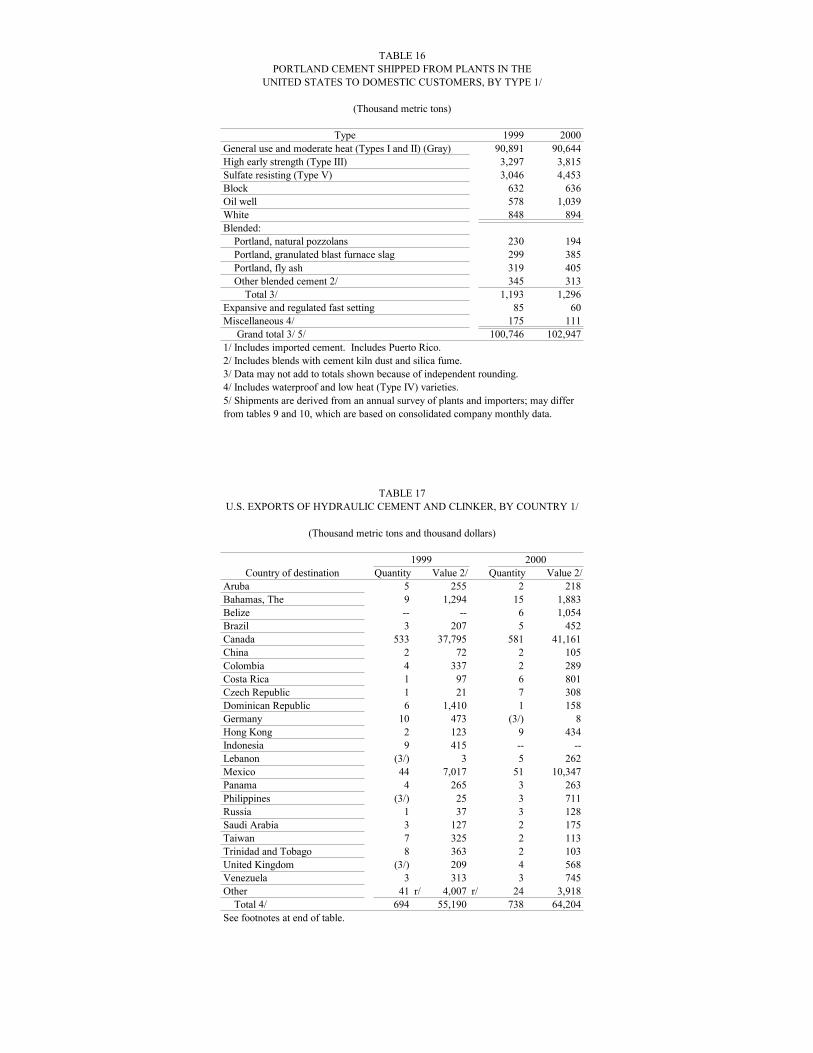
TABLE 16PORTLAND CEMENT SHIPPED FROM PLANTS IN THE
UNITED STATES TO DOMESTIC CUSTOMERS, BY TYPE 1/
(Thousand metric tons)
Type 1999 2000General use and moderate heat (Types I and II) (Gray) 90,891 90,644High early strength (Type III) 3,297 3,815Sulfate resisting (Type V) 3,046 4,453Block 632 636Oil well 578 1,039White 848 894Blended: Portland, natural pozzolans 230 194 Portland, granulated blast furnace slag 299 385 Portland, fly ash 319 405 Other blended cement 2/ 345 313 Total 3/ 1,193 1,296Expansive and regulated fast setting 85 60Miscellaneous 4/ 175 111 Grand total 3/ 5/ 100,746 102,9471/ Includes imported cement. Includes Puerto Rico.2/ Includes blends with cement kiln dust and silica fume.3/ Data may not add to totals shown because of independent rounding.4/ Includes waterproof and low heat (Type IV) varieties.5/ Shipments are derived from an annual survey of plants and importers; may differfrom tables 9 and 10, which are based on consolidated company monthly data.
TABLE 17U.S. EXPORTS OF HYDRAULIC CEMENT AND CLINKER, BY COUNTRY 1/
(Thousand metric tons and thousand dollars)
1999 2000Country of destination Quantity Value 2/ Quantity Value 2/
Aruba 5 255 2 218Bahamas, The 9 1,294 15 1,883Belize -- -- 6 1,054Brazil 3 207 5 452Canada 533 37,795 581 41,161China 2 72 2 105Colombia 4 337 2 289Costa Rica 1 97 6 801Czech Republic 1 21 7 308Dominican Republic 6 1,410 1 158Germany 10 473 (3/) 8Hong Kong 2 123 9 434Indonesia 9 415 -- --Lebanon (3/) 3 5 262Mexico 44 7,017 51 10,347Panama 4 265 3 263Philippines (3/) 25 3 711Russia 1 37 3 128Saudi Arabia 3 127 2 175Taiwan 7 325 2 113Trinidad and Tobago 8 363 2 103United Kingdom (3/) 209 4 568Venezuela 3 313 3 745Other 41 r/ 4,007 r/ 24 3,918 Total 4/ 694 55,190 738 64,204See footnotes at end of table.

TABLE 17--ContinuedU.S. EXPORTS OF HYDRAULIC CEMENT AND CLINKER, BY COUNTRY 1/
r/ Revised. -- Zero.1/ Includes portland and masonry cements.2/ Free alongside ship (f.a.s.) value. The value of exports at the U.S. seaport orborder point of export is based on the transaction price, including inland freight,insurance, and other charges incurred in placing the merchandise alongside the carrier. The value excludes the cost of loading.3/ Less than 1/2 unit.4/ Data may not add to totals shown because of independent rounding.
Source: U.S. Census Bureau.
TABLE 18U.S. IMPORTS FOR CONSUMPTION OF HYDRAULIC CEMENT AND CLINKER, BY COUNTRY 1/
(Thousand metric tons and thousand dollars)
1999 2000Value Value
Country of origin Quantity Customs 2/ C.i.f. 3/ Quantity Customs 2/ C.i.f. 3/Australia 388 8,520 15,079 180 4,305 7,384Bahamas, The -- -- -- 206 7,506 9,485Belgium 182 6,163 8,449 8 1,040 1,372Bulgaria 264 10,161 13,129 635 26,301 33,691Canada 5,511 280,812 303,271 4,948 268,875 285,040China 3,836 123,507 163,169 3,451 107,852 143,945Colombia 1,250 51,348 63,762 1,524 59,173 75,694Croatia 23 5,115 5,727 64 7,097 8,453Cyprus 81 3,044 3,712 -- -- --Denmark 643 33,914 45,853 554 27,934 38,105France 129 18,912 20,255 79 15,223 16,513Greece 2,086 80,366 101,404 1,479 51,897 69,159Indonesia 59 2,596 3,455 197 5,300 9,079Italy 665 25,588 33,710 249 9,645 12,986Korea, Republic of 1,529 43,200 67,045 1,823 49,742 75,578Lebanon -- -- -- 108 4,167 4,935Mexico 1,286 55,216 67,416 1,409 60,700 74,006Morocco 177 6,800 8,956 22 974 1,331Norway 332 12,125 15,227 263 10,257 12,626Philippines 26 604 1,061 160 3,360 7,187Spain 1,900 80,403 103,170 1,177 45,673 60,433Sweden 791 26,777 34,463 903 28,879 37,694Switzerland 54 1,915 2,878 -- -- --Taiwan 39 672 1,068 82 2,417 3,745Thailand 5,140 144,546 217,925 5,693 142,787 231,235Turkey 767 30,575 37,760 1,453 47,868 69,273United Kingdom 60 3,688 4,793 5 1,575 1,946Venezuela 2,073 84,273 102,818 1,878 75,173 95,353Other 62 r/ 3,685 r/ 4,269 r/ 136 8,223 11,292 Total 4/ 29,351 1,144,525 1,449,823 28,684 1,073,943 1,397,541r/ Revised. -- Zero.1/ Includes portland, masonry, and other hydraulic cements. Includes imports into Puerto Rico.2/ Customs value. The price actually paid or payable for merchandise when sold for exportation to the UnitedStates, excluding U.S. import duties, freight, insurance, and other charges incurred in bringing the merchandiseto the United States.3/ Cost, insurance, and freight. The import value represents the customs value plus insurance, freight, and otherdelivery charges to the first port of entry. 4/ Data may not add to totals shown because of independent rounding.
Source: U.S. Census Bureau.

TABLE 19U.S. IMPORTS FOR CONSUMPTION OF HYDRAULIC CEMENT AND CLINKER, BY CUSTOMS DISTRICT AND COUNTRY
(Thousand metric tons and thousand dollars)
1999 2000Value Value
Customs district and country Quantity Customs 1/ C.i.f. 2/ Quantity Customs 1/ C.i.f. 2/Anchorage, AK: Canada 2 81 84 (3/) 12 14 China 88 3,113 4,497 94 2,875 4,197 Total 4/ 90 3,194 4,582 95 2,887 4,211Baltimore, MD: Colombia 64 2,905 4,108 141 5,645 8,043 Denmark -- -- -- (3/) 32 40 Germany (3/) 14 14 (3/) 291 336 Greece -- -- -- 199 7,273 10,334 Netherlands (3/) 98 107 (3/) 96 105 Spain -- -- -- 15 474 834 Turkey 27 990 991 27 1,267 2,073 Venezuela 234 10,206 10,575 112 4,524 4,997 Total 4/ 325 14,213 15,795 494 19,602 26,763Boston, MA: Belgium -- -- -- (3/) 69 72 Colombia -- -- -- 7 246 371 Netherlands (3/) 138 146 (3/) 53 62 Norway -- -- -- 36 2,681 2,741 Spain -- -- -- 30 1,051 1,597 United Kingdom -- -- -- (3/) 11 11 Venezuela 85 3,705 5,293 312 11,438 16,250 Total 4/ 86 3,843 5,439 386 15,550 21,104Buffalo, NY: Canada 626 32,195 33,928 546 29,548 31,133 Denmark 2 271 273 (3/) 10 10 United Kingdom 1 209 301 2 384 398 Total 4/ 630 32,675 34,502 548 29,943 31,541Charleston, SC: Australia 97 1,893 3,470 73 1,275 2,494 Canada -- -- -- 10 300 500 China 173 5,289 7,093 -- -- -- Colombia 6 234 322 101 3,932 5,337 Germany -- -- -- (3/) 15 18 Greece -- -- -- 65 2,266 2,709 Indonesia 32 1,261 1,891 -- -- -- Korea, Republic of -- -- -- 36 1,075 1,558 Netherlands -- -- -- (3/) 64 71 Spain 366 13,142 17,816 16 634 848 Sweden 14 300 360 -- -- -- Thailand 121 2,457 4,624 408 9,786 19,796 Turkey -- -- -- 204 6,178 11,806 United Kingdom (3/) 151 198 1 370 463 Venezuela 21 876 1,085 -- -- -- Total 4/ 830 25,602 36,860 915 25,895 45,601Chicago, IL: Canada -- -- -- 34 1,902 1,992 Denmark (3/) 2 4 -- -- -- India -- -- -- (3/) 4 5 Japan (3/) 25 27 (3/) 43 48 Total 4/ (3/) 28 31 35 1,949 2,046Cleveland, OH: Canada 903 47,501 48,975 643 35,779 36,511 Spain -- -- -- (3/) 2 3 United Kingdom (3/) 60 83 1 221 285 Total 4/ 903 47,560 49,058 644 36,002 36,799Columbia-Snake, OR-WA, China 455 15,837 21,042 452 14,172 19,318Detroit, MI: Canada 1,734 87,694 96,112 1,472 85,463 89,245 Denmark (3/) 51 54 -- -- -- Germany -- -- -- 23 1,049 1,059See footnotes at end of table.
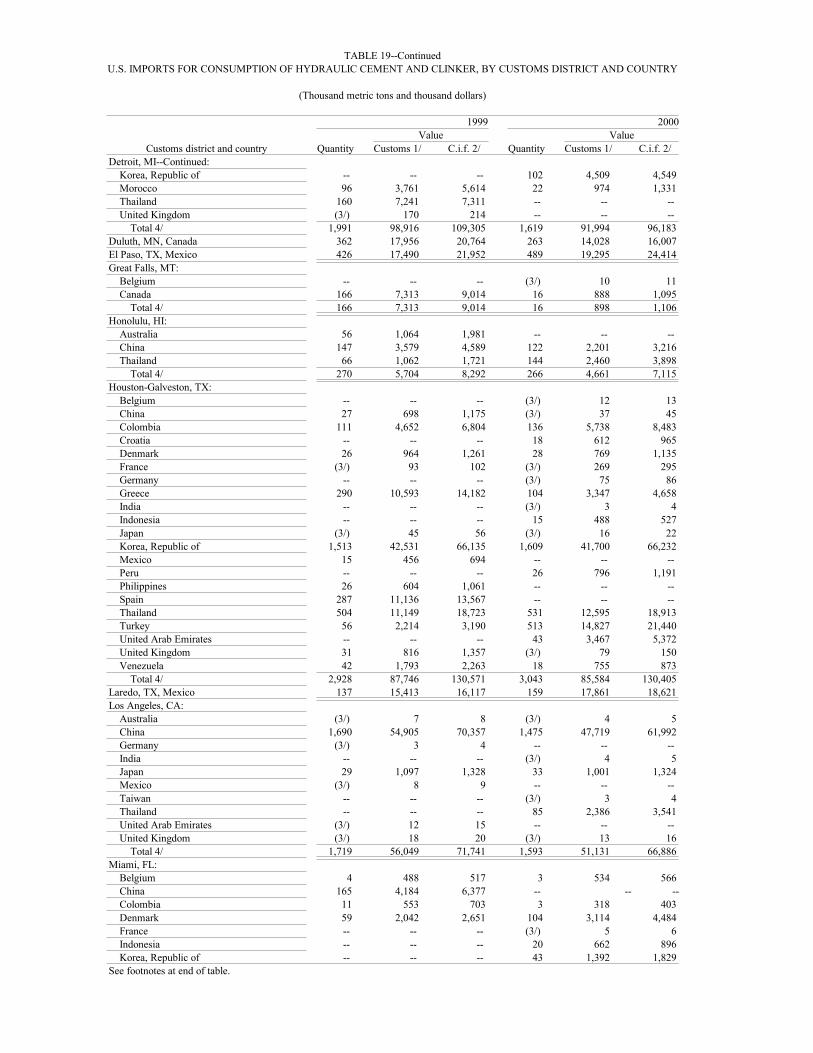
TABLE 19--ContinuedU.S. IMPORTS FOR CONSUMPTION OF HYDRAULIC CEMENT AND CLINKER, BY CUSTOMS DISTRICT AND COUNTRY
(Thousand metric tons and thousand dollars)
1999 2000Value Value
Customs district and country Quantity Customs 1/ C.i.f. 2/ Quantity Customs 1/ C.i.f. 2/Detroit, MI--Continued: Korea, Republic of -- -- -- 102 4,509 4,549 Morocco 96 3,761 5,614 22 974 1,331 Thailand 160 7,241 7,311 -- -- -- United Kingdom (3/) 170 214 -- -- -- Total 4/ 1,991 98,916 109,305 1,619 91,994 96,183Duluth, MN, Canada 362 17,956 20,764 263 14,028 16,007El Paso, TX, Mexico 426 17,490 21,952 489 19,295 24,414Great Falls, MT: Belgium -- -- -- (3/) 10 11 Canada 166 7,313 9,014 16 888 1,095 Total 4/ 166 7,313 9,014 16 898 1,106Honolulu, HI: Australia 56 1,064 1,981 -- -- -- China 147 3,579 4,589 122 2,201 3,216 Thailand 66 1,062 1,721 144 2,460 3,898 Total 4/ 270 5,704 8,292 266 4,661 7,115Houston-Galveston, TX: Belgium -- -- -- (3/) 12 13 China 27 698 1,175 (3/) 37 45 Colombia 111 4,652 6,804 136 5,738 8,483 Croatia -- -- -- 18 612 965 Denmark 26 964 1,261 28 769 1,135 France (3/) 93 102 (3/) 269 295 Germany -- -- -- (3/) 75 86 Greece 290 10,593 14,182 104 3,347 4,658 India -- -- -- (3/) 3 4 Indonesia -- -- -- 15 488 527 Japan (3/) 45 56 (3/) 16 22 Korea, Republic of 1,513 42,531 66,135 1,609 41,700 66,232 Mexico 15 456 694 -- -- -- Peru -- -- -- 26 796 1,191 Philippines 26 604 1,061 -- -- -- Spain 287 11,136 13,567 -- -- -- Thailand 504 11,149 18,723 531 12,595 18,913 Turkey 56 2,214 3,190 513 14,827 21,440 United Arab Emirates -- -- -- 43 3,467 5,372 United Kingdom 31 816 1,357 (3/) 79 150 Venezuela 42 1,793 2,263 18 755 873 Total 4/ 2,928 87,746 130,571 3,043 85,584 130,405Laredo, TX, Mexico 137 15,413 16,117 159 17,861 18,621Los Angeles, CA: Australia (3/) 7 8 (3/) 4 5 China 1,690 54,905 70,357 1,475 47,719 61,992 Germany (3/) 3 4 -- -- -- India -- -- -- (3/) 4 5 Japan 29 1,097 1,328 33 1,001 1,324 Mexico (3/) 8 9 -- -- -- Taiwan -- -- -- (3/) 3 4 Thailand -- -- -- 85 2,386 3,541 United Arab Emirates (3/) 12 15 -- -- -- United Kingdom (3/) 18 20 (3/) 13 16 Total 4/ 1,719 56,049 71,741 1,593 51,131 66,886Miami, FL: Belgium 4 488 517 3 534 566 China 165 4,184 6,377 -- -- -- Colombia 11 553 703 3 318 403 Denmark 59 2,042 2,651 104 3,114 4,484 France -- -- -- (3/) 5 6 Indonesia -- -- -- 20 662 896 Korea, Republic of -- -- -- 43 1,392 1,829See footnotes at end of table.

TABLE 19--ContinuedU.S. IMPORTS FOR CONSUMPTION OF HYDRAULIC CEMENT AND CLINKER, BY CUSTOMS DISTRICT AND COUNTRY
(Thousand metric tons and thousand dollars)
1999 2000Value Value
Customs district and country Quantity Customs 1/ C.i.f. 2/ Quantity Customs 1/ C.i.f. 2/Miami, FL--Continued: Mexico 5 450 529 5 446 568 Spain 889 40,803 52,077 776 31,763 40,768 Sweden 518 16,712 21,447 849 27,148 35,378 Thailand 55 1,359 2,092 18 600 840 United Kingdom (3/) 80 102 (3/) 137 177 Venezuela 190 7,829 10,024 138 4,995 6,627 Total 4/ 1,896 74,501 96,519 1,960 71,113 92,544Milwaukee, WI: Canada 50 2,801 3,401 80 4,598 4,958 Croatia -- -- -- 18 468 468 Total 4/ 50 2,801 3,401 99 5,066 5,426Minneapolis, MN, Germany (3/) 6 8 (3/) -- --Mobile, AL: Australia 70 1,172 2,410 -- -- -- Colombia 25 1,054 1,054 -- -- -- Greece -- -- -- 32 1,020 1,339 Indonesia 28 1,336 1,564 -- -- -- Taiwan 24 342 423 -- -- -- Thailand 293 6,171 10,747 459 9,443 18,322 Turkey -- -- -- 66 1,522 2,346 Total 4/ 440 10,074 16,197 557 11,985 22,006New Orleans, LA: Belgium 172 5,210 7,133 -- -- -- Bulgaria 130 5,093 6,652 344 12,530 17,489 China 25 577 615 2 155 204 Colombia -- -- -- (3/) 9 11 Croatia 22 4,921 5,516 27 5,976 6,977 Cyprus 27 1,154 1,490 -- -- -- France 12 2,239 2,600 13 2,435 2,798 Greece 797 30,989 38,338 327 11,278 14,692 Italy 649 24,904 32,969 244 8,993 12,159 Lebanon -- -- -- 45 1,713 2,325 Sweden 259 9,765 12,657 26 830 1,115 Thailand 2,859 80,942 124,384 2,524 64,692 100,247 Turkey 146 7,833 9,232 290 11,773 14,909 Venezuela 231 9,515 11,885 429 18,949 22,812 Total 4/ 5,330 183,144 253,469 4,271 139,333 195,738New York City, NY: Bahamas, The -- -- -- 206 7,506 9,485 Colombia (3/) 6 10 (3/) 11 17 Croatia (3/) 151 168 (3/) 40 42 Denmark 170 10,459 12,051 68 4,359 5,150 Germany -- -- -- (3/) 16 17 Greece 394 14,828 18,958 350 12,402 16,791 India -- -- -- (3/) 5 6 Lebanon -- -- -- (3/) 3 4 Liechtenstein (3/) 16 17 -- -- -- Netherlands (3/) 166 180 (3/) 88 100 Norway 332 12,125 15,227 227 7,576 9,885 Sweden -- -- -- 28 901 1,201 Turkey 265 9,567 11,180 300 10,533 14,185 United Kingdom (3/) 72 84 (3/) 98 109 Venezuela 28 1,076 1,188 34 1,248 1,778 Total 4/ 1,188 48,465 59,064 1,214 44,787 58,770Nogales, AZ: Mexico 656 19,725 25,879 718 21,418 28,124 Netherlands -- -- -- (3/) 17 21 Total 4/ 656 19,725 25,879 718 21,434 28,145See footnotes at end of table.

TABLE 19--ContinuedU.S. IMPORTS FOR CONSUMPTION OF HYDRAULIC CEMENT AND CLINKER, BY CUSTOMS DISTRICT AND COUNTRY
(Thousand metric tons and thousand dollars)
1999 2000Value Value
Customs district and country Quantity Customs 1/ C.i.f. 2/ Quantity Customs 1/ C.i.f. 2/Norfolk, VA: Bulgaria 109 4,092 5,401 291 13,771 16,202 China -- -- -- (3/) 2 2 Denmark 223 8,857 11,841 (3/) 67 88 France 90 15,768 16,502 65 12,471 13,361 Germany -- -- -- (3/) 9 11 Greece 464 19,246 23,647 402 14,311 18,636 Indonesia -- -- -- 38 1,098 1,695 Netherlands (3/) 34 36 (3/) 185 196 United Kingdom 2 516 629 1 208 261 Venezuela 8 248 337 -- -- -- Total 4/ 896 48,761 58,394 798 42,122 50,453Ogdensburg, NY: Canada 178 6,637 7,033 192 7,355 7,720 Croatia (3/) 42 44 -- -- -- Total 4/ 178 6,679 7,077 192 7,355 7,720Pembina, ND, Canada 341 16,917 19,044 344 16,830 18,770Philadelphia, PA: Germany 1 605 720 (3/) 310 348 Italy -- -- -- 4 560 700 Thailand 339 7,448 8,974 499 9,840 14,342 United Kingdom (3/) 22 24 (3/) 7 8 Total 4/ 340 8,075 9,718 503 10,717 15,399Port Arthur, TX, Thailand 30 539 539 -- -- --Portland, ME: Canada 66 5,988 6,171 68 6,445 6,812 Saudi Arabia 25 934 934 -- -- -- Turkey -- -- -- 46 1,090 1,761 Total 4/ 92 6,922 7,105 114 7,535 8,574Providence, RI: Colombia 24 956 1,373 15 513 727 Philippines -- -- -- 143 2,984 6,501 Spain 247 11,142 14,562 268 9,465 13,724 Venezuela 73 2,936 3,929 137 4,945 7,146 Total 4/ 345 15,034 19,863 562 17,907 28,098San Diego, CA: China 551 18,443 24,014 709 21,724 28,464 Mexico 45 1,446 1,888 30 1,001 1,310 Thailand -- -- -- 1 98 127 Total 4/ 596 19,890 25,902 739 22,823 29,902San Francisco, CA: Canada -- -- -- 12 579 672 China 354 11,315 16,343 421 13,018 18,628 Switzerland 16 654 1,203 -- -- -- Taiwan -- -- -- 82 2,415 3,742 Thailand 407 18,562 26,203 321 14,385 20,427 United Kingdom -- -- -- (3/) 3 6 Total 4/ 777 30,531 43,750 835 30,398 43,475San Juan, PR: Belgium 6 464 799 5 415 710 Bulgaria 25 977 1,077 -- -- -- China -- -- -- 134 4,685 6,111 Colombia 13 851 878 31 1,142 1,240 Cyprus 54 1,890 2,222 -- -- -- Denmark 33 1,974 3,503 202 8,105 11,512 France 26 812 1,051 -- -- -- Italy 16 677 730 (3/) 8 9 Japan (3/) 97 144 -- -- -- Lebanon -- -- -- 63 2,451 2,606 Mexico 3 229 347 7 679 968 Morocco 80 3,039 3,342 -- -- --See footnotes at end of table.

TABLE 19--ContinuedU.S. IMPORTS FOR CONSUMPTION OF HYDRAULIC CEMENT AND CLINKER, BY CUSTOMS DISTRICT AND COUNTRY
(Thousand metric tons and thousand dollars)
1999 2000Value Value
Customs district and country Quantity Customs 1/ C.i.f. 2/ Quantity Customs 1/ C.i.f. 2/San Juan, PR--Continued: Spain 34 1,170 1,233 7 204 214 Thailand 40 640 1,390 -- -- -- Turkey 111 3,843 5,090 -- -- -- Venezuela 168 5,395 6,040 -- -- -- Total 4/ 609 22,058 27,847 450 17,688 23,369Savannah, GA: Australia 33 574 1,166 -- -- -- China 5 180 231 -- -- -- Colombia 49 2,301 2,926 24 1,295 1,351 Denmark 18 1,594 2,332 5 366 507 Indonesia -- -- -- 82 1,484 3,642 Italy (3/) 6 11 (3/) 76 108 Taiwan 15 330 645 -- -- -- Thailand 129 3,422 5,240 132 2,988 5,244 Turkey -- -- -- 6 679 754 United Kingdom 25 1,574 1,779 (3/) 45 61 Venezuela 87 3,689 4,063 69 2,746 2,805 Total 4/ 362 13,670 18,393 318 9,679 14,471Seattle, WA: Australia 132 3,810 6,044 106 3,027 4,885 Canada 833 40,654 42,182 1,077 51,724 55,005 China 126 4,449 5,618 44 1,264 1,767 Japan 1 238 344 (3/) 33 48 Total 4/ 1,090 49,152 54,188 1,227 56,048 61,705St. Albans, VT: Canada 250 15,076 16,564 178 13,084 14,018 France -- -- -- (3/) 44 53 Total 4/ 250 15,076 16,564 178 13,128 14,071Tampa, FL: Canada -- -- -- 12 340 588 China 28 938 1,217 -- -- -- Colombia 946 37,835 45,584 1,054 39,767 48,961 Denmark 112 7,700 11,882 146 11,112 15,178 Greece 141 4,710 6,278 -- -- -- India -- -- -- (3/) 8 10 Indonesia -- -- -- 20 650 880 Korea, Republic of -- -- -- 33 1,066 1,410 Philippines -- -- -- 16 376 687 Spain 79 3,010 3,914 64 2,081 2,444 Switzerland 38 1,261 1,675 -- -- -- Thailand 136 3,555 5,978 551 12,400 23,866 Turkey 161 6,128 8,077 -- -- -- United Arab Emirates -- -- -- 5 409 617 Venezuela 752 30,765 37,918 558 21,423 27,154 Total 4/ 2,395 95,902 122,523 2,458 89,632 121,795U.S. Virgin Islands: Barbados -- -- -- 2 74 94 Panama 5 156 187 3 92 117 Venezuela 53 1,964 2,357 71 4,149 4,911 Total 4/ 57 2,120 2,543 75 4,315 5,122Washington, DC, Italy -- -- -- (3/) 5 6Wilmington, NC: Colombia -- -- -- 13 557 750 Indonesia -- -- -- 21 918 1,438 Italy -- -- -- (3/) 4 4 Korea, Republic of 16 669 910 -- -- -- Thailand -- -- -- 22 1,114 1,670 Venezuela 103 4,275 5,861 -- -- -- Total 4/ 118 4,944 6,771 55 2,593 3,864 Grand total 4/ 29,351 1,144,525 1,449,823 28,684 1,073,943 1,397,541See footnotes at end of table.

TABLE 19--ContinuedU.S. IMPORTS FOR CONSUMPTION OF HYDRAULIC CEMENT AND CLINKER, BY CUSTOMS DISTRICT AND COUNTRY
-- Zero.1/ Customs value. The price actually paid or payable for merchandise when sold for exportation to the United States, excluding U.S.import duties, freight, insurance, and other charges incurred in bringing the merchandise to the United States. 2/ Cost, insurance, and freight. The import value represents the customs value plus insurance, freight, and other delivery charges tothe first port of entry.3/ Less than 1/2 unit.4/ Data may not add to totals shown because of independent rounding.
Source: U.S. Census Bureau.
TABLE 20U.S. IMPORTS FOR CONSUMPTION OF GRAY PORTLAND CEMENT, BY COUNTRY 1/
(Thousand metric tons and thousand dollars)
1999 2000Value Value
Country Quantity Customs 2/ C.i.f. 3/ Quantity Customs 2/ C.i.f. 3/Australia 228 5,703 9,514 179 4,301 7,379Bahamas, The -- -- -- 199 6,713 8,553Belgium 74 2,605 3,463 -- -- --Bulgaria 238 9,185 12,053 635 26,301 33,691Canada 4,057 202,552 217,108 3,916 202,885 216,312China 3,678 119,504 157,973 3,301 104,103 138,811Colombia 1,096 45,329 56,701 1,314 51,444 66,633Croatia -- -- -- 18 612 965Cyprus 27 1,154 1,490 -- -- --Denmark 438 16,861 21,960 385 12,721 17,756Greece 1,843 71,910 90,203 1,392 48,417 64,535Indonesia 56 1,852 2,584 161 3,894 7,113Italy 665 25,529 33,625 248 9,557 12,863Korea, Republic of 1,529 43,200 67,045 1,721 45,232 71,029Mexico 1,080 31,948 42,586 1,174 34,282 45,756Norway 332 12,125 15,227 226 7,576 9,885Philippines 26 604 1,061 159 3,360 7,187Spain 1,795 70,193 91,577 1,054 35,535 48,253Sweden 789 26,387 33,949 903 28,879 37,694Taiwan 15 330 645 81 2,417 3,745Thailand 3,089 91,438 139,770 3,594 100,413 156,533Turkey 767 30,575 37,760 1,225 40,632 59,230United Kingdom 48 1,563 2,135 (3/) 33 37Venezuela 1,725 72,309 88,758 1,851 73,376 93,495 Other 75 r/ 2,861 r/ 3,674 r/ 106 3,672 4,723 Total 4/ 23,672 885,716 1,130,861 23,842 846,355 1,112,178r/ Revised. -- Zero.1/ Includes imports into Puerto Rico.2/ The price actually paid or payable for merchandise when sold for exportation to the United States, excludingU.S. import duties, freight, insurance, and other charges incurred in bringing the merchandise to the United States.3/ Cost, insurance, and freight. The import value represents the customs value plus insurance, freight, and otherdelivery charges to the first port of entry. 4/ Data may not add to totals shown because of independent rounding.
Source: U.S. Census Bureau.
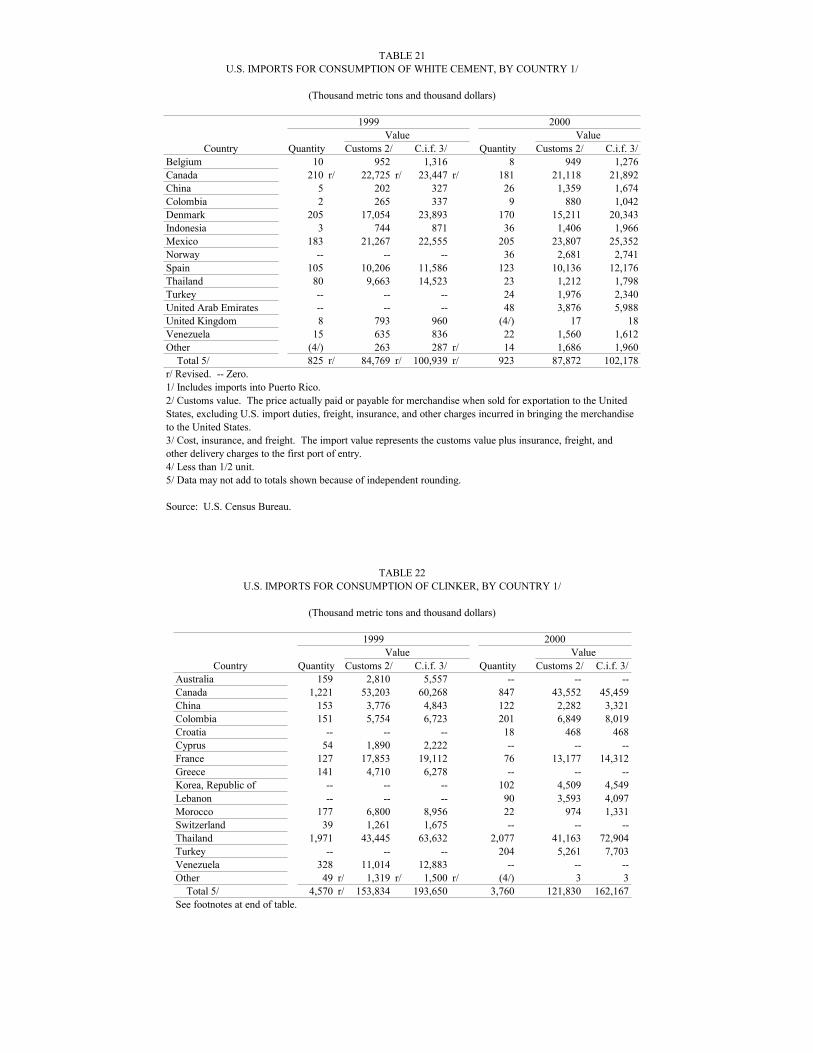
TABLE 21U.S. IMPORTS FOR CONSUMPTION OF WHITE CEMENT, BY COUNTRY 1/
(Thousand metric tons and thousand dollars)
1999 2000Value Value
Country Quantity Customs 2/ C.i.f. 3/ Quantity Customs 2/ C.i.f. 3/Belgium 10 952 1,316 8 949 1,276Canada 210 r/ 22,725 r/ 23,447 r/ 181 21,118 21,892China 5 202 327 26 1,359 1,674Colombia 2 265 337 9 880 1,042Denmark 205 17,054 23,893 170 15,211 20,343Indonesia 3 744 871 36 1,406 1,966Mexico 183 21,267 22,555 205 23,807 25,352Norway -- -- -- 36 2,681 2,741Spain 105 10,206 11,586 123 10,136 12,176Thailand 80 9,663 14,523 23 1,212 1,798Turkey -- -- -- 24 1,976 2,340United Arab Emirates -- -- -- 48 3,876 5,988United Kingdom 8 793 960 (4/) 17 18Venezuela 15 635 836 22 1,560 1,612Other (4/) 263 287 r/ 14 1,686 1,960 Total 5/ 825 r/ 84,769 r/ 100,939 r/ 923 87,872 102,178r/ Revised. -- Zero.1/ Includes imports into Puerto Rico.2/ Customs value. The price actually paid or payable for merchandise when sold for exportation to the UnitedStates, excluding U.S. import duties, freight, insurance, and other charges incurred in bringing the merchandiseto the United States.3/ Cost, insurance, and freight. The import value represents the customs value plus insurance, freight, andother delivery charges to the first port of entry.4/ Less than 1/2 unit.5/ Data may not add to totals shown because of independent rounding.
Source: U.S. Census Bureau.
TABLE 22U.S. IMPORTS FOR CONSUMPTION OF CLINKER, BY COUNTRY 1/
(Thousand metric tons and thousand dollars)
1999 2000Value Value
Country Quantity Customs 2/ C.i.f. 3/ Quantity Customs 2/ C.i.f. 3/Australia 159 2,810 5,557 -- -- --Canada 1,221 53,203 60,268 847 43,552 45,459China 153 3,776 4,843 122 2,282 3,321Colombia 151 5,754 6,723 201 6,849 8,019Croatia -- -- -- 18 468 468Cyprus 54 1,890 2,222 -- -- --France 127 17,853 19,112 76 13,177 14,312Greece 141 4,710 6,278 -- -- --Korea, Republic of -- -- -- 102 4,509 4,549Lebanon -- -- -- 90 3,593 4,097Morocco 177 6,800 8,956 22 974 1,331Switzerland 39 1,261 1,675 -- -- --Thailand 1,971 43,445 63,632 2,077 41,163 72,904Turkey -- -- -- 204 5,261 7,703Venezuela 328 11,014 12,883 -- -- --Other 49 r/ 1,319 r/ 1,500 r/ (4/) 3 3 Total 5/ 4,570 r/ 153,834 193,650 3,760 121,830 162,167See footnotes at end of table.
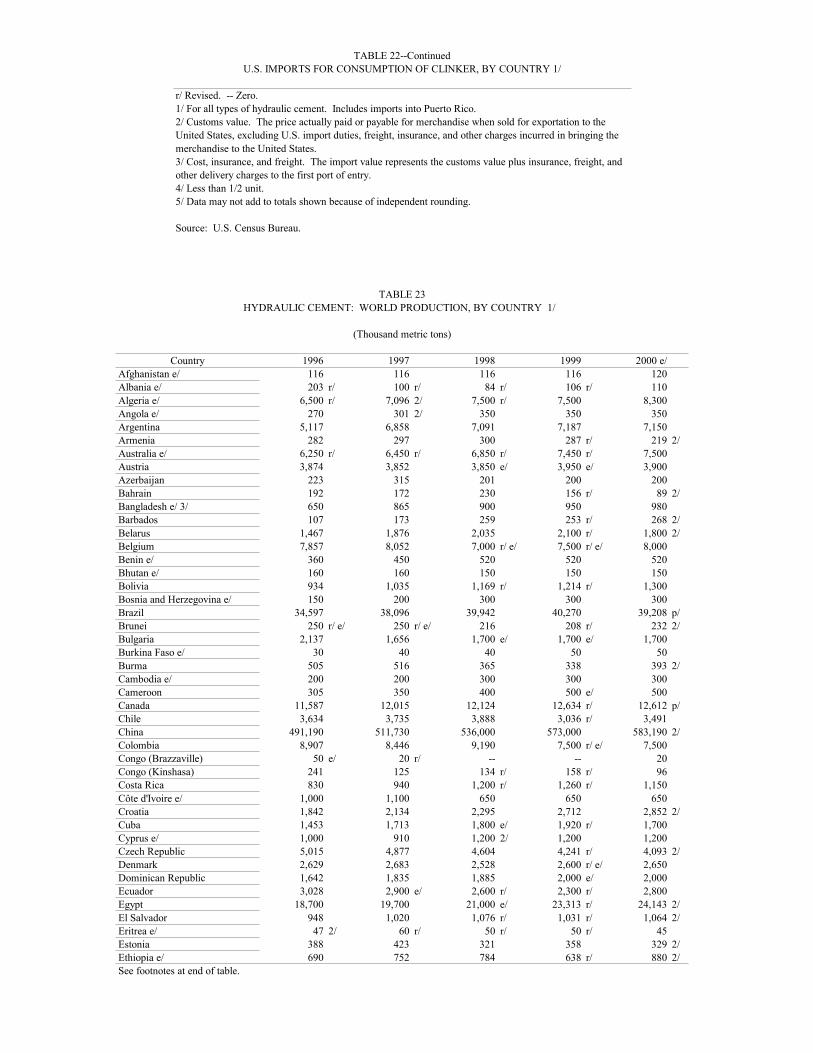
TABLE 22--ContinuedU.S. IMPORTS FOR CONSUMPTION OF CLINKER, BY COUNTRY 1/
r/ Revised. -- Zero.1/ For all types of hydraulic cement. Includes imports into Puerto Rico.2/ Customs value. The price actually paid or payable for merchandise when sold for exportation to theUnited States, excluding U.S. import duties, freight, insurance, and other charges incurred in bringing themerchandise to the United States.3/ Cost, insurance, and freight. The import value represents the customs value plus insurance, freight, andother delivery charges to the first port of entry.4/ Less than 1/2 unit.5/ Data may not add to totals shown because of independent rounding.
Source: U.S. Census Bureau.
TABLE 23HYDRAULIC CEMENT: WORLD PRODUCTION, BY COUNTRY 1/
(Thousand metric tons)
Country 1996 1997 1998 1999 2000 e/Afghanistan e/ 116 116 116 116 120 Albania e/ 203 r/ 100 r/ 84 r/ 106 r/ 110 Algeria e/ 6,500 r/ 7,096 2/ 7,500 r/ 7,500 8,300 Angola e/ 270 301 2/ 350 350 350 Argentina 5,117 6,858 7,091 7,187 7,150 Armenia 282 297 300 287 r/ 219 2/Australia e/ 6,250 r/ 6,450 r/ 6,850 r/ 7,450 r/ 7,500 Austria 3,874 3,852 3,850 e/ 3,950 e/ 3,900 Azerbaijan 223 315 201 200 200 Bahrain 192 172 230 156 r/ 89 2/Bangladesh e/ 3/ 650 865 900 950 980 Barbados 107 173 259 253 r/ 268 2/Belarus 1,467 1,876 2,035 2,100 r/ 1,800 2/Belgium 7,857 8,052 7,000 r/ e/ 7,500 r/ e/ 8,000 Benin e/ 360 450 520 520 520 Bhutan e/ 160 160 150 150 150 Bolivia 934 1,035 1,169 r/ 1,214 r/ 1,300 Bosnia and Herzegovina e/ 150 200 300 300 300 Brazil 34,597 38,096 39,942 40,270 39,208 p/Brunei 250 r/ e/ 250 r/ e/ 216 208 r/ 232 2/Bulgaria 2,137 1,656 1,700 e/ 1,700 e/ 1,700 Burkina Faso e/ 30 40 40 50 50Burma 505 516 365 338 393 2/Cambodia e/ 200 200 300 300 300Cameroon 305 350 400 500 e/ 500 Canada 11,587 12,015 12,124 12,634 r/ 12,612 p/Chile 3,634 3,735 3,888 3,036 r/ 3,491 China 491,190 511,730 536,000 573,000 583,190 2/Colombia 8,907 8,446 9,190 7,500 r/ e/ 7,500 Congo (Brazzaville) 50 e/ 20 r/ -- -- 20 Congo (Kinshasa) 241 125 134 r/ 158 r/ 96 Costa Rica 830 940 1,200 r/ 1,260 r/ 1,150 Côte d'Ivoire e/ 1,000 1,100 650 650 650 Croatia 1,842 2,134 2,295 2,712 2,852 2/Cuba 1,453 1,713 1,800 e/ 1,920 r/ 1,700 Cyprus e/ 1,000 910 1,200 2/ 1,200 1,200 Czech Republic 5,015 4,877 4,604 4,241 r/ 4,093 2/Denmark 2,629 2,683 2,528 2,600 r/ e/ 2,650 Dominican Republic 1,642 1,835 1,885 2,000 e/ 2,000 Ecuador 3,028 2,900 e/ 2,600 r/ 2,300 r/ 2,800 Egypt 18,700 19,700 21,000 e/ 23,313 r/ 24,143 2/El Salvador 948 1,020 1,076 r/ 1,031 r/ 1,064 2/Eritrea e/ 47 2/ 60 r/ 50 r/ 50 r/ 45 Estonia 388 423 321 358 329 2/Ethiopia e/ 690 752 784 638 r/ 880 2/See footnotes at end of table.
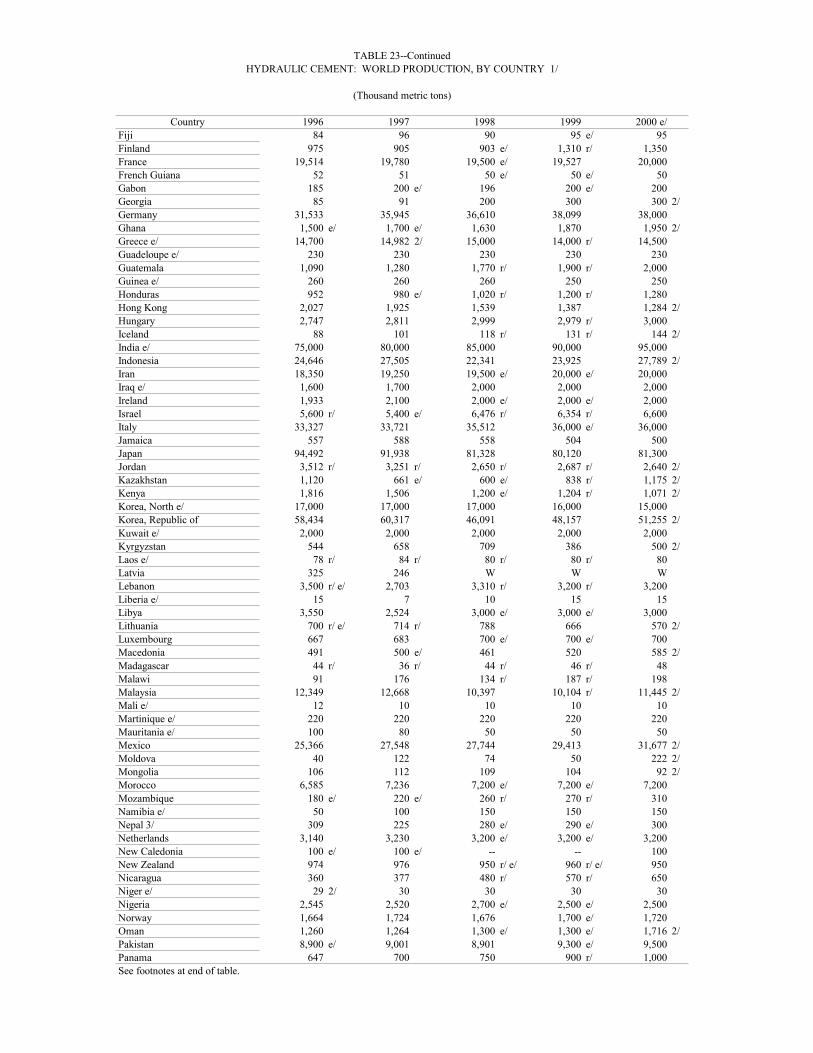
TABLE 23--ContinuedHYDRAULIC CEMENT: WORLD PRODUCTION, BY COUNTRY 1/
(Thousand metric tons)
Country 1996 1997 1998 1999 2000 e/Fiji 84 96 90 95 e/ 95 Finland 975 905 903 e/ 1,310 r/ 1,350 France 19,514 19,780 19,500 e/ 19,527 20,000 French Guiana 52 51 50 e/ 50 e/ 50 Gabon 185 200 e/ 196 200 e/ 200 Georgia 85 91 200 300 300 2/Germany 31,533 35,945 36,610 38,099 38,000 Ghana 1,500 e/ 1,700 e/ 1,630 1,870 1,950 2/Greece e/ 14,700 14,982 2/ 15,000 14,000 r/ 14,500 Guadeloupe e/ 230 230 230 230 230 Guatemala 1,090 1,280 1,770 r/ 1,900 r/ 2,000 Guinea e/ 260 260 260 250 250Honduras 952 980 e/ 1,020 r/ 1,200 r/ 1,280 Hong Kong 2,027 1,925 1,539 1,387 1,284 2/Hungary 2,747 2,811 2,999 2,979 r/ 3,000 Iceland 88 101 118 r/ 131 r/ 144 2/India e/ 75,000 80,000 85,000 90,000 95,000 Indonesia 24,646 27,505 22,341 23,925 27,789 2/Iran 18,350 19,250 19,500 e/ 20,000 e/ 20,000 Iraq e/ 1,600 1,700 2,000 2,000 2,000 Ireland 1,933 2,100 2,000 e/ 2,000 e/ 2,000 Israel 5,600 r/ 5,400 e/ 6,476 r/ 6,354 r/ 6,600Italy 33,327 33,721 35,512 36,000 e/ 36,000 Jamaica 557 588 558 504 500 Japan 94,492 91,938 81,328 80,120 81,300 Jordan 3,512 r/ 3,251 r/ 2,650 r/ 2,687 r/ 2,640 2/Kazakhstan 1,120 661 e/ 600 e/ 838 r/ 1,175 2/Kenya 1,816 1,506 1,200 e/ 1,204 r/ 1,071 2/Korea, North e/ 17,000 17,000 17,000 16,000 15,000 Korea, Republic of 58,434 60,317 46,091 48,157 51,255 2/Kuwait e/ 2,000 2,000 2,000 2,000 2,000 Kyrgyzstan 544 658 709 386 500 2/Laos e/ 78 r/ 84 r/ 80 r/ 80 r/ 80 Latvia 325 246 W W W Lebanon 3,500 r/ e/ 2,703 3,310 r/ 3,200 r/ 3,200 Liberia e/ 15 7 10 15 15 Libya 3,550 2,524 3,000 e/ 3,000 e/ 3,000 Lithuania 700 r/ e/ 714 r/ 788 666 570 2/Luxembourg 667 683 700 e/ 700 e/ 700 Macedonia 491 500 e/ 461 520 585 2/Madagascar 44 r/ 36 r/ 44 r/ 46 r/ 48 Malawi 91 176 134 r/ 187 r/ 198 Malaysia 12,349 12,668 10,397 10,104 r/ 11,445 2/Mali e/ 12 10 10 10 10 Martinique e/ 220 220 220 220 220 Mauritania e/ 100 80 50 50 50 Mexico 25,366 27,548 27,744 29,413 31,677 2/Moldova 40 122 74 50 222 2/Mongolia 106 112 109 104 92 2/Morocco 6,585 7,236 7,200 e/ 7,200 e/ 7,200 Mozambique 180 e/ 220 e/ 260 r/ 270 r/ 310 Namibia e/ 50 100 150 150 150Nepal 3/ 309 225 280 e/ 290 e/ 300 Netherlands 3,140 3,230 3,200 e/ 3,200 e/ 3,200 New Caledonia 100 e/ 100 e/ -- -- 100 New Zealand 974 976 950 r/ e/ 960 r/ e/ 950 Nicaragua 360 377 480 r/ 570 r/ 650 Niger e/ 29 2/ 30 30 30 30 Nigeria 2,545 2,520 2,700 e/ 2,500 e/ 2,500 Norway 1,664 1,724 1,676 1,700 e/ 1,720 Oman 1,260 1,264 1,300 e/ 1,300 e/ 1,716 2/Pakistan 8,900 e/ 9,001 8,901 9,300 e/ 9,500 Panama 647 700 750 900 r/ 1,000 See footnotes at end of table.

TABLE 23--ContinuedHYDRAULIC CEMENT: WORLD PRODUCTION, BY COUNTRY 1/
(Thousand metric tons)
Country 1996 1997 1998 1999 2000 e/Paraguay 613 675 e/ 620 r/ 640 r/ 650 Peru 3,848 4,301 4,340 3,799 3,800 Philippines 12,429 14,681 12,888 12,556 12,500 Poland 13,959 15,003 14,970 15,550 r/ 14,807 2/Portugal 8,455 9,395 9,500 e/ 9,500 e/ 9,200 Qatar 690 692 700 e/ 1,025 r/ 1,050 Réunion 299 277 380 r/ 380 r/ 400Romania 6,956 7,298 7,300 6,252 8,264 2/Russia 27,800 26,700 26,000 28,400 32,400 2/Rwanda 42 r/ 60 r/ 59 r/ 66 r/ 70 Saudi Arabia 16,437 15,400 14,000 r/ e/ 14,000 e/ 15,000 Senegal 811 854 1,000 1,000 e/ 1,000 Serbia and Montenegro 2,205 2,011 2,253 1,575 2,117 2/Sierra Leone e/ 160 50 100 100 100Singapore e/ 3,300 3,300 3,300 3,250 3,250 Slovakia 2,802 3,017 3,000 e/ 3,000 e/ 3,000 Slovenia 1,026 1,113 1,149 1,224 r/ 1,300 South Africa e/ 9,000 9,500 9,500 8,900 8,900 Spain (including Canary Islands) 25,157 27,632 27,943 30,800 30,000 Sri Lanka 928 e/ 965 e/ 874 r/ 976 r/ 1,008 2/Sudan 380 e/ 291 206 r/ 267 r/ 300 Suriname e/ 60 65 65 65 65 Sweden 2,447 2,253 2,105 2,100 e/ 2,150 Switzerland 3,638 3,568 3,600 e/ 3,600 e/ 3,600 Syria 4,500 e/ 4,840 r/ 4,607 r/ 4,781 r/ 4,830 Taiwan 21,537 21,522 19,652 18,283 18,500 Tajikistan 50 36 18 30 50 2/Tanzania 726 r/ 621 r/ 778 r/ 833 r/ 833 Thailand 38,749 r/ 37,086 r/ 30,000 r/ e/ 34,000 r/ e/ 32,000 Togo 413 421 565 560 560 Trinidad and Tobago 617 653 690 688 743 2/Tunisia 4,567 4,424 r/ 4,588 r/ 4,864 r/ 5,409 2/Turkmenistan e/ 451 2/ 450 450 450 450 Turkey 35,214 36,035 38,200 34,258 r/ 35,825 2/Uganda 250 r/ 270 r/ 285 r/ 310 r/ 320 Ukraine 5,017 5,098 5,591 5,828 5,311 2/United Arab Emirates e/ 6,000 5,250 6,000 6,000 6,000 United Kingdom 12,214 12,638 12,409 12,697 r/ 12,800 United States (including Puerto 80,818 84,255 85,522 87,777 89,510 2/ Rico) 4/Uruguay 685 781 750 r/ 720 r/ 700 Uzbekistan 3,300 3,300 3,400 e/ 3,300 e/ 3,400 2/Venezuela 7,556 8,145 r/ 8,202 r/ 8,500 r/ e/ 8,600 Vietnam 6,586 8,019 9,700 r/ 10,381 r/ 12,500 Yemen 1,028 1,235 1,201 1,454 1,400 Zambia 348 384 351 300 r/ e/ 380 Zimbabwe e/ 1,000 1,100 1,100 1,000 1,000 Total 5/ 1,493,000 r/ 1,547,000 1,547,000 r/ 1,603,000 r/ 1,643,000 e/ Estimated. p/ Preliminary. r/ Revised. W Withheld to avoid disclosing proprietary data. -- Zero.1/ Table includes data available through August 20, 2001. Data may include clinker exports for some countries.2/ Reported figure.3/ Data for year ending June 30 of that stated.4/ Portland and masonary cements only.5/ Data are rounded to four significant digits.