BY EVAN FRISCIA AND PARTH THAKKAR Introduction to Technical Analysis.
43
BY EVAN FRISCIA AND PARTH THAKKAR Introduction to Technical Analysis
-
Upload
oscar-flowers -
Category
Documents
-
view
222 -
download
3
Transcript of BY EVAN FRISCIA AND PARTH THAKKAR Introduction to Technical Analysis.

BY EVAN FRISCIA AND PARTH THAKKAR
Introduction to Technical Analysis
What is Technical Analysis
Technical analysis is a security analysis discipline for forecasting the direction of prices through the study of past market data, primarily price and volume.
Technical Analysts look at the CHARTS to make a prediction about the FUTURE!

Tenets of Technical Analysis
Market Action Discounts Everything
Prices Move in Trends
Trends (History) tend to Repeat themselves

Lengths of Trends
Long term 9 months or longer
Intermediary 3 months to a 9 months, but
no longer than a year
Short term Days to weeks, but no longer
than 3 months
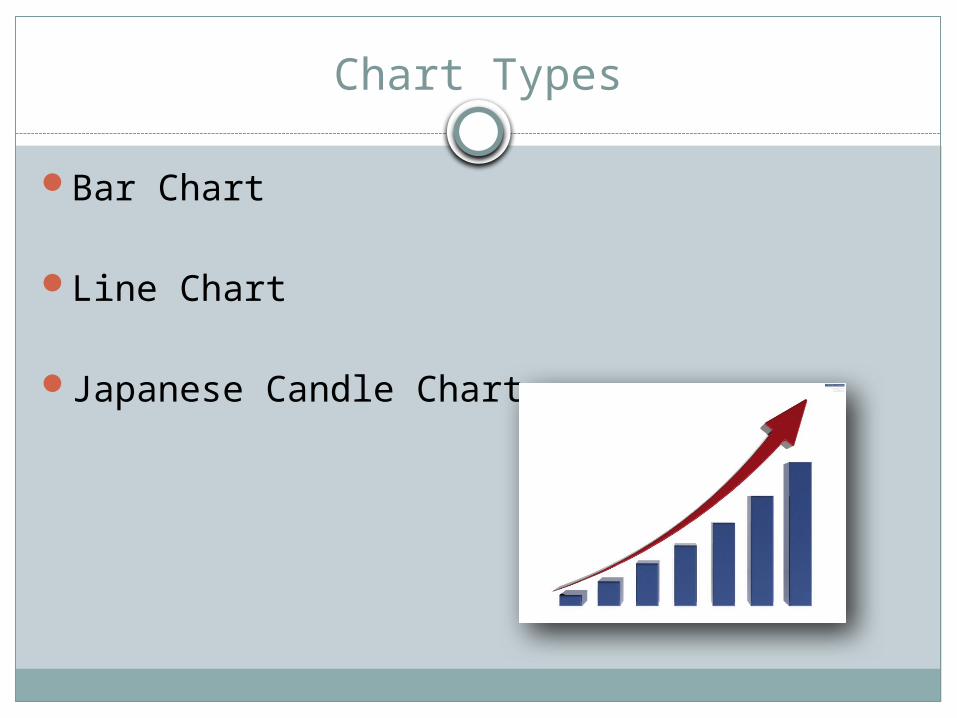
Chart Types
Bar Chart
Line Chart
Japanese Candle Chart
Bar Chart

Line Chart

Candlestick Chart

Candlestick Chart

Directions a Trend can take
Up Trend
Down Trend
Horizontal Trend/Sideways or No Trend
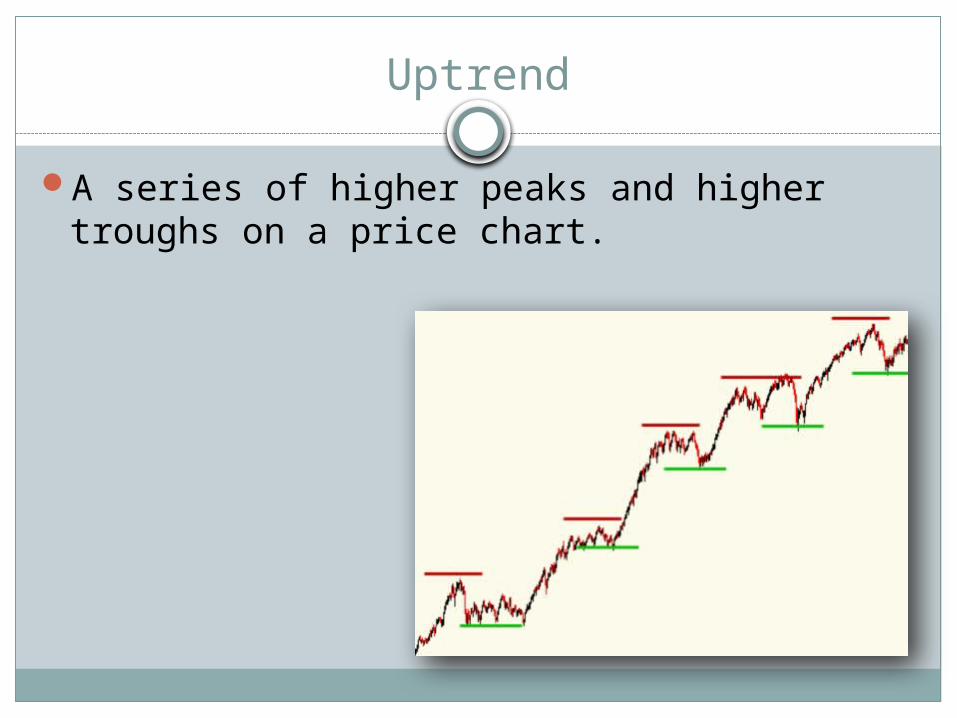
Uptrend
A series of higher peaks and higher troughs on a price chart.

Down Trend
A series of lower peaks and lower troughs on the price chart
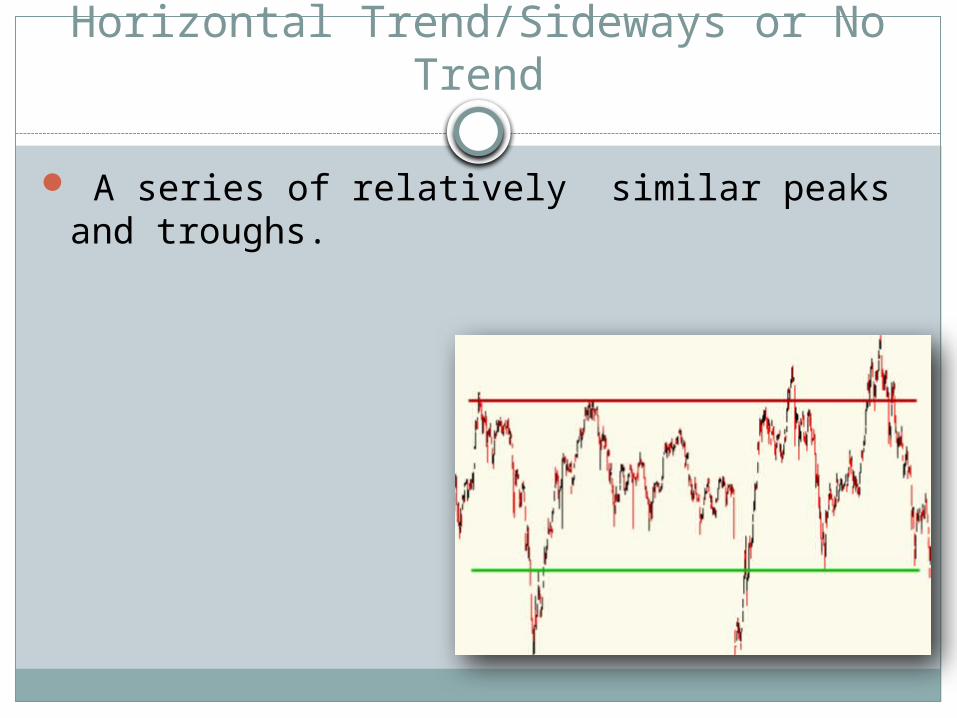
Horizontal Trend/Sideways or No Trend
A series of relatively similar peaks and troughs.
Support
Support is an imaginary price level that is difficult for a stock to move below because there are so many investors willing to buy at that level. It may be a horizontal or diagonal price level.
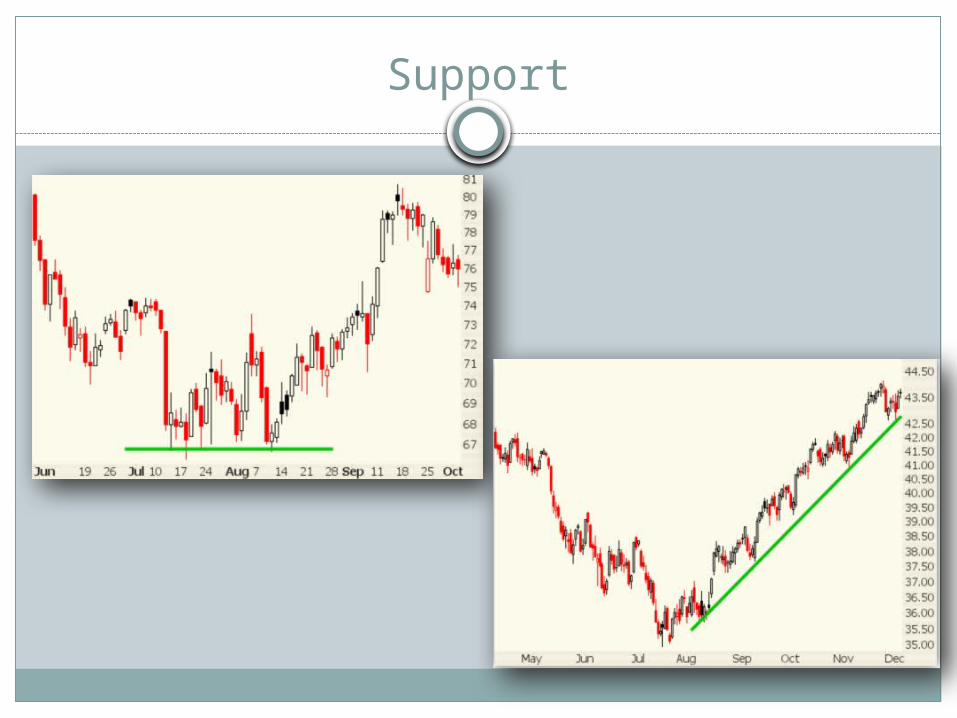
Support
Resistance
Resistance is the opposite of support. It is an imaginary price level that is difficult for a stock to penetrate on the upside. It may be either a horizontal or diagonal price level. Resistance is created when the bears gain enough momentum to overwhelm the bulls and stop or reverse upward movement.

Resistance
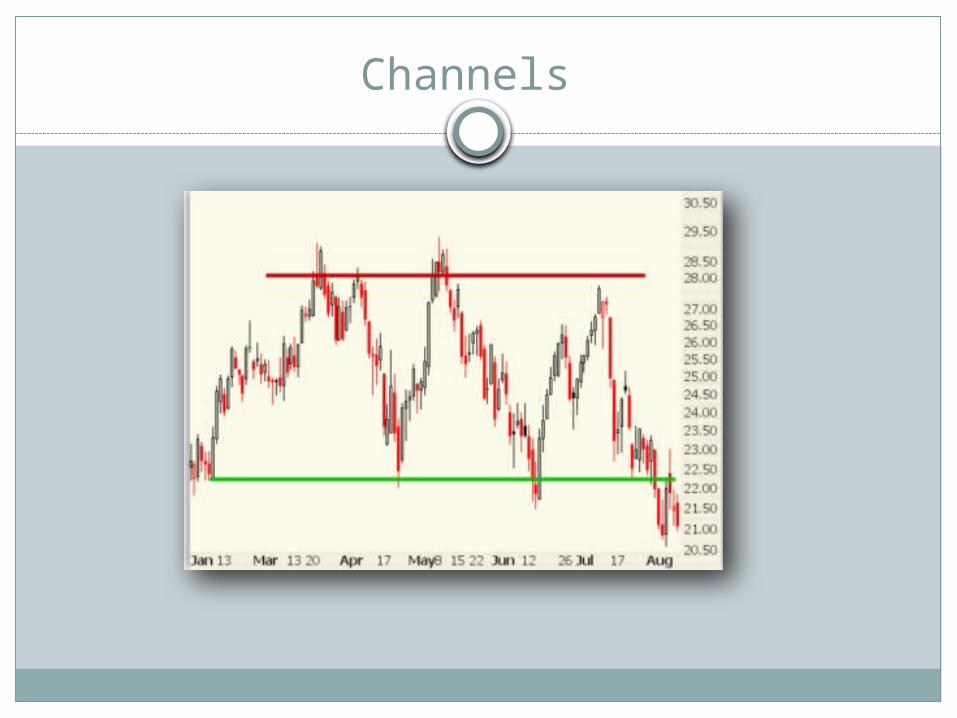
Channels

How do we Conduct Technical Analysis?
Studies!A Technical Study is a function derived from
the stock price, or an underlying factor that determines the stock price.
When graphed, these functions allow give us the information needed to form a Bullish or Bearish opinion towards a
stock!
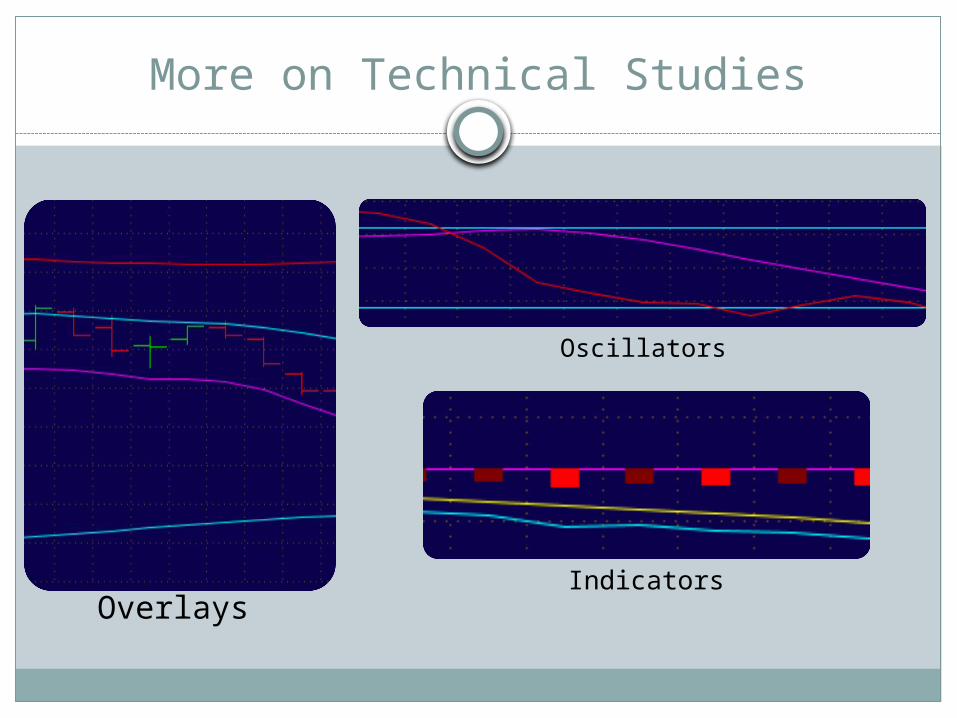
More on Technical Studies
OverlaysIndicators
Oscillators
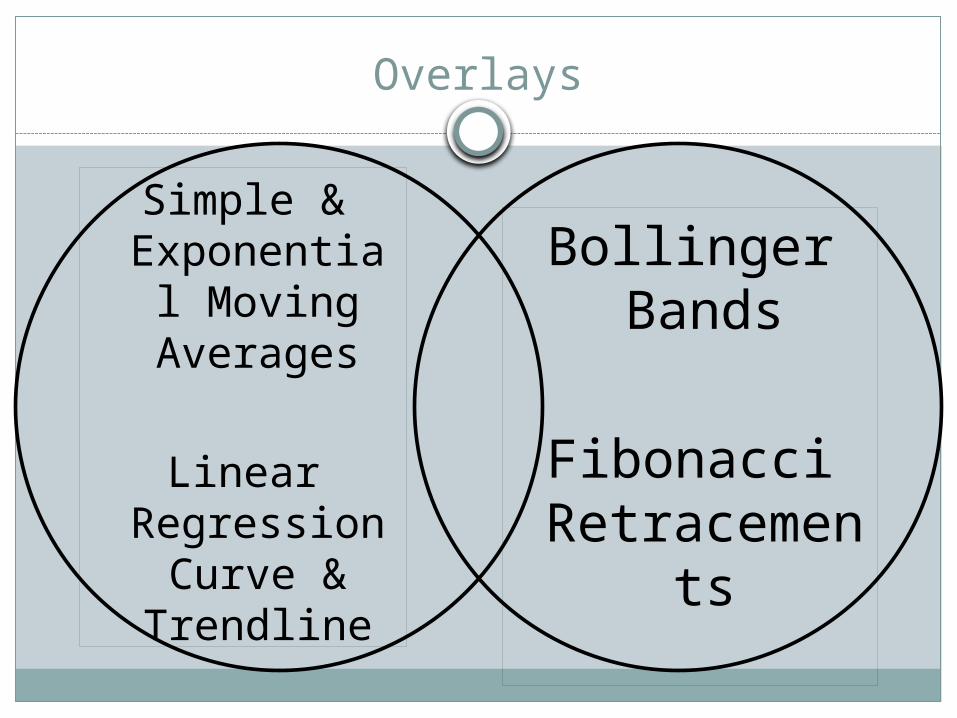
Overlays
Simple & Exponential
Moving Averages
Linear Regression
Curve & Trendline
Bollinger Bands
Fibonacci Retracemen
ts
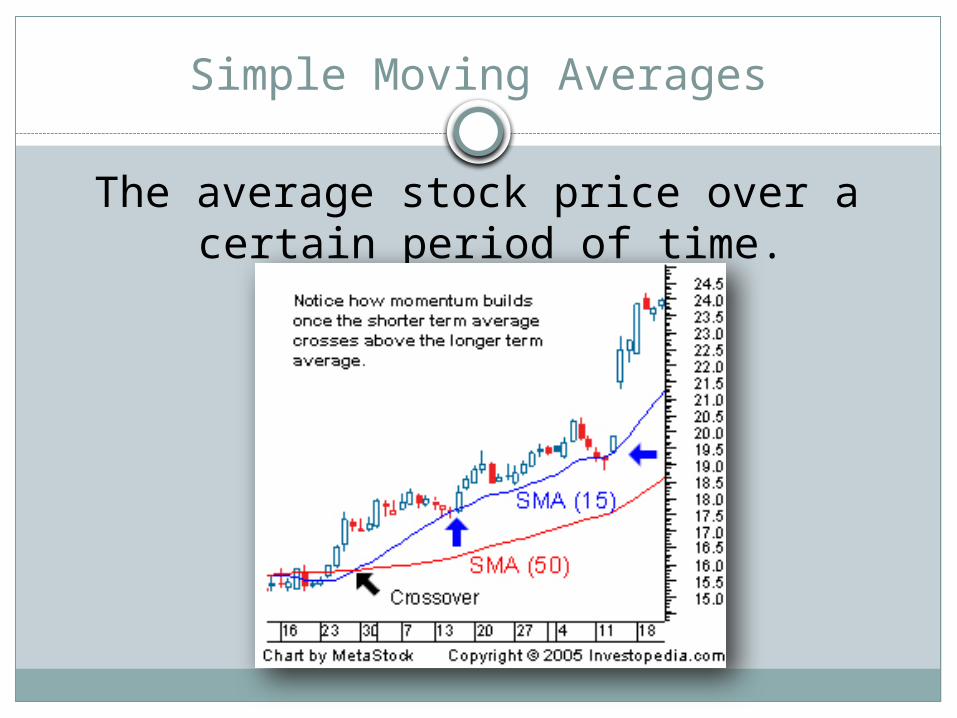
Simple Moving Averages
The average stock price over a certain period of time.
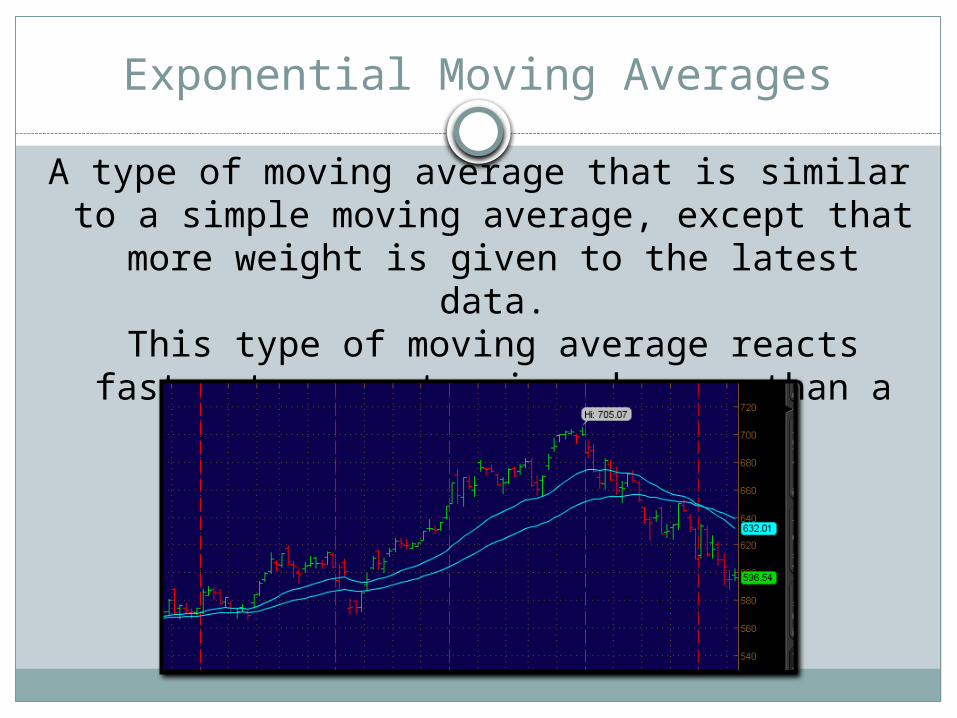
Exponential Moving Averages
A type of moving average that is similar to a simple moving average, except that more
weight is given to the latest data.This type of moving average reacts faster to recent price changes than a simple moving
average.
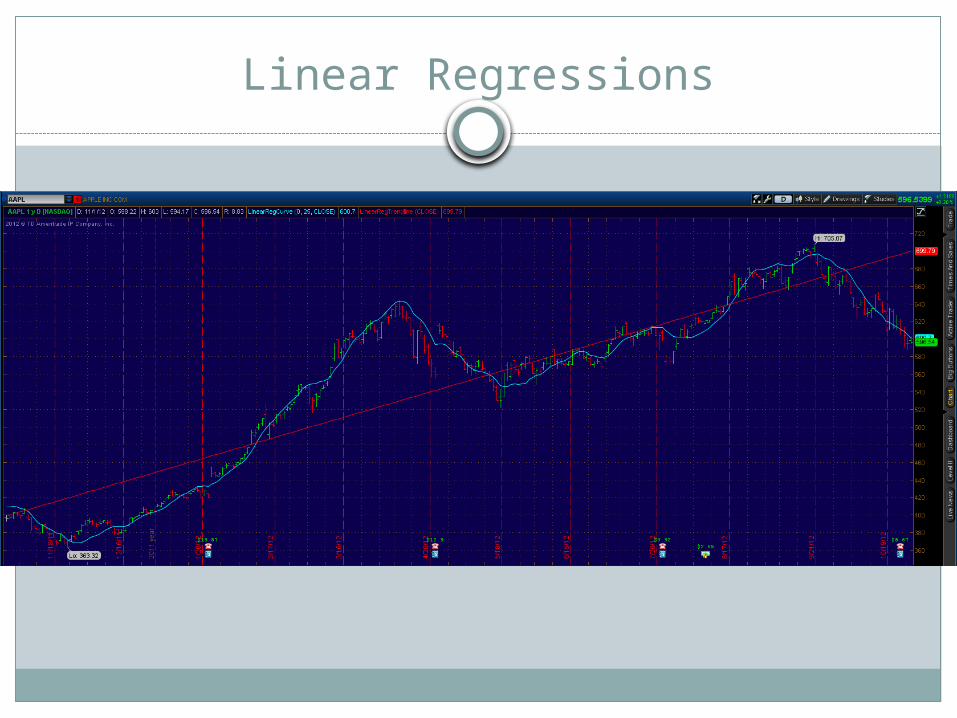
Linear Regressions

Bollinger Bands
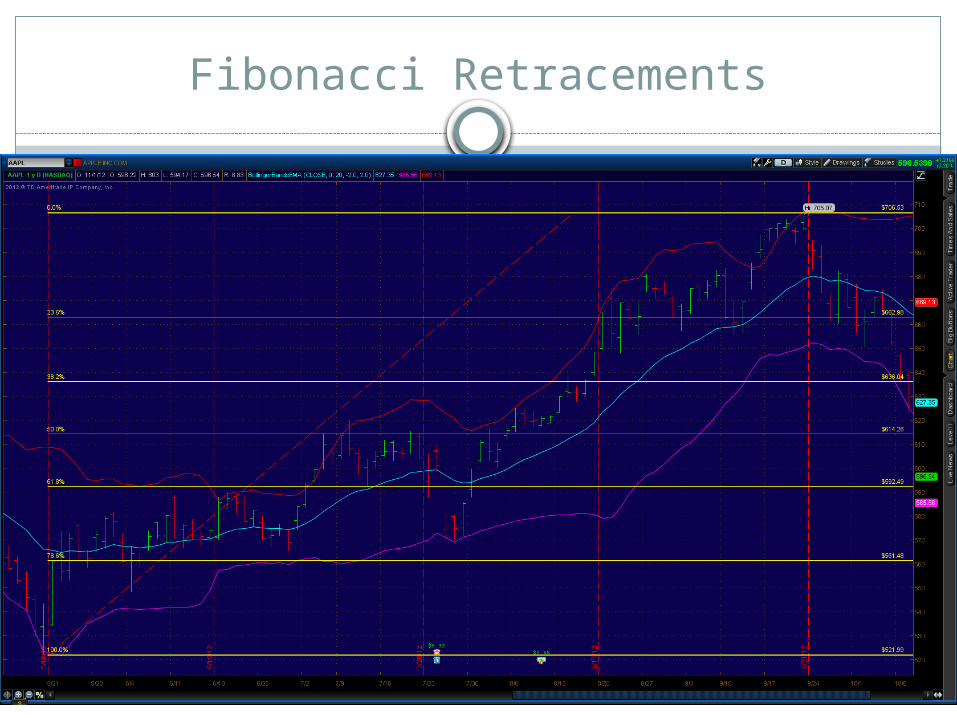
Fibonacci Retracements
Indicators
Moving Average Convergence Divergence (MACD)
Relative Strength (RSI)
MACD
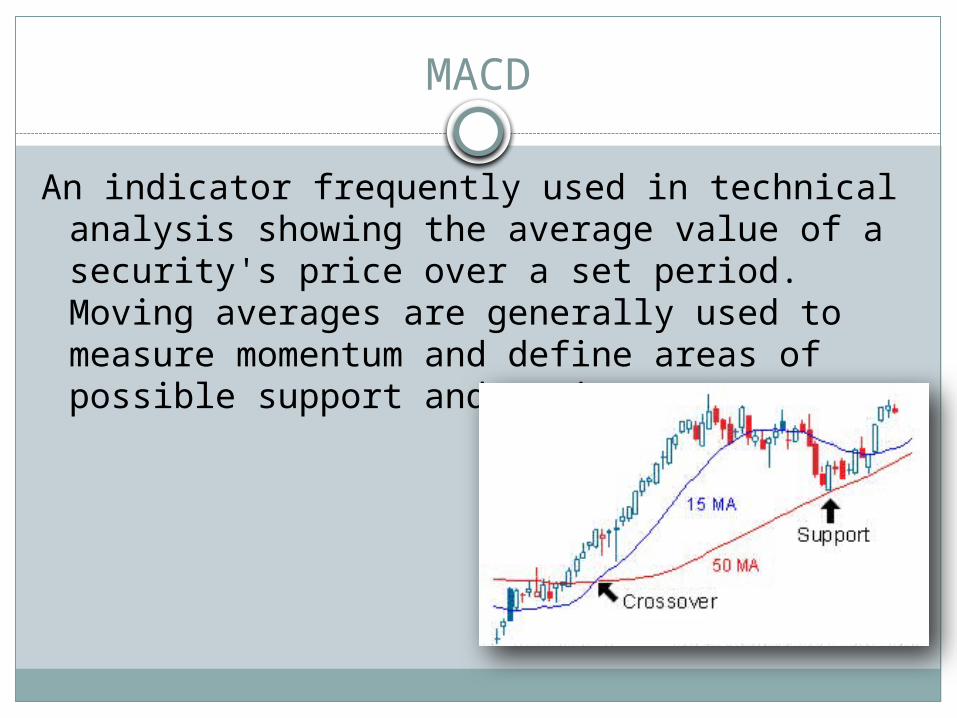
An indicator frequently used in technical analysis showing the average value of a security's price over a set period. Moving averages are generally used to measure momentum and define areas of possible support and resistance.

MACD Application
Observe the Crossovers

MACD Application
Observe the Crossovers

MACD Application
Observe the Crossovers
Relative Strength Indicator
A technical momentum indicator that compares the magnitude of recent gains to recent losses in an attempt to determine overbought and oversold conditions of an asset. It is calculated using the following formula:
RSI = 100 - 100/(1 + RS*)
*Where RS = Average of x days' up closes / Average of x days' down closes
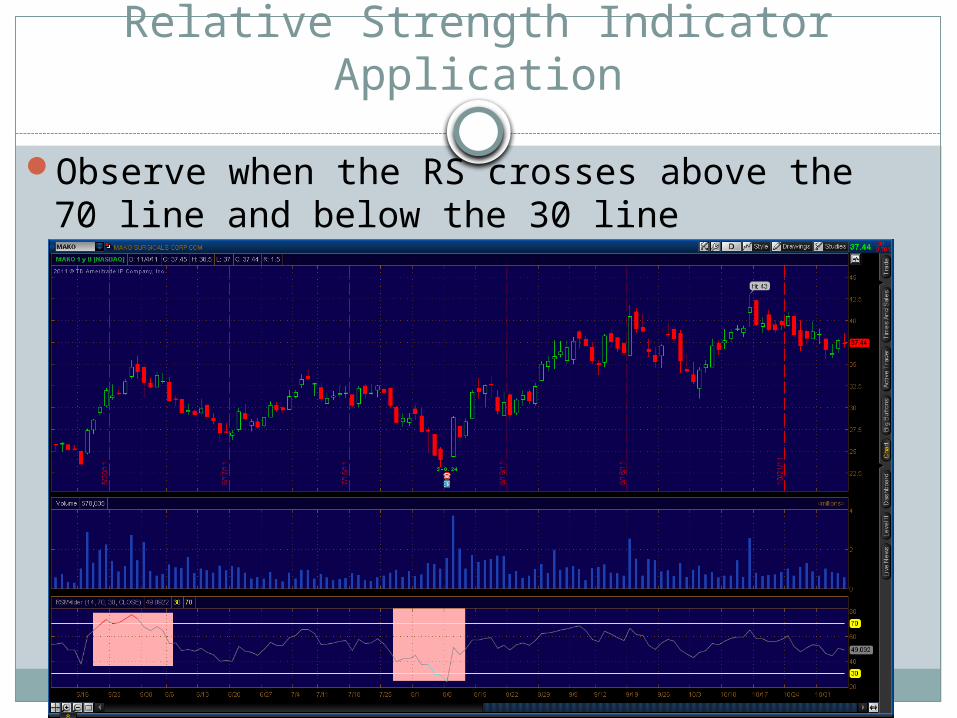
Relative Strength Indicator Application
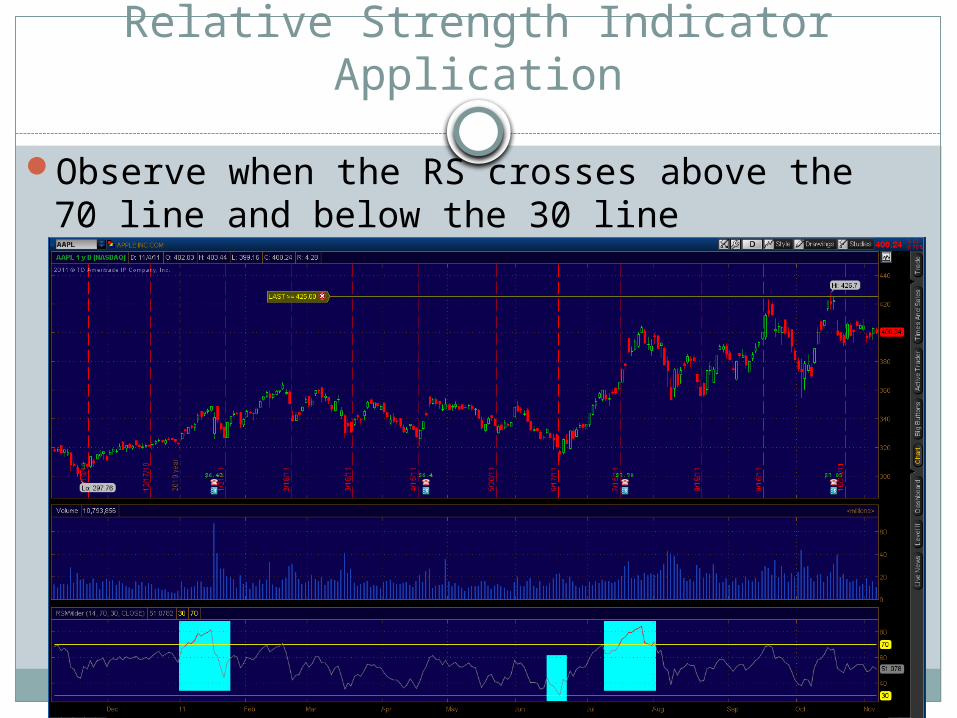
Observe when the RS crosses above the 70 line and below the 30 line
Relative Strength Indicator Application
Observe when the RS crosses above the 70 line and below the 30 line
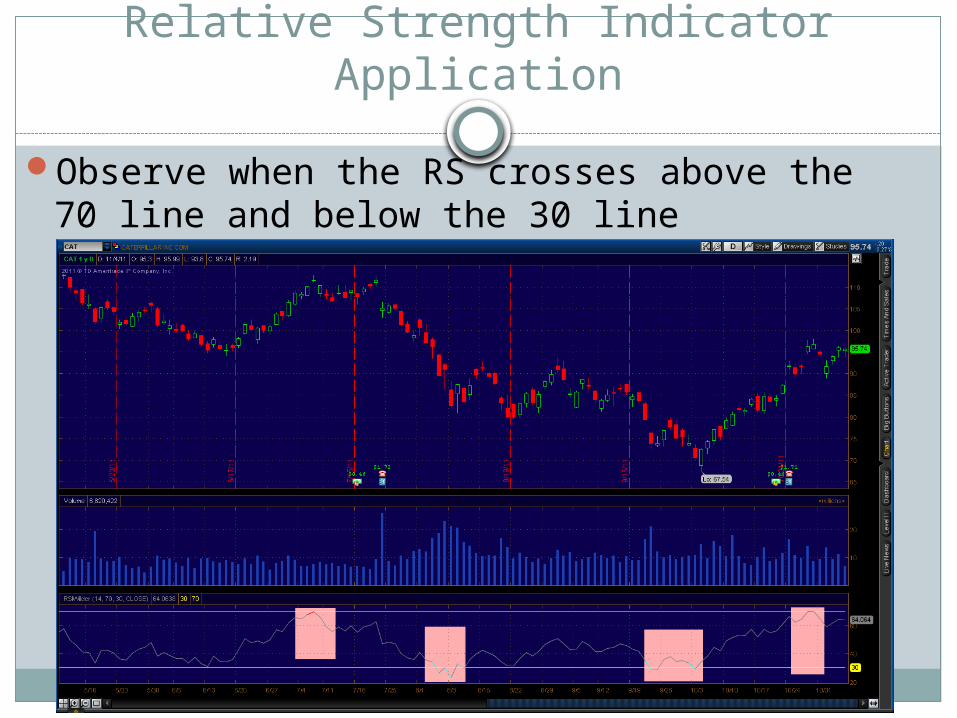
Relative Strength Indicator Application
Observe when the RS crosses above the 70 line and below the 30 line
Oscillators
Stochastic Oscillator
Projection Oscillator

Stochastic Oscillator
A technical momentum indicator that compares a security's closing price to its price range over a given time period
The theory behind this indicator is that in an upward-trending market, prices tend to close near their high, and during a downward-trending market, prices tend to close near their low.
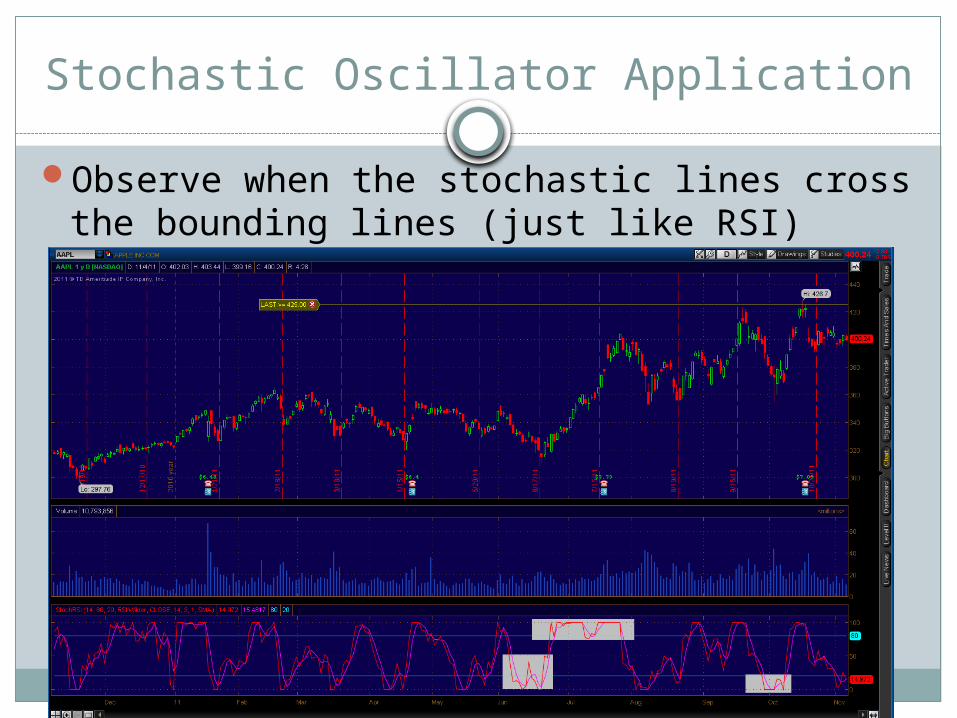
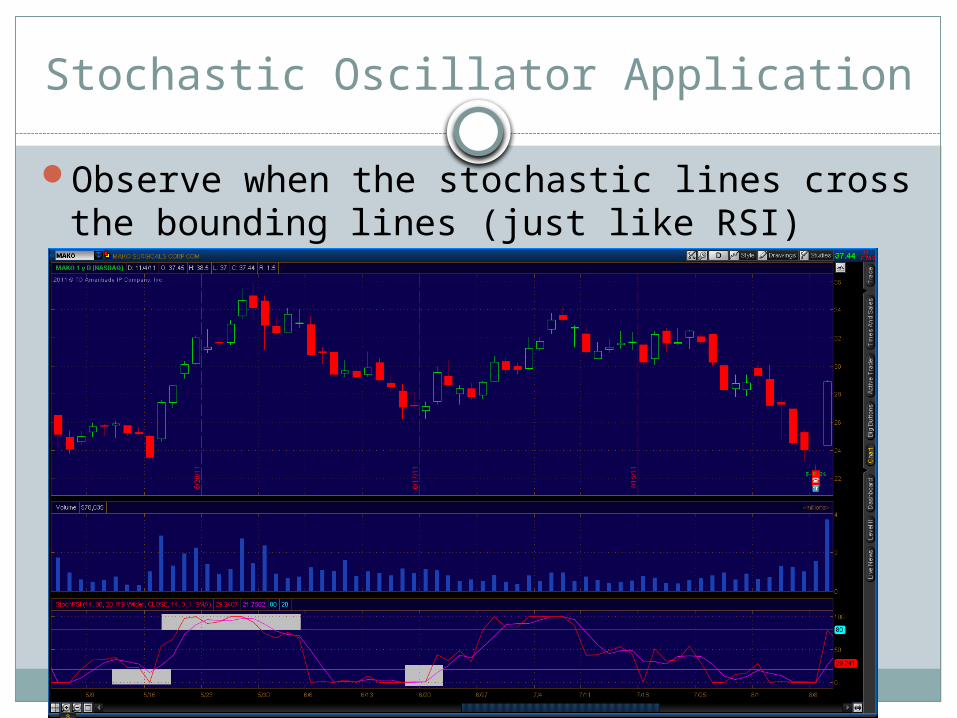
Stochastic Oscillator Application
Observe when the stochastic lines cross the bounding lines (just like RSI)
Stochastic Oscillator Application
Observe when the stochastic lines cross the bounding lines (just like RSI)

Stochastic Oscillator Application
Observe when the stochastic lines cross the bounding lines (just like RSI)
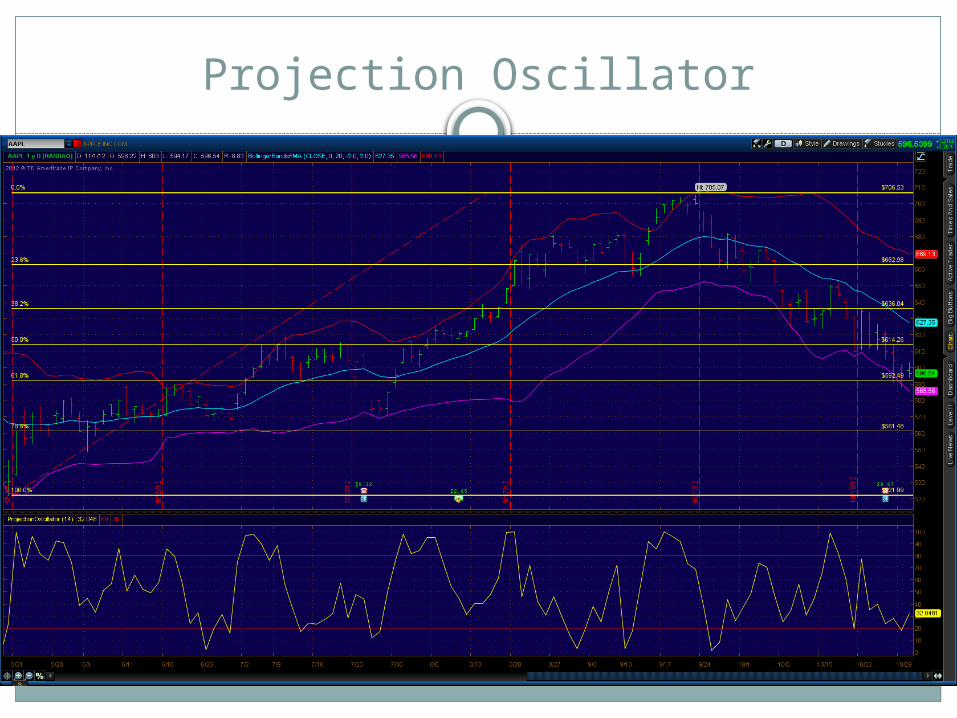
Projection Oscillator
The Projection Oscillator study shows the relationship between the current price and its minimum and maximum prices over time. Unlike the Stochastic Oscillator, here the minimum and maximum prices are adjusted up or down by the slope of the price's regression line.
Projection Oscillator

Questions