by Euromonitor International Cherry · Horticulture trade intelligence Cherry A custom report...
19
Horticulture trade intelligence Cherry A custom report compiled for Hort Innovation by Euromonitor International Q1 Quarter 1: January to March 2017
-
Upload
truongdiep -
Category
Documents
-
view
224 -
download
3
Transcript of by Euromonitor International Cherry · Horticulture trade intelligence Cherry A custom report...

Horticulture trade intelligence
CherryA custom report compiled for Hort Innovationby Euromonitor International
Q1Quarter 1: January to March 2017
Horticulture trade intelligence: Cherry: Q1 2017: Content / Quarterly highlights / Competitor insights / Trade flow / Operating environment / Market overview / Appendix
ContactTim FouldsHead of Research, Australasia Phone: +61 2 9581 9200 Direct: +61 2 9581 9211 [email protected]
This report has been funded by Hort Innovation using the cherry industry R&D levy with contributions from the Australian Government.
Industry highlights 1Competitor insights 4Trade flow 5Operating environment 10Market overview 11Appendix 16
Hort Innovation cherry fund
Content

Horticulture trade intelligence: Cherry: Q1 2017: Content / Quarterly highlights / Competitor insights / Trade flow / Operating environment / Market overview / Appendix
• Q1 export volume declined by 33% y-o-y, with weaker performances in China, Taiwan, South Korea and Thailand.
• Q1 2017 saw a loss in export value of AUD14.6 million in comparison with Q1 2016.
• The Australian cherry industry aims to export 12,000 tonnes by 2020/21, an increase of 340% over the 2015 levels.
• On average, over 2012-2016, Q1 accounted for 54% of cherries by volume and 64% by value of total annual exports.
• Hong Kong, China and Taiwan remained the key export destinations for Australian cherries, representing over 61% ofexport volumes in Q1 2017.
• Hong Kong (38% of export volumes in Q1 2017) is a major re-export hub for China.
• China is a key market to watch – exports of AUD0.7 million in Q1 2013 increased to AUD6.6 million in Q1 2017, withgrowth of 843%.
• Chile is a key competitor to Australia, particularly in China, which accounted for 83% of Chilean cherry exports in Q1 2017.
• New Zealand and Argentina also pose a direct threat to Australia, particularly in Hong Kong, Singapore and the US, due tothe similar harvest season.
• Imports stood at 3 tonnes in Q1 2017, with Serbia accounting for a 63% volume share.
Hort Innovation cherry fund
Quarterly highlights: Summary
Asian markets remain key to Australian success
1Source: IHS Global Trade Atlas; Australian Cherry SIP 2017-2021; Euromonitor International analysis

Horticulture trade intelligence: Cherry: Q1 2017: Content / Quarterly highlights / Competitor insights / Trade flow / Operating environment / Market overview / Appendix
Hort Innovation cherry fund
Quarterly highlights: Export volume
Lower volumes across key Asian markets
Volume (tonnes) Volume share
Q1 2016 Q1 2017 y-o-y growth Q1 2016 Q1 2017
Hong Kong 743 725 -2% 26% 38%
China 646 290 -55% 22% 15%
Taiwan 494 163 -67% 17% 9%
Singapore 132 151 14% 5% 8%
USA 63 124 97% 2% 6%
UAE 130 94 -28% 5% 5%
Indonesia 71 78 10% 3% 4%
South Korea 295 68 -77% 10% 4%
Malaysia 94 63 -33% 3% 3%
Thailand 97 39 -60% 3% 2%
Others 114 120 5% 4% 6%
Total 2,879 1,915 -33% 100% 100%
• As a re-export hub, Hong Kong accounted for the largest volume share, with 38% of total Australian exports in Q1 2017.
• Singapore and Indonesia were the only large Asian markets to which exports increased, registering growth of 14% and 10% respectively.
• China, Taiwan, South Korea and Thailand registered significant volume declines in Q1 2017.
• Australia exported 124 tonnes of cherries to the US in Q1, registering dynamic growth of 97%.
Source: IHS Global Trade Atlas; Euromonitor International analysis; countries are ranked based on Q1 2017 data
2

Horticulture trade intelligence: Cherry: Q1 2017: Content / Quarterly highlights / Competitor insights / Trade flow / Operating environment / Market overview / Appendix
Hort Innovation cherry fund
Quarterly highlights: Export value
Reduced harvests result in high prices for Australian cherries
Value (AUD '000) Value share Average price (AUD per kg)
Q1 2016 Q1 2017 y-o-y growth Q1 2016 Q1 2017 Q1 2016 Q1 2017 y-o-y growth
Hong Kong 12,434 13,210 6% 25% 38% 16.7 18.2 9%
China 13,608 6,623 -51% 28% 19% 21.1 22.8 8%
Taiwan 9,242 3,456 -63% 19% 10% 18.7 21.2 13%
Singapore 2,080 2,254 8% 4% 7% 15.8 14.9 -6%
Indonesia 1,560 1,777 14% 3% 5% 22.0 22.8 4%
USA 961 1,716 79% 2% 5% 15.1 13.9 -8%
UAE 1,068 1,207 13% 2% 4% 8.2 12.8 56%
Malaysia 1,484 1,116 -25% 3% 3% 15.8 17.7 12%
South Korea 3,950 987 -75% 8% 3% 13.4 14.5 8%
Thailand 1,425 551 -61% 3% 2% 14.7 14.1 -4%
Others 1,186 1,542 30% 3% 4% 10.4 12.9 24%
Total 48,998 34,439 -30% 100% 100% 17.0 18.0 6%
• Despite recording volume declines, Hong Kong and the UAE registered value growth in Q1 2017, owing to price increases.
• The price of cherries to the UAE rose strongly, reflecting a price point of AUD12.8 per kg in Q1 2017, compared with AUD8.2 per kg in Q1 2016.
• The US and Singapore, which performed strongly, saw lower unit prices in Q1 2017 from the previous year.
Source: IHS Global Trade Atlas; Euromonitor International analysis; countries are ranked based on Q1 2017 data
3
Horticulture trade intelligence: Cherry: Q1 2017: Content / Quarterly highlights / Competitor insights / Trade flow / Operating environment / Market overview / Appendix
Hort Innovation cherry fund
Competitor insights: Key competitors
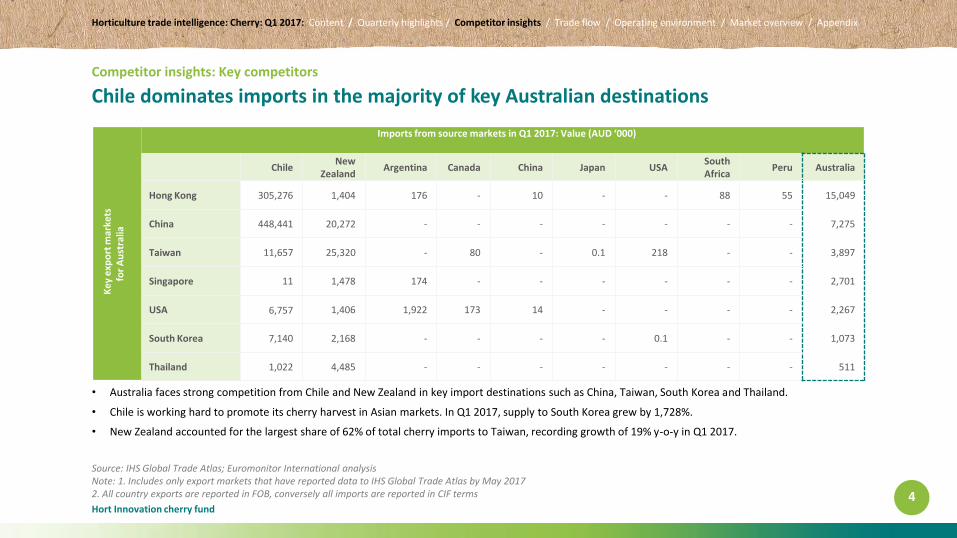
Chile dominates imports in the majority of key Australian destinations
• Australia faces strong competition from Chile and New Zealand in key import destinations such as China, Taiwan, South Korea and Thailand.
• Chile is working hard to promote its cherry harvest in Asian markets. In Q1 2017, supply to South Korea grew by 1,728%.
• New Zealand accounted for the largest share of 62% of total cherry imports to Taiwan, recording growth of 19% y-o-y in Q1 2017.
Source: IHS Global Trade Atlas; Euromonitor International analysisNote: 1. Includes only export markets that have reported data to IHS Global Trade Atlas by May 20172. All country exports are reported in FOB, conversely all imports are reported in CIF terms 4
Ke
y e
xpo
rt m
arke
tsfo
r A
ust
ralia
Imports from source markets in Q1 2017: Value (AUD ‘000)
ChileNew
ZealandArgentina Canada China Japan USA
SouthAfrica
Peru Australia
Hong Kong 305,276 1,404 176 - 10 - - 88 55 15,049
China 448,441 20,272 - - - - - - - 7,275
Taiwan 11,657 25,320 - 80 - 0.1 218 - - 3,897
Singapore 11 1,478 174 - - - - - - 2,701
USA 6,757 1,406 1,922 173 14 - - - - 2,267
South Korea 7,140 2,168 - - - - 0.1 - - 1,073
Thailand 1,022 4,485 - - - - - - - 511
-50%
0%
50%
100%
150%
200%
250%
0
500
1,000
1,500
2,000
2,500
3,000
3,500
Q1 2011 Q1 2012 Q1 2013 Q1 2014 Q1 2015 Q1 2016 Q1 2017
y-o
-y g
row
th (
%)
Trad
e b
alan
ce (
ton
nes
)
Trade balance
% y-o-y growth
Horticulture trade intelligence: Cherry: Q1 2017: Content / Quarterly highlights / Competitor insights / Trade flow / Operating environment / Market overview / Appendix
Hort Innovation cherry fund
International trade analysis
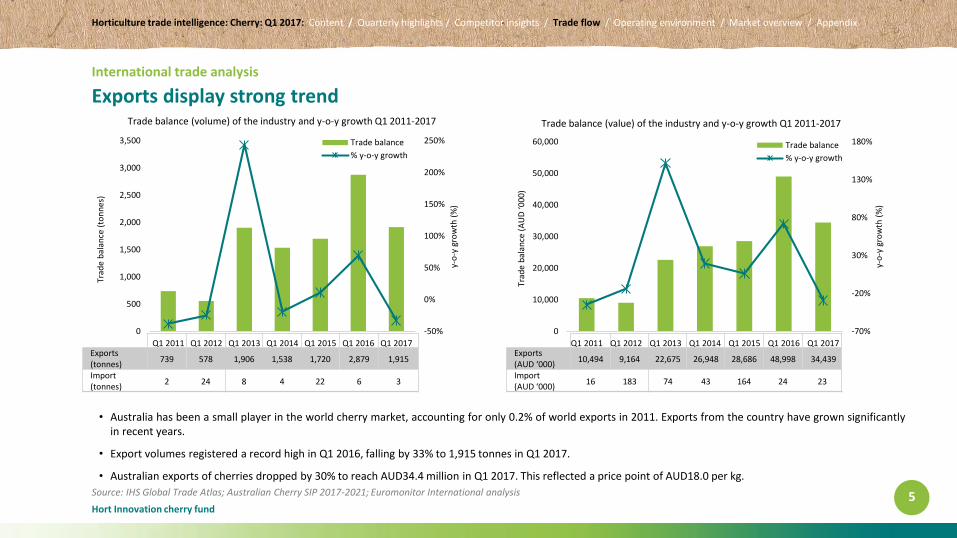
Exports display strong trend
• Australia has been a small player in the world cherry market, accounting for only 0.2% of world exports in 2011. Exports from the country have grown significantlyin recent years.
• Export volumes registered a record high in Q1 2016, falling by 33% to 1,915 tonnes in Q1 2017.
• Australian exports of cherries dropped by 30% to reach AUD34.4 million in Q1 2017. This reflected a price point of AUD18.0 per kg.
Source: IHS Global Trade Atlas; Australian Cherry SIP 2017-2021; Euromonitor International analysis 5
Trade balance (volume) of the industry and y-o-y growth Q1 2011-2017
Exports (tonnes)
739 578 1,906 1,538 1,720 2,879 1,915
Import (tonnes)
2 24 8 4 22 6 3
Trade balance (value) of the industry and y-o-y growth Q1 2011-2017
Exports (AUD ‘000)
10,494 9,164 22,675 26,948 28,686 48,998 34,439
Import (AUD ‘000)
16 183 74 43 164 24 23
-70%
-20%
30%
80%
130%
180%
0
10,000
20,000
30,000
40,000
50,000
60,000
Q1 2011 Q1 2012 Q1 2013 Q1 2014 Q1 2015 Q1 2016 Q1 2017
y-o
-y g
row
th (
%)
Trad
e b
alan
ce (
AU
D ‘0
00
)
Trade balance
% y-o-y growth

Horticulture trade intelligence: Cherry: Q1 2017: Content / Quarterly highlights / Competitor insights / Trade flow / Operating environment / Market overview / Appendix
Hort Innovation cherry fund
International trade exports
Hong Kong maintains its position as the key export destination
• Hong Kong, the largest market for exports of Australian cherries, primarily tranships most of its stock to China for final consumption. The rise in exports toChina can be attributed to direct exports of cherries from Tasmania since its post-2013 pest-free status.
• Exports to Taiwan registered a decline of 67% in volume terms over 2016. However, New Zealand and Chile remained the largest exporters to Taiwan in Q12017, growing by 27% and 24% respectively.
• Singapore, a non-protocol market with many air freight options from Australia, is a consistent export destination for Australian cherries. In Q1 2017, itaccounted for 8% of exports, compared to 5% for Q1 2016.
Source: IHS Global Trade Atlas; Euromonitor International analysis; raw data is available in the appendix 6
0
500
1,000
1,500
2,000
2,500
3,000
3,500
Q1 2011 Q1 2012 Q1 2013 Q1 2014 Q1 2015 Q1 2016 Q1 2017
Exp
ort
vo
lum
e (t
on
nes
)
Others
Thailand
Malaysia
South Korea
Indonesia
United Arab Emirates
USA
Singapore
Taiwan
China
Hong Kong, China
Volume of exports from Australia by destination Q1 2011-2017

Horticulture trade intelligence: Cherry: Q1 2017: Content / Quarterly highlights / Competitor insights / Trade flow / Operating environment / Market overview / Appendix
Hort Innovation cherry fund
International trade exports
Beyond Asia, the US is a promising destination for Australian cherries
• Exports to the US, valued at AUD1.7 million, rose by 79% in Q1 2017. Australia’s share of exports to the US grew by 13% in the last year.
• The UAE, another strong performer in value terms, accounted for a 4% share of exports. Export values to this market surpassed some key Asian markets,registering growth of 13%.
• Australian cherries face strong competition in South Korea from Chile . Its share of Australian cherry exports fell from 8% in Q1 2016 to 3% in Q1 2017; this wasdue in large part to Chile.
7
0
10,000
20,000
30,000
40,000
50,000
60,000
Q1 2011 Q1 2012 Q1 2013 Q1 2014 Q1 2015 Q1 2016 Q1 2017
Exp
ort
val
ue
(AU
D '0
00
)
Others
Thailand
South Korea
Malaysia
United Arab Emirates
USA
Indonesia
Singapore
Taiwan
China
Hong Kong, China
Value of exports from Australia by destination Q1 2011-2017
Source: IHS Global Trade Atlas; Euromonitor International analysis; raw data is available in the appendix

Horticulture trade intelligence: Cherry: Q1 2017: Content / Quarterly highlights / Competitor insights / Trade flow / Operating environment / Market overview / Appendix
Hort Innovation cherry fund
International trade imports
Cherries are in season in the first quarter – reducing the reliance on imports
• The first quarter of every year registers significant production, and exports take precedence over imports. As production is cyclical, imports play an important role during the off-season to fill the supply gap.
• Serbia is a fairly new supplier to the Australian market. The lower price point of Serbian cherries pushes higher volume sales, and the country held a higher volume share of 63% in Q1 2017.
• The value of imports from New Zealand is much higher compared to imports from Serbia. This highlights the stark difference between the price of imports from the two countries. New Zealand exported at an average price of AUD13.4 per kg and Serbia at AUD2.9 per kg in Q1 2017.
8
0
5
10
15
20
25
30
Q1 2011 Q1 2012 Q1 2013 Q1 2014 Q1 2015 Q1 2016 Q1 2017
Imp
ort
vo
lum
e (t
on
nes
)
Serbia
Iran
USA
New Zealand
Volume of imports to Australia by source Q1 2011-2017
0
20
40
60
80
100
120
140
160
180
200
Q1 2011 Q1 2012 Q1 2013 Q1 2014 Q1 2015 Q1 2016 Q1 2017
Imp
ort
val
ue
(AU
D '0
00
)
Serbia
Iran
USA
New Zealand
Value of imports to Australia by source Q1 2011-2017
Source: IHS Global Trade Atlas; Euromonitor International analysis; raw data is available in the appendix
Horticulture trade intelligence: Cherry: Q1 2017: Content / Quarterly highlights / Competitor insights / Trade flow / Operating environment / Market overview / Appendix
Hort Innovation cherry fund
International trade prices
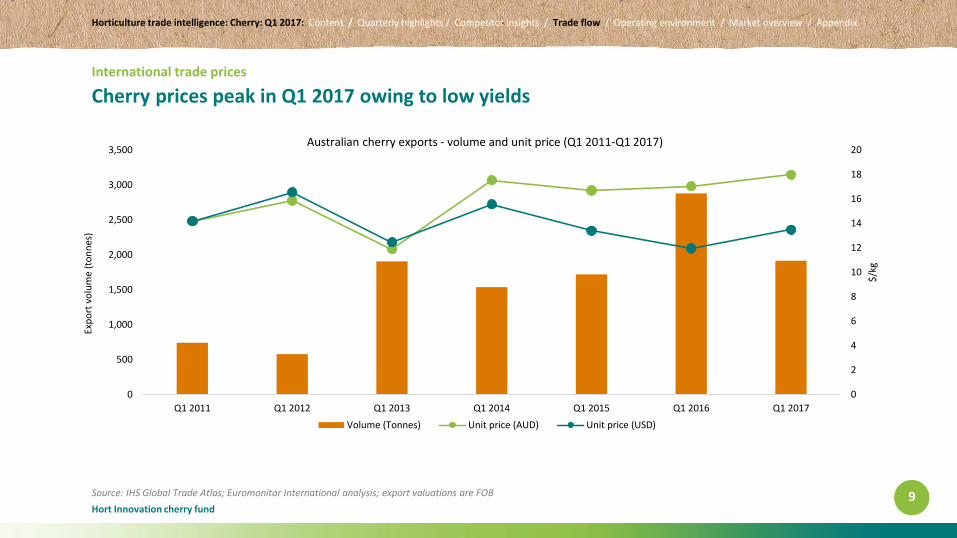
Cherry prices peak in Q1 2017 owing to low yields
9
0
2
4
6
8
10
12
14
16
18
20
0
500
1,000
1,500
2,000
2,500
3,000
3,500
Q1 2011 Q1 2012 Q1 2013 Q1 2014 Q1 2015 Q1 2016 Q1 2017
$/k
g
Exp
ort
vo
lum
e (t
on
nes
)
Australian cherry exports - volume and unit price (Q1 2011-Q1 2017)
Volume (Tonnes) Unit price (AUD) Unit price (USD)
Source: IHS Global Trade Atlas; Euromonitor International analysis; export valuations are FOB

Horticulture trade intelligence: Cherry: Q1 2017: Content / Quarterly highlights / Competitor insights / Trade flow / Operating environment / Market overview / Appendix
Hort Innovation cherry fund
Key trends: Consumers and business dynamics
Health and wellness spurs the consumption of fruit in major export markets
10
Hong Kong: Consumption of fruit is influenced by rising health-consciousness• In 2016, total per capita consumer expenditure was AUD43,717and total
per capita consumer expenditure on fruit stood at AUD425. This is amongst the highest in Asia-Pacific, supported by rising health-consciousness among local consumers.
• In the Index of Economic Freedom 2016 by the Heritage Foundation and the Wall Street Journal, Hong Kong achieved the top rank globally, which is illustrative of a highly favourable regulatory environment.
Taiwan: Health and wellness receives considerable attention• Taiwan is characterised by an increase in the ease of doing business and
improving regulatory quality, led by government reforms, such as an online 1-stop shop for business registration in 2012.
• Increased awareness of health and well-being is driven by government campaigns such as TTM’s “Healthy Kaikai, Healthy Life”, promoting healthy foods for students, in partnership with the Taiwan Health Centre. In 2016, total per capita consumer expenditure was AUD16,719 and per capita consumer expenditure on fruit stood at AUD225.
Singapore: Government initiatives drive healthy consumption• Singapore is characterised by high regulatory quality
and a business-friendly climate, ranking second in the World Bank’s Ease of Doing Business report in 2017.
• With the government intensifying its efforts to promote healthy consumption and living, consumers are increasingly informed and discerning regarding their diet, and put considerable emphasis on regional produce. In 2016, total per capita consumer expenditure was AUD26,906 and per capita consumer expenditure on fruit stood at AUD195.
South Korea: Highly developed infrastructure and further investment makes it an attractive export destination• South Korea is ranked fifth in the World Bank’s Ease of Doing Business,
with a highly developed ICT environment and a highly educated population. The logistics environment has improved significantly over 2010-2015.
• As per a Consumers Korea survey, South Koreans are willing to pay a high price for imported fruit. In 2016, total per capita consumer expenditure was AUD17,754 and per capita consumer expenditure on fruit stood at AUD289.
China: Consumption of fruit benefits from rising consumer purchasing power• Consumer expenditure on fruit increased by a CAGR of
11% over 2011-2016, to reach an estimated AUD167 billion in 2016, supported by rising disposable incomes. This increase was driven by the rise in the middle class, which accounted for 23% of all households in 2016, and the convenience of e-retailing of fruit. In 2016, total per capita consumer expenditure was AUD4,398 and per capita consumer expenditure on fruit stood at AUD126.
• Modern retailers such as supermarkets and hypermarkets accounted for 36% of fresh food retail sales, increasing by a CAGR of 10% over 2011-2016.
Source: IHS Global Trade Atlas; Euromonitor International analysis

Horticulture trade intelligence: Cherry: Q1 2017: Content / Quarterly highlights / Competitor insights / Trade flow / Operating environment / Market overview / Appendix
Hort Innovation cherry fund
Market overview: Hong Kong
Hong Kong remains a re-export hub to mainland China
• In 2016, Chile represented 85% of Hong Kong’s 99,499 tonnes of imports, growing by 76% from 2015. In December 2016, Chile started operating direct ocean freight to Hong Kong, by-passing Taiwan and thereby reducing the turnaround time by five days.
• Cherries are the most important fresh fruit imported to Hong Kong. They represented 21% of total import value in 2016, taking precedence over other major fruits, such as durian and oranges. Imports rose by 60% from 2015, to reach a value of AUD743.8 million.
Source: IHS Global Trade Atlas; Euromonitor International analysis
11
CountriesImport volumes
2016 (tonnes)
Total 99,499
Chile 84,959
USA 10,561
Australia 1,446
Argentina 1,191
Canada 790
Others 551
Chile85%
USA11%
Australia1%
Argentina1%
Canada1%
Others1%
Major exporters of cherry to Hong Kong 2016: volume share
444
669
1,5511,650
2,293
1,446
51%
132%
6%
39%
-…-60%
-40%
-20%
0%
20%
40%
60%
80%
100%
120%
140%
160%
0
500
1,000
1,500
2,000
2,500
2011 2012 2013 2014 2015 2016
y-o
-y g
row
th
Imp
ort
vo
lum
e (t
on
nes
)
Import volume from Australia 2011-2016
Imports (Tonnes) Y-o-Y growthImports (tonnes) y-o-y growth
Market Overview: This is a special section included in every Q1 report, that reports on key markets on an annual basis

Chile84%
USA13%
Canada2%
New Zealand1%
Australia<1% Others
<1%
Major exporters of cherry to China 2016: volume share
Horticulture trade intelligence: Cherry: Q1 2017: Content / Quarterly highlights / Competitor insights / Trade flow / Operating environment / Market overview / Appendix
Hort Innovation cherry fund
Market overview: China
Counter-seasonal production favours imports from Chile
• Imports from Chile grew by 23% in 2016, to reach 91,637 tonnes. Unlike Chile, the US does not have a counter-seasonal advantage, and competes with thelocal cherry season, hence its imports rose by only 6% in 2016, to reach 13,830 tonnes.
• It is customary for Chinese households to give fruit as a gift whilst visiting friends and family, and particularly during the winter (November-March) cherriesare highly valued.
• 2016 was a dynamic year for cherries, as the value of imports rose by 18% from 2015, reaching the highest share of 16% of total imports of fruits.
12
CountriesImport volumes
2016 (tonnes)
Total 109,153
Chile 91,637
USA 13,830
Canada 1,910
New Zealand 983
Australia 670
Others 124
66
335392
670405%
17%
71%
0%
50%
100%
150%
200%
250%
300%
350%
400%
450%
0
100
200
300
400
500
600
700
800
2011 2012 2013 2014 2015 2016
y-o
-y g
row
th
Imp
ort
vo
lum
e (t
on
nes
)
Import volume from Australia 2011-2016
Imports (Tonnes) Y-o-Y growthImports (tonnes) y-o-y growth
Source: IHS Global Trade Atlas; Euromonitor International analysis
Market Overview: This is a special section included in every Q1 report, that reports on key markets on an annual basis
Horticulture trade intelligence: Cherry: Q1 2017: Content / Quarterly highlights / Competitor insights / Trade flow / Operating environment / Market overview / Appendix
Hort Innovation cherry fund
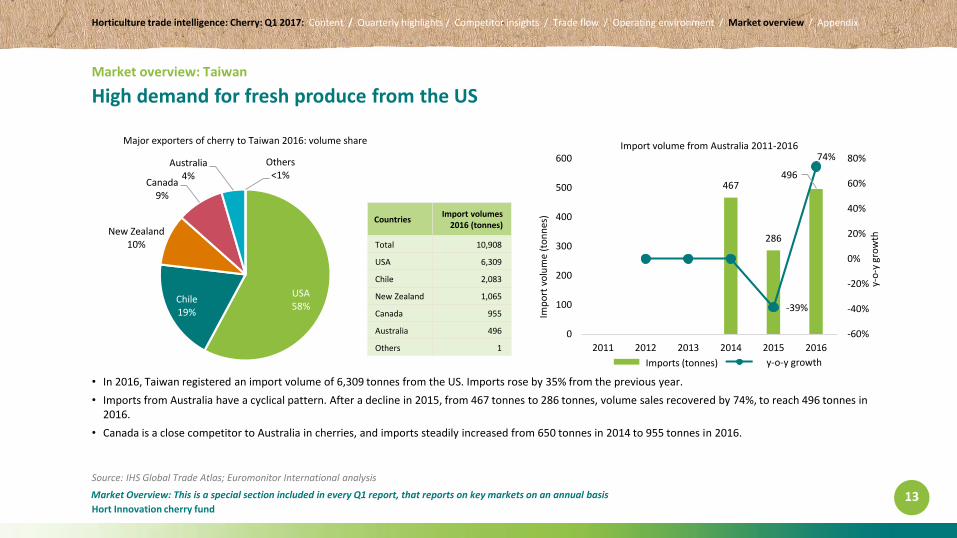
Market overview: Taiwan
High demand for fresh produce from the US
• In 2016, Taiwan registered an import volume of 6,309 tonnes from the US. Imports rose by 35% from the previous year.
• Imports from Australia have a cyclical pattern. After a decline in 2015, from 467 tonnes to 286 tonnes, volume sales recovered by 74%, to reach 496 tonnes in 2016.
• Canada is a close competitor to Australia in cherries, and imports steadily increased from 650 tonnes in 2014 to 955 tonnes in 2016.
13
CountriesImport volumes
2016 (tonnes)
Total 10,908
USA 6,309
Chile 2,083
New Zealand 1,065
Canada 955
Australia 496
Others 1
USA58%
Chile19%
New Zealand10%
Canada9%
Australia4%
Others<1%
Major exporters of cherry to Taiwan 2016: volume share
467
286
496
-39%
74%
-60%
-40%
-20%
0%
20%
40%
60%
80%
0
100
200
300
400
500
600
2011 2012 2013 2014 2015 2016
y-o
-y g
row
th
Imp
ort
vo
lum
e (t
on
nes
)
Import volume from Australia 2011-2016
Imports (Tonnes) Y-o-Y growthImports (tonnes) y-o-y growth
Source: IHS Global Trade Atlas; Euromonitor International analysis
Market Overview: This is a special section included in every Q1 report, that reports on key markets on an annual basis

Horticulture trade intelligence: Cherry: Q1 2017: Content / Quarterly highlights / Competitor insights / Trade flow / Operating environment / Market overview / Appendix
Hort Innovation cherry fund
Market overview: Singapore
Singapore sees rapid growth in imports from the US and Canada
• The US is the major supplier of cherries to Singapore, representing a volume of 959 tonnes in 2016. Import volume from the US registered significant growth, of 500% in 2016.
• Singapore is the fourth largest market for Australian cherries. Import volume stood at 273 tonnes in 2016. Australia is exposed to threats from Canadian supply, which has grown significantly, reaching 216 tonnes in 2016.
• Imports from Argentina have been consistently rising, to reach 98 tonnes in 2016. Supply from Argentina has counter-seasonal advantage due to its Southern Hemisphere location.
14
CountriesImport volumes
2016 (tonnes)
Total 1,900
USA 959
Australia 273
Canada 216
Argentina 98
Chile 65
Others 290
USA51%
Australia14%
Canada11%
Argentina5%
Chile4%
Others15%
Major exporters of cherry to Singapore 2016: volume share
0
216
332
399
560
2730%
54%
20%
40%
-51%-60%
-40%
-20%
0%
20%
40%
60%
0
100
200
300
400
500
600
2011 2012 2013 2014 2015 2016
y-o
-y g
row
th
Imp
ort
vo
lum
e (t
on
nes
)
Import volume from Australia 2011-2016
Imports (Tonnes) Y-o-Y growthImports (tonnes) y-o-y growth
Source: IHS Global Trade Atlas; Euromonitor International analysis
Market Overview: This is a special section included in every Q1 report, that reports on key markets on an annual basis

Horticulture trade intelligence: Cherry: Q1 2017: Content / Quarterly highlights / Competitor insights / Trade flow / Operating environment / Market overview / Appendix
Hort Innovation cherry fund
Market overview: South Korea
Chilean cherries gained entry into the South Korean market in 2016
• The US dominates the South Korean import market for cherries accounting for a 90% market share in 2016. US imports have risen 33% over 2012-2016 owing to the US-Korea free trade agreement, an elimination of the 24% import duty on cherries, and strong marketing efforts by US agricultural associations.
• Chilean imports of cherries to South Korea started for the first time in 2016 as South Korea allowed fumigation free Chilean cherries to enter the country. Chile accounted for 5% market share in 2016 in volume terms.
15
CountriesImport volumes
2016 (tonnes)
Total 13,819
United States 12,387
Chile 690
Australia 311
New Zealand 281
Uzbekistan 150
Others 0
United States90%
Chile5%
Australia2%
New Zealand2%
Uzbekistan1%
Major exporters of cherry to South Korea 2016: volume share
8 924
297310
25%
157%
1,123%
4% 0%
200%
400%
600%
800%
1,000%
1,200%
0
50
100
150
200
250
300
350
2011 2012 2013 2014 2015 2016
y-o
-y g
row
th
Imp
ort
vo
lum
e (t
on
nes
)
Import volume from Australia 2011-2016
Imports (tonnes) y-o-y growth
Source: IHS Global Trade Atlas; Euromonitor International analysis; Press release
Market Overview: This is a special section included in every Q1 report, that reports on key markets on an annual basis
Horticulture trade intelligence: Cherry: Q1 2017: Content / Quarterly highlights / Competitor insights / Trade flow / Operating environment / Market overview / Appendix
Hort Innovation cherry fund
Appendix
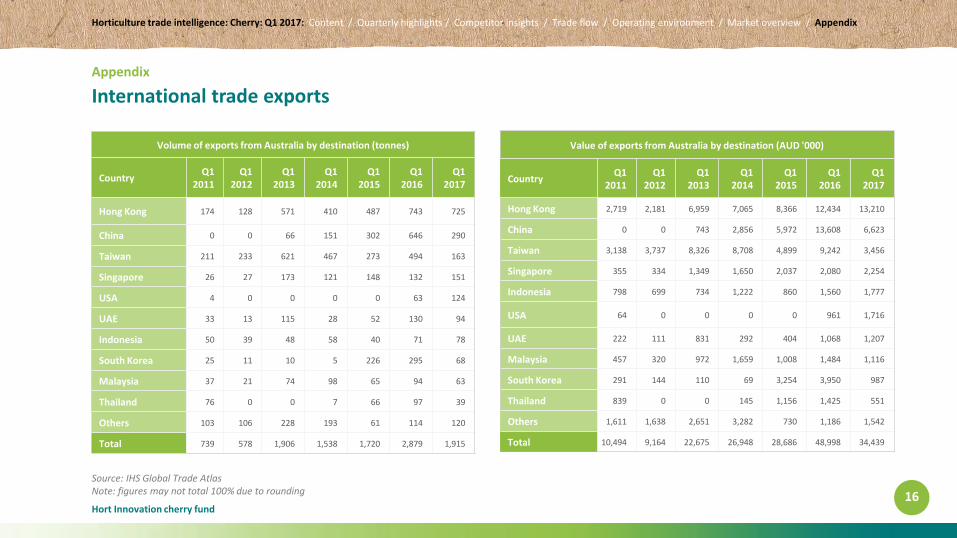
International trade exports
Source: IHS Global Trade AtlasNote: figures may not total 100% due to rounding 16
Volume of exports from Australia by destination (tonnes)
CountryQ1
2011Q1
2012Q1
2013Q1
2014Q1
2015Q1
2016Q1
2017
Hong Kong 174 128 571 410 487 743 725
China 0 0 66 151 302 646 290
Taiwan 211 233 621 467 273 494 163
Singapore 26 27 173 121 148 132 151
USA 4 0 0 0 0 63 124
UAE 33 13 115 28 52 130 94
Indonesia 50 39 48 58 40 71 78
South Korea 25 11 10 5 226 295 68
Malaysia 37 21 74 98 65 94 63
Thailand 76 0 0 7 66 97 39
Others 103 106 228 193 61 114 120
Total 739 578 1,906 1,538 1,720 2,879 1,915
Value of exports from Australia by destination (AUD '000)
CountryQ1
2011Q1
2012Q1
2013Q1
2014Q1
2015Q1
2016Q1
2017
Hong Kong 2,719 2,181 6,959 7,065 8,366 12,434 13,210
China 0 0 743 2,856 5,972 13,608 6,623
Taiwan 3,138 3,737 8,326 8,708 4,899 9,242 3,456
Singapore 355 334 1,349 1,650 2,037 2,080 2,254
Indonesia 798 699 734 1,222 860 1,560 1,777
USA 64 0 0 0 0 961 1,716
UAE 222 111 831 292 404 1,068 1,207
Malaysia 457 320 972 1,659 1,008 1,484 1,116
South Korea 291 144 110 69 3,254 3,950 987
Thailand 839 0 0 145 1,156 1,425 551
Others 1,611 1,638 2,651 3,282 730 1,186 1,542
Total 10,494 9,164 22,675 26,948 28,686 48,998 34,439

Horticulture trade intelligence: Cherry: Q1 2017: Content / Quarterly highlights / Competitor insights / Trade flow / Operating environment / Market overview / Appendix
Hort Innovation cherry fund
Appendix
International trade imports
17
Volume of imports to Australia by source (tonnes)
CountryQ1
2011Q1
2012Q1
2013Q1
2014Q1
2015Q1
2016Q1
2017
New Zealand 0 24 6 2 15 6 1
USA 1 0 2 0 0 0 0
Iran 1 0 0 0 0 0 0
Serbia 0 0 0 2 7 0 2
Total 2 24 8 4 22 6 3
Value of imports to Australia by source (AUD '000)
CountryQ1
2011Q1
2012Q1
2013Q1
2014Q1
2015Q1
2016Q1
2017
New Zealand 0 181 49 26 149 22 17
USA 10 2 25 10 0 0 0
Iran 6 0 0 0 0 2 0
Serbia 0 0 0 7 15 0 6
Total 16 183 74 43 164 24 23
Horticulture Innovation Australia Limited (Hort Innovation) makes no representations and expressly disclaims all warranties (to the extent permitted by law) about the accuracy, completeness, or currency of information in Horticulture Trade Intelligence Reporting 2017-2019.Reliance on any information provided by Hort Innovation is entirely at your own risk. Hort Innovation is not responsible for, and will not be liable for, any loss, damage, claim, expense, cost (including legal costs) or other liability arising in any way, including from any Hort Innovation or other person’s negligence or otherwise from your use or non-use of Horticulture Trade Intelligence Reporting 2017-2019, or from reliance on information contained in the material or that Hort Innovation provides to you by any other means.
Source: IHS Global Trade AtlasNote: figures may not total 100% due to rounding