By: Eddie Oldfield Mapping for Public Health, Environment, and Public Safety.
27
By: Eddie Oldfield Mapping for Public Health, Environment, and Public Safety
-
date post
21-Dec-2015 -
Category
Documents
-
view
216 -
download
0
Transcript of By: Eddie Oldfield Mapping for Public Health, Environment, and Public Safety.

By: Eddie Oldfield
Mapping for Public Health, Environment, and Public Safety

The Greenhouse Effect
Earth’s surface is heated by the sun and radiates the heat back out towards space
Solar energy from the sunpasses throughthe atmosphere
Greenhouse gases in the atmospheretrap some of the heat
Some energy is reflected back out to space
L’Effet de Serre

What’s wrong
warmerwarmertemperatures?temperatures?
withwith

More severe More severe weather eventsweather events
Longer and more Longer and more intense intense heat wavesheat waves• worse air worse air pollutionpollution• increase in increase in heat-related heat-related illnessillness
DroughtsDroughts
Lowered Lowered freshwater levelsfreshwater levels
Sea-levelSea-level rise rise on all three on all three coastscoastsSpread of Spread of
Infectious Infectious DiseasesDiseases
Impacts

National Geographic, August 2005National Geographic, August 2005
City Beneath the Sea!
Hurricane Katrina hits New Orleans
Warmer water
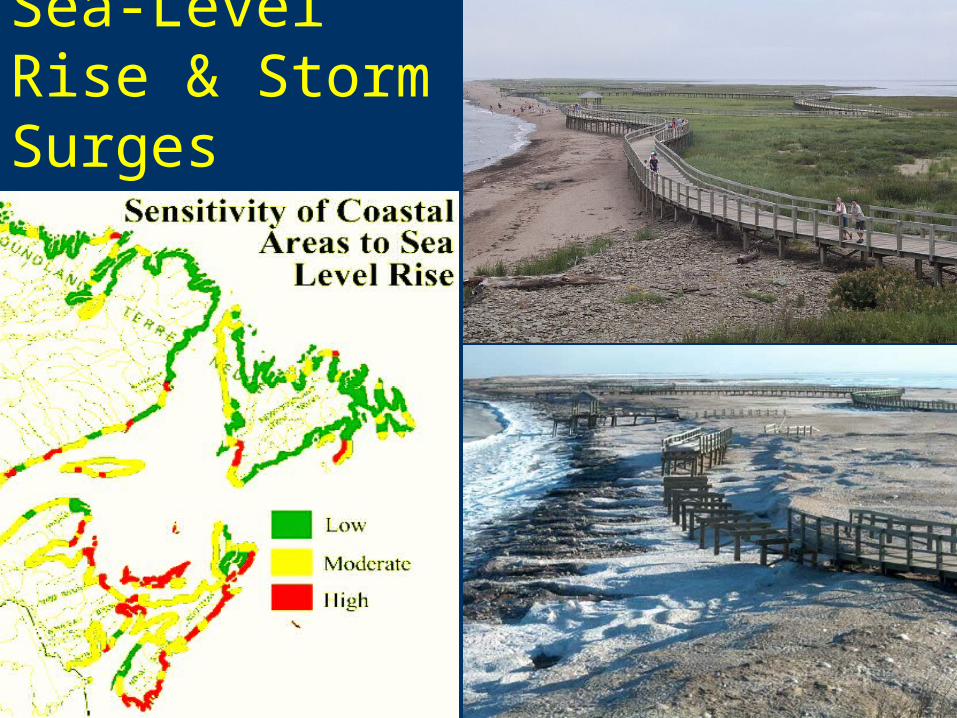
Sea-Level Rise & Storm Surges

Victoria Calgary Winnipeg London Quebec Fredericton
0
10
20
30
40
50
Days/Year
Daily Maximum Temperature >30°C or >35°C
> 30 C (1951-80)
> 30 C (2 X CO2)
Projected Number of Hot Days Per Year
> 35 C (2 X CO2)
Warmer Temperatures, Worsening Air Quality, and Human Health?

Mortality in Paris June-August 2003
Source: INVS, 2003
325 in one day

Global warming killed 150,000 people in 2000 and the death toll could double again in the next 30 years if current trends are not reversed
One heat wave killed 20,000 people in Europe alone (in 2003)
-World Health Organization
Current: 0.6 degrees Celcius warmer
Arctic has experienced 20% decrease in ice extent in 30 years
1.5 degrees warmer
8 million additional people at risk of coastal flooding
20 million additional people at risk from hunger
150 million additional people at risk from malaria
18% of species to extinction
Health OutcomesHealth Outcomes

Expected Global ImpactsExpected Global Impacts3 degrees warmer
Near total loss of Arctic Ice
100 million additional people at risk of coastal flooding
300 million additional people at risk of malaria
3 billion people at risk of water shortage
Meltdown of Greenland ice sheet – several meters of sea level rise
The earth becomes a net contributor to CO2 emissions (melting
permafrosts, erosion of soils and vegetation, desertification)
4-5 degrees warmer
Thermohaline shutdown probability over 50%
Source: Pembina Institute

United Nations Framework Convention
on Climate Change www.unfccc.int
In 1997, over 150 countries agreed to
establish the
Kyoto Protocol

Welcome to Kyoto
The Kyoto Protocol became international law on February The Kyoto Protocol became international law on February 16, 200516, 2005
The first meeting of the UNFCCC (signatories to Kyoto) will The first meeting of the UNFCCC (signatories to Kyoto) will take place in Montreal, November, 2005take place in Montreal, November, 2005

New Brunswick Lung Association
Hosts Hub – Delivers One Tonne Challenge www.nbhub.org Communities: Delivers Partners for Climate Protection in NB –
Goal: greenhouse gas reduction Fleet Challenge (fuel efficiency) Healthy Homes, Schools, and Workplaces (energy efficiency
and indoor air quality) International Center for Air Quality and Health (research and
advocacy – NorthEast) Environmental-Health Mapping portal www.nb.lung.ca/mapping

www.nbhub.org

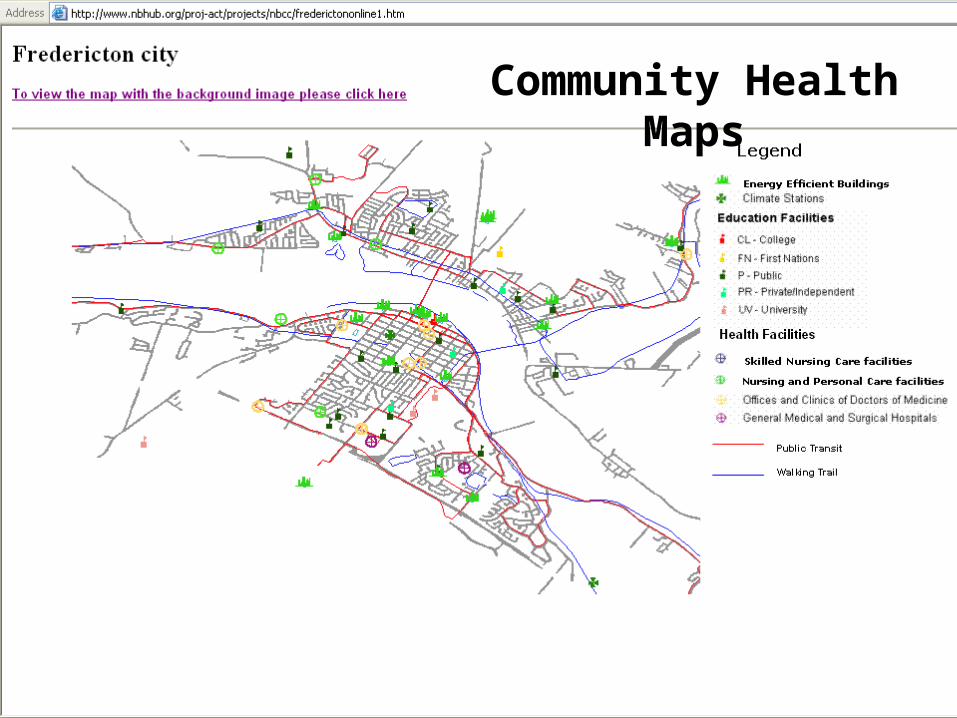
Community Health Maps

Linking climate, air quality, and health care capacity

User QueriesUser Queries
User Requirements User Requirements are metare met
Spatial Modeling and Spatial Modeling and AnalysisAnalysis
e.g. Disease Clustering; Flood Zonese.g. Disease Clustering; Flood Zones
Data IntegrationData Integration
Web-GISWeb-GIS
Delivery ChannelsDelivery Channels
Meteorological DataMeteorological Data
Health DataHealth Data
Population / Population / Demographic DataDemographic Data
Land FeaturesLand Features
Case / location-specificCase / location-specificSpatial dataSpatial data
Data:Data:
The value of GIS:The value of GIS:

NB NB LungLungWMSWMS
DBDB
CGDI CGDI ServicesServices
CGDI - enabledCGDI - enabled
WMSWMS
WFSWFS
WMSWMS
Client Interface
System Administrator
Interface
OGC Standards (interoperability)
Discovery Portal
Data Model Data Model


City of Moncton

Add slide showing graph / map, air quality + health in a community

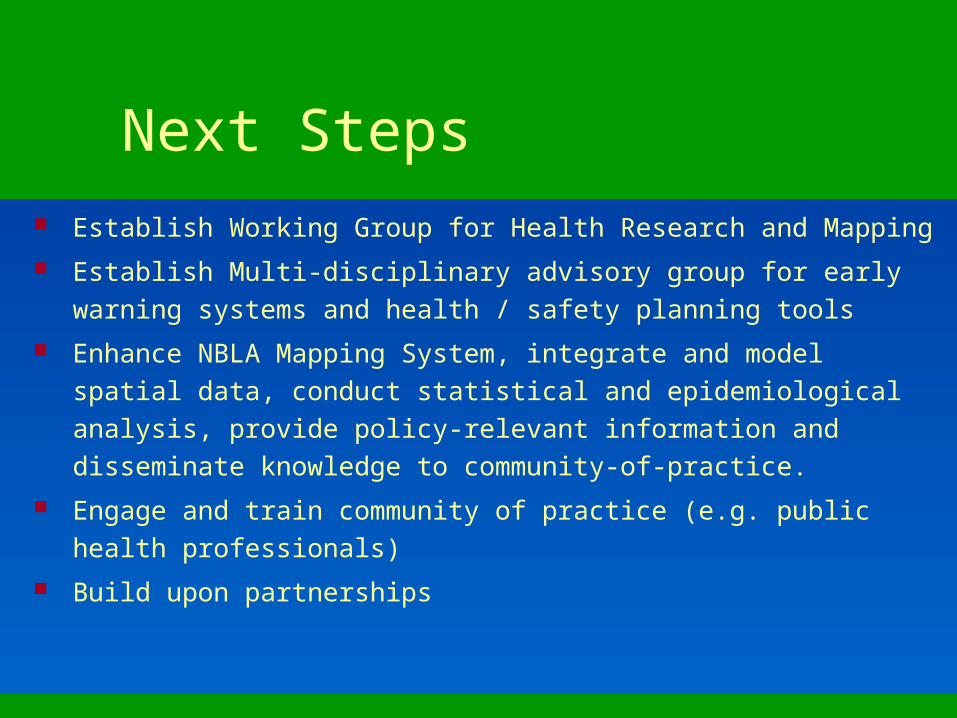
Next Steps
Establish Working Group for Health Research and Mapping
Establish Multi-disciplinary advisory group for early warning systems
and health / safety planning tools
Enhance NBLA Mapping System, integrate and model spatial data,
conduct statistical and epidemiological analysis, provide policy-
relevant information and disseminate knowledge to community-of-
practice.
Engage and train community of practice (e.g. public health
professionals)
Build upon partnerships

Break-Out GroupsBreak-Out Groups
We want:We want:
• To know what user requirements are (your needs)To know what user requirements are (your needs)
• To know what data is neededTo know what data is needed
• To build a data model and focus spatial analysis / map-To build a data model and focus spatial analysis / map-based researchbased research
• To discuss how data is delivered to: doctors, nurses, health To discuss how data is delivered to: doctors, nurses, health planners, hospital managers, health emergency officials, planners, hospital managers, health emergency officials, researchers, general publicresearchers, general public
• To engage / train public health professionalsTo engage / train public health professionals

GROUP 1:GROUP 1: Patti Parker - focus: health issues and requirements Patti Parker - focus: health issues and requirements
GROUP 2:GROUP 2: Barb MacKinnon – focus: environmental-health policy / maps, Barb MacKinnon – focus: environmental-health policy / maps,
training and user engagement, data needs, decision-support requirements training and user engagement, data needs, decision-support requirements
GROUP 3:GROUP 3: Michael Sutherland – focus: cross-linkages between health, Michael Sutherland – focus: cross-linkages between health,
environment, public safety, and aboriginal communities; + delivery channelsenvironment, public safety, and aboriginal communities; + delivery channels
GROUP 4:GROUP 4: Dave Loukes – focus: standards-based web mapping Dave Loukes – focus: standards-based web mapping
development, map technology requirements, infrastructure requirements / development, map technology requirements, infrastructure requirements /
policy, data privacy and securitypolicy, data privacy and security
Break-Out GroupsBreak-Out Groups


![Oldfield v Oldfield [2020] NZHC 9, Duffy J](https://static.fdocuments.in/doc/165x107/62802f3ea038b54566275bdd/oldfield-v-oldfield-2020-nzhc-9-duffy-j.jpg)