by Christopher J. Gobler, PhD Submitted January 2017ehtrustees.com/images/Final report on water...
64
1 East Hampton Town Trustees 2016 water quality study, Draft Final Report by Christopher J. Gobler, PhD Submitted January 2017
Transcript of by Christopher J. Gobler, PhD Submitted January 2017ehtrustees.com/images/Final report on water...

1
East Hampton Town Trustees 2016 water quality study, Draft Final Report
by
Christopher J. Gobler, PhD
Submitted January
2017

2

3
Executive Summary
This study was undertaken from March through November of 2016 for the East Hampton
Town Trustees to assess water quality, harmful algal blooms, and pathogenic bacteria in the marine
and freshwater bodies of Accabonac Harbor, Napeague Harbor, Hog Creek, Northwest Creek,
Three-Mile Harbor, Georgica Pond, and Hook Pond. The study included intensive sampling and
focus on Three Mile Harbor and Georgica Pond because of harmful algal blooms and low dissolved
oxygen from 2013 to 2015. During 2016, it was found that most East Hampton Town Trustees
waters were of a high quality. Fecal coliform bacteria levels across marine sites were low through
the spring and summer, with the exception of some summer dates in Accabonac and Three-Mile
Harbor. The 2013 report to the Trustees indicated that Northwest Creek could be opened to
shellfishing and that change was implemented by the NYSDEC in 2014. The 2015 and 2016 data
indicates that some regions of Three Mile Harbor and Northwest Creek could also be opened to
shellfishing. At nearly all marine locations, dissolved oxygen and chlorophyll a were at
concentrations supportive of fisheries with the exception being within the Head of Three Mile
Harbor and Georgica Pond. Harmful algae concentrations were generally low in 2016 with the
exception of blooms of the harmful dinoflagellate Cochlodinium in Three-Mile Harbor and
Northwest Creek. In contrast to most marine sites, the two East Hampton Town’s freshwater
bodies monitored by this study in 2016 displayed multiple water quality impairments. Hook Pond
displayed high levels of chlorophyll a and blue-green algae, but reasonable levels of dissolved
oxygen (> 4 mg/L). While Georgica Pond had experienced a series of significant water quality
impairments including hypoxia (low oxygen), fish kills, macroalgal blooms, and blue-green algal
blooms in prior years, these conditions were largely absent in 2016 with the exception of a minor
blue green algal bloom in July. This difference may have been associated with macroalgal harvest

4
removal from the Pond or an anomalous mahogany tide in May and June. The inlet remained
closed for much of 2016, allowing for salinities to remain low enough for cyanobacterial growth
from July to October. The action of an algae harvester on the Pond for much of the season
contributed to biomass and nutrient removal and may have prevented an outbreak of blue-green in
Georgica Pond algae in 2016. Testing of fecal coliform and Enterococci bacterial levels in
Georgica Pond demonstrated levels often exceed those recommended for swimming.

5
Background
Coastal marine ecosystems are amongst the most ecologically and economically productive
areas on the planet, providing an estimated US$20 trillion in annual resources or about 43% of the
global ecosystem goods and services (Costanza et al. 2010). Approximately 40% of the world’s
population lives within 100 km of a coastline, making these regions subject to a suite of
anthropogenic stressors including intense nutrient loading (Nixon 1995). Excessive nutrient
loading into coastal ecosystems promotes algal productivity and the subsequent microbial
consumption of this organic matter reduces oxygen levels and can promote hypoxia (Cloern 2001).
The rapid acceleration of nutrient loading to coastal zones in recent decades has contributed to a
significant expansion of algal blooms, some of which can be harmful to ecosystems or the humans
who live around those ecosystems.
Globally, the phytoplankton communities of many coastal ecosystems have become
increasingly dominated by harmful algal blooms (HABs) and New York’s coastal waters are a
prime example of this trend. Prior to 2006, algal blooms in NY were well-known for their ability
to disrupt coastal ecosystem and fisheries, but were never considered a human health threat. Since
2006, blooms of the saxitoxin-producing dinoflagellate Alexandrium fundyense (> 1,000,000 cells
L-1) have led to paralytic shellfish poisoning (PSP)-inducing closures of nearly 10,000 acres of
shellfish beds in western Suffolk County during six of the past seven years. In 2008, a second
toxic dinoflagellate, Dinophysis acuminata, began forming large, annual blooms (> 100,000 cells
L-1) that generated the toxins okadaic acid and DTX-1, both of which are the causative agents of
diarrhetic shellfish poisoning (DSP). During the past two years, PSP events have spread
progressively east to Shinnecock Bay and Sag Harbor. Moreover, moderate levels of
Alexandrium and Dinophysis have recently been detected in East Hampton Town waters. The

6
limited nature of sampling, however, has prohibited definitive conclusions regarding the extent
and maximal densities of blooms from being established.
In Suffolk County, blooms of the ichtyotoxic dinoflagellate Cochlodinium have occurred
every year since 2004 in the Peconic Estuary and Shinnecock Bay and bloom water from these
regions has been shown to cause rapid morality in fish, shellfish, and shellfish larvae (Gobler et al.
2008, Tang & Gobler 2009a and b). Cochlodinium polykrikoides forms blooms around the world
and the highly lethal effects of these blooms on fish, shellfish, shellfish larvae, zooplankton, and
subsequent impacts on fisheries have been well established (Kudela and Gobler 2012). Studies to
date suggest short-lived, labile toxins, similar to reactive oxygen species (ROS), play a central role
in the toxicity of C. polykrikoides to fish and shellfish (adult, juvenile, and larvae) (Tang & Gobler
2009A&B). In 2012, these blooms spread into East Hampton Town marine waters. Large
populations of bay scallops, that were otherwise abundant prior to the blooms, died following these
blooms events (Deborah Barnes, NYSDEC, pers. comm.). However, the precise distribution of
Cochlodinium polykrikoides blooms in East Hampton Town waters is unknown.
Since 2003, the Gobler lab of Stony Brook University has assessed levels of toxic
cyanobacteria and microcystin in more than 30 freshwater systems across Suffolk County. All
lakes sampled contained potentially toxic cyanobacteria (typically Microcystis sp. or Anabaena
sp.) and detectable levels of the hepatoxin made by cyanobacteria, microcystin. Fifteen of the
lakes had levels of microcystin exceeding levels of 1 µg/L permissible for drinking water
according to the World Health Organization (WHO). Microcystis is a cyanobacteria that
synthesizes a gastrointestinal toxin known as microcystin that is known to inhibit protein
phosphorylation. Although no bloom was obvious in Georgica Pond when it was investigated in
late September of 2012, blooms are typically ephemeral and the most toxic events are typically

7
associated with nearshore, wind accumulated scums, rather than lake water. Historically, the
temporal and spatial dynamics of toxic cyanobacteria in Georgica Pond as well as densities of
other harmful algae in East Hampton waters have not been well-characterized.
Toxic cyanobacteria blooms represent a serious threat to aquatic ecosystems. Globally, the
frequency and intensity of toxic cyanobacteria blooms have increased greatly during the past
decade, and have become commonplace in the more freshwater, upper reaches of many US
estuaries. Toxin concentrations during many of these blooms often surpass the World Health
Organization (WHO) safe drinking water of 1 µg/L and recreational water limit of 20 µg/L (Chorus
and Bartham, 1999). There are multitudes of examples of sicknesses and deaths associated with
chronic, or even sporadic, consumption of water contaminated with cyanotoxins (O’Neil et al.,
2012). Cyanotoxin exposure has been linked to mild and potentially fatal medical conditions in
humans including gastrointestinal cancers (i.e. liver, colorectal; Chorus and Bartham 1999) and
more recently, neurological disorders such as Alzheimer’s disease (Cox et al., 2005).
A final group of microbes of concern in coastal ecosystems are pathogenic bacteria. Such
pathogens can present a hazard to humans recreating in affected waters by infecting the alimentary
canal, ears, eyes, nasal cavity, skin or upper respiratory tract, which can be exposed through
immersion or the splashing of water (Thompson et al., 2005). Consumption of contaminated
shellfish is one of the most common exposure routes for marine pathogens. Fecal coliform bacteria
are the recommended indicator for human pathogens in marine waters and gastrointestinal
symptoms are a frequent health outcome associated with exposure (Thompson et al., 2005)
The objectives of this study were to assess the temporal and spatial dynamics of coliform
bacteria, the PSP-causing dinoflagellate Alexandrium, the DSP-causing dinoflagellate Dinophysis,
and the ichthyotoxic dinoflagellate, Cochlodinium in East Hampton Town marine waters. It also

8
assesses the dynamics of toxic cyanobacteria and cyanotoxins in East Hampton’s major
freshwater/brackish bodies. Sampling for general water quality parameters was also included and
sampling proceeded from March through November of 2015.
Approach
The 2016 sampling season ran from March 30th to November 2nd. Sampling was done on
a biweekly basis, with the exceptions of Three Mile Harbor and Georgica Pond, which were
sampled weekly. Sampling included eleven marine sites within Napeague Harbor, Accabonac
Harbor, Hog Creek, Three-Mile Harbor, and Northwest Creek; and five freshwater sites within
Georgica Pond and Hook Pond. The Fresh Pond site was excluded from this year’s study. Its
bacterial levels were consistently high, and harmful algal blooms there were unlikely.
Each marine water body was sampled from two or three individual sites, with at least one
located near the water body’s inlet to the Peconic estuary, and the others further from the inlet.
Northwest Creek was the exception with only one site located near its inlet. General water quality
measurements obtained for each site included salinity, temperature, and dissolved oxygen levels
measured with a handheld YSI 556 probe. One Onset HOBO data logger was also deployed at the
head of Three-Mile Harbor to continuously record bottom temperature and dissolved oxygen levels
over time. Additionally, water was collected at each of these eleven sites and analyzed for
chlorophyll a and fecal coliform bacteria. To quantify fecal coliform bacteria levels, water samples
were collected onto filters and transferred onto agar plates permissive for the growth of these
bacteria, and incubated at 44.5°C for 24 h. The number of colonies that had grown on the media
were then quantified and densities of fecal coliform per 100 mL of seawater were determined. The
pigment chlorophyll a, which serves as an analog for algal biomass, was measured by filtering

9
whole water through glass fiber filters, extracting the collected pigment from the filter with acetone,
and measuring the fluorescence (Parsons et al., 1984). The four Georgica Pond sites were also
sampled for fecal coliform bacteria and Enterococci bacteria from July through September.
Enterococci were quantified using the IDEXX Enterolert & Quanti-Tray/2000 sampling kits,
giving MPN per 100mL.
To assess the abundance of harmful algae, eight of these marine sites were sampled more
comprehensively with each harbor having at least one such site. These sites were those located
furthest from their respective inlets in areas that are more prone to elevated nutrient levels and the
proliferation of algae. All three of Three-Mile Harbor sites, and the four Georgica Pond sites for
this study were treated as such. The Accabonac site on Gann Rd. near the culvert was upgraded
to a full sampling site from July onward.
The toxic dinoflagellate Dinophysis acuminata, which is responsible for diarrhetic shellfish
poisoning (DSP), was sampled for from March into July. The harmful “rust tide” dinoflagellate
Cochlodinium, known for causing fish kills, was monitored from July through October. In both
cases, whole water was collected and preserved with Lugol’s iodine and cells were counted on a
Sedgewick-Rafter slide under a microscope. Alexandrium fundyense, a toxic marine dinoflagellate
responsible for paralytic shellfish poisoning, was sampled from April through May. Samples were
filtered through a 20µm sieve, backwashed into a 15mL centrifuge tube, and preserved in formalin
and methanol. Cell densities were determined by marking the cells with an oligonucleotide probe,
and counting with an epifluorescent microscope, as detailed in Hattenrath et al. (2010).
At the five freshwater sites (four in Georgica and one in Hook Pond) samples were
collected for the quantification of chlorophyll a, temperature, salinity, and dissolved oxygen as
described above. Additionally, each site was sampled for blue-green algae (cyanobacteria),

10
including Microcystis and Anabaena. Blue-green fluorescence, an analog for cyanobacterial
biomass, was measured using a FluoroProbe with live samples. Colonies of these algae were
preserved in whole water samples with Lugol’s iodine solution, and identified using a microscope
as described above.
The telemetry monitoring buoy was redeployed in southern Georgica Pond from spring
through fall. The buoy uploaded real-time water quality data of temperature, salinity, pH,
dissolved oxygen, chlorophyll a, and bluegreen fluorescence. The sensors for chlorophyll a and
bluegreens are not as sensitive as the discreet sampling methods, but displayed trends that parallel
those measurements.
Findings
Marine Systems
Fecal Coliform Bacteria
The concentrations of fecal coliform bacteria in 2016 were lower at Hog Creek, and Hand’s
Creek (Three-Mile), but higher in Accabonac and the head of Three-Mile compared to those
measured in years past. The average 2016 fecal coliform bacteria values ranged from 0 colony
forming units (CFU)/100mL, to 19 CFU/100mL (Fig 1). That is compared to the 2015 range of 0
CFU/100mL to 59 CFU/100mL (Fig 2). The safe shellfishing standards set by the NYSDEC for
fecal coliform bacteria levels are a mean value below 14 CFU/100mL, with 90% of individual
values below 49 CFU/100mL. Almost all of the sampled sites in the present study were below
these levels, with the exception of Landing Lane, Accabonac, that failed both criteria in 2016, with
a mean fecal coliform value of 19 CFU/100mL, and reached a peak value of 134 CFU/100mL on
September 20th (Fig 3). Individual values surpassed the 49 CFU/100mL limit once on May 25th,

11
and observed again September 20th. The sites at Louse Point in Accabonac and Head of the Harbor
for Three-Mile each saw concentrations exceed the 49 CFU/100mL in May and July respectively
(Fig 3). These individual values were very high, but do not fail the overall criteria set for
shellfishing.
Prior studies have generally shown that total coliform levels were lower near inlets where
the water flushes regularly, and higher in the back of harbors where water residence time is long,
which allows the accumulation of land-derived bacteria. These studies have also determined that
coliform bacterial levels generally paralleled temperatures and thus are highest during summer.
The comparatively higher fecal coliform concentrations in 2016 again showed this trend in
Accabonac and Three-Mile harbors.
NYSCEC Comparison of Fecal Coliform Data
Fecal coliform bacteria values measured in this study were compared with NYSDEC
shellfish bed statuses. In 2015, four of the 11 sites measured confirmed the DEC’s statuses, and
the remaining seven sites supported certification of presently uncertified waters (Fig 4). In contrast,
measurements from 2016 confirmed the DEC statuses for seven of the eleven sites. The 2016 data
supports only three of the 2015 report’s opening recommendations. Three seasonally uncertified
sites supported by the 2015 report were in turn observed within safe levels in 2016, supportive of
certification. These include site 9 in Hog Creek, and site 12 in Three-Mile (Fig 5 & 6).
Approximately 88 acres of Northwest Creek’s northern extent were seasonally opened starting in
2014, between December 15 and March 31 (Fig 6). Measurements from both 2014 through 2016
suggest that Northwest Creek could be opened longer, as it was one of the cleanest systems in

12
regards to fecal coliforms (Fig 1 & 2). These recommendations are based solely on fecal coliform
levels, and do not account for other potential sources of contamination and closure.
Harmful Algae: Dinophysis, Cochlodinium, & Alexandrium
All algae contain the pigment chlorophyll a and it is therefore measured as a proxy for total
phytoplankton biomass. Moderate levels of algae support productive fisheries and ecosystems,
but excessive algal growth can lead to a series of negative ecological consequences including
hypoxia and acidification, and could be a sign of the development of an algal bloom. The average
chlorophyll a values for East Hampton’s marine systems during the 2016 sampling season ranged
from 2µg/L to 10µg/L (Fig 7). This range is consistent with the values observed in prior years,
and is near the normal level of 5µg/L for the eastern Peconic Estuary (Fig 8). The USEPA
considers 20µg/L of chlorophyll a as eutrophic and with all but one site averages being below this
level. The singular exception was site 11 in Three-Mile Harbor that reached a peak of 30µg/L on
September 20th, but also exceeded the eutrophic limit in July and August.
Regarding harmful algal blooms, 2016 was a mild year in most East Hampton marine
systems. Dinoflagellates of the genus Dinophysis can cause DSP, a globally significant human
health syndrome (Reguera et al., 2012). Dinophysis spp. synthesize okadaic acid (OA) and
dinophysistoxins (DTXs), the causative toxins of DSP. While DSP is common in regions of
Europe, South America and Asia (Reguera et al., 2012), prior to 2008 the US had not experienced
a DSP event. However, there have been a series of such outbreaks recently, including in NY
(Hattenrath-Lehmann et al., 2013). In 2016, Dinophysis was not present in Napeague, or Hog
Creek, with averages ranging from 0 cells/L to 56 cells/L (Fig10). The highest values were

13
measured in Three Mile Harbor, with a peak of 391 cells/L being measured at Hand’s Creek, site
12. Dinophysis blooms exceeding 10,000 cells/L have the potential to contaminate shellfish. As
such, East Hampton waters are far from reaching dangerous levels of this toxic algae.
Cochlodinium is an ichthyotoxic dinoflagellate that has caused fish kills across the globe
including some sites on eastern LI (Kudela and Gobler, 2012). Cochlodinium was detected at low
levels in all seven of the marine systems sampled in 2015. Counts in 2016 focused on the three
sites that have observed dense, potentially harmful blooms in the past: Accabonac at Landing Ln.,
Three-Mile at Head of the Harbor, and Northwest Creek. The average Cochlodinium densities
between these three sites ranged from 23 cells/mL to 6,765 cells/mL in 2016, significantly higher
than the range of 4 cells/mL to 86 cells/mL observed in the year prior (Fig 13). Individual
concentrations surpassed the 300 cell/mL toxicological limit in both Three Mile Harbor with
33,700 cells/mL, and Northwest Creek with 806 cells/mL (Fig 12). The peak of the bloom
observed at Northwest Creek occurred August 18th, and the massive bloom in Three Mile Harbor
was observed September 20th. Cochlodinium blooms in excess of 300 cells/mL have been known
to cause mortality in larval fish, which use these estuarine systems as nurseries, and in shellfish
(Tang and Gobler 2009). In prior years, Cochlodinium blooms initiated in the far western Peconic
Estuary and spread eastward. In 2014, Cochlodinium blooms on Long Island first emerged in East
Hampton Town waters, and may be related to the ability of the organism to form resting cysts;
increasing its ability to propagate and spread in areas it has been established (Tang and Gobler
2012). In 2016, Cochlodinium blooms emerged in East Hampton at nearly the same time as the
western Peconic Estuary. These patterns demonstrate that year-to-year, Cochlodinium has behaves
very differently in East Hampton Town waters, illustrating the importance of long term monitoring
of water quality trends. It is notable that while Cochlodinium densities were lower in 2015, blooms

14
were intense and more widespread in 2016. Given its ability to form cysts (Tang and Gobler 2012),
this finding suggests the potential to bloom in more locations in the future.
Alexandrium is a toxic dinoflagellate that synthesizes saxitoxin, which leads to the
syndrome of PSP, and can cause illness or death in individuals consuming shellfish containing
these toxins (Anderson 1997). PSP has been occurring annually in New York waters since it first
appeared in 2006, with Sag Harbor being the closest region to East Hampton experiencing these
events. In 2013, densities of Alexandrium exceeded 1,000 cells/L, levels known to cause toxicity
in shellfish (Anderson 1997), were detected in Three Mile Harbor at Head of the Harbor,
representing the most intense Alexandrium bloom in East Hampton waters. In 2016, only sites of
Three Mile Harbor had observable levels of Alexandrium, with a maximum of 48 cells/L (Fig 15).
These levels were well below those known to cause toxicity. Average values were lower across
most sites in 2016 compared to 2015 (Fig 16). Concentrations of Alexandrium have been
decreasing yearly since the peak bloom in 2013, emphasizing the importance of long term
monitoring of water quality to capture such long term trends.
General Water Quality: Salinity & Dissolved Oxygen
Salinity across East Hampton’s marine sites was relatively static, mostly staying within
29±1 PSU and were generally higher at the sites closest to their respective inlets. Hog Creek, Isle
of Wight, had the lowest salinity and highest range of values (Fig 17).
The mean levels of dissolved oxygen from discrete measurements ranged from 4 to 9 mg/L
for marine sites; levels which are generally supportive of fisheries, shellfisheries, and wildlife (>5
mg/L; Fig 18). Additionally, continuous dissolved oxygen probe that records every 15 minutes
was installed at Head of the Harbor to measure dissolved oxygen at depth from May through

15
August to provide better resolution of dissolved oxygen levels. Head of the Harbor experienced
periods of low dissolved oxygen throughout much of the months recorded (Fig 19). The site’s
mean dissolved oxygen level (5.21 mg/L) was above the level ideal for marine life and higher than
it was the year before (4.67 mg/L), although this likely reflects an absence of measurements during
the warmest period of summer. The wide variation of dissolved oxygen levels between day and
night is evidence of extreme ecosystem metabolism and eutrophication. Most nights during the
three-and-a-half-month observation oxygen levels fell below the 3 mg/L and on occasion went
anoxic (0 mg/L), indicating conditions unsuitable for benthic life (Fig 19A). For comparative
purposes, NYSDEC’s standard for dissolved oxygen for marine water bodies is above 3 mg/L,
indicating that this is an impaired water body.
Addressing problems with eutrophication within Three Mile Harbor
During the past four years, Three Mile Harbor has displayed obvious water quality
impairment with low or no oxygen levels during summer and toxic algal blooms caused by
Alexandrium and Cochlodinium. All of these conditions were most problematic within the Head
of the Harbor region of Three Mile Harbor. Given that both of the harmful algal blooms have been
associated with excessive nitrogen loading (Hattenrath et al 2010; Gobler et al 2012) and given
low oxygen conditions are also associated with excessive nitrogen loading, it is important that the
nutrient loading conditions be considered in this system. Recently, The Nature Conservancy
completed an analysis of nitrogen loading rates for the entire Peconic Estuary, including the Three
Mile Harbor watershed (Lloyd, 2014). There are a series of key insights to be yielded from this
study. Firstly, the Three Mile Harbor watershed was shown to have the high nitrogen loads in the
entire Town of East Hampton in terms of kilograms of nitrogen per year and kilograms of nitrogen

16
per unit area per year (Table 1). Next, the Three Mile Harbor was shown to have a greater
proportion of its nitrogen load emanating from wastewater than any other Town of East Hampton
with 65% (Table 1). Across all sites monitored during this study, there was a highly significant
correlation (R2 = 0.93; p<0.01) between the nitrogen loading rate per hectare of watershed and the
chlorophyll a level in the receiving water body suggesting excessive nitrogen loading rates are
promoting the water quality impairments within Three Mile Harbor. There was also a significant
correlation between the percentage of nitrogen load emanating from wastewater and average
chlorophyll a levels (R2 = 0.87; p<0.05), suggesting that wastewater derived nitrogen may
specifically be promoting algal blooms in Three Mile Harbor.
As part of NYSDEC’s Long Island Nitrogen Action Plan, a ‘Subwatersheds’ study is being
conducted in Suffolk County. While that exercise has thus far affirmed the information above
regarding Three Mile Harbor, it has also revealed two pieces of important information about this
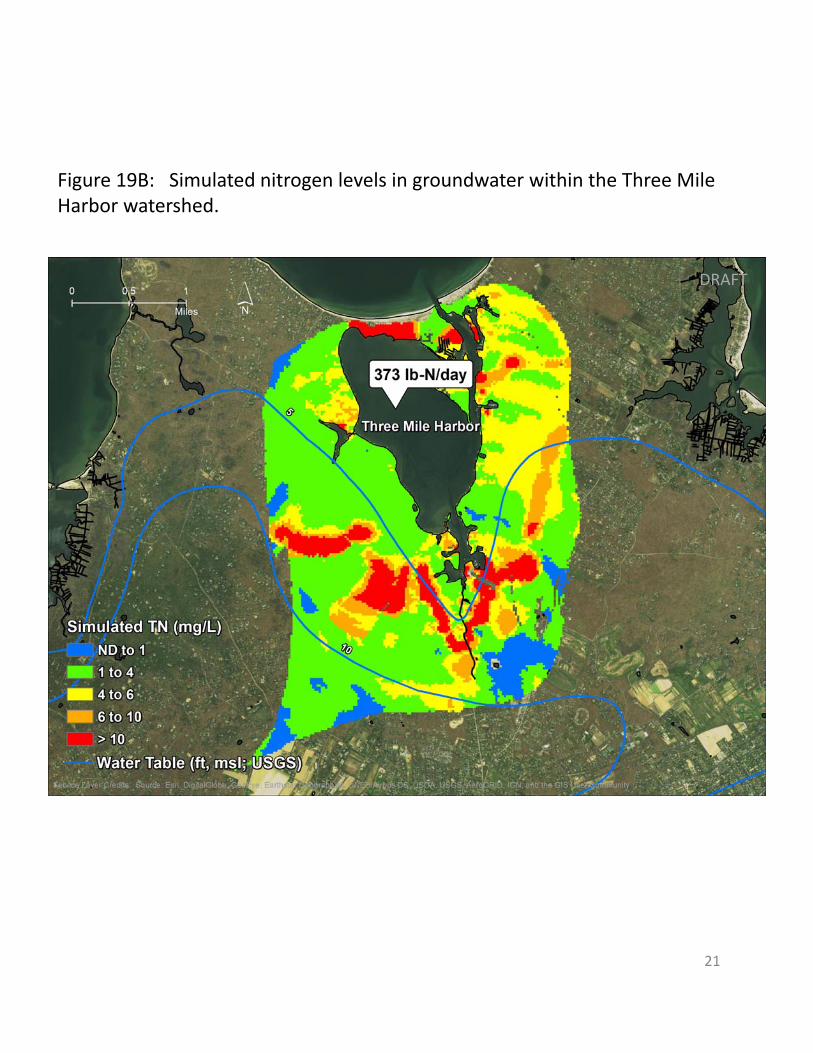
watershed. First, it has modeled the levels of nitrogen in groundwater surrounding Three Mile
Harbor and has depicted a band of extremely high nitrogen (>10 mg/L) in the region surrounding
the Head of the Harbor region (Fig 19A). In prior reports, the slow flushing rate of the Head of
the Harbor was emphasized due to it extreme distance from the Peconic Estuary inlet to Three
Mile Harbor and the sand bar that separates the Head of the Harbor from the main basin of this
system. Moreover, in prior assessments of Long Island water bodies in general, it has been shown
that the combination of slow flushing and heavy nitrogen loads are the precise formula for severe
water quality impairment. Hence, after four years of study and data collection, it can be concluded
that the Head of the Harbor region is the most eutrophied and impaired marine water body in East
Hampton, given Georgica Pond is brackish and not fully marine. As such the Head of the Harbor

17
region is likely most deserved of wastewater remediation, since this is the largest source of nitrogen
to this region and since flushing times are unlikely to change in the region.
One final piece of evidence from the LINAP subwatershed study brings good news
regarding Three Mile Harbor. Specifically, the groundwater travel times for much of the watershed
and specifically the high nitrogen region around Head of the Harbor have travel times are generally
rapid (Fig 19C). For the whole watershed, 62% of the groundwater drains into Three Mile Harbor
is < 10 years and 80% enters in < 25 years. This means that, unlike regions of western Long Island
where watershed travel times maybe hundreds of years, these rapid travel times assure that efforts
to mitigate wastewater should yield a rapid improvement in water quality in this region.
To date, the Town of East Hampton has taken some progressive measures to mitigating
nitrogen loading in Three Mile Harbor including the installation of a permeable reactive barrier
and the planned construction on a carbon-based injection well. While these measures will be
helpful, given that Three Mile Harbor has the largest nitrogen loading rates within the Town, that
the large majority of this nitrogen emanates from wastewater, and the significant water quality
impairment in this system, it seems clear that this watershed should be a priority location for the
upgrading septic tanks and cesspools within the Town of East Hampton, especially around the
Head of the Harbor region.
Hook Pond
Hook Pond was one of two freshwater bodies studied in 2016 in East Hampton. In 2015,
a new site was considered and replaced the original site, which was located in a shallow cove.
Chlorophyll a values averaged 21 µg/L in 2016, compared to 19 µg/L the year prior, and had a
maximum value of 32 µg/L (Fig 24, 25). Hook Pond exceeded the chlorophyll a threshold for a

18
eutrophic freshwater body (>8 µg/L) on all dates sampled (Fig 27). Blue-green fluorescence,
which serves as an analog for cyanobacterial biomass, had a mean value of 15 µg/L in 2016,
compared to an average of 29 µg/L in 2014 (Fig 28, 29). The maximum blue-green fluorescence
observed was 44 µg/L, and peaked on August 10th (Fig 31), exceeding the NYSDEC safety limit
of 20-30 µg/L. The values also exceeded 20 µg/L for most of July and August. Unlike Georgica
Pond, there appears to be little to no marine influence in Hook Pond, with a mean salinity of 0.2
PSU (Fig 32). The mean dissolved oxygen level was 10.09 mg/L, and the minimum value was
7.54 mg/L, both well within healthy waterbody levels set by NYSDEC (3 mg/L; Fig 34). The
location of the new site allows for observation of the main body of the pond, rather than just the
shallow cove observed in previous years. However, with only one site, there is still poor spatial
coverage of the pond. Based on the observations in Georgica Pond, great spatial heterogeneity in
water quality may exist in that water body.
Georgica Pond
Fecal Coliform and Enterococci Bacteria
Measurements of indicator bacteria were added to the analysis of Georgica Pond for 2016.
The average fecal coliform values ranged from 73 CFU/100mL to 308 CFU/100mL (Fig 20), all
three sites are well above the average shellfishing safety limit of 14 CFU/100mL, in keeping with
the NYSDEC shellfishing closure there. Site 15, the Rt. 27 kayak launch, surpassed the average
bathing safety limit of 200 CFU/100mL, though none of the sites pass the individual date limit of
1000 CFU/100Ml (Fig 20).
Enterococci bacterial levels were also measured as these are a generally more accepted
measure for bathing beach evaluation. Average values ranged from 11 CFU/100mL to 93

19
CFU/100mL, with a maximum value of 240 CFU/100mL being measured at Rt. 27 (Fig 22).
Enterococci values surpassed both the average bathing safety limit standard of 35 CFU/100mL,
and the individual sample bathing safety limit of 104 CFU/100mL at three sites: Rt. 27, Georgica
Cove, and southwest Georgica (Fig 22). These sites saw high levels on several dates between July
and September, with the most frequent occurrences at Rt. 27 (Fig 23).
Harmful Algae
Georgica Pond has been substantially impaired by algae for the past three years of
observation. A total of four stations have been included since 2014 to provide data more
representative of the pond as a whole. The greatest chlorophyll a values measured in East
Hampton Town waters have been consistently sampled in Georgica Pond. Chlorophyll a values
in 2016 ranged from 19 µg/L to 31 µg/L, with the highest mean values measured in Georgica Cove
and southwestern Georgica, with 31 µg/L each (Fig 24). All four sites had mean chlorophyll a
concentrations well over 8 µg/L, above the USEPA eutrophic level for freshwater bodies. The
sites surpassed this level in early June and high levels persisted onward. The highest level of
chlorophyll a was measured in Georgica Cove on October 13th, with a value of 74 µg/L (Fig 26).
The microalgal bloom began to form in June, came to a peak July 20th, and saw a decline before
coming to another peak October 13th at 74 µg/L. Other sites in the pond saw a similar bloom in
July, but did not have a second peak after the opening of the inlet in October.
Continuous monitoring of chlorophyll a along with aerial images and microscopy revealed
the emergence of a new potentially harmful algal bloom in Georgica Pond in May and June of
2016, specifically a mahogany tide formed by the dinoflagellate, Prorocentrum minimum (Fig 27).
This bloom began in May and continued through June (Fig 27). This alga was concurrently

20
forming blooms across many of Long Island’s south shore lagoons and in the Peconic River (C.
Gobler, pers. obs). The bloom was associated with extreme turbidity which may have altered the
growth of macroalgae in 2016. The alga has been shown to be associated with high nitrogen levels
and can be harmful to some forms of marine life including larval bivalves (Heil et al., 2005).
Georgica Pond and Georgica Cove experienced dense blooms of the filamentous macroalga
Cladophora vagabunda, and subaquatic plant Sago pondweed (Stuckenia pectinata) for much of
the early summer in 2014, and again in 2015, and was a nuisance for recreational use and shoreline
cleanup of the pond. The alga forms thick, bright green mats on the surface which were common
in all of the protected creeks and coves of the pond. The alga was also present subsurface and
covered much of the bottom of the pond. The aquatic plant grew attached to the bottom, and its
branching structure provided a hold for the Cladophora, aiding the persistence of the mats. Large
mats of Cladophora grew almost exclusively intertwined with Sago pondweed. Sago pondweed
also detaches and washes ashore, forming large mats of its own. For 2016, mitigation efforts
focused on the use of a mechanical algae harvester, which removed these two nuisance species
from the surface and subsurface of the pond and surface of the pond remained mostly clear for the
whole of the summer, which Cladophora growth limited to the shallows very close to shore.
Toxic Cyanobacteria
Toxic cyanobacteria blooms represent a serious threat to aquatic ecosystems and human
health. Globally, the frequency and intensity of toxic cyanobacteria blooms have increased greatly
during the past decade and toxin concentrations during many blooms often surpass the World
Health Organization (WHO) safe drinking water and recreational water limit (Chorus and Bartham,
1999).

21
Whereas chlorophyll a is an analog for algal biomass, blue-green algal fluorescence serves
as an analog specifically for cyanobacterial biomass. Georgica Pond saw extremely high levels of
blue-green algae during 2014 and 2015, but values in 2016 were significantly lower. The highest
levels in 2016 were seen in southern Georgica, with southwestern Georgica having slightly lower
levels. Mean fluorescence at southwestern Georgica was 26 µg/L and southern Georgica saw an
average level of 22 µg/L (Fig 28). These averages are significantly lower than the year prior,
which had values of 121 µg/L and 112 µg/L each (Fig29). In 2015, all four sites in Georgica Pond
had averages in excess of 20 µg/L, which the NYSDEC uses to close a lake to recreational use. In
2016 however, only sites 18 and GPS had average values exceeding this level. Values at southwest
Georgica exceeded 20 µg/L at the end of June, reached its maximal peak on July 27th but these
values dropped below 20 µg/L in early August, and came to a second, smaller peak September 8th,
after which they declined to low levels (Fig 30). South Georgica site reached its maximal peak on
August 3rd (Fig 31). All four sites showed a very similar trends, though amplitude of the values
varied. All bluegreen florescence values dropped to near undetectable levels after the opening of
the fall inlet in late September. Identification of cyanobacterial cells present during the period
from May to November showed three major genera of cyanobacteria present: Aphanizomenon,
Anabaena, and Planktothrix. Aphanizomenon was the dominant genus, followed by Anabaena,
and Planktothrix replaced Microcystis as the third.
Toxin samples were taken and analyzed during the cyanobacterial blooms, on all dates
where blue-green fluorescence passed 20µg/L. Microcystin values were mostly at low levels, but
it was present for most dates sampled, and across all four sites. On September 8th, for all sites
except for southeast, microcystin values were found in excess of the WHO standard for drinking

22
water of 1 µg/L. The highest recorded value was 1.947 µg/L at south Georgica, followed by 6.93
µg/L in Georgica Cove, and 1.16 µg/L at Rt. 27.
General Water Quality: Salinity & Dissolved Oxygen
Salinity varied between sites across Georgica Pond. The lowest average salinity (4 PSU)
was measured at Rt. 27, which has the highest freshwater inflow. The other three sites had similar
salinity of 9±1 PSU (Fig 32). Unlike the previous year, the inlet remained closed for most of the
spring and summer and thus slowly declined about 15 PSU in April down to around 5 PSU (Fig
33). From June onward, salinity dropped below 10 PSU, which is conducive to the growth of
cyanobacteria (Orr et al 2004).
The average levels of discrete dissolved oxygen measurements ranged from 4 to 9 mg/L,
with the lowest measurement at Rt. 27 (Fig 34). The three other sites were around 9 mg/L, which
is safely above the NYSDEC minimum daily average of 5 mg/L to support wildlife (class C waters;
http://www.dec.ny.gov/regs/4592.html). However, the minimum values for EH 15 at Rt. 27 were
near 1 mg/L, well below the 3 mg/L limit that the NYSDEC states oxygen levels should, at no
point, fall below to support survival and propagation of fish, shellfish, and wildlife.
Discrete sampling by land of dissolved oxygen was complemented by the redeployment of
the continuously logging telemetry buoy, located in the south end of Georgica Pond, near the
southern Georgica (GPS) shore sampling site. For most of the year, oxygen levels were within a
healthy range. However, oxygen concentrations fell below the hypoxic level of 3 mg/L only
following the opening of the inlet, perhaps due to tidal exposure of mud flats and/or the possible
die-off of aquatic organisms. It should be noted that the readings of the buoy are taken near-

23
surface in several meters of water. Oxygen levels at or near bottom may to be lower and more
susceptible to hypoxia.

24
Citations
Anderson, D. M. (1997). Bloom dynamics of toxic Alexandrium species in the northeastern US.
Limnology and Oceanography, 42(5), 1009-1022.
Chorus, I., & Bartram, J. (1999). Toxic cyanobacteria in water: A guide to their public health
consequences, monitoring and management. Spon Press.
Cloern, J. E. (2001). Our evolving conceptual model of the coastal eutrophication problem.
Marine ecology progress series, 210(2001), 223-253.
Costanza, Robert, et al (1997) Valuing ecosystem services with efficiency, fairness and
sustainability as goals." Nature’s services: societal dependence on natural ecosystems. Island Press,
Washington, DC: 49-70.
Gobler, C. J., Berry, D. L., Anderson, O. R., Burson, A., Koch, F., Rodgers, B. S., & Nuzzi, R.
(2008). Characterization, dynamics, and ecological impacts of harmful< i> Cochlodinium
polykrikoides</i> blooms on eastern Long Island, NY, USA. Harmful Algae, 7(3), 293-307.
Hattenrath-Lehmann TK, Marcoval MA, Berry DL, Fire S, Wang Z, Morton SL, Gobler CJ. 2013.
The emergence of Dinophysis acuminata blooms and DSP toxins in shellfish in New York waters.
Harmful Algae 26: 33–44
Hattenrath TK, Anderson DA, Gobler CJ. 2010. The influence of nutrients and climate on the
dynamics and toxicity of Alexandrium fundyense blooms in a New York (USA) estuary. Harmful
Algae 9: 402–412
Kudela RM, Gobler CJ. 2012. Harmful dinoflagellate blooms caused by Cochlodinium sp.:
Global expansion and ecological strategies facilitating bloom formation. Harmful Algae. 14: 71–
86

25
Moisander, P. H., McClinton, E., & Paerl, H. W. (2002). Salinity effects on growth, photosynthetic
parameters, and nitrogenase activity in estuarine planktonic cyanobacteria. Microbial Ecology,
43(4), 432-442.
Nixon, S. W. (1995). Coastal marine eutrophication: a definition, social causes, and future
concerns. Ophelia, 41(1), 199-219.
O’Neil JM, Davis TW,* Burford MA, Gobler CJ. 2012. The Rise of Harmful Cyanobacteria
Blooms: The Potential Roles of Eutrophication and Climate Change. Harmful Algae. 14: 313–
334
Orr, P. T., Jones, G. J., & Douglas, G. B. (2004). Response of cultured Microcystis aeruginosa
from the Swan River, Australia, to elevated salt concentration and consequences for bloom and
toxin management in estuaries. Marine and Freshwater Research, 55(3), 277-283.
Paerl, H. W., & Huisman, J. (2008). Blooms like it hot. Science 320(5872), 57.
Parsons, T. R., Maita, Y., & Lalli, C. M. (1984). A manual of chemical and biological methods for
seawater analysis. Pergamon press
Reguera, B., Velo-Suarez, L., Raine, R., Park, M.G., 2012. Harmful Dinophysis species: A review.
Harmful Algae 14, 87-106.
Tang YZ, and Gobler CJ. 2009. Cochlodinium polykrikoides blooms and clonal isolates from the
northwest Atlantic coast cause rapid mortality in larvae of multiple shellfish species. Marine
Biology 156: 2601-2611
Tang YZ, Gobler CJ. 2009. Characterization of the toxicity of Cochlodinium polykrikoides
isolates from Northeast US estuaries to finfish and shellfish. Harmful Algae 8:454-462
Gobler et al. 2008,

26
Thompson, J. R., Marcelino, L. A., & Polz, M. F. (2005). Diversity, sources, and detection of
human bacterial pathogens in the marine environment. In Oceans and Health: Pathogens in the
Marine Environment (pp. 29-68). Springer US.
Tonk, L., Bosch, K., Visser, P. M., & Huisman, J. (2007). Salt tolerance of the harmful
cyanobacterium Microcystis aeruginosa.

Figure 1: Average and maximum recorded fecal coliform bacteria values for marine sites from March through October of 2016. Error bars show standard error. Dashed lines show shellfishing safety limits.
Napeague Accabonac Hog Creek North‐west
Three Mile

Figure 2: Comparison of average fecal coliform bacteria levels from 2015 and 2016, with running three‐year average. Error bars show standard error. Dashed lines show shellfishing safety limits.
Napeague Accabonac Hog Creek North‐west
Three Mile
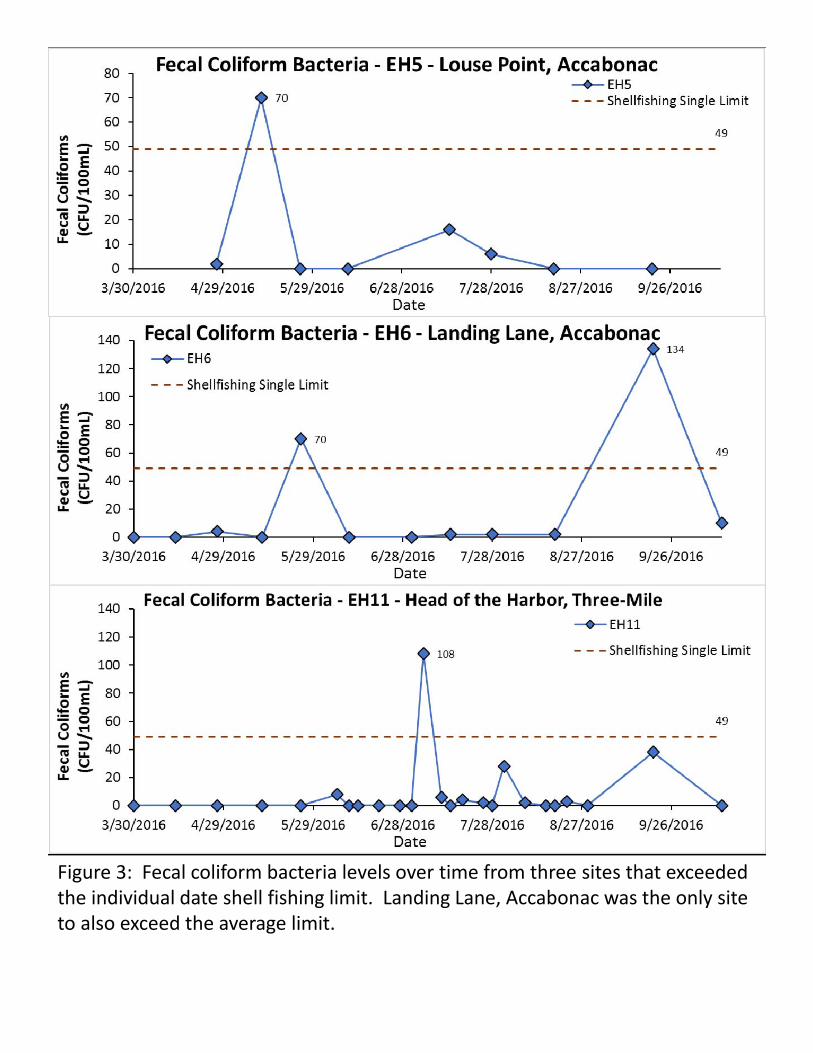
Figure 3: Fecal coliform bacteria levels over time from three sites that exceeded the individual date shell fishing limit. Landing Lane, Accabonac was the only site to also exceed the average limit.
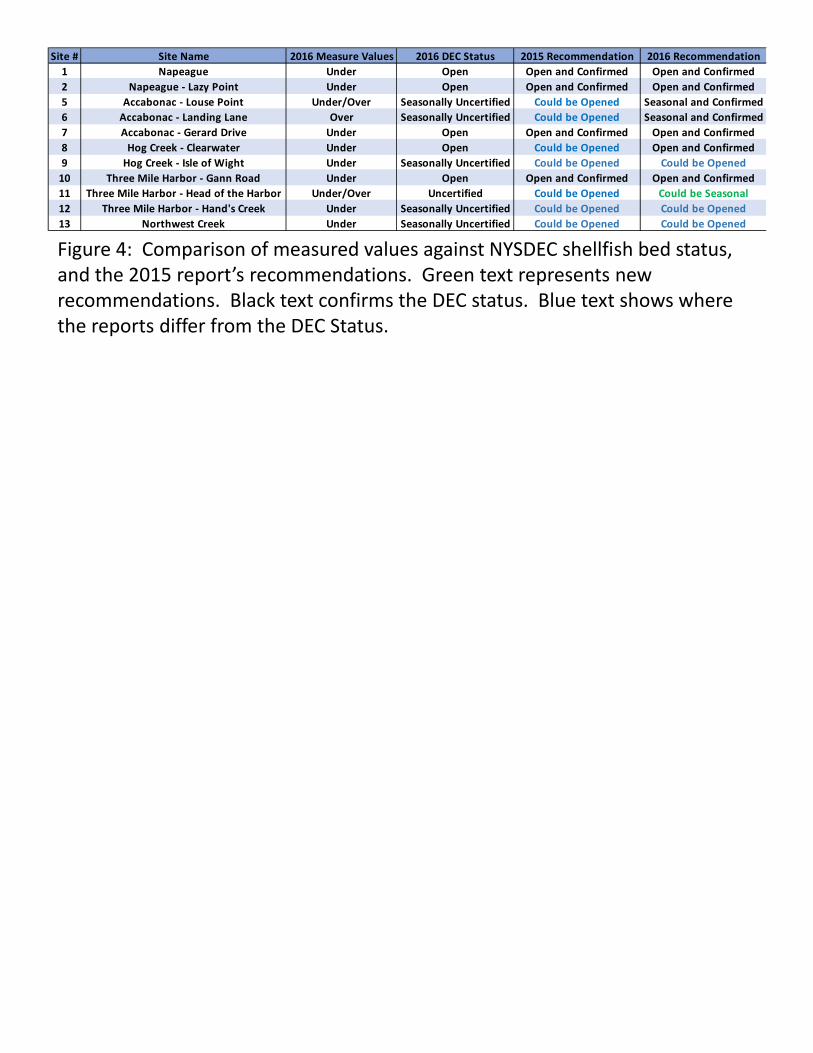
Figure 4: Comparison of measured values against NYSDEC shellfish bed status, and the 2015 report’s recommendations. Green text represents new recommendations. Black text confirms the DEC status. Blue text shows where the reports differ from the DEC Status.
Site # Site Name 2016 Measure Values 2016 DEC Status 2015 Recommendation 2016 Recommendation
1 Napeague Under Open Open and Confirmed Open and Confirmed
2 Napeague ‐ Lazy Point Under Open Open and Confirmed Open and Confirmed
5 Accabonac ‐ Louse Point Under/Over Seasonally Uncertified Could be Opened Seasonal and Confirmed
6 Accabonac ‐ Landing Lane Over Seasonally Uncertified Could be Opened Seasonal and Confirmed
7 Accabonac ‐ Gerard Drive Under Open Open and Confirmed Open and Confirmed
8 Hog Creek ‐ Clearwater Under Open Could be Opened Open and Confirmed
9 Hog Creek ‐ Isle of Wight Under Seasonally Uncertified Could be Opened Could be Opened
10 Three Mile Harbor ‐ Gann Road Under Open Open and Confirmed Open and Confirmed
11 Three Mile Harbor ‐ Head of the Harbor Under/Over Uncertified Could be Opened Could be Seasonal
12 Three Mile Harbor ‐ Hand's Creek Under Seasonally Uncertified Could be Opened Could be Opened
13 Northwest Creek Under Seasonally Uncertified Could be Opened Could be Opened

Figure 5: Maps showing 2016 NYSDEC shellfish bed statuses for Accabonac Harbor, and Hog Creek, as well as showing sampling sites.

Figure 6: Maps showing 2016 NYSDEC shellfish bed statuses for Three Mile Harbor, and Northwest Creek, as well as showing sampling sites.
Confirmed
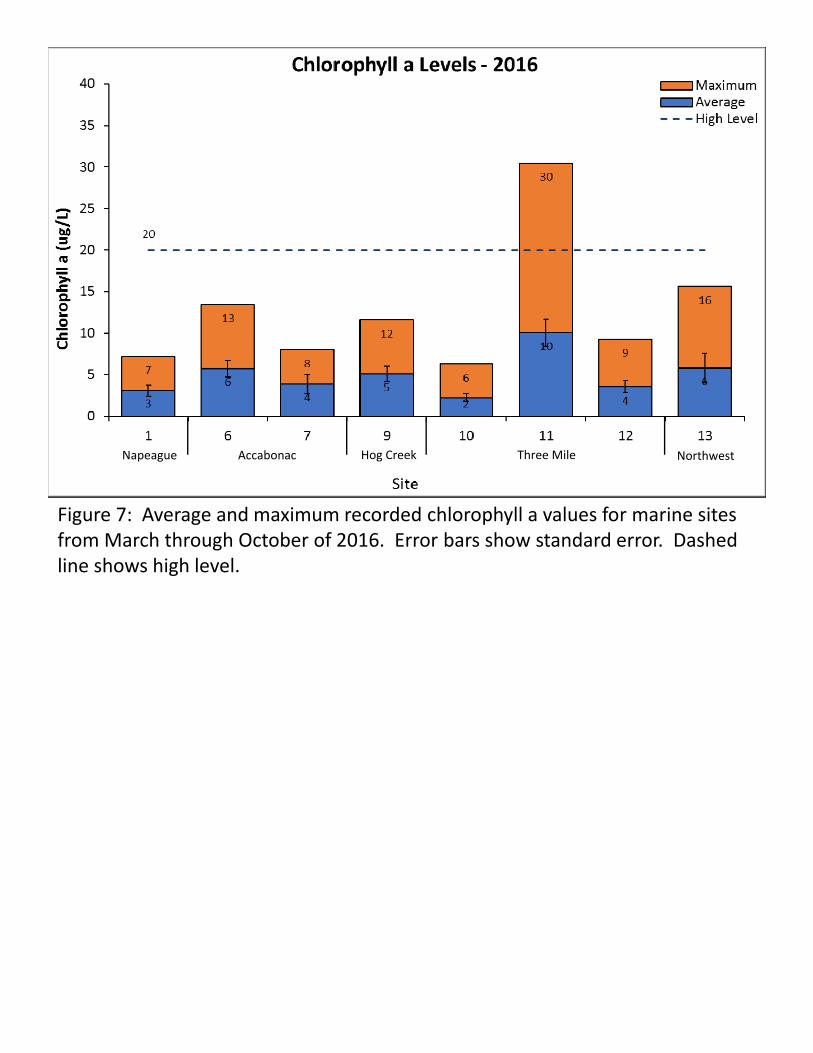
Figure 7: Average and maximum recorded chlorophyll a values for marine sites from March through October of 2016. Error bars show standard error. Dashed line shows high level.
Napeague Accabonac Hog Creek NorthwestThree Mile

Figure 8: Comparison of average chlorophyll a levels from 2015 and 2016, with running three‐year average. Error bars show standard error. Dashed line shows high level.
Napeague Accabonac Hog Creek NorthwestThree Mile

Figure 9: Chlorophyll a levels over time for Head of the Harbor, Three‐Mile, which exceeded the high level.

Figure 10: Average and maximum counts of the harmful dinoflagellate Dinophysis. Error bars showing Standard Error. Samples were collected from March and into July 2016. Level of concern of 10,000 cells/L not shown within range.
Napeague Accabonac Hog Creek NorthwestThree Mile Harbor

Figure 11: Comparison of average Dinophysis concentrations from 2015 and 2016, with the four‐year average. Level of concern of 10,000 cells/L not shown within range.
Napeague Accabonac Hog Creek NorthwestThree Mile Harbor

Figure 12: Average and maximum counts of the harmful dinoflagellate Cochlodinium. Error bars showing Standard Error. Samples were collected from July and into September 2016. Values shown on logarithmic scale.
Accabonac NorthwestThree Mile Harbor

Accabonac NorthwestThree Mile Harbor
Figure 13: Comparison of average Cochlodinium concentrations from 2015 and 2016, with the four‐year average. Values shown on logarithmic scale.

Figure 14: Cochlodinium levels over time for two sites that exceeded the level of concern.
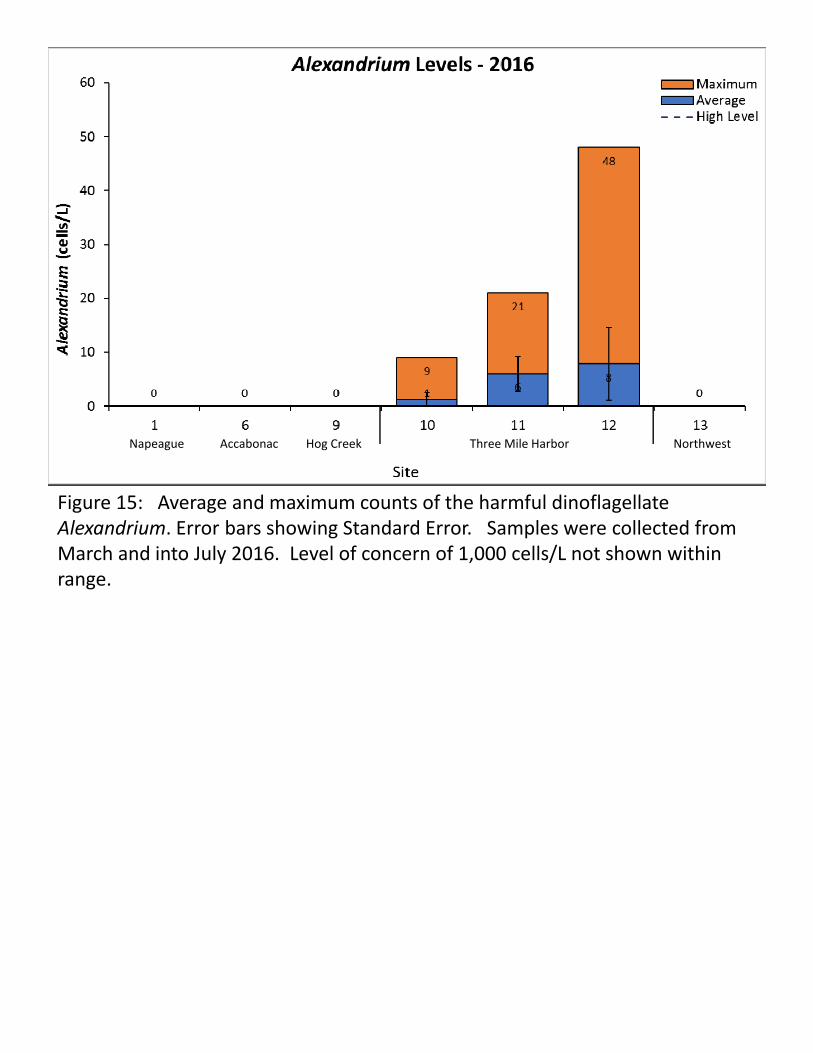
Figure 15: Average and maximum counts of the harmful dinoflagellate Alexandrium. Error bars showing Standard Error. Samples were collected from March and into July 2016. Level of concern of 1,000 cells/L not shown within range.
Napeague Accabonac Hog Creek NorthwestThree Mile Harbor
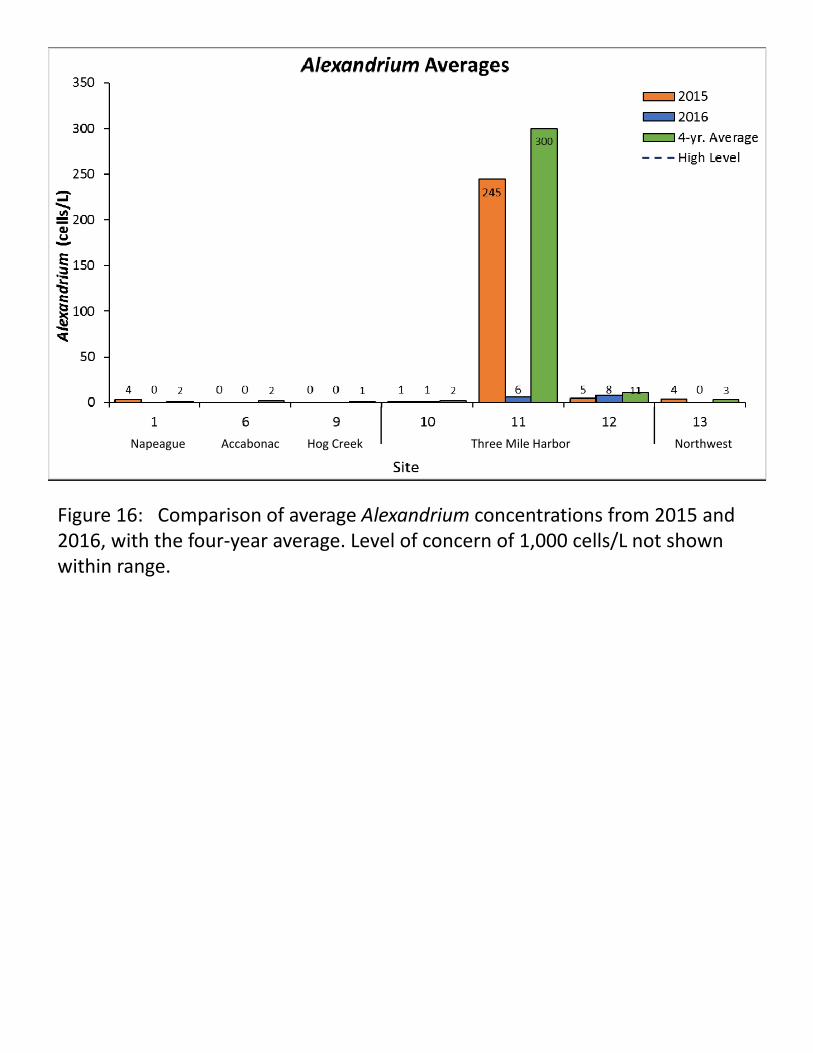
Figure 16: Comparison of average Alexandrium concentrations from 2015 and 2016, with the four‐year average. Level of concern of 1,000 cells/L not shown within range.
Napeague Accabonac Hog Creek NorthwestThree Mile Harbor

Figure 17: Average salinity values for marine sites from March through October of 2016. Error bars show standard error.
Napeague Accabonac Hog Creek North‐west
Three Mile

Figure 18: Average and minimum recorded dissolved oxygen values for marine sites from March through October of 2016. Error bars show standard error. Dashed line shows hypoxia threshold.
Napeague Accabonac Hog Creek North‐west
Three Mile

Figure 19A: Time series HOBO data of dissolved oxygen levels at depth from Head of the Harbor, Three‐Mile. Dashed line shows hypoxic level for low oxygen.

21
DRAFT
Figure 19B: Simulated nitrogen levels in groundwater within the Three Mile Harbor watershed.

22
DRAFT
10
5
(ft, msl; USGS)
Figure 19C: Simulated groundwater travel times within the Three Mile Harbor watershed.

Figure 20: Average and maximum recorded fecal coliform bacteria values for Georgica Pond sites from July through September of 2016. Error bars show standard error. Dashed lines show bathing safety limits.
Georgica CoveGeorgica, Rt. 27 SW Georgica South Georgica

Figure 21: Fecal coliform bacteria levels over time from Georgica pond at Rt. 27 which exceeded the average limit for bathing. Single date threshold not shown.

Figure 22: Average and maximum recorded enterococci bacteria values for Georgica Pond sites from July through September of 2016. Error bars show standard error. Dashed lines show bathing safety limits.
Georgica CoveGeorgica, Rt. 27 SW Georgica South Georgica

Figure 23: Enterococci bacteria levels over time from three sites that exceeded the average and individual date bathing limits. Dashed line shows bathing level limit for individual dates.
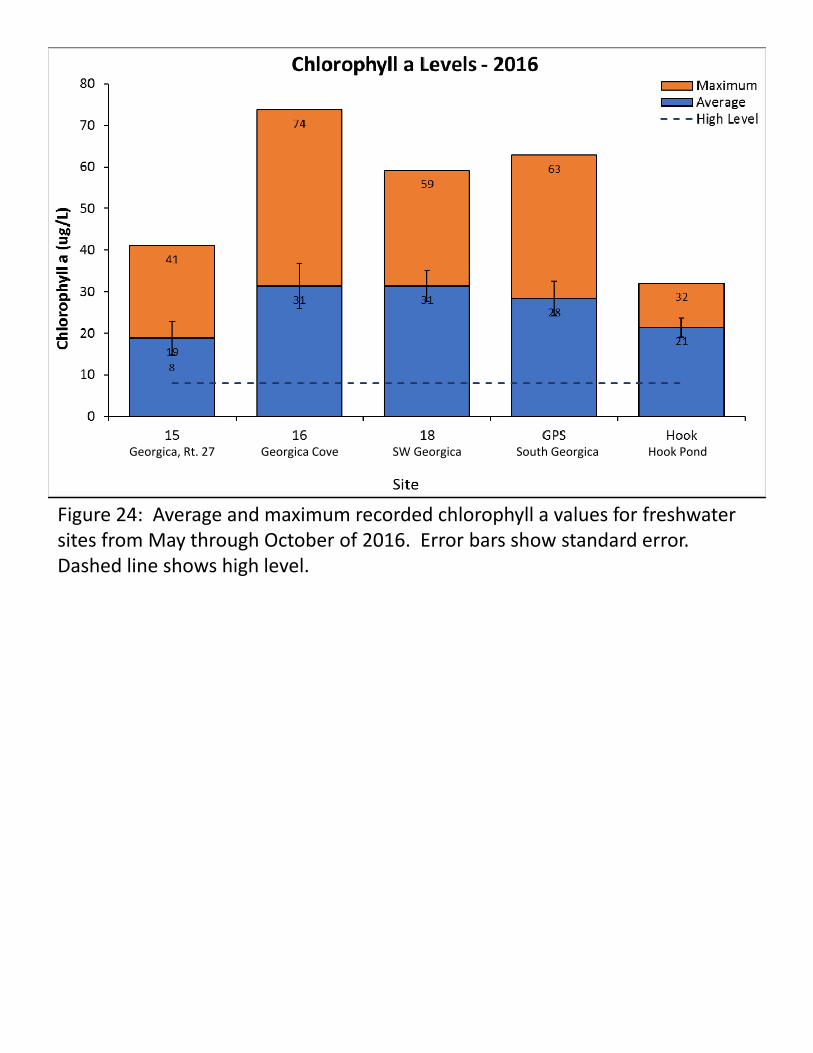
Figure 24: Average and maximum recorded chlorophyll a values for freshwater sites from May through October of 2016. Error bars show standard error. Dashed line shows high level.
Georgica CoveGeorgica, Rt. 27 SW Georgica South Georgica Hook Pond

Figure 25: Comparison of average chlorophyll a levels from 2015 and 2016, with running three‐year average. Error bars show standard error. Dashed line shows high level.
Georgica CoveGeorgica, Rt. 27 SW Georgica Hook Pond

Figure 26: Chlorophyll a levels over time for sites which exceeded the high level. Vertical dashed line shows opening of the inlet.
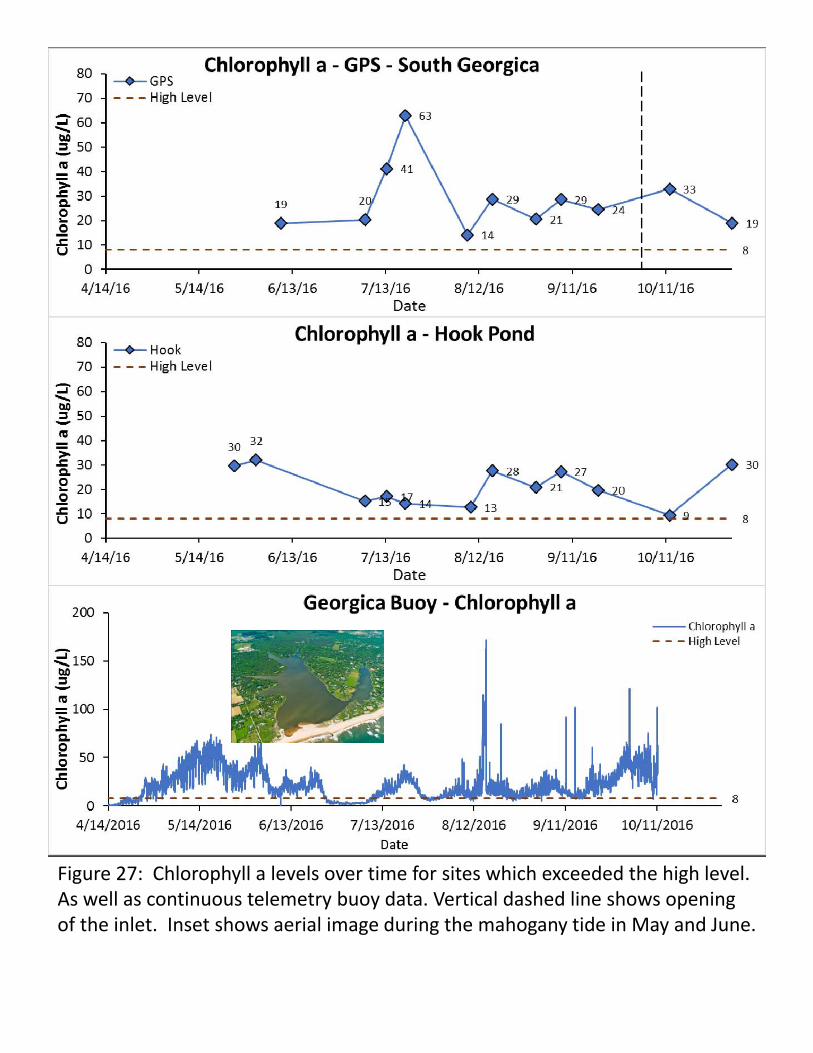
Figure 27: Chlorophyll a levels over time for sites which exceeded the high level. As well as continuous telemetry buoy data. Vertical dashed line shows opening of the inlet. Inset shows aerial image during the mahogany tide in May and June.
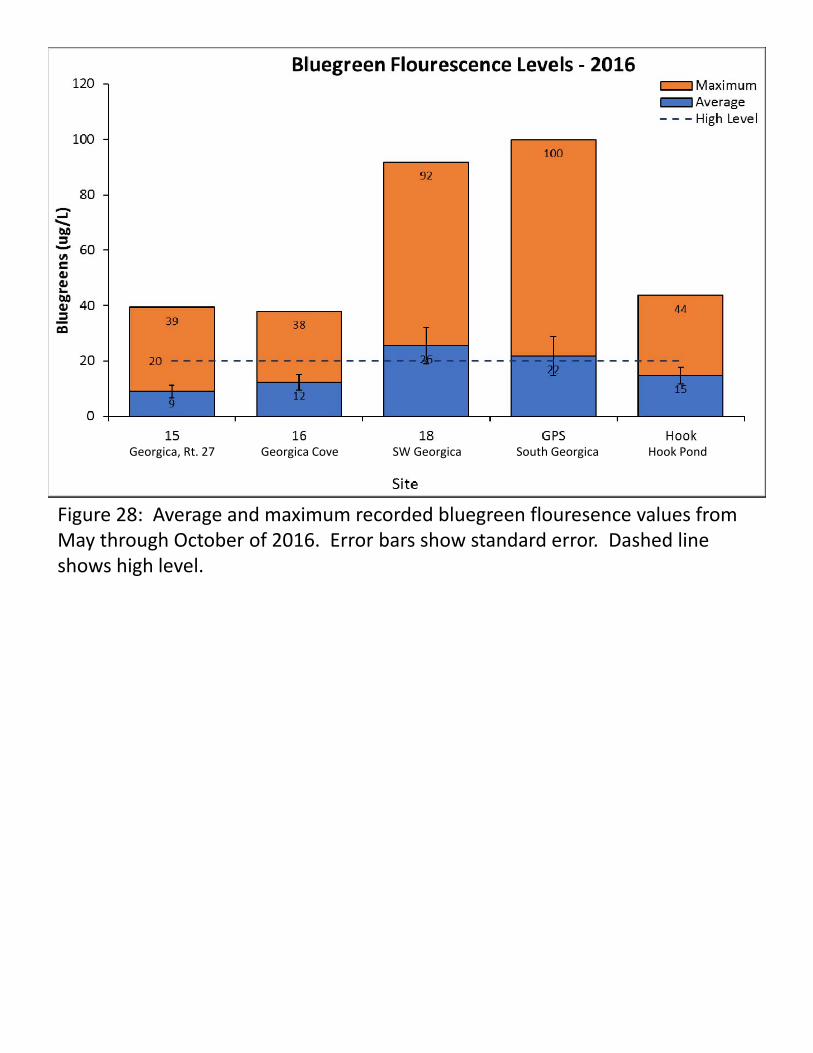
Figure 28: Average and maximum recorded bluegreen flouresence values from May through October of 2016. Error bars show standard error. Dashed line shows high level.
Georgica CoveGeorgica, Rt. 27 SW Georgica South Georgica Hook Pond

Figure 29: Comparison of average bluegreen flouresence levels from 2015 and 2016, with running three‐year average. Error bars show standard error. Dashed line shows high level.
Georgica CoveGeorgica, Rt. 27 SW Georgica Hook Pond

Figure 30: Bluegreen fluorescence levels over time for sites exceeding the high level of concern. Vertical dashed line shows opening of the inlet.

Figure 31: Bluegreen fluorescence levels over time for sites exceeding the high level of concern. As well as continuous telemetry buoy data. Vertical dashed line shows opening of the inlet.
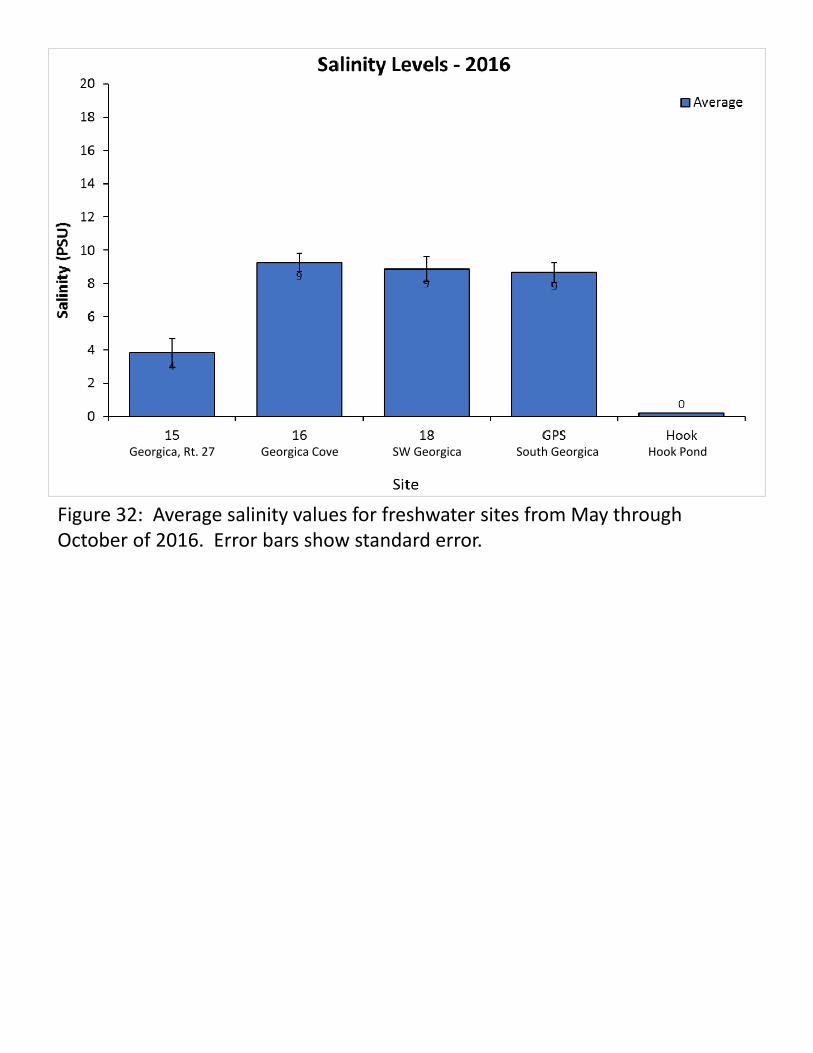
Figure 32: Average salinity values for freshwater sites from May through October of 2016. Error bars show standard error.
Georgica CoveGeorgica, Rt. 27 SW Georgica South Georgica Hook Pond

Figure 33: Salinity levels over time for Georgica Pond, with discreet sampling, and continuous telemetry buoy data. Vertical dashed line shows opening of the inlet.

Figure 34: Average and minimum recorded dissolved oxygen values for freshwater sites from May through October of 2016. Error bars show standard error. Dashed line shows hypoxia threshold.
Georgica CoveGeorgica, Rt. 27 SW Georgica South Georgica Hook Pond

Figure 35: Dissolved oxygen levels over time for Georgica Pond at Rt. 27, where values dropped below they hypoxic level. As well as continuous telemetry buoy data. Vertical dashed line shows opening of the inlet.


![[Anvil Christopher] Anvil, Christopher - Interstel(BookFi)](https://static.fdocuments.in/doc/165x107/577c7f1a1a28abe054a33ed5/anvil-christopher-anvil-christopher-interstelbookfi.jpg)