By Charlotte Bagnall Use a line transect and appropriate quadrats to collect quantitative and...
16
By Charlotte Bagnall Use a line transect and appropriate quadrats to collect quantitative and qualitative data to show how changing abiotic factors affect the distribution of organisms along the transect.
-
Upload
ferdinand-long -
Category
Documents
-
view
215 -
download
0
Transcript of By Charlotte Bagnall Use a line transect and appropriate quadrats to collect quantitative and...
By Charlotte Bagnall
Use a line transect and appropriate quadrats to collect
quantitative and qualitative data to show how changing
abiotic factors affect the distribution of organisms along
the transect.
I predict that the further away that we are from the shaded area, the more plant species we will find because there will be more moisture in the ground which will give the plants more nutrients. Furthermore, there will be more sunlight to help the plant species to grow.
• A quadrat• 10m tape measure• Area where there are a verity of different plant species• Soil thermometer• Light meter
Step one – Find an area of area outside where there are lots of plant species
Step two – Line a 10m tape measure laid along the grass making a marking in the ground by digging a little chunks of soil out from the ground. Make sure it is large enough to see.
Step three - Place the quadrat on the ground at each meter that is marked on the tape measure.
Step four – Now that it is placed, count the number of all the different plant species that are there and plot down in your results table
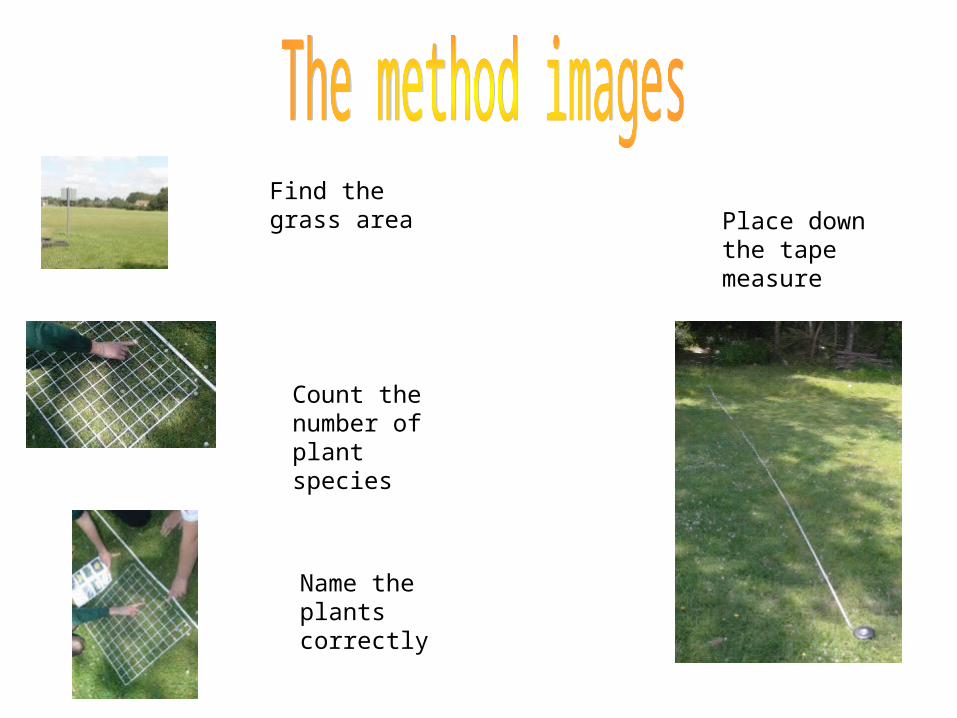
Find the grass area Place down
the tape measure
Count the number of plant species
Name the plants correctly
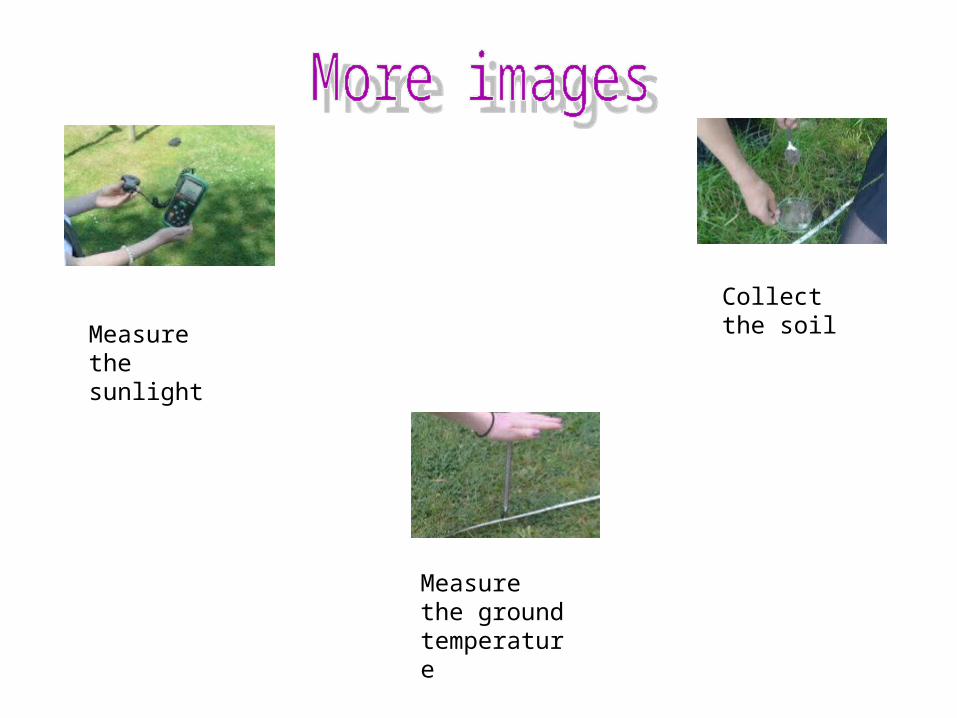
Measure the sunlight
Measure the ground temperature
Collect the soil

Risk assessment
Hazard Risk
Safety
Precaution
How to prevent it Rating
The quadrat
Could get hit over the head
by it
Lay the quadrat on the ground when not in
use.
Got to matron for an ice pack
1/10
Allergies
You could have allergies to the plant species
Make sure to take you’re your
mediation outside with you
Get to matron for medical help 7/10
Wooden Logs
Could trip us on large logs and
break something
Make you’re your just
walking not running
Go to matron for ice pack or if
leg is cut, a plaster
6/10

TableDistance Petri
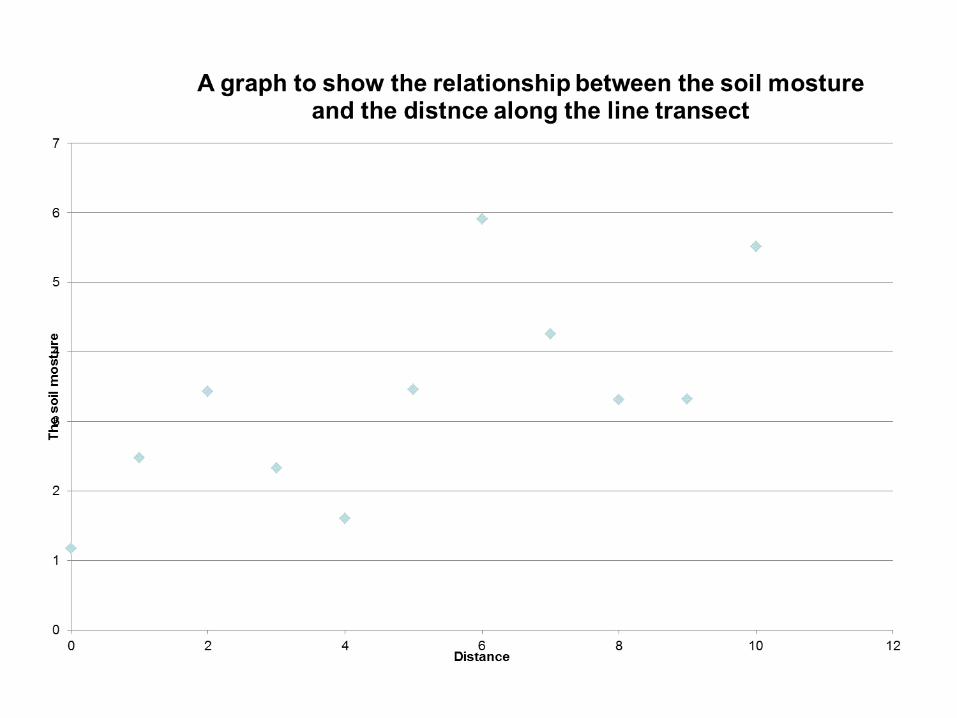
Dish (g)Wet
mass (g)Dry
mass (g)Soil
temp (‘c)Soil PH Light
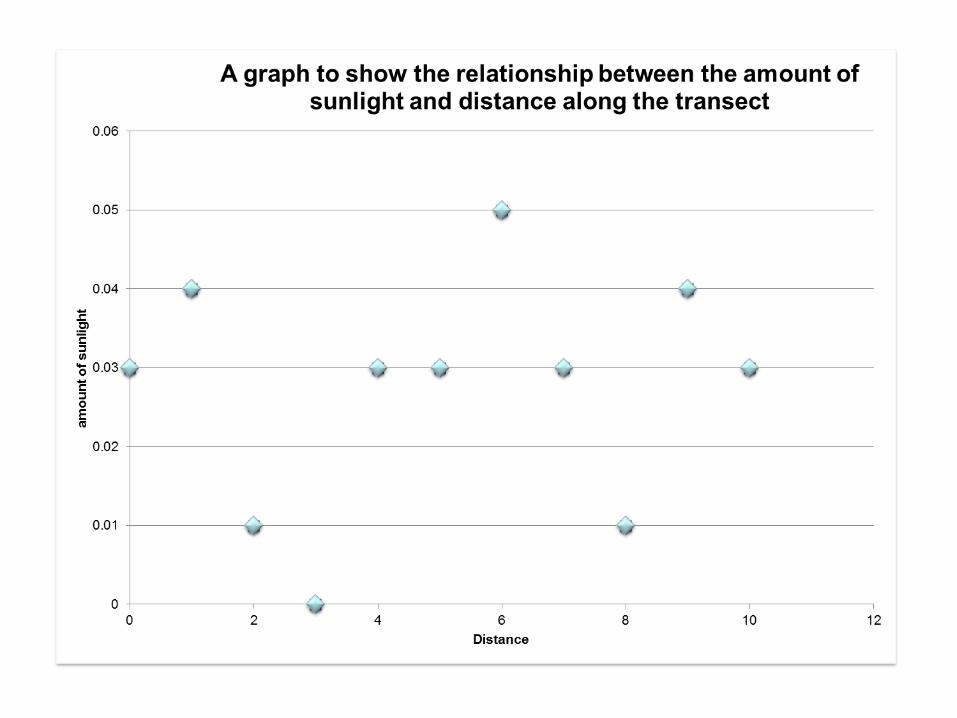
0 48.4 53.6 52.43 23 7 0.03
1 66.6 78.3 75.82 21 7 0.04
2 46.5 59.3 55.87 23 7 0.01
3 46.1 56.9 54.57 24 7 0.00
4 67.9 54.3 52.7 18 7 0.03
5 70.1 83.4 79.94 20 7 0.03
6 92.1 114.0 108.09 19 7 0.05
7 67.3 84.8 80.54 23 7 0.03
8 7.3 19.0 15.69 24 7 0.01
9 7.1 18.7 15.38 22 7 0.04
10 42.7 66.7 61.18 24 7 0.03
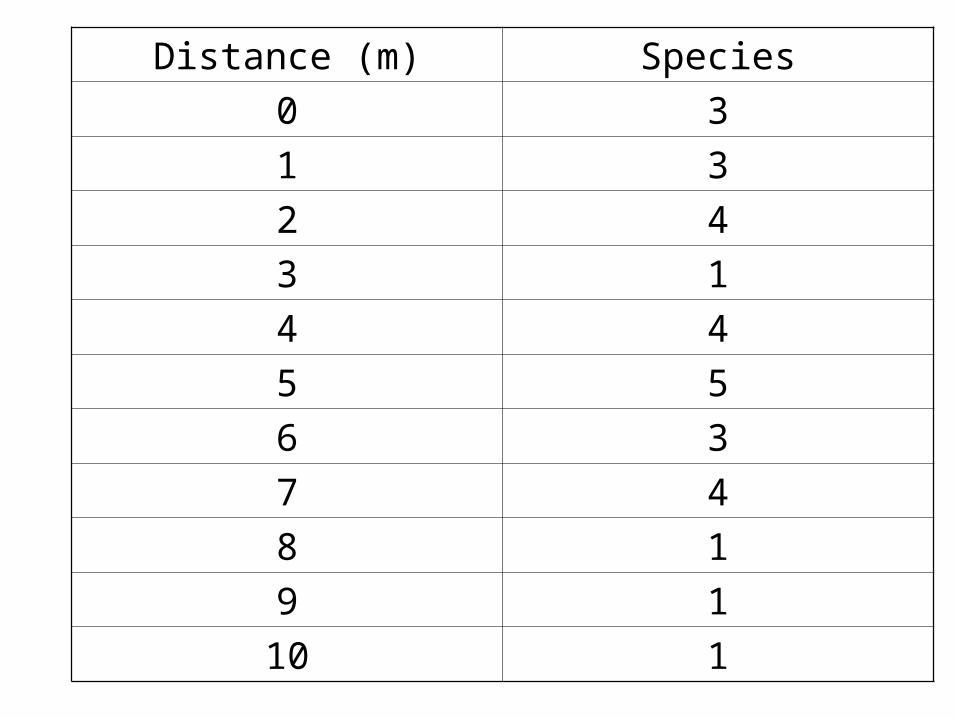
Distance (m) Species
0 3
1 3
2 4
3 1
4 4
5 5
6 3
7 4
8 1
9 1
10 1
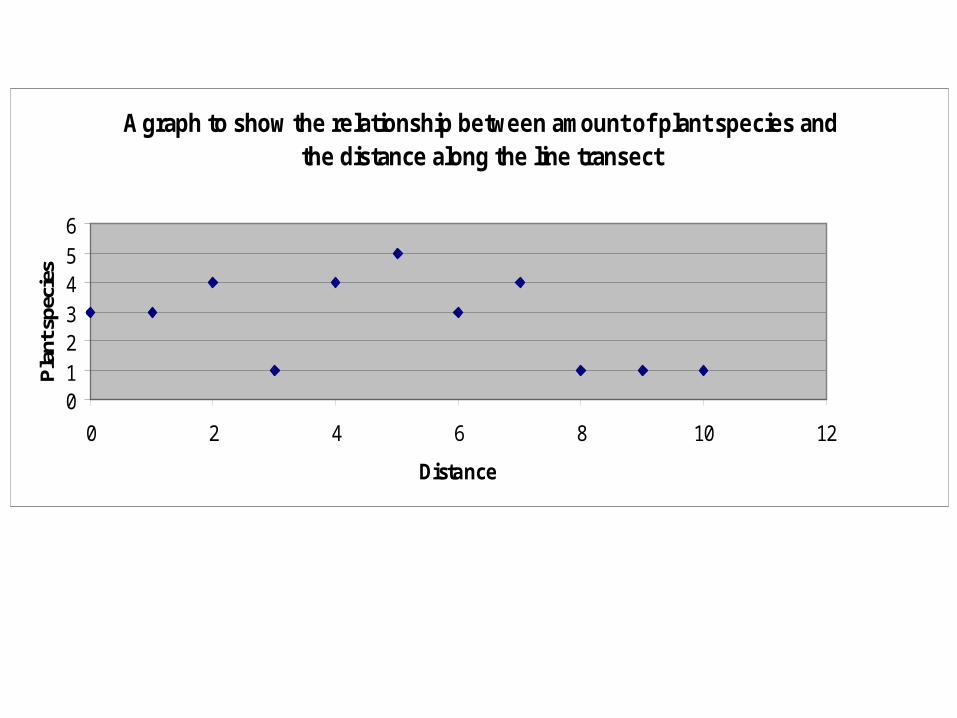
A graph to show the relationship between amount of plant species and the distance along the line transect
0123456
0 2 4 6 8 10 12
Distance
Pla
nt s
peci
es
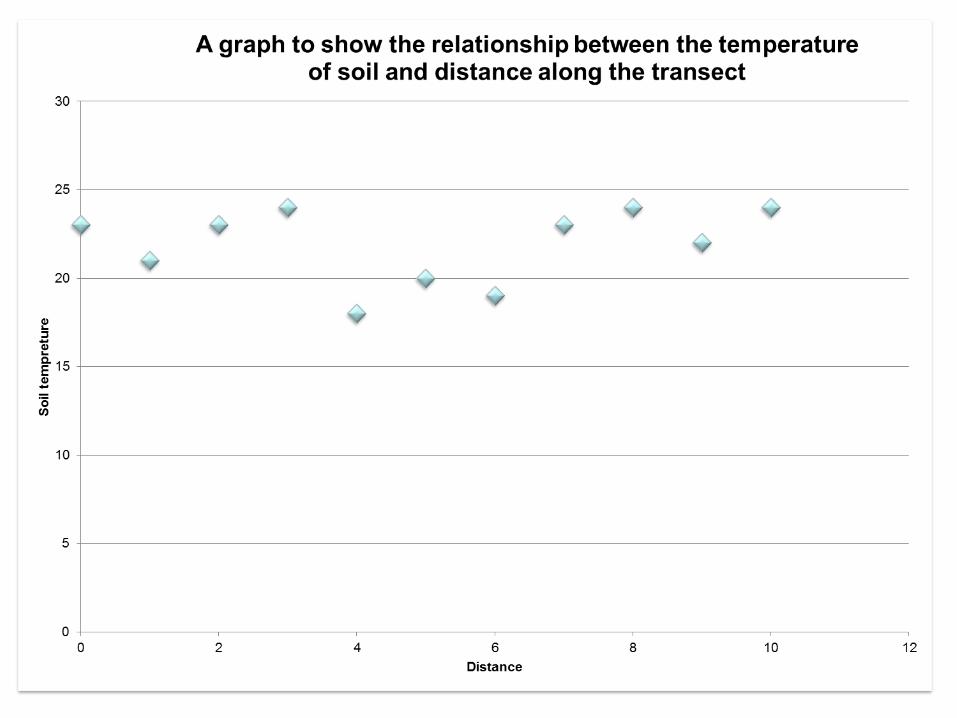

In conclusion, my results show, that the plant species corresponded with the soil temperature which meant when the soil was cooler, the more plant species there were. I found this rather strange as it goes against phophotosynthesis. This is when the plants need more light. Therefore I feel that I would need to of retest this again.
EvaluationEvaluation
We were able to gather our results in this investigation because there were a good verity of different plant species.
What didn’t work so well was as it was our first time trying to identify the plant types, there is a risk that we may have got the plant identification wrong.
If we were to do this experiment again, I would make try to find the plant species from a different area of the field to see if my results would be different. Also I would repeat this two or three more times.
We didn’t have to make any amendments/ modifications throughout the experiment.