by Avery Shenfeld - CIBC Capital Marketsresearch.cibcwm.com/economic_public/download/eijun11.pdf ·...
12
ECONOMIC INSIGHTS CIBC World Markets Inc. • PO Box 500, 161 Bay Street, Brookfield Place, Toronto, Canada M5J 2S8 • Bloomberg @ WGEC1 • (416) 594-7000 CIBC World Markets Corp • 300 Madison Avenue, New York, NY 10017 • (212) 856-4000, (800) 999-6726 June 1, 2011 Economics Avery Shenfeld (416) 594-7356 [email protected] Benjamin Tal (416) 956-3698 [email protected] Peter Buchanan (416) 594-7354 [email protected] Warren Lovely (416) 594-8041 [email protected] Krishen Rangasamy (416) 956-3219 [email protected] Emanuella Enenajor (416) 956-6527 [email protected] “text text text” http://research. cibcwm.com/res/Eco/ EcoResearch.html A central bank’s task is to get the most out of an economy while avoiding the scourge of inflation. In the quarter-century after 1983, an era that became known as “The Great Moderation”, the job seemed easy enough, as generally mild recessions and tame inflation allowed for a gentle steering in interest rates. The Great Recession that followed has been blamed, in some quarters, on the glacial pace at which the Fed raised interest rates in the last expansion. But it was much more about too moderate a hand in regulatory, not interest rate, policy, which left US and European mortgage and credit markets steering towards an inevitable abyss. The economic shock meant that the moderate steering in interest rates went out the window as central banks cut rates in dramatic fashion. In the current expansion, those in the monetary policy hot seat are once again back on a gradualist path. In most corners of the global economy, rate hikes are coming in dribbles, if at all. That approach could prove problematic. Emerging-market policy makers look to be behind the curve in battling inflation through exchange rate adjustments (ideally) and/or interest rate hikes. The risks that raises for the global economy are twofold: an overheating in commodity prices that acts as a current headwind on the developed world, and second, the risks of miscalculating and excessively tightening later on if rates have to move up in a hurry in response to inflation. In Canada, Governor Mark Carney could also be dubbed a gradualist, having thus far left real overnight rates significantly negative, despite judging the economy to be en route to its non-inflationary capacity within a year. The drags from an upcoming fiscal tightening, a tepid US economy and a strong Canadian dollar are good reasons for the Bank’s hesitance thus far, particularly with commodity prices not offering as much of a boost as they would have historically (see pages 3-5). In eschewing on a rate hike in May, the Bank’s statement was dovish enough to have us drop our projection for another round of hikes beginning in July. We can understand the logic of that strategy, but it exposes Canada to the risk of having to take a less gradualist approach to rate hikes later on if inflation heats up. Holding rates low for longer could fuel what may already be a housing price overshoot. A sharper run-up in rates down the road will make a smooth price adjustment less attainable. The alternative would be to deliver a couple of preemptive quarter-point hikes earlier, allowing room to keep on that gradualist path if the economy performs as expected and core inflation approaches the 2% target, but also leaving the door open to cutting rates again if it does not. So while we’re not forecasting a rate hike in July anymore, we’ve simply shifted that call to September. There are risks in waiting any longer should Canadian growth surprise to the upside. The Gradualist by Avery Shenfeld March 2, 2009 “There are risks in waiting any longer should Canadian growth surprise to the upside.”
Transcript of by Avery Shenfeld - CIBC Capital Marketsresearch.cibcwm.com/economic_public/download/eijun11.pdf ·...

Economic insights
CIBC World Markets Inc. • PO Box 500, 161 Bay Street, Brookfield Place, Toronto, Canada M5J 2S8 • Bloomberg @ WGEC1 • (416) 594-7000C I B C W o r l d M a r k e t s C o r p • 3 0 0 M a d i s o n A v e n u e , N e w Yo r k , N Y 1 0 0 1 7 • ( 2 1 2 ) 8 5 6 - 4 0 0 0 , ( 8 0 0 ) 9 9 9 - 6 7 2 6
June 1, 2011
Economics
Avery Shenfeld(416) 594-7356
Benjamin Tal(416) 956-3698
Peter Buchanan(416) 594-7354
Warren Lovely(416) 594-8041
Krishen Rangasamy(416) 956-3219
Emanuella Enenajor(416) 956-6527
“text text text”
h t t p : / / r e s e a r c h .cibcwm.com/res/Eco/EcoResearch.html
A central bank’s task is to get the most out of an economy while avoiding the scourge of inflation. In the quarter-century after 1983, an era that became known as “The Great Moderation”, the job seemed easy enough, as generally mild recessions and tame inflation allowed for a gentle steering in interest rates.
The Great Recession that followed has been blamed, in some quarters, on the glacial pace at which the Fed raised interest rates in the last expansion. But it was much more about too moderate a hand in regulatory, not interest rate, policy, which left US and European mortgage and credit markets steering towards an inevitable abyss. The economic shock meant that the moderate steering in interest rates went out the window as central banks cut rates in dramatic fashion.
In the current expansion, those in the monetary policy hot seat are once again back on a gradualist path. In most corners of the global economy, rate hikes are coming in dribbles, if at all.
That approach could prove problematic. Emerging-market policy makers look to be behind the curve in battling inflation through exchange rate adjustments (ideally) and/or interest rate hikes. The risks that raises for the global economy are twofold: an overheating in commodity prices that acts as a current headwind on the developed world, and second, the risks of miscalculating and excessively tightening later on if rates have to move up in a hurry in response to inflation.
In Canada, Governor Mark Carney could also be dubbed a gradualist, having thus far left real overnight rates significantly negative, despite judging the economy to be en route to its non-inflationary capacity within a year. The drags from an upcoming fiscal tightening, a tepid US economy and a strong Canadian dollar are good reasons for the Bank’s hesitance thus far, particularly with commodity prices not offering as much of a boost as they would have historically (see pages 3-5).
In eschewing on a rate hike in May, the Bank’s statement was dovish enough to have us drop our projection for another round of hikes beginning in July. We can understand the logic of that strategy, but it exposes Canada to the risk of having to take a less gradualist approach to rate hikes later on if inflation heats up. Holding rates low for longer could fuel what may already be a housing price overshoot. A sharper run-up in rates down the road will make a smooth price adjustment less attainable.
The alternative would be to deliver a couple of preemptive quarter-point hikes earlier, allowing room to keep on that gradualist path if the economy performs as expected and core inflation approaches the 2% target, but also leaving the door open to cutting rates again if it does not.
So while we’re not forecasting a rate hike in July anymore, we’ve simply shifted that call to September. There are risks in waiting any longer should Canadian growth surprise to the upside.
The Gradualistby Avery Shenfeld
March 2, 2009
“There are risks in waiting any longer should Canadian growth surprise to the upside.”

CIBC World Markets InC. Economic Insights - June 1, 2011
2
MARKET CALL
INTEREST & FOREIGN EXCHANGE RATES
We see a rate hike by July as justified, but have doubts that the Bank of Canada sees it the same way. We therefore dropped it from our forecast, leaving three quarter point moves to the end of the year, with the first hike in September. The current lull in growth looks to be a one-time hit from gasoline prices and temporary supply chain disruptions, and if it gives way to a re-acceleration, monetary stimulus will have to be withdrawn.
The bond market is at this point pricing in even fewer rate hikes, so look for pressure on two-year Canada’s in a flattening bear market ahead. We trimmed our outlook for longer US yields in the wake of the market’s rally, but if Europe’s credit problems are simply pushed down the road, the flight to safety bid for Treasuries will fade.
The Canadian dollar will be in a tug of war between two opposing forces: the advantages of wider short-term interest rate spreads vs. the US, but the disadvantages of a fading commodities rally and a generally more positive tone to the greenback. Call it a draw, and look for the C$ to be generally range-bound over the forecast horizon.
•
•
•
2011 2012
END OF PERIOD: 30-May Sep Dec Mar Jun Sep Dec
CDA Overnight target rate 1.00 1.25 1.75 1.75 1.75 1.75 2.0098-Day Treasury Bills 0.99 1.20 1.65 1.65 1.60 1.60 1.902-Year Gov't Bond 1.50 1.80 2.20 2.10 2.20 2.40 2.7510-Year Gov't Bond 3.07 3.30 3.50 3.50 3.60 3.65 3.7530-Year Gov't Bond 3.50 3.60 3.65 3.70 3.80 3.85 3.95
U.S. Federal Funds Rate 0.10 0.20 0.20 0.20 0.20 0.20 0.2091-Day Treasury Bills 0.04 0.10 0.15 0.15 0.15 0.15 0.202-Year Gov't Note 0.48 0.50 0.60 0.75 0.80 0.85 1.0010-Year Gov't Note 3.07 3.20 3.35 3.40 3.70 3.75 3.8530-Year Gov't Bond 4.24 4.30 4.45 4.55 4.60 4.70 4.75
Canada - US T-Bill Spread 0.95 1.10 1.50 1.50 1.45 1.45 1.70Canada - US 10-Year Bond Spread -0.01 0.10 0.15 0.10 -0.10 -0.10 -0.10
Canada Yield Curve (30-Year — 2-Year) 2.00 1.80 1.45 1.60 1.60 1.45 1.20US Yield Curve (30-Year — 2-Year) 3.77 3.80 3.85 3.80 3.80 3.85 3.75
EXCHANGE RATES CADUSD 1.02 1.02 1.03 1.01 1.02 1.02 1.03USDCAD 0.98 0.98 0.97 0.99 0.98 0.98 0.97USDJPY 81 87 89 88 90 92 94EURUSD 1.43 1.36 1.34 1.30 1.35 1.34 1.32GBPUSD 1.65 1.60 1.62 1.62 1.67 1.65 1.65AUDUSD 1.07 0.98 0.97 0.98 1.03 1.01 1.00USDCHF 0.85 0.95 0.96 0.97 0.95 0.97 1.01USDBRL 1.59 1.62 1.65 1.62 1.60 1.58 1.56USDMXN 11.62 11.80 12.00 12.00 11.85 11.75 11.50

CIBC World Markets InC. Economic Insights - June 1, 2011
�
Commodity Prices: The More the Merrier for Canada?Avery Shenfeld and Emanuella Enenajor
Chart 1Key Emerging Markets Increase TheirShare of Commodities Demand
Canada’s natural resource bounty is, no doubt, a blessing in an era in which commodities are getting expensive, while manufactured goods from clothing to high tech, seem to get ever cheaper. That shift in relative prices represents a winner in terms of living standards for Canadians, as a net exporter of commodities and a net importer of most consumer goods and business equipment. Comparing two points at which we were at full employment, Canada is better off in an equilibrium in which resource prices are high relative to what we buy abroad.
But an upward run in commodity prices is less likely to boost growth and get Canada to full employment as it might have been in the past. That largely reflects the new tendency for commodities demand growth to be overwhelmingly found in emerging markets (Chart 1) to which Canada has less direct ties.
The result is that a general rise in the Bank of Canada’s commodity price index appears to have more modest benefits for Canadian GDP growth than was historically the case. Indeed, a vector autoregression analysis1 of the relationship between the Bank of Canada’s commodity price index, Canadian GDP and US GDP shows that an upward shock in that basket of resource prices tends to slightly lower the level of Canadian GDP (relative to
the base case) over the period since 1995, excluding the recent recession. Further back, the linkage was measurably positive, raising the level of real output by more than 1% four quarters out (Chart 2).
The New World Order
What lies behind that shift? Historically, when resource prices were on a demand-driven upswing (as opposed to a supply shock as we saw in oil in 1973), a booming US economy was part of that story, which meant good times for other Canadian exports. Not so today. Prices for copper, cotton, oil, gold, and other globally traded resources all reached multi-year highs despite America’s economy sporting a roughly 5% output gap.
Looked at from 30,000 feet, the improvement in the terms of trade has been a stunning win for Canada, but real trade volumes have not, in fact, been that impressive in the past decade’s run for resources. Net trade from 2000 to 2007, a period of huge gains in commodity prices, was actually a drag on growth in real terms, having been slightly positive in earlier decades (Chart 3). We earned more income from what we sold abroad, but we didn’t sell more of it relative to the volume of imports, and that was during an expansion in which the US was doing much better than it is today.
1 We regress the following variables: Bank of Canada Commodity Price Index, Canadian and US real GDP growth, CAD and 10-year government of Canada yield) on lagged values of each other. Our model is thus able to capture how a rise in commodity prices impacts Canadian GDP directly and via induced
changes in the US economic growth, the exchange and interest rates.
Chart 2Cdn GDP Response to Commodity Price Shocks
Source: EIA, CRU, WBMS
99.5
100.0
100.5
101.0
101.5
0 1 2 3 4 5 6 7 8 9 10
1975-1994
1995-2007
Quarters from start of shock (25% increase in commodity prices)
GDP IndexPreshock = 100 Max = 1.3%
0%
20%
40%
60%
Petr
ole
um
Ref
ined
Copper
Coal
Prim
ary
Nic
kel
1990's
Today
BIC (Brazil, India, China) Share of Total Consumption
Note: latest coal data as of 2009; petroleum data as of 2010; nickel and copper data as of 2011 Q2,
copper data excludes Brazil

CIBC World Markets InC. Economic Insights - June 1, 2011
�
Chart �Trade Weighed on Cdn Growth in Last Expansion
Chart 5Increasing Importance of Commodity Sector Investment
Chart �Canadian Commodity Output Tilting to Energy Sector
Rather than booming, the US is being held back by the mess in its housing market, and to some extent, by high oil prices that have acted as a tax on American consumers. We estimate that the run-up in oil from $80 to $100/bbl chopped as much as a half-percent on US growth, as wages failed to keep pace with a gasoline-boosted CPI.
Consumers vs. Capital Spending
In Canada, our own consumers also face similar costs, although as shareholders in energy companies they are reaping the income effects of higher oil prices. Historically, Canada’s commodity basket was well diversified, and included heavy weights for items that don’t feature prominently in the CPI basket (e.g. forest products). In recent decades, the energy, and particularly oil’s share of the basket has grown (Chart 4), meaning that a rising Bank of Canada commodity price index has weighed more heavily on real consumer spending power than it might have in the past when industrial commodities had a greater weight. Although wages and employment in the resource sector benefit from higher energy prices, that lift has not been sufficient to prevent gasoline purchases from eating up a higher share of incomes and retail sales.
While consumers might be constrained, capital spending in Canada’s resource sector clearly benefits from higher resource prices. Such projects have accounted for roughly 22% of all private capital spending in the economy in recent years, up about 4%-points from the pre-2000 share (Chart 5). But it’s not necessarily the case that extreme peaks in resource prices are needed to get the lion’s share of that boost.
-1.0
-0.5
0.0
0.5
1.0
1975-1999 2000-2007
Net Trade Contribution to GDP Growth (%)
0%
20%
40%
60%
80%
1975
1980
1985
1990
1995
2000
2005
2010
Energy Share of BoC Fisher Commodity Price Index
Take the oil sector, for example. Annual oil sands capital budgets were pared back during the recession’s dive to less than $40/bbl prices, but those projects were ramped up again once crude recovered towards $80/bbl (Chart 6). Projects with hurdle rates above, say, $100/bbl are unlikely to be green-lighted unless crude spends a convincingly long period of time above that level, as capital budgets tend to use conservative assumptions. So at peak prices, we feel the hit to US growth and Canada’s exports to that market without much of an offsetting lift to capital spending here.
Source: Bank of CanadaSource: Statistics Canada
0%
5%
10%
15%
20%
25%
pre-2000 2000-2010
Commodity Industry Share of Private Sector CapEx
Source: Statistics Canada
CIBC World Markets InC. Economic Insights - June 1, 2011
5
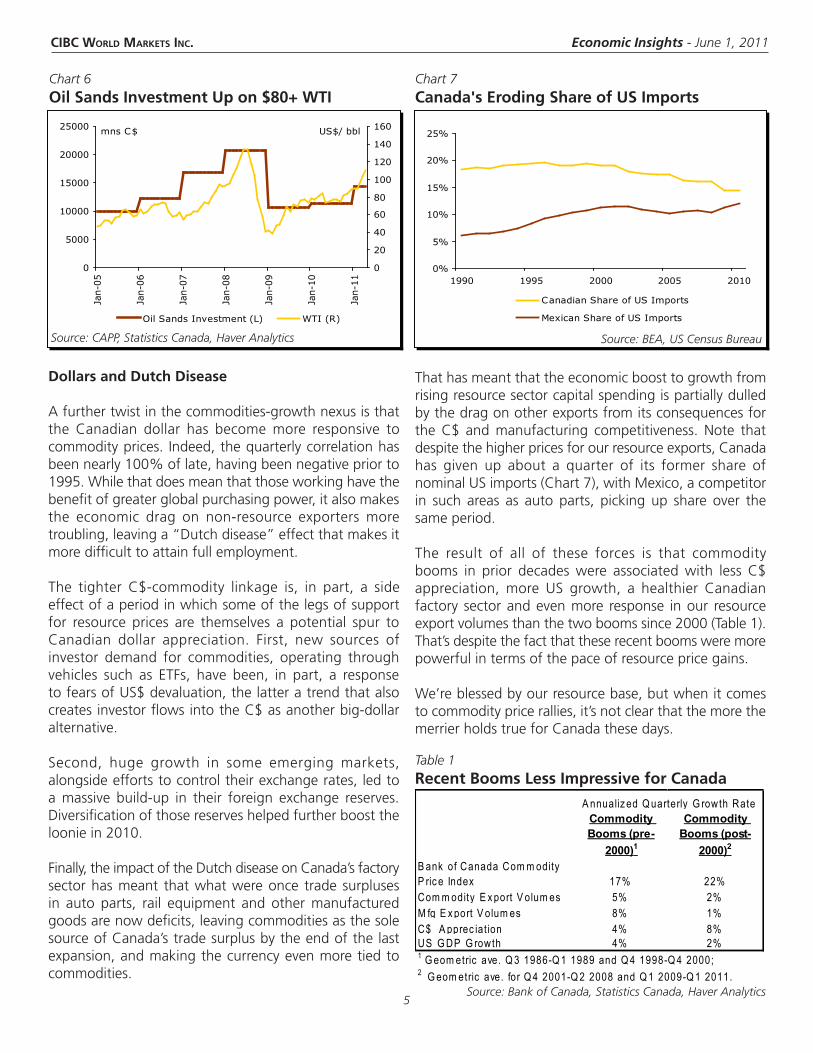
Chart 7Canada's Eroding Share of US Imports
Dollars and Dutch Disease
A further twist in the commodities-growth nexus is that the Canadian dollar has become more responsive to commodity prices. Indeed, the quarterly correlation has been nearly 100% of late, having been negative prior to 1995. While that does mean that those working have the benefit of greater global purchasing power, it also makes the economic drag on non-resource exporters more troubling, leaving a “Dutch disease” effect that makes it more difficult to attain full employment.
The tighter C$-commodity linkage is, in part, a side effect of a period in which some of the legs of support for resource prices are themselves a potential spur to Canadian dollar appreciation. First, new sources of investor demand for commodities, operating through vehicles such as ETFs, have been, in part, a response to fears of US$ devaluation, the latter a trend that also creates investor flows into the C$ as another big-dollar alternative.
Second, huge growth in some emerging markets, alongside efforts to control their exchange rates, led to a massive build-up in their foreign exchange reserves. Diversification of those reserves helped further boost the loonie in 2010.
Finally, the impact of the Dutch disease on Canada’s factory sector has meant that what were once trade surpluses in auto parts, rail equipment and other manufactured goods are now deficits, leaving commodities as the sole source of Canada’s trade surplus by the end of the last expansion, and making the currency even more tied to commodities.
Chart 6Oil Sands Investment Up on $80+ WTI
Table 1Recent Booms Less Impressive for Canada
That has meant that the economic boost to growth from rising resource sector capital spending is partially dulled by the drag on other exports from its consequences for the C$ and manufacturing competitiveness. Note that despite the higher prices for our resource exports, Canada has given up about a quarter of its former share of nominal US imports (Chart 7), with Mexico, a competitor in such areas as auto parts, picking up share over the same period.
The result of all of these forces is that commodity booms in prior decades were associated with less C$ appreciation, more US growth, a healthier Canadian factory sector and even more response in our resource export volumes than the two booms since 2000 (Table 1). That’s despite the fact that these recent booms were more powerful in terms of the pace of resource price gains.
We’re blessed by our resource base, but when it comes to commodity price rallies, it’s not clear that the more the merrier holds true for Canada these days.
Source: Bank of Canada, Statistics Canada, Haver Analytics
0
5000
10000
15000
20000
25000
Jan-0
5
Jan-0
6
Jan-0
7
Jan-0
8
Jan-0
9
Jan-1
0
Jan-1
1
0
20
40
60
80
100
120
140
160
Oil Sands Investment (L) WTI (R)
US$/ bblmns C$
Source: CAPP, Statistics Canada, Haver Analytics
0%
5%
10%
15%
20%
25%
1990 1995 2000 2005 2010
Canadian Share of US Imports
Mexican Share of US Imports
Source: BEA, US Census Bureau
Commodity Booms (pre-
2000)1
Commodity Booms (post-
2000)2
B ank of Canada Com m odity P ric e Index 17% 22%Com m odity E x port V olum es 5% 2%M fg E x port V olum es 8% 1%C$ A pprec iat ion 4% 8%US G DP G rowth 4% 2%
A nnualiz ed Q uarterly G rowth Rate
1 G eom etric ave. Q 3 1986-Q 1 1989 and Q 4 1998-Q 4 2000; 2 G eom etric ave. for Q 4 2001-Q 2 2008 and Q 1 2009-Q 1 2011.

CIBC World Markets InC. Economic Insights - June 1, 2011
6
Estimating the Odds of an Equity Bear MarketPeter Buchanan
clear and present danger. The bad is that it looks more and more as if global growth this year will come in closer to our earlier scaled back 4% forecast than 2010’s hot 5% pace. The US data revisions point to stiffer energy headwinds for the consumer even as capital spending is downshifting from its earlier vigourous clip. Nor have some of the global economy’s strongest players been spared. The recent 10-month low in China’s flash PMI, stalled auto sales and further central bank tightening all point to less toasty growth there.
Earnings News: Not Bad But the Bar Has Risen
While commodity prices remain at one of the highest levels on record, the recent modest correction has served to remind investors that those prices can move up and down, notwithstanding the obvious bullish implications in the longer run of rising demand from China and India. Resource stocks have trailed the TSX lately after pacing gains late last year. The curse of high expectations has also helped cool the rally’s earlier momentum. Q1’s 18% year-on-year rise in TSX earnings was good compared to the 7% longer term annual average. But it trailed pre-reporting season expectations for a rise of over 20%, as misses by energy and materials producers offset street-beating numbers from the telecoms, utilities and non-bank financials (Chart 2).
A Cooler Spring for Stocks After a Hot Winter
Proving that sustained performance wins, the hare didn’t prevail in Aesop’s tale. After a surge to 2½ year highs earlier in 2011, North American equity markets have settled back into a more modest groove lately. While it’s too early to write the epitaph for one of the past half century’s strongest rallies, several forces could help to keep the market express rolling down a slower track for a while longer.
One restraint—though perhaps not such a bad thing seen in a broader context—is the reawakening of investors’ appreciation for risk. Rekindled eurozone debt woes have contributed to the more cautious mindset in markets, as evidenced by the strong recent performance not only of government bonds, but other havens, like quality dividend stocks (Chart 1).
Also inspiring caution are perceptions that the global expansion may have already seen its best days, as efforts to cut deficits in the developed world compound the drag from higher energy prices and emerging market central bankers’ efforts to tame hot inflation. After padding their growth estimates for 2011 only months ago, many forecasters have consequently been trimming them recently. The good news is that for the great majority of countries, a double dip recession doesn’t look like a
Chart 1Quality Dividend Stocks Have Done Well Recently
96
97
98
99
100
101
102
103
104
105
12/1
4/20
10
1/11
/201
1
2/8/
2011
3/8/
2011
4/5/
2011
5/3/
2011
Relative Strength: Canadian Dividend Aristocrats Index vs TSX Composite, 2010 close=100
Chart 2TSX Composite Q1 Earnings: The Good, the Bad and the Ugly
Source: Bloomberg
-30 -20 -10 0 10 20 30
Industrials
Basic Materials
Oil & Gas
Technology
Consumer Svcs
Telecom
Financials
Health Care
Consumer Goods
Utilities
Average % deviation from consensus expectations

CIBC World Markets InC. Economic Insights - June 1, 2011
7
Chart �TSX Has More Weight in Yield-Sensitive Areas
Some Pluses as Well as Challenges
Not all of the news has been bad, one reason why softer market performance does not in our view portend a sharp retreat. It appears all the more likely that central banks in both Canada and the US will hold their fire for a while longer (see page 1), given the recent growth and inflation data. That could help the TSX more than the S&P 500, given the Canadian market’s appreciably higher 35% weighting in interest sensitive sectors (financials, utilities, telecoms) (Chart 3). The past month’s 5% drop in US gasoline pump prices may also portend reduced headwinds from that quarter.
How TSX Fared After Earlier Oil/Resource Rallies
In terms of potential risk scenarios, an obvious one given the economic backdrop and a potentially firmer US dollar is that commodity prices could lose a bit more ground.
Our analysis (see pages 3-5) suggests that wouldn’t be an unalloyed negative for Canada’s economy, given the country’s close ties with a heavily energy using US economy and damage to consumer pocket books. What might the effect be on equity valuations? While modest oil prices swings are a plus for Canadian stocks, the historical evidence would appear to suggest that large, recession inducing ones, which rob consumers of purchasing power and squeeze margins elsewhere in the economy, aren’t.
The 1973-74 OPEC oil shock provides a case in point. The S&P 500 rebounded strongly from late 1974 on in that episode, as slowing growth eased pressure on energy
markets, improving the general economic outlook. The TSX bottomed at precisely the same time as the US index in that episode, despite its greater energy weighting. The stimulus from falling energy costs also certainly contributed to the strength of the rebound in both stock markets in the aftermath of the recent recession. Although the energy sector lagged the market as a whole, the TSX nevertheless rose by 60% in the first year after the bottom, one of the strongest rallies on record (Chart 4).
Handicapping the Odds on Future Bull and Bear Markets
If energy alone isn’t such a decisive driver, what are the odds that other factors either tip the recent sell-off into a full-fledged bear market or send the TSX to new heights? In modelling those probabilities, we have chosen to focus on a three-month horizon, because that period is a relevant one for many investors and the predictive power of many indicators declines over longer time periods. The TSX has had ten rallies—defined loosely as a 20% rise in prices—since 1956, the earliest year for which consistent data is readily available. (Comparable data on the level and changes in forward earnings are, unfortunately, available only back to the mid-1980s.) The TSX has been in a bullish phase about 80% of the time in the past half-century, making that by far the most prevalent trading regime (Table 1, Chart 5).
The biblical reference to seven good harvests followed by seven meagre ones is one of the oldest references to “persistence” in asset markets. A Markov Chain, one
0
5
10
15
20
25
30
35
40
TSX Composite S&P 500
Financials Telecoms Utilities
% of market cap
Chart �TSX & S&P 500 Rallied Together on Improving Growth Outlook After Past Oil Shocks
0
2000
4000
6000
8000
10000
12000
14000
16000
Jan-08 Oct-08 Jul-090
200
400
600
800
1000
1200
1400
1600
TSX Composite (L)
S&P 500 (R )
End of Oil Shock
0
200
400
600
800
1000
1200
1400
Jan-73 Nov-74 Sep-760
20
40
60
80
100
120
140End of Oil Shock

CIBC World Markets InC. Economic Insights - June 1, 2011
�
Chart 6Actual and Predicted Bull and Bear Markets
model of time-correlated performance used increasingly in modern financial analysis, holds that tomorrow’s trading regime (e.g. bull or bear market), depends on today’s state—but not on any earlier history. The transition probabilities in a Markov Chain (the odds, say, that a bull market this month will be followed by “a bull market correction” next) are fixed in the simplest case. However, a more complex but realistic and useful approach from an investment perspective, is where the odds of progressing from one market regime to another depend on the state of the economy, earnings and other financial variables.
Adopting the latter of these two approaches, we have used a probit regression on six financial and economic series and a variable representing the market’s current state (i.e. bull market=1, or bear market=0) to calculate odds for a particular type of market performance three months ahead. A bull market-bear market indicator constructed this way has had considerable success tracking the timing of regime shifts since the mid-1980s
(Chart 6). Using the latest data, it is currently placing under 5% odds on the start of a new bear market in the next two-three months, suggesting that the TSX’s recent decline is a bull market correction. Our analysis suggests that the variables that convey the most information about future market performance are: 1) the slope of the yield curve, 2) the ratio of 12-month forward to trailing earnings, and 3) the 12-month forward PE ratio. That suggests investors might be well advised to pay close attention to these metrics, as part of their tracking of general economic and financial trends.
A downshifting global recovery and assorted other developments have contributed to a cooler ride in equity markets recently. Within each economic cycle, there are typically many market ups and downs, jogs and short-term corrections. Although the situation bears watching, our analysis does not suggest a materially worse equity market outcome than that typical bump in the road.
Chart 5TSX's Time in Different Regimes Since 1956 (%)
Table 1Historical TSX Bull & Bear Markets
Probit Model — (market state � mo. ahead: bull=1, bear=0) = Φ [1.09 + .1� x (mo/mo US GDP chg.) + .001� x (10 yr – � mo. GOC yield)** -.2� x (equity market liquidity) - .12 x (12 mo. fwd PE ratio)** +0.26 x (ratio of 12 mo. fwd to 12 mo. trailing earnings)** – .012 (� mo. % chg. in CRB index) + 1.9� x (current market state: bull=1, bear=0)**]
Where ‘market liquidity’ is the TSX 60 bid ask spread and index earnings refer to survey and lagged historical numbers from Thomson Reuters. ** denotes statistical significance at the 10% level. Φ is the normal cumulative distribution function, as per the usual practice. US monthly GDP changes are interpolated from the quarterly data. The model was estimated over the May 19�7 – May 2011 period.
Bottom Top Rise (%)Subsequent Decline (%)
Dec-57 Dec-61 62.2 -18.4
Sep-62 May-69 97.8 -28.3
Jun-70 Feb-74 54.8 -32.7
Dec-74 Nov-80 184.5 -44.0
Jul-82 Aug-87 205.5 -30.9
Nov-87 Aug-89 41.3 -25.1
Oct-90 May-98 158.1 -28.8
Aug-98 Sep-00 105.9 -50.0
Oct-02 Jun-08 164.7 -49.8
Mar-09 ?
0%10%20%30%40%50%60%70%80%90%
100%
Jun-88 Jun-93 Jun-98 Jun-03 Jun-08TSX Bull Markets
Probit-Model prediction of odds of bull market fromobserved financial/economic data 3 months ago
last model prediction
dateAug-2011
"Normal" Bull
Market, 71
Bull Market Correction,
9
"Normal" Bear
Market, 16
Bear Market (or "Sucker's") Rally, 3

CIBC World Markets InC. Economic Insights - June 1, 2011
9
Chart 1India's Demographic Advantage Over China
Source: IMF
India has often been referred to as a sleeping giant as it has remained in China’s economic shadow, despite its GDP growth averaging a healthy 6.5% a year over the last two decades. With its demographic advantages and more room to realign resources towards more productive areas of the economy, India could potentially outperform China in the coming decades and accordingly provide further tremendous opportunities for investors. But that potential is at risk of remaining unfulfilled, if some pressing challenges are not addressed.
Demographics: Advantage India
On demographics alone, India is in many ways a quite attractive proposition for investors. The country already has the highest working-age population growth rates in the world and that advantage is likely to be preserved, with roughly a quarter of the increase in the global population in the 15–64 age bracket over the next three decades projected to be in India1. The increase in the proportion of the working-age group and the corresponding drop in the dependency ratio (i.e. the ratio of elderly and children to working age population), should help alleviate fiscal pressures and leave more room for savings to flow into investment spending rather than deficit finance.
The benefits to per capita GDP of a higher share of its population available to work give India an edge over China, where demographics aren’t quite as favourable due to historic efforts to limit family size (Chart 1). India also has more scope for productivity gains from transferring resources to the manufacturing sector from the low-productivity agricultural sector. The latter currently accounts for 17.5% of GDP in India compared to an already trimmed-down 11% in China. Moreover, India’s faster growing middle class (expected to reach 41% of the population by 2025 from 5% in 2005) is set to fuel domestic demand for decades to come2.
Unleashing India's PotentialBenjamin Tal and Krishen Rangasamy
Need to Deal With Inflation Challenge
While India seems ready for take off, it faces some economic hurdles that could delay its launch. For one, inflation remains a major threat to growth. The spike in food and energy prices, which together account for over half of the weight in India’s CPI, has pushed inflation to double digits until recently, prompting the Reserve Bank of India to raise its repo rate by 200 basis points in the last twelve months alone. Further tightening is needed to bring real interest rates into positive territory, and we expect the RBI to hike another 50 basis points in the third quarter en route to taking the repo rate to pre-recession levels of 9% by the end of next year (Table 1).
Banks are already passing such tightening signals to borrowers, and that’s impacting investment demand. The growth rate in capital spending has come down quite steeply from 25% year-on-year in the second quarter to about 6% in the final quarter of 2010 (Chart 2). Clearly, higher rates are hurting corporate margins, and with the
Table 1Interest Rate and Exchange Rate Outlookend of period 11Q1A 11Q2F 11Q3F 11Q4F 12Q1F 12Q2F 12Q3F 12Q4F 13Q1F 13Q2F 13Q3F 13Q4F
Repo rate 6.75 7.25 7.75 8.00 8.25 8.50 8.75 9.00 9.00 9.00 9.00 9.00
Rupee/US$ 44.6 44.7 44.8 45.0 44.6 44.2 44.0 43.9 44.3 44.7 45.0 45.5

CIBC World Markets InC. Economic Insights - June 1, 2011
10
Chart �India Lagging China on Infrastructure
Source: IMF, World Bank, CIBC
Chart 2Investment Already Softening
Source: Haver Analytics, CIBC
-5
0
5
10
15
20
25
30
08Q4 09Q2 09Q4 10Q2 10Q4
Real Gross Fixed Capital Formation (y/y % chg.)
RBI attempting to stay ahead of the curve, that will make the investment environment even weaker. Higher interest rates are also pushing up the savings rate. That trend will probably continue in the coming quarters, taking some steam out of consumption and holding GDP growth below 8% this year.
And high inflation is hurting not just the domestic economy. While India’s currency, the rupee, remains weaker in nominal terms compared to before the global recession hit, the currency is now much stronger in real terms (Chart 3, left). High inflation in India relative to trade partners has caused the real rupee to appreciate, making Indian goods and services less competitive in global markets. That, coupled with rising domestic demand for imports, has caused the current account deficit to widen in recent years (Chart 3, right). More troubling is that the financing of the external deficit has come mostly via volatile portfolio flows. In fact, were it not for huge portfolio investment inflows into the IPO market in 2010, the rupee could have weakened significantly last year, in line with the steady decline in net FDI inflows.
The large external imbalance remains the rupee’s Achilles heel and that’s why, despite India having favourable interest rate spreads and a buoyant economy, we expect any appreciation to be minimal through 2012. With the US Fed starting to hike rates in a couple of years and India’s repo rate stabilizing near pre-recession levels then, expect the narrowing spread to take some steam out of the rupee/US$ exchange rate come 2013 (Table 1).
Chart �Real Rupee Has Appreciated (L) Leaving a Larger Dent in India's External Balance (R)
Source: IMF, Reserve Bank of India, CIBC
90
100
110
120
Apr0
8
Nov0
8
Jun0
9
Jan1
0
Aug1
0
Mar11
Rupee index (Index=100, Apr08-Mar09)
Real
Nominal
-4
-3
-2
-1
0
1
2
2000 2005 2010
Current account balance (% of GDP)
The Infrastructure Deficit and Supply Constraints
Another challenge to India’s prosperity is its infrastructure deficit (Chart 4). The lack of a fully-modernized infrastructure system has been limiting productivity growth and clearly contributing to supply constraints, which are in turn feeding inflationary pressures. The still-deepening financial markets and bureaucratic red tape make it difficult for some infrastructure projects to be implemented. The government is attempting to address those issues by targeting wider private sector involvement. For instance, with regards to funding, the government is encouraging bank participation so as to tap retail investors. The authorities are also tackling the thorny issue of land compensation for displaced individuals. How quickly India capitalizes on its massive potential will depend, in large part, on how successful government
10
20
30
40
50
60
1980 1990 2000 2010
Investment (% of GDP)
China
India
40
50
60
70
80
90
100
Roadspaved (% oftotal roads)
Rail lines('000 km)
% of urbanpopulation
withimproved
watersource
India China

CIBC World Markets InC. Economic Insights - June 1, 2011
11
Chart 6Canada-India Trade Has UnderperformedRelative to Distance and GDP
gauge India’s trade potential with the rest of the world, we observe that trade with Canada has underperformed not just relative to potential (i.e. model estimates) but also relative to most of India’s trade partners (Chart 6).
And it’s not as if India is consuming things that Canada doesn’t produce. Machinery and transportation equipment which accounted for a good 10% of India’s imports last year came predominantly from China, Germany and to a lesser extent the US. Gold and related jewellery, which represented another 10% of India’s imports, were shipped primarily from Switzerland. Clearly, years of neglecting the Indian market, have put Canadian exporters at a disadvantage relative to competitors with deeper trade linkages with India.
That said, it’s not too late for Canada to capitalize on India’s economic ascent. There will be growing demand for a whole range of goods and services in which Canada has strength and holds a worldwide reputation, such as telecom and transportation equipment, heavy engineering, resources, education services, agriculture, nuclear power and more. Whether those opportunities translate into actual dollars, however, will depend on the willingness of Canadian corporations to look beyond near-term risks and broaden their search for markets abroad.
Source: CIBC
reforms are in unleashing the wave of infrastructure projects that India so desperately needs.
Government Finances Need Improvement
A third potential threat to India is its government finances. Last year, the budget deficit was over 10% of GDP and the public debt over 70% of GDP (Chart 5). The government is, accordingly, working towards a more sustainable path for the deficit. The thirteenth Finance Commission tabled in parliament last year called for the budget deficit to shrink by 4 percentage points of GDP, and for public debt-to-GDP to drop from 79% to 68% by 2014-15. Those targets seem ambitious given the hardships brought by the recent food price spike, which have increased the demands on the government to spend on food, fuel and fertilizer subsidies. So, for now, fiscal tightening towards the target is an unlikely scenario meaning that the RBI will have to continue shouldering the burden of reining in inflation. But letting monetary policy do all the heavy lifting for too long can be hazardous as India would have learnt from its own experience of the late 1990s when interest rates went up to 12% and growth slowed to 2%.
Opportunities for Canada
As India moves to overcome those challenges, opportunities will abound not just for the local population but also for countries with major trade links with India. Canada, for now, does not fall in that category, accounting for less than 1% of India’s overall exports and imports last year. Distance between the two countries is an obvious impediment to trade, but controlling for that in a gravity model of trade (i.e. one using distance between trade partners and GDP of trade partners) to
Chart 5Room for Improvement on Gov't Finances
Source: IMF, CIBC
1 The Demographic Dividend, Evidence from the Indian States: Aiyar and Mody, 20112 Seizing Opportunities for Canadians, India’s Growth and Canada’s Future Prosperity: The Standing Senate Committee on Foreign Affairs and International Trade, 2011
-15
-10
-5
0
5
10
15
20
25
30
1998 2002 2006 2010
% of GDPGovt. spending
Govt. revenue
Govt. structural balance
0 1 2 3 4 5
SwitzerlandSouthAfrica
USAustralia
KoreaChina
GermanyUK
ItalyFranceJapan
CanadaSpain
Actual trade flows with India divided by Model Est. for 2010
Better than model estimatesWorse

CIBC World Markets InC. Economic Insights - June 1, 2011
12
CANADA
ECONOMIC UPDATE
UNITED STATES
This report is issued and approved for distribution by (a) in Canada, CIBC World Markets Inc., a member of the Investment Industry Regulatory Organization of Canada, the Toronto Stock Exchange, the TSX Venture Exchange and a Member of the Canadian Investor Protection Fund, (b) in the United Kingdom, CIBC World Markets plc, which is regulated by the Financial Services Authority, and (c) in Australia, CIBC Australia Limited, a member of the Australian Stock Exchange and regulated by the ASIC (collectively, “CIBC”) and (d) in the United States either by (i) CIBC World Markets Inc. for distribution only to U.S. Major Institutional Investors (“MII”) (as such term is defined in SEC Rule 15a-6) or (ii) CIBC World Markets Corp., a member of the Financial Industry Regulatory Authority. U.S. MIIs receiving this report from CIBC World Markets Inc. (the Canadian broker-dealer) are required to effect transactions (other than negotiating their terms) in securities discussed in the report through CIBC World Markets Corp. (the U.S. broker-dealer).
This report is provided, for informational purposes only, to institutional investor and retail clients of CIBC World Markets Inc. in Canada, and does not constitute an offer or solicitation to buy or sell any securities discussed herein in any jurisdiction where such offer or solicitation would be prohibited. This document and any of the products and information contained herein are not intended for the use of private investors in the United Kingdom. Such investors will not be able to enter into agreements or purchase products mentioned herein from CIBC World Markets plc. The comments and views expressed in this document are meant for the general interests of wholesale clients of CIBC Australia Limited.
This report does not take into account the investment objectives, financial situation or specific needs of any particular client of CIBC. Before making an investment decision on the basis of any information contained in this report, the recipient should consider whether such information is appropriate given the recipient’s particular investment needs, objectives and financial circumstances. CIBC suggests that, prior to acting on any information contained herein, you contact one of our client advisers in your jurisdiction to discuss your particular circumstances. Since the levels and bases of taxation can change, any reference in this report to the impact of taxation should not be construed as offering tax advice; as with any transaction having potential tax implications, clients should consult with their own tax advisors. Past performance is not a guarantee of future results.
The information and any statistical data contained herein were obtained from sources that we believe to be reliable, but we do not represent that they are accurate or complete, and they should not be relied upon as such. All estimates and opinions expressed herein constitute judgments as of the date of this report and are subject to change without notice.
This report may provide addresses of, or contain hyperlinks to, Internet web sites. CIBC has not reviewed the linked Internet web site of any third party and takes no responsibility for the contents thereof. Each such address or hyperlink is provided solely for the recipient’s convenience and information, and the content of linked third-party web sites is not in any way incorporated into this document. Recipients who choose to access such third-party web sites or follow such hyperlinks do so at their own risk.
© 2011 CIBC World Markets Inc. All rights reserved. Unauthorized use, distribution, duplication or disclosure without the prior written permission of CIBC World Markets Inc. is prohibited by law and may result in prosecution.
A weak start to Q2, courtesy of adverse weather and supply-chain problems related to Japan’s March earthquake, had us trim our call for the quarter’s growth rate to 2.4%. Our forecast for 2011 as a whole remains unchanged, however, as we bumped up our Q3 forecast, expecting a rebound as normal production resumes. The slightly hotter-than-expected April CPI data had us raise our projections again for inflation, although we remain convinced, given the persistently high unemployment rate, that the Fed will not be raising interest rates this year and next.
Q1 GDP came in near expectations at 3.9% as a surge in capital spending and inventory rebuilding more than offset soft consumption. Although the savings rate held steady, consumers were hit by eroded real incomes on higher gasoline prices and a drop in volatile government transfers. An end to such transitory factors should see personal consumption rebound, but a stall in the manufacturing sector and softer US activity could keep growth tame at a 1.8% pace in Q2. We still think that 2011 growth could track 2.8%, as temporary curtailments in activity get a boost in the latter half of the year.
CANADA 11Q1A 11Q2F 11Q3F 11Q4F 12Q1F 12Q2F 12Q3F 2010A 2011F 2012F
Real GDP Growth (AR) 3.9 1.8 2.8 1.9 2.3 3.1 4.2 3.2 2.8 2.8
Real Final Domestic Demand (AR) 2.3 2.3 1.8 1.9 2.3 3.0 4.0 4.5 3.0 2.7
All Items CPI Inflation (Y/Y) 2.6 3.3 2.7 2.2 1.6 1.4 1.9 1.8 2.7 1.7
Core CPI Ex Indirect Taxes (Y/Y) 1.3 1.8 2.0 2.1 2.0 2.0 2.1 1.7 1.8 2.0
Unemployment Rate (%) 7.7 7.6 7.5 7.4 7.6 7.5 7.4 8.0 7.6 7.4
U.S. 11Q1A 11Q2F 11Q3F 11Q4F 12Q1F 12Q2F 12Q3F 2010A 2011F 2012F
Real GDP Growth (AR) 1.8 2.4 3.3 1.9 2.1 2.5 2.7 2.9 2.5 2.4
Real Final Sales (AR) 0.6 2.4 3.6 2.3 2.0 2.5 2.7 1.4 2.6 2.5
All Items CPI Inflation (Y/Y) 2.1 3.3 3.7 3.5 2.8 1.8 2.0 1.6 3.2 2.2
Core CPI Inflation (Y/Y) 1.1 1.3 1.4 1.6 1.8 1.7 1.9 1.0 1.3 1.9
Unemployment Rate (%) 8.9 9.0 9.1 9.2 9.2 9.0 8.8 9.6 9.0 8.9