
By Alfredo C. Gurmendi filecoal, columbium (niobium), chromite, gemstones, gold, iron ore, kaolin,...
22
THE MINERAL INDUSTRY OF BRAZIL—2001 4.1 1 Revised on March 16, 2004. 2 Where necessary, values have been converted from the Brazilian real (R$) to U.S. dollars at the rate of R$2.358=US$1.00. 3 References that include a section twist (§) are found in the Internet References Cited section. THE MINERAL INDUSTRY OF BRAZIL 1 By Alfredo C. Gurmendi In 2001, the Economic Commission for Latin America and the Caribbean reported that Brazil received $1.1 billion of FDI in the finance sector for the privatization of the Banco do Estado de So Paulo. The International Monetary Fund endorsed Brazil’s move to a system of inflation targets and currency devaluation to guide its monetary policy into 2002. This action indicated that the country could reduce its account deficit of $35.2 billion down to an equivalent of 5.8% of the GDP thus helping restore confidence in the Government’s economic management and creating conditions for lower interest rates and economic recovery (Banco Central do Brazil, 2002a§). The Brazilian strategic plan Plano Real continued to be based on constitutional reviews, direct acquisitions of assets via mergers and joint ventures with the private sector, and macroeconomics to achieve its goals and to encourage new capital flows into the Brazilian economy. Given that the economy was in recovery, however, the currency devaluation and a tough fiscal austerity plan helped restore confidence in the Government’s economic management and create favorable conditions for lower interest rates and Brazil’s economic recovery that began in the second one-half of 2001 and continued into 2002. Brazil turned a fiscal deficit of 3% of the GDP in 1997 to a surplus of 3% in 1999 and 4.6% budget surplus in 2001 (Departamento Nacional de Produço Mineral, 2002a, p. 11; Banco Central do Brasil, 2002a§). In 2001, Brazil’s trade balance was affected by a reduction in demand and depressed prices for mineral exports and higher prices for crude oil imports. The mineral sector had a deficit of $1.4 billion; if petroleum and its derivatives and natural gas were excluded, however, then the surplus would have been $5.3 billion (Departamento Nacional de Produço Mineral, 2002a, p. 11). Brazil produced 70 mineral commodities (45 industrial minerals, 21 metals, and 4 fuel minerals), such as bauxite, coal, columbium (niobium), chromite, gemstones, gold, iron ore, kaolin, manganese, tantalum, and tin from large deposits and exported them to the global marketplace in 2001. In Latin America, particularly within Mercosur, Brazil continued to be the leading producer of aluminum, cement, ferroalloys, gold, iron ore, manganese, steel, and tin. Brazil’s reportedly large mineral reserves and other identified resources helped make it one of the most dynamic markets in the world and constituted one-third of the Latin American economy (Departamento Nacional de Produço Mineral, 2002a, p. 11). The country continued with its petroleum exploration program to expand reserves as well as to reduce dependence on oil imports, which satisfied about 24.2% of its crude oil requirements (Petrobrás, 2002, p. 4). Brazil’s petroleum and mining industries and utilities attracted investors’ interest because of the country’s diversified minerals Brazil was Latin America’s largest economy and the eighth largest worldwide and had a population of more than 174 million. The gross domestic product (GDP) was $611.2 billion 2 , or $1.34 trillion in terms of purchasing power parity in 2001. Brazil’s GDP growth rate was 1.7% compared with 4.5% in 2000. Foreign exchange reserves decreased to about $33 billion from $36.3 billion in 2000 and the peak level of $51.4 billion in 1997. Brazil’s total debt burden amounted to $216.5 billion. The trade balance increased substantially to $2.6 billion surplus compared with $749 million in 2000 and the peak level of $6.6 billion in 1998. Exports were valued at $58.2 billion, and imports, at $55.6 billion. The growth of Brazil’s economy slowed considerably in 2001 because of a slowdown in major markets (Europe, Japan, and the United States) and the increasing of interest rates by the Brazilian Central Bank to fight inflationary restraints. Inflation was 7.7% compared with 6% in 2000. Brazil’s currency (real) devaluation helped moderate the downturn in economic growth in the second half of 2001, which was affected by the terrorist attacks of September 11 and the intensification of the Argentine crisis (Departamento Nacional de Produço Mineral, 2002a, p. 10; Ferraz, 2002, p. 1; Banco Central do Brazil, 2002c§ 3 ; Economic Commission for Latin America and the Caribbean, 2002b§; U.S. Central Intelligence Agency, 2002§; World Bank Group, 2002§). In 2001, foreign direct investment (FDI) inflows to the Latin American and Caribbean region amounted to about $79.7 billion, which was almost 10% lower than that of 2000 ($88.5 billion). Mexico, however, set a record of more than $24.7 billion of FDI in 2001 followed by Brazil with about $22.6 billion. Brazil’s share of the region’s net FDI inflows decreased by 31.1% compared with that of 2000 ($32.8 billion) and was up from the $1.5 billion at the beginning of the past decade (Banco Central do Brazil, 2002b§). Within the Mercado Común del Cono Sur (Mercosur) (Souther Cone Common Market), which included Argentina, Brazil, Paraguay, and Uruguay plus Bolivia and Chile as associated members, Brazil was followed at a considerable distance by Chile ($4.6 billion), Argentina ($3.2 billion), Bolivia ($550 million), Uruguay ($320 million), and Paraguay ($152 million). Brazil was the largest recipient of FDI in the region for the sixth consecutive year largely because of the sale of state-owned assets, primarily in the service sector, telecommunications, energy, and finance, by the Government (Economic Commission for Latin America and the Caribbean, 2002a§).
Transcript of By Alfredo C. Gurmendi filecoal, columbium (niobium), chromite, gemstones, gold, iron ore, kaolin,...
THE MINERAL INDUSTRY OF BRAZIL—2001 4.1
1Revised on March 16, 2004.2Where necessary, values have been converted from the Brazilian real (R$) to
U.S. dollars at the rate of R$2.358=US$1.00.3References that include a section twist (§) are found in the Internet
References Cited section.
THE MINERAL INDUSTRY OF
BRAZIL1By Alfredo C. Gurmendi
In 2001, the Economic Commission for Latin America and the Caribbean reported that Brazil received $1.1 billion of FDI in the finance sector for the privatization of the Banco do Estado de So Paulo. The International Monetary Fund endorsed Brazil’s move to a system of inflation targets and currency devaluation to guide its monetary policy into 2002. This action indicated that the country could reduce its account deficit of $35.2 billion down to an equivalent of 5.8% of the GDP thus helping restore confidence in the Government’s economic management and creating conditions for lower interest rates and economic recovery (Banco Central do Brazil, 2002a§).
The Brazilian strategic plan Plano Real continued to be based on constitutional reviews, direct acquisitions of assets via mergers and joint ventures with the private sector, and macroeconomics to achieve its goals and to encourage new capital flows into the Brazilian economy. Given that the economy was in recovery, however, the currency devaluation and a tough fiscal austerity plan helped restore confidence in the Government’s economic management and create favorable conditions for lower interest rates and Brazil’s economic recovery that began in the second one-half of 2001 and continued into 2002. Brazil turned a fiscal deficit of 3% of the GDP in 1997 to a surplus of 3% in 1999 and 4.6% budget surplus in 2001 (Departamento Nacional de Produço Mineral, 2002a, p. 11; Banco Central do Brasil, 2002a§).
In 2001, Brazil’s trade balance was affected by a reduction in demand and depressed prices for mineral exports and higher prices for crude oil imports. The mineral sector had a deficit of $1.4 billion; if petroleum and its derivatives and natural gas were excluded, however, then the surplus would have been $5.3 billion (Departamento Nacional de Produço Mineral, 2002a, p. 11).
Brazil produced 70 mineral commodities (45 industrial minerals, 21 metals, and 4 fuel minerals), such as bauxite, coal, columbium (niobium), chromite, gemstones, gold, iron ore, kaolin, manganese, tantalum, and tin from large deposits and exported them to the global marketplace in 2001. In Latin America, particularly within Mercosur, Brazil continued to be the leading producer of aluminum, cement, ferroalloys, gold, iron ore, manganese, steel, and tin. Brazil’s reportedly large mineral reserves and other identified resources helped make it one of the most dynamic markets in the world and constituted one-third of the Latin American economy (Departamento Nacional de Produço Mineral, 2002a, p. 11). The country continued with its petroleum exploration program to expand reserves as well as to reduce dependence on oil imports, which satisfied about 24.2% of its crude oil requirements (Petrobrás, 2002, p. 4).
Brazil’s petroleum and mining industries and utilities attracted investors’ interest because of the country’s diversified minerals
Brazil was Latin America’s largest economy and the eighth largest worldwide and had a population of more than 174 million. The gross domestic product (GDP) was $611.2 billion2, or $1.34 trillion in terms of purchasing power parity in 2001. Brazil’s GDP growth rate was 1.7% compared with 4.5% in 2000. Foreign exchange reserves decreased to about $33 billion from $36.3 billion in 2000 and the peak level of $51.4 billion in 1997. Brazil’s total debt burden amounted to $216.5 billion. The trade balance increased substantially to $2.6 billion surplus compared with $749 million in 2000 and the peak level of $6.6 billion in 1998. Exports were valued at $58.2 billion, and imports, at $55.6 billion. The growth of Brazil’s economy slowed considerably in 2001 because of a slowdown in major markets (Europe, Japan, and the United States) and the increasing of interest rates by the Brazilian Central Bank to fight inflationary restraints. Inflation was 7.7% compared with 6% in 2000. Brazil’s currency (real) devaluation helped moderate the downturn in economic growth in the second half of 2001, which was affected by the terrorist attacks of September 11 and the intensification of the Argentine crisis (Departamento Nacional de Produço Mineral, 2002a, p. 10; Ferraz, 2002, p. 1; Banco Central do Brazil, 2002c§3; Economic Commission for Latin America and the Caribbean, 2002b§; U.S. Central Intelligence Agency, 2002§; World Bank Group, 2002§).
In 2001, foreign direct investment (FDI) inflows to the Latin American and Caribbean region amounted to about $79.7 billion, which was almost 10% lower than that of 2000 ($88.5 billion). Mexico, however, set a record of more than $24.7 billion of FDI in 2001 followed by Brazil with about $22.6 billion. Brazil’s share of the region’s net FDI inflows decreased by 31.1% compared with that of 2000 ($32.8 billion) and was up from the $1.5 billion at the beginning of the past decade (Banco Central do Brazil, 2002b§). Within the Mercado Común del Cono Sur (Mercosur) (Souther Cone Common Market), which included Argentina, Brazil, Paraguay, and Uruguay plus Bolivia and Chile as associated members, Brazil was followed at a considerable distance by Chile ($4.6 billion), Argentina ($3.2 billion), Bolivia ($550 million), Uruguay ($320 million), and Paraguay ($152 million). Brazil was the largest recipient of FDI in the region for the sixth consecutive year largely because of the sale of state-owned assets, primarily in the service sector, telecommunications, energy, and finance, by the Government (Economic Commission for Latin America and the Caribbean, 2002a§).

endowment, the Government’s macroeconomic policies, and a skilled labor force. Major international mining, petroleum, and steel companies were notably interested in or very active by acquiring exploration properties, mining prospects, and steel firms. They were particularly interested in oil and gas, iron ore, steel, coal, gold, copper, and diamond, in order of importance.
The megamergers of British Petroleum Ltd. of the United Kingdom and Amoco Corp., Exxon Corporation and Mobil Oil Corp. (ExxonMobil), and Chevron Corp. and Texaco Corp. (ChevronTexaco) of the United States, and others entered in joint-venture oil/gas projects with Petróleo Brasileiro S.A. (Petrobrás). Petrobrás viewed such a trend of mergers as significant to improve and strengthen economies of scale, competitiveness, operational synergy, and regional strategies, which will impact future oil/gas joint ventures between Petrobrás and the private sector. Equally important to Brazil will be the Minas Gerais iron ore joint venture between Companhia Vale do Rio Doce (CVRD) and China’s Shanghai Baosteel Group Corp. that will begin in 2002 and the Sossego copper-gold joint venture between CVRD and Phelps Dodge Corp. of the United States that also will begin in 2002 (Metal Bulletin, 2001; Ferraz, 2002, p. 3). Since 1991, the more than 500 transnational corporations that have established operations in Brazil have brought in $240 billion in registered investment with the Banco Central do Brasil; of that total, $57.1 billion was received by the minerals sector. The Banco Central do Brasil also reported that since 1996, the accumulated net FDI amounted to $136 billion as equity capital, of which $31 billion was used for acquisitions of state-owned assets and $105 billion (excluded privatizations) was for direct acquisitions and joint ventures with the private sector (Banco Central do Brasil, 2002b§).
The list of active international mining and oil companies in Brazil included Repsol-YPF of Argentina; BHP Minerals International Exploration Inc. and Western Mining Corp. Holdings Ltd. of Australia; Barrick Gold Corp., INCO Limited, and TVX Gold Inc. of Canada; Shanghai Baosteel Group Corp. of China; EDP of Portugal; Anglo American plc, Billiton plc, and Rio Tinto plc of the United Kingdom; Iberdrola S.A. of Spain; and Enron Energy Corp., ExxonMobil (Esso Brasileira de Petróleo Ltda.), Newmont Mining Corp., Placer Dome U.S. Inc., Royal Dutch/Shell Group, and ChevronTexaco (ChevronTexaco Brasil S.A.) of the United States (Ferraz, 2002, p. 4).
Government Policies and Programs
The legal framework for the development and use of mineral resources in Brazil was established by the Federal Constitution, which was enacted on October 5, 1988. On August 15, 1995, the Brazilian Congress approved Constitutional Amendments Nos. 6 and 9, which allow the participation of the private sector via joint ventures and/or privatization investment in the sectors of mining, natural gas, and petroleum and in the deregulated sectors of coastal and river shipping, telecommunications, and transportation. The 45-year Government monopolies of the oil and gas industries and fuel price subsidies were ended in 1999, thus allowing Petrobrás to enter into joint ventures with foreign investors. The Agencia Nacional do Petróleo, however, regulates the petroleum industry (Ferraz, 2002, p.
6; Pimentel, 2002a, p. 3-5). In 2001, other significant actions were undertaken by the Brazilian Government. The Brazilian import tax for minerals, in general, was reduced; the rates vary from 3% to 9%—ores and concentrates were 5%, and other products, 7%. The export tax does not apply to exported mineral products. The tax on industrialized products does not apply to mining activities, although there is a “value-added tax.” In most cases, the basis for assessment of corporate income taxes is the net profit for the fiscal year; the tax rate ranges between 10% and 15% and is levied on gross profit. Profits can be expatriated. Equity ownership, which is allowed via privatization or by direct acquisition, can be as high as 100% (Departamento Nacional de Produço Mineral, 2002d, p. 5-8; Pimentel, 2002b, p. 10-15). In 2001, the Concessions Law created additional opportunities for the private sector in public utilities previously reserved for the Government.
All the above actions, which were undertaken by the Government to open the Brazilian economy to international competition, have continued to create an environment that attracts domestic and foreign investments equally. The establishment of joint ventures in the sectors of construction and management of railroads, ports, telecommunications, and hydroelectric powerplants, metals, and oil and gas has become a common practice in Brazil.
The Brazilian Constitution and the Mining Code, law No. 9314 of January 1997, provide greater flexibility for investment in the Brazilian mining sector. Article 7 of this law stipulates that the exploitation of mineral deposits will depend upon an exploration authorization permit granted by the General Director of the Departamento Nacional de Produço Mineral (DNPM) and a Development Concession issued by the Minister of Mines and Energy. Licensing is a restricted system applicable exclusively to the exploitation of industrial minerals. The DNPM is responsible for enforcing this mining code and its complementary legal provisions. In 2001, the DNPM issued 32,000 exploration licenses compared with 21,200 in 2000 and reported an investment of $180 million in mineral exploration compared with $104 million in 2000. Companhia de Pesquisa de Recursos Minerais (CPRM) (the Brazilian Geological Survey) is developing programs for basic geologic mapping, metallogenetic and hydrogeologic mapping, and prospecting in areas of potential development, in addition to creating and maintaining geologic and economic data bases, particularly for coal, copper, diamond, gold, kaolin, nickel, peat, and zinc, to assist potential investors in the minerals sector. In 2000, a reorganization was proposed whereby the DNPM will be called the National Agency of Mining, and the CPRM will be called the National Geological Service (Departamento Nacional de Produço Mineral, 2002b, p. 25, 30-31; Ferraz, 2002, p. 1-2).
Environmental Issues
The Brazilian Environmental Policy (BEP) is executed at three levels—Federal, State, and municipal. The coordination and formulation of the BEP is the responsibility of the Ministério de Meio Ambiente (MMA). Linked to the MMA is the Conseho Nacional de Meio Ambiente, which grants the environmental licenses that are required for all mining activities in Brazil. Law No. 88351 of 1986 established

the National System for the Environment, which comprises representatives of the Federal, State, and local governments and private foundations involved in environmental protection and improvement. Article 225 of the 1988 Brazilian Constitution stipulates that mining operators must reclaim areas that they have environmentally degraded. In Brazil, the environmental legislation applied to mining is basically consolidated in the following environmental requirements: environmental impact study (EIA), environmental licensing (LA), and plan for recovery of degraded areas (PRAD). An EIA applies to mining projects of any mineral substance; an LA is mandatory for installing, expanding, and operating any mining activity under the systems of mining concession or licensing; and a PRAD requires suitable technical solutions to rehabilitate the soil and other aspects of the environment that might be degraded by mining operations (Departamento Nacional de Produço Mineral, 2002b, p. 35-38). The Ministério de Minas e Energia enforces the 1989 decree, which prohibits the use of mercury and cyanide in the mining of gold unless approved by Brazilian local environmental agencies, and offers technical assistance on producing gold without affecting the environment to small-scale independent miners (garimpeiros), in particular. Environmental impacts are expected to be lessened in the future.
Resolution 010 of December 6, 1990, requires that all mining operations obtain LAs prior to the granting of mineral rights by the DNPM. As environmental problems have increased, antipollution measures have been enacted to eliminate the sources of pollutants and to mitigate their effects on the environment.
Production
In 2001, the total value of minerals produced (gas and crude oil included) was about $9.4 billion, or about 1.5% of the GDP. The mineral-based industries amounted to $51 billion, or about 8.3% of the GDP. Crude oil and natural gas amounted to almost $6 billion. The mineral sector grew by 3.4% in 2001compared with 11.1% in 2000. The electricity rationing affected consumption and investment flows and the minerals sector performance decreased during the second one-half of 2001. Depletion of shallow gold and tin deposits and environmental constraints on garimpeiros affected their outputs of gold and tin (Departamento Nacional de Produço Mineral, 2002c, p. 21; Banco Central do Brasil, 2002c§).
The major integrated steelworks were the structure and rail producer Aço Minas Gerais, S.A., Latin America’s largest integrated steelmaker Companhia Siderúrgica Nacional (CSN), the carbon steel sheet and plate producer Companhia Siderúrgica Paulista, the slab producer Companhia Siderúrgica de Tubaro, and Brazil’s second largest steel mill Usinas Siderúrgicas de Minas Gerais, S.A. These companies produced about 17.1 million metric tons (Mt), or about 64% of the total Brazilian steel production of 26.7 Mt (Departamento Nacional de Produço Mineral, 2002c, p. 64). Brazil remained as the largest iron ore producer in the world with flat ouput in 2001 at 208.7 Mt. CVRD produced about 57% of the iron ore (Mining Journal, 2002c). Mineraço Rio do Norte S.A. (MRN), the majority of which was privately owned, was the world’s third largest bauxite producer and exporter; it produced about 79%
of Brazil’s total bauxite production, which amounted to about 13.9 Mt. The four major aluminum smelters, Albras-Alumínio Brasileiro S.A., Alcoa Alumínio S.A., Companhia Brasileira de Alumínio, and Billiton Metais S.A., produced 87.9% of the primary aluminum production of 1.1 Mt (table 1).
Trade
Brazil was the largest open market and the economic center of Mercosur. In 2001, the member countries of Mercosur had almost 247 million people, 27.1% of the Western Hemisphere’s population, and a combined GDP of almost $2.0 trillion, which represented about 77% of South America’s total GDP (Cowley, 2001). Brazil accounted for about 71% of Mercosur’s population and almost 67% of its GDP (U.S. Central Intelligence Agency, 2002§). Most multinational companies considered this growing trade bloc, which followed the North America Free Trade Agreement (NAFTA) and the European Union, to be extremely important because of its size and the amount of trade that takes place in the region. NAFTA has had an impact on Latin America and Caribbean Basin trade, which increased to about $109 billion, or about 73% higher than that of 1991 ($63 billion). When Mercosur is fully integrated, unrestricted movement of goods, labor, and services is expected to take place among the four principal members and the two associate members. Mercosur has had an impact on Latin intraregional trade, which increased to about $30 billion in 2001 from $7 billion in 1983. Intra-Mercosur trade amounted to $20 billion, and mineral trade amounted to $6.5 billion (Departamento Nacional de Produço Mineral, 2002a, p. 16-17).
In 2001, Brazil sold 17% of its exports to the other Mercosur members and 26% to the other countries in Latin America. Total minerals trade between the major players of Mercosur, Brazil ($1.7 billion) and Argentina ($800 million), amounted to $2.5 billion. Brazilian mineral imports were valued at $12.7 billion, or 4.5% lower than those of 2000 ($13.3 billion), and its total mineral exports were $12.1 billion, or about the same level as those of 2000 ($12.0 billion). The values of the principal exports were $2.9 billion for iron ore; $2.3 billion, steel products; and $1.2 billion, aluminum. In addition to petroleum and derivatives ($4.3 billion), other major mineral imports ($1.9 billion) were, in order of importance, copper, phosphate rock, potash, sulfur, and zinc (Departamento Nacional de Produço Mineral, 2002c, p. 16; Ferraz, 2002, p. 6).
Brazil-U.S. trade relations during the past decade grew at an unprecedented rate. The U.S. imports were primarily manufactured and semimanufactured Brazilian goods of high aggregate value, such as steel and chemical products, as well as other commodity exports. Brazilian exports to Europe and Japan consisted mostly of raw materials; in order of importance, these were iron ore, manganese, marble, and granite, and agricultural commodities.
In 2001, total trade between Brazil and the United States was $4.1 billion. Exports increased by 27.5% to $3.1 billion, and imports decreased by 3.0% to $1.0 billion. Brazil’s mineral trade balance with the United States increased to a surplus of $2 billion from a surplus of $1.2 billion in 1999 (Departamento Nacional de Produço Mineral, 2002a, p. 16).

4.4 U.S. GEOLOGICAL SURVEY MINERALS YEARBOOK—2001 THE MINERAL INDUSTRY OF BRAZIL—2001 4.5
Structure of the Mineral Industry
The mineral industry of Brazil was large by world standards. The major portion of the industry was partially or wholly owned by Brazilian corporations, private Brazilian investors, and/or foreign companies. The exceptions were the natural gas and petroleum industries, which were 100% Government owned through Petrobrás and comprised five subsidiaries—Petrobrás Distribuidora S.A., which was the petroleum products distribution company; Petrobrás Internacional, S.A., which was the foreign operating company; Petrobrás Transporte S.A., which was the company that constructed and operated pipelines, terminals, vessels, and facilities needed for the transportation and storage of oil and derivatives, natural gas, and bulk products; Petrobrás Química, S.A., which was the integrated refining-petrochemical operations company; and Petrobrás Gás S.A., which was the company that produced, traded, and distributed natural and liquefied natural gas, and fertilizers company (Petrobrás, 2002, p. 10-29).
The structure of the Brazilian mineral industry continued to change to a privately owned/Government-regulated regime from one that was Government owned/Government operated. Between 1991 and 2001, the Government privatized the telecommunications and electrical energy sectors, the steel industry, and CVRD. In addition, 40 cement companies were operating 64 cement plants and 7 grinding plants with a clinker capacity of 45 Mt, and 30 iron ore mining companies were operating 80 mines and 43 processing plants (Departamento Nacional de Produço Mineral, 2001, p. 159; 2002c, p. 45-46).
In 2001, Brazil’s total labor force was nearly 80 million. Of this total, services represented 53%; industry, 24%; and agriculture, 23%. The unemployment rate was 6.4% (U.S. Central Intelligence Agency, 2002§). The minerals sector employed about 5% (960,000) of the industry total (19.2 million); this did not include the nearly 650,000 garimpeiros active in Brazil (Vale, 2002, p. 1). Employment in the mining sector continued its downward trend because Brazil’s economy was affected by its recent slow economic recovery, electricity crisis, and the increases of efficiency and productivity in the private sector that resulted from the forming of joint ventures, mergers, and privatizations, particularly in the steel and mining sectors (table 2).
Commodity Review
Metals
Alumina, Aluminum, and Bauxite.—Primary aluminum production amounted to about 1.13 Mt of metal, or 11% lower than that (1.27 Mt) of 2000. Primary aluminum producers were Albras-Alumínio Brasileiro S.A. (29%), Alcoa Alumínio S.A. (23%), Companhia Brasileira de Alumínio (CBA) (19%), Billiton (17%), Alcan Alumínio do Brasil S.A. (8%), and Vale do Sul Alumínio S.A. (Aluvale) (4%) (Departamento Nacional de Produço Mineral, 2002c, p. 25). Bauxite production was 13.9 Mt, which was about the same level as that of the previous year. The MRN joint venture [owned by CVRD (40%), Billiton (14.8%), Alcoa (13.2%), Alcan (12%), CBA (10%), Norsk
Hydro Group (5%), and Reynolds Alumínio do Brasil (5%)] accounted for almost 81% of the total bauxite production (11.2 Mt) for 2001. Alumina production was 3.8 Mt, which was about the same level as that of 2000, of which a consortium led by Alcoa (54%), Billiton (36%), and Alcan (10%) produced 44%; Alumínio do Norte do Brasil S.A., 43%; and CBA, 13%. Exports amounted to 4 Mt of bauxite valued at $110 million, 1.2 Mt of alumina valued at $215 million, and 1.4 Mt of primary aluminum valued at $1.7 billion (Departamento Nacional de Produço Mineral, 2002c, p. 25-26).
MRN planned to open its new mine, which has bauxite reserves of 800 Mt and a capacity of 2 million metric tons per year (Mt/yr), in the Papagalo plateau, Trombetas, Pará. The Papagalo Mine will maintain MRN’s total bauxite ore production capacity at about 12 Mt/yr. CVRD was planning to invest $400 million in the bauxite-alumina-aluminum sector. The Albras facility at Vila do Conde, Pará (CVRD, 51%, and Nippon Amazon Aluminio Co., 49%), produced 369,200 metric tons (t) of primary metal in 2001, and was to be expanded to 400,000 metric tons per year (t/yr) capacity at a cost of about $100 million in the near future. Alcan invested $370 million in expansions of its complex facility at Laminaço de Pindamonhangaba in So Paulo to increase its production capacity to 280,000 t/yr from 120,000 t/yr in 2001.
The Alcoa aluminum smelter owned by Alcoa (53.66%) and Billiton (46.34%) at So Luiz, Maranho, was expanded to 239,000 t/yr from 194,000 t/yr in 2001 at a cost of $550 million. Alcan expanded its aluminum sheet production capacity to 120,000 t/yr from 100,000 t/yr in 2001 as a part of a $380 million investment program and was planning to increase its primary capacity to 150,000 t/yr. Investments in the aluminum sector could reach up to $1.6 billion within the next few years. Latapack-Ball S.A., which produced aluminum cans, invested $5 million to increase its plant capacity in Jacareí, State of So Paulo, to 2 billion aluminum cans from 1.7 billion. Brazil’s goal to recycle 80% of its aluminum cans was not achieved, but it came very close at 77% (Departamento Nacional de Produço Mineral, 2002c, p. 26; Ferraz, 2002, p. 2).
MRN was set up to mine the Oriximina bauxite deposit near the Trombetas River in conjunction with the Papagalo bauxite mine in Pará and will supply the feed to Alcoa’s refinery at So Luís, Maranho. CBA planned to invest $700 million to produce 500,000 t/yr of alumina and to expand its aluminum capacity to 360,000 t/yr from 220,000 t/yr. Alunorte began an expansion program to increase its alumina production capacity by about 40% to 2.3 Mt/yr from 1.6 Mt/yr by 2005 (Departamento Nacional de Produço Mineral, 2002c, p. 26; Ferraz, 2002, p. 2, 6).
Columbium (Niobium) and Tantalum.—Brazil continued to be the world’s most significant producer and main supplier of columbium to the global markets. Brazil produced about 92.4% of the world’s total output, or 31,200 t of pyrochlore (Nb2O5) in concentrates, 18,218 t of columbium in alloys, and 1,274 t of columbium in oxides from two open pits located in Araxá, State of Minas Gerais, and Catalo, State of Goiás. In 2001, Mineraço Catalo de Goiás Ltda. (MCGL) (a joint venture of Bozzano Simonsen S.A. of Brazil, 68.5%, and Anglo American, 31.5%) and Companhia Brasileira de Metalurgia e
4.4 U.S. GEOLOGICAL SURVEY MINERALS YEARBOOK—2001 THE MINERAL INDUSTRY OF BRAZIL—2001 4.5
Mineraço (CBMM) [a joint venture of Grupo Moreira Sales S.A. of Brazil (55%) and Molycorp, Inc., of the United States (45%)] accounted for 61.5% and 38.5%, respectively, of Brazil’s 65,000-t/yr pyrochlore production capacity. The columbium plants of CBMM in Araxá and MCGL in Ouvidor accounted for about 88% of Brazil’s pyrochlore production and supplied about 79% of the world demand for ferrocolumbium. The Araxá, Catalo, and Ouvidor columbium ore deposits contained 90% (5 Mt) of the world’s pyrochlore reserves. Tantalum production totaled 50 t. The Araxá deposit, which was considered to be one of the world’s largest (450 Mt with 2.5% Cb2O2) and most economically viable ore body, produced 50,400 t in 2001. The upward trend in tantalum supply will continue in response to increased world demand (Departamento Nacional de Produço Mineral, 2002c, p. 83-84).
Copper.—Copper content of concentrate production amounted to 32,000 t, which was a very small increase compared with that of 2000. The concentrate was produced by Mineraço Caraíba S/A’s [Grupo PARANAPANEMA (GP)] deposit in Jaguari, State of Bahia, which was Brazil’s only underground copper mine (Departamento Nacional de Produço Mineral, 2002c, p. 41).
In 2001, Caraiba Metais S/A (CMSA) of Camaçari, Bahia, produced 185,345 t of primary copper metal, which was a decrease of 4% compared with that of 2000; this also included 486,700 t of copper concentrates imported from Chile (65%), Peru (14%), and other countries (21%). CMSA, which was the only electrolytic copper producer to meet Brazil’s metal copper demand of 335,200 t/yr, imported 148,000 t of copper cathode, mostly from Chile (85%) and Peru (13%), in 2001 (Departamento Nacional de Produço Mineral, 2002c, p. 41-42).
In 2001, the reserves at Cobre Salobo, which was Brazil’s largest copper project, were estimated to be 1,900 Mt at a grade of 0.65% copper and contained 0.96% copper-equivalent associated with gold, silver, and molybdenum, in order of importance. These reserves could support a 250,000-t/yr production capacity of refined copper with byproducts of gold, silver, and molybdenum, in order of added value. The project, which is in Marabá, Pará, was a joint venture of Anglo American, the Brazilian Banco Nacional de Desenvolvimento Econômico e Social, and CVRD; each member held a one-third interest. The Salobo copper project was going through a reassessment process owing to the depressed prices for copper in 2001 (Departamento Nacional de Produço Mineral, 2002c, p. 42). CMSA’s Camaçari refinery in Bahía State expanded its cathode capacity to produce 220,000 t/yr of refined copper with an investment of $14 million in 2001. A feasibility study on the Chapada copper project (owned by Mineraço Maracá S.A.) in Alto Horizonte, Goiás, estimated that its ore reserves were 434.5 Mt and contained 1.3 Mt of copper and 9.6 t of gold. The Cobre Sossego project, Cristalino, and Corpo Alemo in Carajás, Pará, are being explored by Mineraço Serra do Sossego S.A. (a joint venture between CVRD and Phelps Dodge Corp.); current resources of copper were estimated to be 400 Mt at a grade of 1.14% copper and 0.34 gram per metric ton gold (Departamento Nacional de Produço Mineral, 2002c, p. 42).
Brazil’s refined copper production was used primarily in the automobile and construction industries. Exports amounted to
55,700 t of copper metal valued at $100 million, which went to Chile, 39%; Argentina, 33%; and the United States, 28% (Departamento Nacional de Produço Mineral, 2002c, p. 41-42).
Gold.—Gold production was reported by the DNPM to be 50.5 t, which represented 42 t from mining companies and 8.5 t from garimpeiros; this output was 8 t lower than that of 1997, which had the highest levels of output during the past 4 years (table 1). Gold production from the garimpeiros and the private sector decreased because of higher production costs, depletion of shallower deposits, lower prices in the international market, and much higher environmental standards. CVRD, which was the largest gold producer, reported 18 t; AngloGold Ltd. of South Africa, which was the second largest gold producer, reported 13 t, of which Mineraço Morro Velho S.A. (owned by AngloGold) produced 7 t and Mineraço Serra Grande S.A. (owned by AngloGold), 6 t. Rio Paracatu Mineraço S.A. (owned by Rio Tinto, 51%, and Autram S/A, 49%) continued to be the third largest gold producer with 7 t. So Bento Mineraço S.A. (owned by Eldorado Gold Corp.) was the fourth largest producer with an ouput of 4 t. Refined gold from the So Bento Mine was extracted by a combination of pressure oxidation and bioleaching (biox process) developed by Gold Fields Ltd. and Mintek Ltd. of South Africa. Mineraço Maracá S.A.’s So Vicente Mine in Mato Grosso produced 1.5 t of gold. Production at the So Vicente Mine will be expanded to about 10 t of gold during 2003 and 2004 (Departamento Nacional de Produço Mineral, 2002c, p. 55-56).
Brazilian gold production could increase significantly in the foreseeable future because of the growth of Brazilian copper production and of increased interest by domestic and foreign investors in largely unexplored areas in spite of the depressed gold market prices in 2001. More than 2,000 gold occurrences, which are mostly Precambrian vein deposits and alluvial placers, were known (Departamento Nacional de Produço Mineral, 2001, p. 192; Ferraz, 2002, p. 4).
AngloGold was planning to spend $50 million to implement the Amapari gold project in the State of Amapá, which will begin operating next year, and $6 million to explore for gold near to the Pedra Branca do Amapari in the Amazon region (Departamento Nacional de Produço Mineral, 2002c, p. 56).
Iron and Steel.—Ferroalloys.—Ferroalloy production decreased to 734,000 t in 2001 from 884,000 t in 2000; this significant decrease of almost 17% in ferroalloy output was the result of the country’s worst drought in decades that affected the hydroelectric power supply system. For the year, steel production amounted to 26.7 Mt, which represented a decrease of 2.2% compared with 2000. Brazil was the third largest ferroalloy producer in the world (Departamento Nacional de Produço Mineral, 2002c, p. 62). Apparent domestic consumption was about 740,000 t. Brazil’s Prometal Produtos Metalúrgicos S.A. took Norway’s Elkem A/S, which was one of the world’s largest manganese alloy producers, as a partner to produce a projected 500,000 t of ferromanganese by 2004; the project, in which Elkem will hold a 40% share, was in Marabá, Pará. The manganese will come from the nearby Prometal Mine, and the iron ore will come from the Carajás district. Nova Era Silicon S.A. [a joint venture among CVRD (49%),
4.6 U.S. GEOLOGICAL SURVEY MINERALS YEARBOOK—2001 THE MINERAL INDUSTRY OF BRAZIL—2001 4.7
Mitsubishi Corp. (25.5%), and Kawasaki Steel Corp. (25.5%)] was building a silicon ferroalloy plant in Nova Era, Minas Gerais, with an installed capacity of 48,000 t/yr. About two-thirds of its output was exported mainly to Japan, during 2000 to 2001 and will continue between 2002 and 2010 (Departamento Nacional de Produço Mineral, 2002c, p. 62).
Iron Ore.—Brazil produced 208.7 Mt of beneficiated iron ore compared with 208.8 Mt in 2000. About 96% of that production was from the major iron ore companies—CVRD; Mineraçes Brasileiras Reunidas S/A (MBR) (equally owned by CVRD and Mitsui e Co. Ltd. of Japan); Ferteco Mineraço S.A., S.A. Mineraço da Trindade (SAMITRI), Samarco Mineraço S.A., CSN, SOCOIMEX S.A., and Itaminas Comércio de Minérios S.A. In 2001, Brazil exported 155.7 Mt of iron ore and pellets valued at $2.9 billion (Departamento Nacional de Produço Mineral, 2002c, p. 61-62).
The total iron ore exports were 2.7% lower than those of 2000 and were shipped to 40 countries worldwide. Total export revenues decreased by almost 5% from $3.05 billion in 2000. The major importers of Brazilian iron ore were Japan (18%), Germany (14%), China (9%), the Republic of Korea (7.6%), Italy (6%), the United States (5.2%), Belgium (4.8%), France (4.1%), Spain (3.8%), and Argentina (3.3%). The customized commercial products (varied chemical characteristics) sold were sinter feed and pellet feed (70.3%), pellets (21.4%), and lump ore (8.3%) (Departamento Nacional de Produço Mineral, 2002c, p. 62).
CVRD and Pohang Iron and Steel Co. of the Republic of Korea invested $220 million to produce 4 Mt/yr of pellets. The facility is in the port of Tubaro, Espírito Santo. CVRD was planning a new $400 million pelletizing plant with railroad and port facilities in So Luiz, Maranho. MBR opened three new mines—Capo Xavier, Capito do Mato, and Tamandúa—in Minas Gerais to increase capacity to 32 Mt/yr in 2004 and to offset the iron ore depletion at the Aguas Claras and the Matuca Mines. Mineraço Corumbaense S.A. (a subsidiary of Rio Tinto) was planning a $200 million plant at Corumba in the State of Matto Grosso to produce 1 Mt/yr of hot-briquetted iron to supply steel plants in Argentina. This facility will use natural gas from the 3,150-kilometer (km) pipeline between Bolivia and Brazil that connects the Santa Cruz de la Sierra, Bolivia, to Campinas, State of So Paulo (Departamento Nacional de Produço Mineral, 2002c, p. 62).
During 2000 to 2001, CVRD acquired the following Brazilian enterprises: SOCOIMEX (100%), which had the capacity to produce 7 Mt/yr of iron ore, for $48 million; Gulf Industrial Company (50%), which was the owner of a pellet plant in Bahrain with a 4-Mt/yr capacity, $92 million; and SAMITRI (51%), $711 million. Caemi Mineraço e Metalurgia S.A. controlled 85% of MBR, 10% was held by a consortium of Japanese steel producers, and 5%, by CVRD directly, which was acquired from Bethlehem Steel in late 2001. CVRD was planning to invest about $6 billion to focus in the mining sector by 2007 (Ferraz, 2002, p. 4-5; Mining Journal, 2002b, c).
Pig Iron.—Brazil produced 27.8 Mt of pig iron, which was about the same level as that of 2000. The 2.5 Mt of exports, which was valued at $290 million, was approximately one-third of the pig iron traded in the world (Departamento Nacional de Produço Mineral, 2002c, p. 62).
Steel.—Brazil’s 2001 steel production totaled 26.7 Mt, which was a 2.1% decrease from that of 2000; this placed the country fifth in the world (Fenton, 2002). The major recipients of Brazil’s exports were Asia (5 Mt), Latin America (2 Mt), and the United States (1.4 Mt) (Instituto Brasileiro de Siderurgia, 2001, p. 32). The Instituto Brasileiro de Siderurgia (IBS) stressed that the Brazilian steel industry needed to become more efficient because privatization has fundamentally improved efficiency and reduced employment levels of the Brazilian steel industry. The IBS believes that vertical integration was evident as customers and suppliers of the steel companies participated in the auctions. The Government’s privatization program identified the Brazilian steel industry as one of the first sectors for auction via the stock exchanges of Rio de Janeiro and So Paulo. The state-owned steel companies were largely privatized between 1991 and 1993 (Ferraz, 2002, p. 6).
Manganese.—In 2001, Brazil produced 2.2 Mt of manganese ore, which was about the same level as that of 2000. CVRD’s high-grade manganese mine Igarapé Azul in the Carajás Complex accounted for 70% of metallurgical manganese production, which was about the same level (1.4 Mt) as that of 2000. Construtora Polares Ltda., a medium producer, and small producers (in order of importance, in the States of Minas Gerais, Goiás, and Bahia) produced 177,000 t of manganese ore, which was 0.6% higher than that of 2000. Exports of manganese ore accounted for 1.2 Mt valued at $140 million; this export increase of almost 96% was due to a higher demand for steel. Manganese ferroalloys exports also increased by 62.7%, which amounted to 136,000 t valued at $60 million (Departamento Nacional de Produço Mineral, 2002c, p. 73-74; Ferraz, 2002, p. 6).
Nickel.—Brazil produced about 2.8 Mt of nickel ore with a nickel content of 45,300 t, which was about the same level as that of 2000. Mineraço Serra da Fortaleza in Fortaleza de Minas, Minas Gerais (owned by Rio Tinto), produced 8,500 t of nickel contained in matte, which was 8% lower than that of the previous year; Companhia Niquel Tocantins of Grupo Votarantin (GV) in Niquelândia, Goiás, produced 17,200 t of nickel contained in carbonates obtained by ammoniacal leaching, which is a hydrometallurgical process; this was about the same level as that of 2000. Also in the same district, CODEMIN S.A. of Anglo American produced 6,300 t of nickel contained in ferronickel alloy, which was 2.4% lower than that of 2000 (Departamento Nacional de Produço Mineral, 2002c, p. 81-82; Ferraz, 2002, p. 4).
Owing to the increase in world demand for stainless steel and better nickel prices, investments of $1.4 billion in the Brazilian nickel industry were planned to increase the production capacity to 107,000 t/yr from 34,000 t/yr starting in 2003. CVRD intended to invest $600 million to produce 30,000 t/yr nickel from its Vermehlo project in Carajás, Pará, which contains reserves of 100 Mt at a grade of 1.5% nickel; Anglo American will develop the Barro Alto nickel project in Goiás, by investing $750 million to produce 40,000 t/yr of nickel from a deposit with 117 Mt at a grade of 1.5% nickel; Companhia Niquel Tocantins will increase production capacity to 20,000 t/yr from 17,000 t/yr at a cost of $50 million in Niquelândia, Goiás;
4.6 U.S. GEOLOGICAL SURVEY MINERALS YEARBOOK—2001 THE MINERAL INDUSTRY OF BRAZIL—2001 4.7
and Falconbridge Limited of Canada, which was world’s third largest producer of refined nickel, entered into exploration negotiations with the Brazilian Government for sulfide and lateritic nickel in the country in 2000. Thus far, Falcombridge had invested $500,000 for preliminary research and map collection with CPRM and DNPM (Departamento Nacional de Produço Mineral, 2002d, p. 81-82; Ferraz, 2002, p. 4).
Tin.—Brazil was the world’s fourth largest tin producer after China, Indonesia, and Peru (Carlin, 2002). Tin production was 14,200 t of tin contained in concentrate and 13,800 t of metal; this was an increase of about 3.1% of tin concentrate; the metal content was about the same level as that of 2000. During the past 5 years, production cuts were made at the Pitinga Mine in the State of Amazonas, which was operated by Marmoré S.A. (GP), and at the garimpeiros’ Bom Futuro operations in the State of Rondônia. Marmoré’s mine produced 11,750 t compared with 11,200 t in 2000; byproducts were, in order of importance, columbium (niobium), tantalum, zirconium, hafnium, thorium, and cryolite. Marmoré was planning to develop its Rocha Sa project to increase total tin output to 14,300 t/yr by 2004 (Mining Journal, 2002d). Exports increased to 7,860 t valued at $36.1 million from 7,161 t valued at $35.3 million in 2000. During the past 5 years, the highest exports were registered in 1997 (11,957 t valued at $62.5 million). These exports were far below the quota of 20,185 t/yr assigned to Brazil by the Association of Tin Producing Countries. Shipments were made to Argentina (55%); Belgium, Spain, and others (32%); and the United States (13%). Amazonas (72%) and Rondônia (25%) continued to be the major producers in the country (Departamento Nacional de Produço Mineral, 2002c, p. 83-84; Ferraz, 2002, p. 4-5).
Zinc.—Brazil produced 100,300 t of zinc in concentrates, which was about the same level as that of 2000. GV’s Companhia Mineira de Metais S.A. (CMM), which was the only producer of zinc ore in Brazil, produced 27,800 t of zinc sulfide concentrates in Paracatu, which was about 1% higher than that of 2000, and 72,480 t of zinc silicate in Vazante, which was about the same level as that of 2000 (Departamento Nacional de Produço Mineral, 2002c, p. 119-120). The concentrates were processed in CMM’s plant in Trs Marias and GP’s Juiz de Fora Complex in Minas Gerais. These zinc refineries produced 192,000 t of primary metal, which was about the same level as that of 2000. CMM produced 111,360 t (58% of the total), which was an increase of 1.2% compared with that of 2000, and GP’s Companhia Paraibuna de Metais S.A. produced 81,100 t, which was an increase of 4.5% compared with that of 2000 (Ferraz, 2002, p. 5).
To meet Brazil’s demand for zinc, which was about 190,000 t/yr of metal, the country imported 187,000 t of zinc concentrates (valued at $64 million), which was 13.5% lower than that of 2000 (216,287 t valued at $72.9 million), and 26,575 t of metal, which was 23.6% higher than that of 2000. Peru supplied 95% of the concentrates and 13.5% of the metal; additional needed zinc metal was supplied by Argentina (72.2%) and the United States (3.6%) (Departamento Nacional de Produço Mineral, 2002c, p. 119-120; Ferraz, 2002, p. 5).
To identify additional zinc reserves in Paracatu and to expand the Trs Marias zinc refinery to 165,000 t/yr from 110,000 t/yr
by early 2003, CMM was planning to invest $8 million and $160 million, respectively (Departamento Nacional de Produço Mineral, 2002c, p. 120).
Industrial Minerals
Asbestos.—Brazil’s significant asbestos deposits were in Minaçu, Goiás; Goiás was the only producing State in the country. Sociedade Anônima Mineraço de Amianto produced 209,300 t of asbestos fiber, which was about the same level as that of 2000. Almost 80% of Brazil’s asbestos production was consumed in the manufacture of specialized cement products, such as ceiling tiles, protective screens, water and sewer pipes, water tanks, and molded electrical insulators. Other uses were in thermal insulators, paper and cardboard, slabs, decorations, insecticide, asphalt for highways and airport runways, and the automobile industry (Departamento Nacional de Produço Mineral, 2002c, p. 43-44; Ferraz, 2002, p. 5).
Brazil exported about 34.7% of its production, mainly to India, 37%; Thailand, 11%; Japan, 10%; Mexico, 9%; and Indonesia, 6%; these exports were 28% higher than those of 2000. The State of So Paulo was Brazil’s largest consumer followed by Paraná and Rio Grande do Sul. Asbestos mining and consumption are highly regulated in most industrialized nations, forcing them to reduce production and consumption. Industry experts expected asbestos use in the industrial nations to continue to decline. In contrast, the world’s developing economies were expected to increase their collective asbestos consumption by large margins. Brazilian asbestos reserves (16 Mt) were considered to be adequate to meet demand in the short to medium term; the average grade of ore from the Cana Brava Mine in Minaçu was 5.235%, and its reserves (fiber content only) were 3 Mt, which, at a production rate of about 200,000 t/yr, represented a 15-year mine life (Departamento Nacional de Produço Mineral, 2002c, p. 43-44).
Cement.—The country produced 39.5 Mt of cement, which was almost 1% higher than that of 2000. Among the 21 State producers, Minas Gerais was the most important with 22.8% of the total followed by So Paulo (19.7%), Paraná (9.7%), Rio de Janeiro (7.4%), Sergipe (4.8%), Rio Grande do Sul (4.5%), and others (31.1%). The main producers were GV’s Companhia Cimento Portland Itau (21.5%) and Companhia Cimento Portland Rio Branco (20.3%), Grupo Swiss Holderbank’s Holder Cimento S.A. (9%), Grupo Lafarge’s Companhia Cimento Portland Paraiso (8.3%), Camargo Correia Cimentos S.A. (8.1%), and others (32.8%). Most of the exported cement (185,800 t) went to Argentina (43.3%), Paraguay (40.2 %), Bolivia (6%), Peru (2.4%), and Colombia (1.3%). Brazil imported 157,300 t of cement mainly from Mexico (43.9%), Colombia (21%), France (15.3%), and Belgium (10.4%). Camargo Correia Cimentos S.A. was investing $200 million to build a new 1.6-Mt/yr cement plant in Ijaci, Minas Gerais, that will began operations in early 2003. Grupo Cimentos Portland S/A (CIMPOR) will invest $180 million to build two cement plants in the State of Paraíba. CIMPOR will produce 1.7 Mt/yr of cement in 2003 (Departamento Nacional de Produço Mineral, 2002c, p. 33-34).

4.8 U.S. GEOLOGICAL SURVEY MINERALS YEARBOOK—2001 THE MINERAL INDUSTRY OF BRAZIL—2001 4.9
Clays.—Brazil had 4,000 Mt of kaolin reserves, or about 28.2% of the world’s total. Production of beneficiated kaolin was about 1.7 Mt, which was about the same level as that of 2000. The beneficiated kaolin was either coating or filler kaolin. In 2001, Caulim da Amazônia S.A. (CADAM) of Pará accounted for 43.5% (756,000 t) of the country’s total output, the State of Pará contributed with 704,500 t of beneficiated kaolin via Pará Pigmentos S.A. (PPSA) and Ymerys Rio Campin Caulim S.A. (RCCSA), and the remainder (274,500 t) was produced by small producers in the States of Minas Gerais, Rio Grande do Sul, and So Paulo. Brazilian kaolin exports were 20% higher than those of 2000, or about 1.4 Mt valued at $160 million. Shipments were made to Belgium (40%), Japan (18%), Italy (16%), the Netherlands (10%), the United States (9%), and other countries (7%). Depending on market conditions, RCCSA was planning to expand its capacity to 600,000 t/yr by 2002, PPSA was considering expansions that would increase its capacity to 550,000 t/yr by 2002, and CADAM was expected to increase production of coating kaolin to 1 Mt in 2002. In Brazil, kaolin consumption decreased by about 1.5% to 339,365 t from 344,533 t in 2000. Kaolin was used mainly in the ceramics and paper industries and, to a lesser degree, in the manufacture of rubber, plastics, pesticides, animal feed, food supplements and pharmaceuticals, fertilizers, and paint, as well as many other applications (Departamento Nacional de Produço Mineral, 2002c, p. 63-64).
Fluorspar.—Production of beneficiated fluorspar totaled 43,000 t, which was about the same level as that of 2000 (42,962 t). The beneficiated fluorspar was either acid or metallurgical grade. Crude-ore [run-of-mine (ROM)] production was 131,000 t, which remained at about the same level as that of 2000 (130,976 t). The decline of ROM production during the past 3 years was due to the shutdown of Mineraço Nossa Senhora do Carmo Ltda.’s (MNSCL) Fumaça and Pedras Grandes fluorspar mines. ROM production, by mine, in Santa Catarina State was at Morro de Fumaça (34.7%), Rio Fortuna (26.3%), and Santa Rosa de Lima (22.3%), and in Rio de Janeiro State, at Tanguá (16.7%). MNSCL was planning to acquire Mineraço Del Rey Ltda.’s Cerro Azul Mine in Paraná State to start production and to increase domestic production in 2004 (Departamento Nacional de Produço Mineral, 2002c, p. 51-52).
Gemstones.—Brazil continued to be one of the world’s largest gemstone producers and exporters. Many different varieties of gemstones are found throughout the country; these include, in order of importance, emerald, aquamarine, diamond, amethyst, citrine, chrysoberyl, opal, topaz, agate, and tourmaline. Brazil is the world’s only source of some quality gemstones, such as imperial topaz and Paraíba tourmaline (Oliveira, 2002).
In 2001, mining of gemstones continued to be dominated by the garimpeiros. Brazilian production of gems (including diamond), which totaled 1 million carats, was mainly derived from digging activities (garimpos), which amounted to 820,000 carats, or 82% of the total; the private sector produced 80,000 carats, or 8% of the total (table 1). Garimpeiros’ production, however, continued to decline because of depletion in garimpos’ reserves and increase in environmental restrictions. By the end
of 2001, some high-content gem placers in indigenous reserves were closed by the Government to exploration, the jewelry industry’s gemstone consumption was unknown, taxation on domestic sales of jewelry was high, and the private sector faced severe competition from its black-market counterparts. Taking into consideration these factors, Brazil’s gemstone reserves were almost impossible to quantify. Brazil, however, may have great potential because the country has 600 million cubic meters of sedimentary rocks that contain diamond that grade between 0.01 and 0.1 carat per cubic meter, or 15 million carats; this represented about 1.2% of the world’s diamond reserve base (Departamento Nacional de Produço Mineral, 2002c, p. 45-46; Olson, 2002, p. 56-57).
Diamond production remained about the same level as that of 2000. The total value of gemstone (including diamond) production was $48 million. Total exports of uncut gemstones were about $13 million, which remained at about the same level as that of 2000 but was lower than the $15.8 million in 1998 and $34.6 million in 1997. The major markets for uncut stones were Belgium (95%) and for cut stones were the United States (55%), Argentina (15%), Japan (12%), Paraguay (9%), Germany (6%), and Bolivia (3%). Imports increased to $21.5 million from $20.6 million in 1999 and $17 million in 1998. The main sources for uncut stones were Ireland (48%), the United States (36%), and the United Kingdom and Germany (8% each), and for cut stones, Italy (31%), China (25%), Japan (14%), and the United States and Spain (15% each). Brazil had lapidarian centers, many of which have closed owing to the preference of foreign buyers for uncut stones (Departamento Nacional de Produço Mineral, 2002c, p. 45).
Graphite.—Historically, Brazil’s beneficiated natural graphite output had been centered in Minas Gerais. Nacional de Grafite Ltda. (NGL) mined natural graphite in the municipalities of Pedra Azul, which had a production capacity of 30,000 t/yr; Itapecerica, 11,000 t/yr; and Salto da Divisa, 6,000 t/yr. Production amounted to 71,000 t with 14% carbon content; this was about the same level as that of 2000. This production was mainly of products that ranged in grade from 65.5% to 99.9% carbon at NGL’s three plants in Pedra Azul (31,100 t), Itapecerica (13,400 t), and Salto da Divisa (6,100 t). Also in Minas Gerais, Grafita MG Ltda. produced about 16,570 t of natural graphite, which was 10.5% higher than that of 1999 and was consumed domestically after simple grinding, and GP’s Mamoré Mineraço e Metalurgia Ltda. in Maiquinique, Bahía, produced 3,830 t of natural graphite (Departamento Nacional de Produço Mineral, 2002c, p. 57-58).
Three types of beneficiated graphite products were processed by NGL in Itapecerica and Pedra Azul—fines, lump, and medium grained. Brazil’s demand for natural flake-type crystalline graphite was met by the the Itapecerica, Pedra Azul, and the Salto da Divisa beneficiation plants. Exports amounted to 17,994 t valued at $19 million in 2001 compared with 11,307 t valued at about $18 million in 2000. Growth of the domestic consumption of natural graphite during the 1990s was correlated with that of the iron and steel industries, which absorbed about 80% of the natural graphite consumed in Brazil; demand in 2001, however, increased by about 41.6% (51,000 t) compared with that of 2000 (36,000 t). Other consumers included battery

4.8 U.S. GEOLOGICAL SURVEY MINERALS YEARBOOK—2001 THE MINERAL INDUSTRY OF BRAZIL—2001 4.9
manufacturing (6.5%), refractories (6%), paint and varnishes (2%), and other miscellaneous uses (5.5%) (Departamento Nacional de Produço Mineral, 2002c, p. 57-58).
Magnesite.—The most important magnesite mine in Brazil was the Pedra Preta Mine, which was owned and operated by Magnesita S.A. (MSA); the mine is in the Éguas Mountain region of Brumado, Bahía, about 610 km from Salvador. Brazil produced 280,000 t of beneficiated magnesite, which was about the same level as that of 2000; MSA produced 97% (271,600 t). Exports of processed magnesite totaled 78,000 t valued at $12 million and were shipped to Paraguay (25%), Poland (20%), the United States (16%), Argentina (15%), and Chile (11%). Imports totaled 7,600 t valued at $5 million and were imported from Norway (69%), Canada (21%), Mexico (3%), and other countries (7%). By yearend, about 630 Mt of resources with 180 Mt of magnesium content had been identified. The expansion of Indústria Química Xilolite S.A.’s calcined magnesia plant in Brumado, Bahía, to 28,000 t/yr from 4,000 t/yr continued (Departamento Nacional de Produço Mineral, 2002c, p. 71-72).
Phosphate Rock.—Production of phosphate rock concentrate amounted to about 4.7 Mt, which was about the same level as that of 2000. Production was highly concentrated (95.4%, or 4.5 Mt) in four mining companies—Fosfértil S.A. (Grupo Fertifós) (34%), Fertilizantes Serrana S.A. (Bunge International Group (30%), and Ultrafértil S.A. (Grupo Fertifós) and Copebras S.A. (Anglo American) (15% each). Fosfértil and Ultrafértil were reorganized by yearend; they were controlled by Grupo Fertifós (79%) and CVRD (11%). Bunge Group controlled Fertifós (100%), Fertilizantes Serrana S.A. (52%), Cargill S.A. (33%), and Fertibrás S.A. (13%) (Ferraz, 2002, p. 5-6). The reported domestic consumption of concentrates was about 5.7 Mt/yr; this was an increase of 1% compared with that of 2000. Of the total phosphoric acid, 73% was used in the fertilizer industry; 25%, in the chemical industry; and 2%, for other uses. These usages remained alomost unchanged from those of 2000. Imports of concentrates, phosphoric acid, and intermediate products were valued at $574 million compared with those of 2000 ($467 million) (Departamento Nacional de Produço Mineral, 2002c, p. 87-88).
Quartz.—Brazil produced 3,700 t of quartz valued at $1.6 million. Quartz was exported mostly to Japan (31%), Hong Kong (25%), the United Kingdom (21%), Canada (8%), and Germany (4%). Quartz powder was shipped to the United Kingdom (48%), Germany (46%), and the United States (6%). Telequartzo Exportaço S.A. and others produced quartz powder, which is an important constituent in the production of optic fibers, crucibles, oscillators, solar cells, wafers and integrated circuit packing, and ceramic materials of exceptional purity, in order of importance. Brazil’s reserves were estimated to be 53 Mt (Departamento Nacional de Produço Mineral, 2002c, p. 93-94).
Salt.—The reported domestic production of marine salt was 4.6 Mt, which was about the same level as that of 2000. The State of Rio Grande do Norte continued to be the major
producer of marine salt with 95.9% followed by the States of Rio de Janeiro (2.4%) and Ceará (1.7%). The domestic consumption of marine salt was 5.5 Mt. Brazil also produced 1.4 Mt of rock salt. Salgema Mineraço e Química S.A. in Maceió, State of Alagoas, produced 751,000 t (51.8%) of rock salt, and Dow Química do Nordeste Ltd. (a subsidiary of Dow Chemical Co. of the United States) produced 697,000 t (48.2%) of salt from the Vera Cruz Mine in the State of Bahía (Departamento Nacional de Produço Mineral, 2002c, p. 99).
In 2001, salt imports decreased from 215,000 t to 190,000 t, or 11.6%. Imports were sea salt (23,000 t) and bulk, in order of importance, without aggregates—table salt, sodium chloride, and pure sodium (167,000 t). Imports came from Chile (98%) and the Netherlands (2%). Salt exports amounted to 765,000 t, which was an increase of 48.3% from that of 2000. Exports were sea salt (756,000 t), bulk without aggregates (4,000 t), table salt (3,000 t), and pure sodium choride (2,000 t). Exports were shipped to Nigeria (63%), the United States (30%), Belgium and Uruguay (3% each), and Venezuela (1%). Salt was consumed by the chemical industry (chlorine and sodium manufacture) (85.4%) and others (caustic soda) (14.6%) (Departamento Nacional de Produço Mineral, 2002c, p. 100).
Other Industrial Minerals.—Potassium production increased by almost 2% to 597,860 t compared with that of 2000. Brazil imported 2.6 Mt of potash mainly from Canada (29%), Russia (20%), Germany (20%), and Israel (15%) (Departamento Nacional de Produço Mineral, 2002c, p. 91-92).
Production of gypsum was more than 1.5 Mt, which was about the same level as that of 2000. In Brazil, renewed housing and infrastructure construction activities improved the consumption of cement and plasters (Departamento Nacional de Produço Mineral, 2002c, p. 59-60).
Production of talc was 300,000 t, which was about the same level as that of 2000. Paraná was Brazil’s major talc producer with 58% of the national output followed by Bahía (29%), So Paulo (12%), and Minas Gerais (1%); these represented lower volumes as a result of the depletion of some talc ores that had taken place since mid-1997 (Departamento Nacional de Produço Mineral, 2002c, p. 105-106).
Mineral Fuels
Brazil produced 487.6 million barrels (Mbbl) of petroleum and 14.0 billion cubic meters of natural gas, which were 5% and 5.3% higher, respectively, than those of 2000. The country produced, in order of importance, crude oil, natural gas liquid, natural gas, and shale oil; production totaled 572.3 Mbbl of oil equivalent (Departamento Nacional de Produço Mineral, 2002c, p. 85-86). In 2001, Petrobrás’s average production of crude oil, which included condensate and natural gas liquid, was about 1.568 million barrels per day (Mbbl/d), which was 5% higher than that of 2000. In December, Petrobrás attained a new production record of 1.636 Mbbl/d and was planning to reach a target of 1.9 Mbbl/d in 2003 to 2004 (Ferraz, 2002, p. 6; Petrobrás, 2002, p. 4, 11).
Coal.—The Brazilian coal industry’s mine operations were concentrated in the three southernmost States of Santa Catarina
4.10 U.S. GEOLOGICAL SURVEY MINERALS YEARBOOK—2001 THE MINERAL INDUSTRY OF BRAZIL—2001 4.11
(50%), Rio Grande do Sul (49%), and Paraná (1%). In 2001, Brazilian ROM coal production was about the same level as that of 2000 (13.8 Mt), and production of energy-generation-type coal (marketable output) increased to 6.6 Mt from 6.5 Mt in 2000 and 5.6 Mt in 1999, which were increases of about 1.5% and 18%, respectively (table 1).
The main producers of ROM coal were Copelmi Mineraço Ltda. with 4.6 Mt followed by Companhia Riograndense de Mineraço S.A. (CRM) (2.2 Mt), Companhia Carbonífera Metropolitana S.A. (1.2 Mt), and Carbonífera Circiúma S.A. (1.6 Mt). Coal demand increased mainly because the thermoelectric plants were operating at full capacity in these three States. Domestic coal (6.3 Mt) was used by Santa Catarina (56.5%), Rio Grande do Sul (42.1%), and Paraná (1.4%). To meet Brazil’s metallurgical coal demand, 15 Mt valued at $530 million was imported; this was an increase of 11% compared with that of 2000.
Imports came from the United States (33%), Australia (27%), South Africa (10%), and Canada (8%). Brazil imported 1.6 Mt of mineral coal coke as well, which was an increase of 78% compared with that of 2000; China was the main supplier. Total coal consumption reached 17 Mt, which was about the same level as that of 2000. The steel industry consumed 62% of metallurgical coal, 33% was used for the thermoelectric generation, and 5%, for the petrochemical and pulp and paper industries (Departamento Nacional de Produço Mineral, 2002c, p. 38).
The higher consumption of electricity in the country was reaching the limits of the hydroelectric generating capacity, which is rationed during periods of drought. Brazil was planning a priority thermoelectric generating program based mostly on natural gas and coal and would involve 49 new power stations based mainly on natural gas. Three of them to be built in Rio Grande do Sul will be coal fired. These new powerplants were part of the Government’s 17-gigawatt emergency plan (supplied largely by Electrobrás S.A.) to cope with the increased demand of electricity. CRM was planning to invest $3 million to produce 2.5 Mt/yr in early 2003. Circiúma and Metropolitana were negotiating with Usina Termoeléctrica do Sul Catarinese to supply coal to produce 400 megawatts (MW). In July 2000, Chinese investors signed a letter of intent with the State of Rio Grande do Sul to perform technical and economic feasibility studies on a thermoelectric plant in the Candiota region. Most Brazilian coals have a lower content of carbon and a higher content of ash compared with the Colombian coals in the Guajira area. Total Brazilian coal reserves were estimated to be 7,400 Mt (Departamento Nacional de Produço Mineral, 2002c, p. 37-38; Ferraz, 2002, p. 2-3).
Natural Gas and Petroleum.—Brazil produced 38.5 million cubic meters per day of gas, which was 5.7% higher than that of 2000. The gas pipeline that links the Enchova platform in the offshore Campos Basin to Macaé, Río de Janeiro, had 5 million cubic meters per day of gas flow added to the Río de Janeiro and the So Paulo markets; offshore gas production accounted for 58% of the total. Petrobrás signed two separate agreements with Yacimientos Petroleros Fiscales de Argentina and with Yacimientos Petroleros Fiscales de Bolivia to supply natural gas to Brazil. The Argentina-Brazil gas pipeline linked
Aldeia Brasileira in Argentina to Porto Alegre in Rio Grande do Sul. The $2 billion 3,150-km Bolivia-Brazil gas pipeline started operation and will increase the supply of natural gas along the 1,970 km of pipeline between Santa Cruz de la Sierra, Bolivia, and Guararema, Brazil, to supply Mato Grosso do Sul, So Paulo, Paraná, Santa Catarina, and Rio Grande do Sul with 8 million cubic meters per day into 2005, 16 million cubic meters per day from 2005, and 30 million cubic meters per day from 2010.
The natural gas share of the country’s energy mix was 3% in 2001 and will be 12% in 2010. Petrobrás continued producing natural gas in the Gulf of Mexico and recovered gas from the Frederick Field, which was 27 km off the Louisiana coast (Departamento Nacional de Produço Mineral, 2002c, p. 53-54, 86; Ferraz, 2002, p. 7). In 2001, Petrobrás negotiated and acquired stakes on concession areas in the following countries: Argentina in the Neuquina Basin (100%), Bolivia in the Rio Hondo block (50%), Colombia in the upper Madalena Basin (50%), Trinidad and Tobago in deep waters (19%), Angola in the lower Congo Basin (15%), and Nigeria (negotiations are in progress) (Petrobrás, 2002, p. 42-43).
Brazil produced 1.4 Mbbl/d of petroleum, which was 5% higher than that of 2000. Imports of crude oil and derivatives were valued at $4.3 billion compared with exports valued at $1.7 billion. Brazil’s imports of petroleum were 326 Mbbl at a value of $3.3 billion. The main sources were Nigeria (28.0%), Saudi Arabia (26.0%), Argentina (10.0%), Iraq (9.0%), and other countries (27.0%) (Departamento Nacional de Produço Mineral, 2002c, p. 86; Ferraz, 2002; Petrobrás, 2002, p. 21).
Uranium.—Brazil owned the fifth largest uranium reserves in the world (Rapouso Dos Santos, 2000, p. 204). The country’s indicated reserves amounted to 21.9 Mt of uranium oxide (U3O8) and 67 Mt of inferred reserves; minable reserves contained about 103,200 t at a grade of 0.104% U3O8. Private interests were permitted to participate in uranium exploration and production in Brazil through state-owned joint ventures; no more than 20% of the country’s uranium reserves may be exported (Departamento Nacional de Produço Mineral, 2001, p. 389-391).
Reserves
Brazil was among the world leaders in reserves of some mineral commodities. According to the Departamento Nacional de Produço Mineral (2002a, p. 17), the commodities were ranked as follows: colombium (niobium), first; graphite and kaolin, second; aluminum, talc, and vermiculite, third; magnesite and tin, fourth; and iron ore and manganese, sixth (table 3).
Infrastructure
Brazil’s railroads comprised a total 30,539 km (2,129 km electrified), of which the broad gauge was 5,679 km of 1.600-meter (m) gauge (1,190 km electrified); the standard gauge, 194 km of 1.440-m gauge; and the narrow gauge, 24,666 km of 1.000-m gauge (930 km electrified). In addition, three rails had dual gauge—336 km of 1.000- and 1.600-m gauge. The
4.10 U.S. GEOLOGICAL SURVEY MINERALS YEARBOOK—2001 THE MINERAL INDUSTRY OF BRAZIL—2001 4.11
country had a total of almost 2 million kilometers (Mkm) of roads—184,140 km paved and 1.8 Mkm gravel and dirt. Brazil had 50,000 km of navigable inland waterways, and pipelines for petroleum products, 4,762 km; for natural gas, 4,246 km; and for crude oil, 2,980 km. The major shipping ports were Belém, Fortaleza, Ilheus, Manaus, Paranagua, Porto Alegre, Recife, Río de Janeiro, Río Grande, Salvador, Santos, and Vitoria. Among the merchant marine’s 271 ships, 82 were bulk vessels; 56, tankers; 15, chemical tankers; 10, liquefied gas tankers; 14, combination ore and oil vessels; and 2, combination bulk vessels (Vale, 2002, p. 18-23; U.S. Central Intelligence Agency, 2002§).
In 2001, Brazil’s installed electrical generating capacity was 52,865 megawatts (MW). Total production of electric power for the year was 291,630 gigawatthours, which translated into 1,370 kilowatthours per capita. Brazil’s primary domestic energy supply encompassed the following: hydroelectric, 95%; petroleum and natural gas, 2.6%; nuclear energy, 0.8%; and others, 1.6% (Vale, 2002, p. 18-23; U.S. Central Intelligence Agency, 2002§).
The Bolivia-Brazil pipeline (owned by a consortium of the Royal Dutch/Shell, Enron, and Petrobrás) was the largest of the various cross-border energy projects. Argentina supplied gas to Rio Grande do Sul’s new thermoelectric plant, two additional pipelines were to take Argentine gas to Brazil’s southern market, and another project was to supply energy to Brazil from a powerplant in Uruguay. The total pipeline network remained at 12,790 km. In northern Brazil, a transmission line supplied energy to Roraima from Venezuela. The majority of these projects were being developed by the private sector as a result of internationalization, liberalization, and privatization. State-owned corporations entered into partnerships with private domestic and foreign investors (Chodorowski and Carnecir, 2001; Petrobrás, 2002, p. 22).
Negotiations were also completed between the Brazilian Government and five companies, four of which were foreign subsidiaries. The companies involved were Alcan, Alcoa, Billiton, Camargo Corréa Industrial S.A. (Brazil), and Dow Chemical, USA. Brazil and the five companies will build a 1,200-MW dam on the Tocantins River on the border between the States of Maranho and Tocantins; the dam will be named Tucurui. The construction of the dam was estimated to cost about $1 billion; Billiton has pledged $350 million (Vale, 2002, p. 23). This new dam appeared to be necessary because demand for hydroelectricity was growing at a rate faster than that of its supply. This increased demand could exceed the 2001 supply in a very few years. The supply of subsidized electricity from the Tucurui Dam had been exceeded by the mining and industrial activities in 2001 in the Tocantins area. The 10% electrical subsidy was expected to be phased out by 2004 (Vale, 2002, p. 20). Alcoa acquired ownership of one concession as part of a consortium, and Alcan obtained the right to build three separate hydroelectric power stations (Mining Journal, 2002a). Constran S.A. and Construço e Comércio of Grupo Itamaraty planned to construct an additional 1,718 km of railroad to be linked to the existing railroad system. The cost of the new system was projected to be $2.5 billion. This addition will connect to the existing system, which runs through Vitória, Espírito Santo; Belo Horizonte, Minas Gerais; Santos, So Paulo; and Chapadao do Sul, Mato Grosso do Sul. This new railroad system will run from Chapadao do Sul to
Cuiabá, Mato Grosso, and Santarem, Pará, branching from Cuiabá to Porto Velho, Rondônia (Vale, 2002, p. 22).
Outlook
Brazil is one the world’s most important mining countries with significant production of a range of minerals and metals. Key factors in continuing to offer a favorable climate for investors are keeping inflation under control, coming to grips with its fiscal deficit, providing stable rules for capital repatriation and profit remittances, and reducing the tax burden, tariffs, and nontariff barriers. These factors, along with its reviewed 1988 Constitution, are expected to position Brazil well into the next decade. As an exporter of mineral commodities, the country is poised to gain from the continued depreciation of the Brazilian real caused by the financial risks, which, in part, were triggered by the more-severe crisis in Argentina. The reduced FDI to $22.6 billion in 2001 from $32.8 billion in 2000 into the Brazilian economy somehow reflects the uneasiness in the financial markets. Other foreign investors, however, have confidence in the country, which will support continued economic growth and investments in technology well into the next decade.
No deferment of a major investment decision was reported. Even firms that have financed with borrowed U.S. dollars, which include CVRD, have the natural hedge provided by their exports. CVRD will invest about $6 billion in mineral project developments and acquisitions by 2007. The significance of the investment would be to increase CVRD’s market capitalization to $25 billion from its 2001 level of about $10 billion (Mining Journal, 2002b). The Brazilian economy, however, was affected by the volatility of the international financing market, depressed prices for mineral exports, and the country’s power shortage owing to its worst drought in decades, which affected the country’s hydroelectric power generating capacity (Prates, 2001; Mining Journal, 2002a).
The various sectors of the Brazilian economy recorded diverse rates of growth—minerals, 3.4%; agriculture, 3.0%; services, 2.5%; and industrial, 0.6 % (Departamento Nacional de Produço Mineral, 2002a, p. 1; Banco Central do Brasil, 2002c§). If that positive rate of economic growth in the minerals sector is sustained into 2001 and beyond, then it should continue its expansion as the demand for mineral exports and fabricated steel goods increases. Mercosur has undergone dramatic changes in natural gas and power markets owing to the increase in cross-border energy investment opportunities, domestic gas consumption, and privatization of the energy sector. Brazil has become the center of an increasingly rapid process of energy integration in South America owing to the country’s gas market, which is in full evolutionary mode with an unsatisfied energy demand and a great potential for growth.
Investments into the Brazilian mining industry are expected to continue to enhance exploration and mine development activities, particularly in iron ore, gold, and emeralds, in order of importance. This trend should continue because several corporations were forming consortiums and acquiring exploration properties, mining prospects, and permits, particularly for iron ore, gold, diamond, base metals, and oil and gas, in order of importance.
4.12 U.S. GEOLOGICAL SURVEY MINERALS YEARBOOK—2001 THE MINERAL INDUSTRY OF BRAZIL—2001 4.13
After the steel industry, CVRD, and other sectors of the Brazilian economy, such as energy, services, telecommunications, and transportation were privatized, new projects in the oil and gas sectors will continue to be opened up to mergers and joint-venture projects with domestic and foreign investors; thus, the Brazilian economy is expected to remain sustainable and competitive within an inclusive globalization and internationalization and privatization processes into the new century.
The existing Brazilian infrastructure is of particular interest to the minerals and its related industries. Brazil has a good industrial base capable of supplying most of the required mining equipment, has a modern and reliable transportation and communication systems, and can provide skilled labor, modern mining technology, and an efficient network of supporting services. Improvements and additional infrastructure, however, would have a direct bearing on Brazil’s ability to increase industrial and minerals production competitively. The sectors most likely to be affected will be those that will depend most heavily on electricity and transportation facilities.
Brazil’s dramatic electricity crisis will continue to create a short- to medium-term slowdown in the aluminum, automobile, steel, petrochemical, and pulp and paper industries, in order of importance, which depend heavily on energy and exports; however, they will likely benefit most from a new and improved power-generating infrastructure. The 46 expected thermal generation plants to be built in the foreseeable future would be the major driver for growth in gas and/or coal demand. Brazil, however, would need to have the necessary regulatory resolutions, which include gas and coal prices, in place to motivate private investment.
Brazil’s dynamic and diverse economy, coupled with its sizable consuming market and its membership in Mercosur, will continue to attract the interest of investors of all types and origins. The Amazon region alone was considered to have possibilities for major undiscovered mineral wealth in addition to the large reserves of iron ore, manganese, bauxite, gold, and tin, in order of importance. A factor that may have a negative effect on mineral development over the longer term was the concern over biodiversity in the Amazon rain forest. Much will depend on the approaches to be used for economic and social development while protecting the environment in a sustainable way.
References Cited
Carlin, J.F., Jr., 2002, Tin: U.S. Geological Survey Mineral Commodity Summaries 2002, p. 174-175.
Chodorowski, Anthony, and Carnecir, Roberto, 2001, Gas & power in Latin America—South America’s Southern Cone gas—Power sectors taking first steps toward energy integration: Oil & Gas Journal, v. 99, no. 42, October 15, p. 68-76.
Cowley, Matthew, 2001, Building a super market—Country by country: Wall Street Journal, June 13, p. A2.
Departamento Nacional de Produço Mineral, 2001, Anuário mineral Brasileiro: Economia Mineral Estadistíca, v. 30, December, 404 p.
Departamento Nacional de Produço Mineral, 2002a, Indicadores da produço mineral 2001—Diviso de economia mineral: Ministério de Minas e Energia, March, 20 p.
Departamento Nacional de Produço Mineral, 2002b, Mining in Brazil— Directory of development and mineral economics: Ministério de Minas e Energia, January, 83 p.
Departamento Nacional de Produço Mineral, 2002c, Sumário mineral: Produço Mineral Brasileira, v. 21, November, 122 p.
Departamento Nacional de Produço Mineral, 2002d, Taxation of mining activities in Brazil—Brasília 2001: Ministério de Minas e Energia, February, 86 p.
Fenton, M.D., 2002, Iron and steel: U.S. Geological Survey Mineral Commodity Summaries 2002, p. 86-87.
Ferraz, P.C., 2002, Brazil, in Mining annual review: Mining Journal Ltd., folio 934, 6 p.
Instituto Brasileiro de Siderurgia, 2001, Anuário—Estatístico da indústria siderúrgica Brasileira: Instituto Brasileiro de Siderurgia Yearbook, 98 p.
Metal Bulletin, 2001, Iron ore—CVRD and Baosteel set up Brazilian mining joint venture: Metal Bulletin, no. 8603, August 30, p. 17.
Mining Journal, 2002a, Brazilian power concessions sold: Mining Journal, v. 339, no. 8694, July 19, p. 48.
Mining Journal, 2002b, Industry in action—CVRD plans major investments: Mining Journal, v. 339, no. 8698, August 16, p. 120.
Mining Journal, 2002c, Iron ore in 2001: Mining Journal, v. 339, no. 8693, July 12, p. 25-26.
Mining Journal, 2002d, Problems for tin: Mining Journal, v. 339, no. 8697, August 9, p. 93-94.
Oliveira, A.M., 2002, Gemstones: Instituto Brasileiro de Gemas e Metais Preciosos 2001, p. 299.
Olson, D.W., 2002, Diamond (industrial): U.S. Geological Survey Mineral Commodity Summaries 2002, p. 56-57.
Petrobrás, 2002, Petrobrás annual report 2001: Petrobrás, v. 7, no. 32, December 2001, 110 p.
Pimentel, J.R., 2002a, Mining in Brazil—Basic information for the investor: Ministério de Minas e Energia, January, 88 p.
Pimentel, J.R., 2002b, Taxation of mining activities in Brazil—Analysis of current situation and of changes proposed for tax reform: Ministério de Minas e Energia, January, 86 p.
Prates, Jean-Paul, 2001, Brazil’s energy crisis complicates progress in gas, power markets—Buy outlook brightening: Oil & Gas Journal, v. 99, no. 42, October 15, p. 77-84.
Rapouso Dos Santos, André, 2000, Economia mineral do Brazil—Urânio e energía nuclear: Estudos de Política e Economia Mineral, no. 8, July, 278 p.
Vale, Eduardo, 2002, Estudos de política e economia mineral—Economia mineral do Brasil: Ministério de Minas e Energia, Secretaria de Minas e Metalurgia, Departamento Nacional de Produço Mineral, 23 p.
Internet References Cited
Banco Central do Brasil, 2002a, Economic and financial information—Brazil’s balance of payments, Annual Report 2001, accessed October 16, 2002, via URL http://www.bcb.gov.br/ default.asp?Idioma=I.
Banco Central do Brasil, 2002b, Economic and financial information—Foreign direct investment in Brazil, Annual Report 2001, accessed October 16, 2002, via URL http://www.bcb.gov.br/default.asp?Idioma=I.
Banco Central do Brasil, 2002c, Economic and financial information—The Brazilian economy, Annual Report 2001, accessed October 16, 2002, via URL http://www.bcb.gov.br/default.asp?Idioma=I.
Economic Commission for Latin America and the Caribbean, 2002a, Brazil— La inversión extranjera en América Latina y el Caribe—Informe 2001, accessed October 16, 2002, via URL http://www.eclac.org/cgi-bin/ getProd.asp?xml=/publicaciones/xml/8/10478.xml&xsl=/ddpe/tpl/p9f.xsl.
Economic Commission for Latin America and the Caribbean, 2002b, Brazil— South America, Preliminary Overview of the Economies of Latin America and the Caribbean 2001, accessed October 16, 2002, via URL http://www.eclac.org/publicaciones/DesarrolloEconomico/3/LCG2153P/ lcg2153i.pdf.
U.S. Central Intelligence Agency, 2002, Brazil, World Factbook, accessed October 15, 2002, at URL http://www.odci.gov/cia/publications/factbook/ geos/br.html.
World Bank Group, 2002, Regions and countries—Brazil, accessed October 16, 2002, via URL http://www.worldbank.org/html/extdr/regions.htm#b.
4.12 U.S. GEOLOGICAL SURVEY MINERALS YEARBOOK—2001 THE MINERAL INDUSTRY OF BRAZIL—2001 4.13
Major Sources of Information
Comisso Nacional de Energia NuclearRua General Severianao90 Botáfogo-ZC-0222290-Rio de Janeiro-RJ-Brasil
Companhia de Pesquisa de Recursos MineraisAvenida Pasteur 404-Anexo, 2o Andar, Pria Vermelha22290-Rio de Janeiro-RJ-Brasil
Conselho de No-Ferrosos e de SiderurgiaEsplanados dos Ministerios-Bloco 6-5o Andar70053-Brasilia-DF-Brasil
Conselho Nacional do PetróleoSGAN-Q.603 Modulos J, I e H70830-Brasilia-DF-Brasil
Instituto Brasileiro de MineraçoAvenida Afonso Pena, 3880 3o, 4o e 5o Andares30000-Belo Horizonte-MG-Brasil
Instituto Brasileiro de SiderurgiaRua Araújo Porto Alegre, 36 - 7o Andar20030-010-Rio de Janeiro-RJ-Brasil
Departamento Nacional de Produço MineralMinistério da Minas e EnergiaSAN-Quadra 01-Bloco “B”70040-Brasilia-DF-Brasil
Petróleo Brasileiro, S.A.Avenida República do Chile, 6520035-Río de Janeiro-RJ-Brasil
Rio Doce Geológica e Mineraço, S.A.Avenida President Wilson 11o Andar22030-Rio de Janeiro-RJ-Brasil
Major Publications
Associaço Brasileira dos Produtores de Ferroligas (ABRAFE), Sao Paulo, Brazil: ABRAFE Yearbook, annual.
Departamento Nacional da Produço Mineral, Brasilia, Brazil: Anuario and Sumario Mineral, annual.
Fairchild Publications, New York City, New York: American Metal Market, weekly.
Instituto Latinoamericano del Fierro y el Acero, Santiago, Chile: Monthly and annual reports.
Metal Bulletin Journals Ltd., London, United Kingdom:Metal Bulletin, semiweekly.Metal Bulletin, monthly.
Mining Journal Ltd., London, United Kingdom:Mining Annual Review, annual.Mining Journal, weekly.
PennWell Publishing Co., Tulsa, Oklahoma: Oil & Gas Journal, weekly.
Petróleo Brasileiro, S.A., Rio de Janeiro, Brazil: Petrobrás Relatório Anual de Atividades, annual.
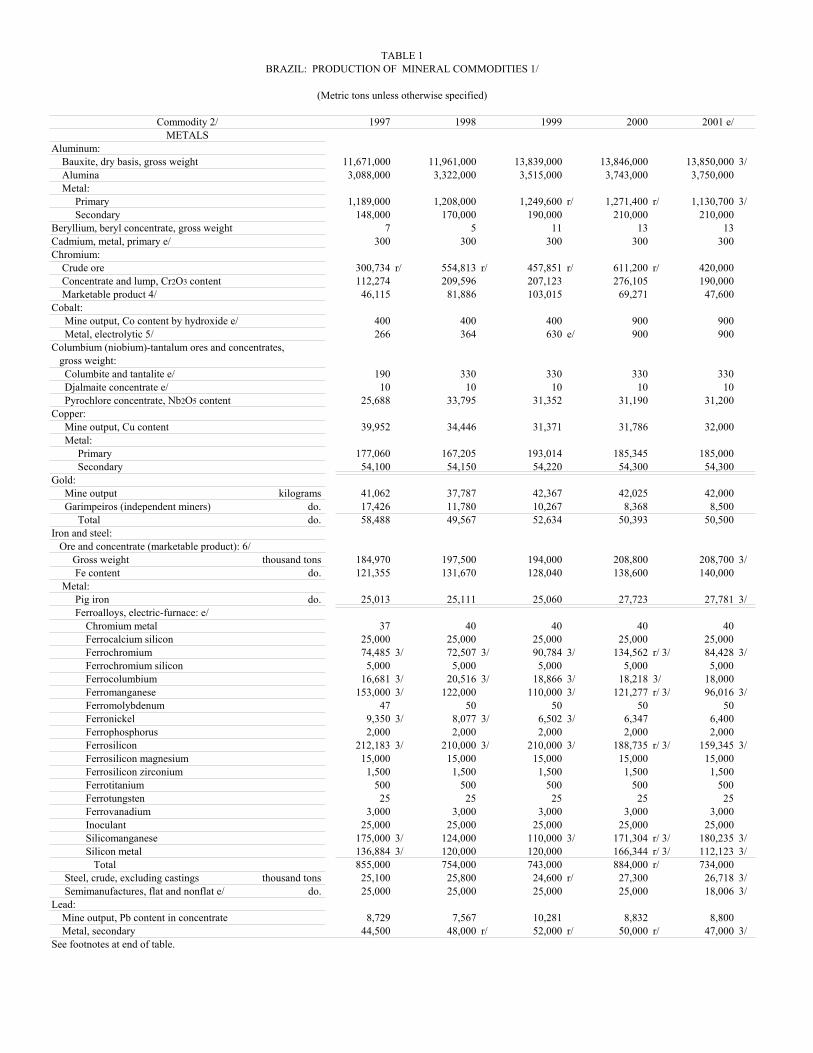
TABLE 1BRAZIL: PRODUCTION OF MINERAL COMMODITIES 1/
(Metric tons unless otherwise specified)
Commodity 2/ 1997 1998 1999 2000 2001 e/METALS
Aluminum: Bauxite, dry basis, gross weight 11,671,000 11,961,000 13,839,000 13,846,000 13,850,000 3/ Alumina 3,088,000 3,322,000 3,515,000 3,743,000 3,750,000 Metal: Primary 1,189,000 1,208,000 1,249,600 r/ 1,271,400 r/ 1,130,700 3/ Secondary 148,000 170,000 190,000 210,000 210,000Beryllium, beryl concentrate, gross weight 7 5 11 13 13Cadmium, metal, primary e/ 300 300 300 300 300Chromium: Crude ore 300,734 r/ 554,813 r/ 457,851 r/ 611,200 r/ 420,000 Concentrate and lump, Cr2O3 content 112,274 209,596 207,123 276,105 190,000 Marketable product 4/ 46,115 81,886 103,015 69,271 47,600Cobalt: Mine output, Co content by hydroxide e/ 400 400 400 900 900 Metal, electrolytic 5/ 266 364 630 e/ 900 900 Columbium (niobium)-tantalum ores and concentrates, gross weight: Columbite and tantalite e/ 190 330 330 330 330 Djalmaite concentrate e/ 10 10 10 10 10 Pyrochlore concentrate, Nb2O5 content 25,688 33,795 31,352 31,190 31,200Copper: Mine output, Cu content 39,952 34,446 31,371 31,786 32,000 Metal: Primary 177,060 167,205 193,014 185,345 185,000 Secondary 54,100 54,150 54,220 54,300 54,300Gold: Mine output kilograms 41,062 37,787 42,367 42,025 42,000 Garimpeiros (independent miners) do. 17,426 11,780 10,267 8,368 8,500 Total do. 58,488 49,567 52,634 50,393 50,500Iron and steel: Ore and concentrate (marketable product): 6/ Gross weight thousand tons 184,970 197,500 194,000 208,800 208,700 3/ Fe content do. 121,355 131,670 128,040 138,600 140,000 Metal: Pig iron do. 25,013 25,111 25,060 27,723 27,781 3/ Ferroalloys, electric-furnace: e/ Chromium metal 37 40 40 40 40 Ferrocalcium silicon 25,000 25,000 25,000 25,000 25,000 Ferrochromium 74,485 3/ 72,507 3/ 90,784 3/ 134,562 r/ 3/ 84,428 3/ Ferrochromium silicon 5,000 5,000 5,000 5,000 5,000 Ferrocolumbium 16,681 3/ 20,516 3/ 18,866 3/ 18,218 3/ 18,000 Ferromanganese 153,000 3/ 122,000 110,000 3/ 121,277 r/ 3/ 96,016 3/ Ferromolybdenum 47 50 50 50 50 Ferronickel 9,350 3/ 8,077 3/ 6,502 3/ 6,347 6,400 Ferrophosphorus 2,000 2,000 2,000 2,000 2,000 Ferrosilicon 212,183 3/ 210,000 3/ 210,000 3/ 188,735 r/ 3/ 159,345 3/ Ferrosilicon magnesium 15,000 15,000 15,000 15,000 15,000 Ferrosilicon zirconium 1,500 1,500 1,500 1,500 1,500 Ferrotitanium 500 500 500 500 500 Ferrotungsten 25 25 25 25 25 Ferrovanadium 3,000 3,000 3,000 3,000 3,000 Inoculant 25,000 25,000 25,000 25,000 25,000 Silicomanganese 175,000 3/ 124,000 110,000 3/ 171,304 r/ 3/ 180,235 3/ Silicon metal 136,884 3/ 120,000 120,000 166,344 r/ 3/ 112,123 3/ Total 855,000 754,000 743,000 884,000 r/ 734,000 Steel, crude, excluding castings thousand tons 25,100 25,800 24,600 r/ 27,300 26,718 3/ Semimanufactures, flat and nonflat e/ do. 25,000 25,000 25,000 25,000 18,006 3/Lead: Mine output, Pb content in concentrate 8,729 7,567 10,281 8,832 8,800 Metal, secondary 44,500 48,000 r/ 52,000 r/ 50,000 r/ 47,000 3/See footnotes at end of table.
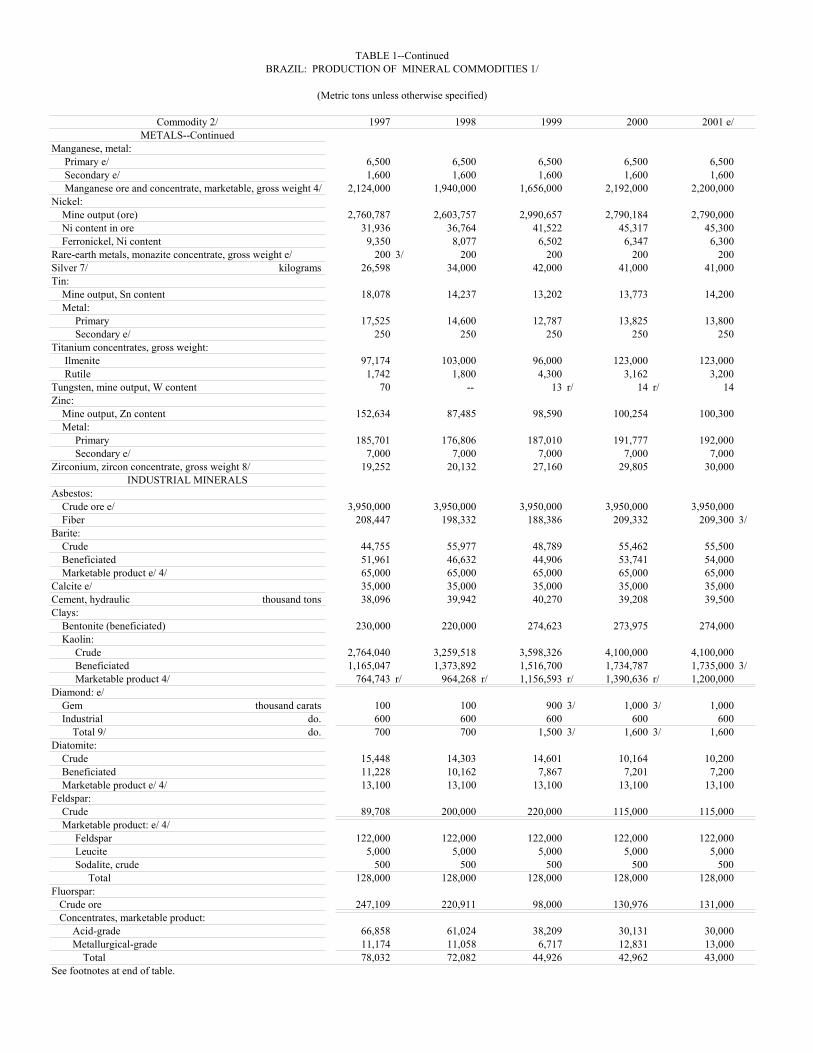
TABLE 1--ContinuedBRAZIL: PRODUCTION OF MINERAL COMMODITIES 1/
(Metric tons unless otherwise specified)
Commodity 2/ 1997 1998 1999 2000 2001 e/METALS--Continued
Manganese, metal: Primary e/ 6,500 6,500 6,500 6,500 6,500 Secondary e/ 1,600 1,600 1,600 1,600 1,600 Manganese ore and concentrate, marketable, gross weight 4/ 2,124,000 1,940,000 1,656,000 2,192,000 2,200,000Nickel: Mine output (ore) 2,760,787 2,603,757 2,990,657 2,790,184 2,790,000 Ni content in ore 31,936 36,764 41,522 45,317 45,300 Ferronickel, Ni content 9,350 8,077 6,502 6,347 6,300Rare-earth metals, monazite concentrate, gross weight e/ 200 3/ 200 200 200 200Silver 7/ kilograms 26,598 34,000 42,000 41,000 41,000Tin: Mine output, Sn content 18,078 14,237 13,202 13,773 14,200 Metal: Primary 17,525 14,600 12,787 13,825 13,800 Secondary e/ 250 250 250 250 250Titanium concentrates, gross weight: Ilmenite 97,174 103,000 96,000 123,000 123,000 Rutile 1,742 1,800 4,300 3,162 3,200Tungsten, mine output, W content 70 -- 13 r/ 14 r/ 14Zinc: Mine output, Zn content 152,634 87,485 98,590 100,254 100,300 Metal: Primary 185,701 176,806 187,010 191,777 192,000 Secondary e/ 7,000 7,000 7,000 7,000 7,000Zirconium, zircon concentrate, gross weight 8/ 19,252 20,132 27,160 29,805 30,000
INDUSTRIAL MINERALSAsbestos: Crude ore e/ 3,950,000 3,950,000 3,950,000 3,950,000 3,950,000 Fiber 208,447 198,332 188,386 209,332 209,300 3/Barite: Crude 44,755 55,977 48,789 55,462 55,500 Beneficiated 51,961 46,632 44,906 53,741 54,000 Marketable product e/ 4/ 65,000 65,000 65,000 65,000 65,000Calcite e/ 35,000 35,000 35,000 35,000 35,000Cement, hydraulic thousand tons 38,096 39,942 40,270 39,208 39,500Clays: Bentonite (beneficiated) 230,000 220,000 274,623 273,975 274,000 Kaolin: Crude 2,764,040 3,259,518 3,598,326 4,100,000 4,100,000 Beneficiated 1,165,047 1,373,892 1,516,700 1,734,787 1,735,000 3/ Marketable product 4/ 764,743 r/ 964,268 r/ 1,156,593 r/ 1,390,636 r/ 1,200,000Diamond: e/ Gem thousand carats 100 100 900 3/ 1,000 3/ 1,000 Industrial do. 600 600 600 600 600 Total 9/ do. 700 700 1,500 3/ 1,600 3/ 1,600Diatomite: Crude 15,448 14,303 14,601 10,164 10,200 Beneficiated 11,228 10,162 7,867 7,201 7,200 Marketable product e/ 4/ 13,100 13,100 13,100 13,100 13,100Feldspar: Crude 89,708 200,000 220,000 115,000 115,000 Marketable product: e/ 4/ Feldspar 122,000 122,000 122,000 122,000 122,000 Leucite 5,000 5,000 5,000 5,000 5,000 Sodalite, crude 500 500 500 500 500 Total 128,000 128,000 128,000 128,000 128,000Fluorspar: Crude ore 247,109 220,911 98,000 130,976 131,000 Concentrates, marketable product: Acid-grade 66,858 61,024 38,209 30,131 30,000 Metallurgical-grade 11,174 11,058 6,717 12,831 13,000 Total 78,032 72,082 44,926 42,962 43,000See footnotes at end of table.
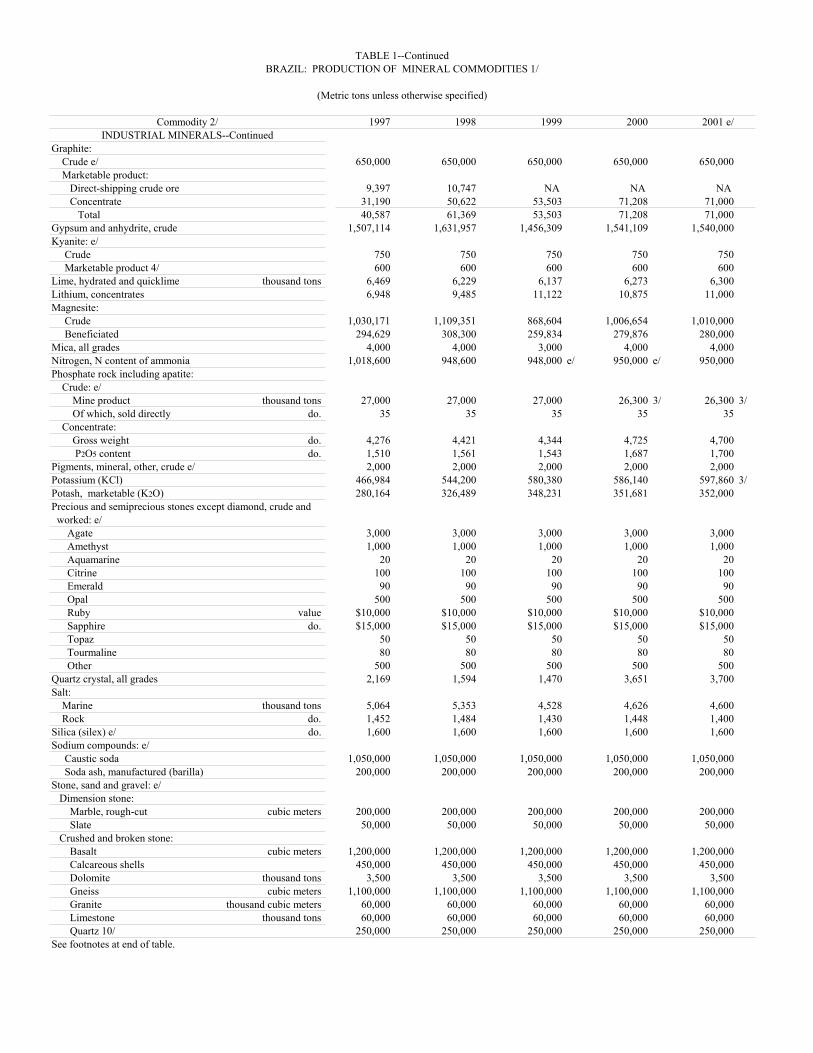
TABLE 1--ContinuedBRAZIL: PRODUCTION OF MINERAL COMMODITIES 1/
(Metric tons unless otherwise specified)
Commodity 2/ 1997 1998 1999 2000 2001 e/INDUSTRIAL MINERALS--Continued
Graphite: Crude e/ 650,000 650,000 650,000 650,000 650,000 Marketable product: Direct-shipping crude ore 9,397 10,747 NA NA NA Concentrate 31,190 50,622 53,503 71,208 71,000 Total 40,587 61,369 53,503 71,208 71,000Gypsum and anhydrite, crude 1,507,114 1,631,957 1,456,309 1,541,109 1,540,000Kyanite: e/ Crude 750 750 750 750 750 Marketable product 4/ 600 600 600 600 600Lime, hydrated and quicklime thousand tons 6,469 6,229 6,137 6,273 6,300Lithium, concentrates 6,948 9,485 11,122 10,875 11,000Magnesite: Crude 1,030,171 1,109,351 868,604 1,006,654 1,010,000 Beneficiated 294,629 308,300 259,834 279,876 280,000Mica, all grades 4,000 4,000 3,000 4,000 4,000Nitrogen, N content of ammonia 1,018,600 948,600 948,000 e/ 950,000 e/ 950,000Phosphate rock including apatite: Crude: e/ Mine product thousand tons 27,000 27,000 27,000 26,300 3/ 26,300 3/ Of which, sold directly do. 35 35 35 35 35 Concentrate: Gross weight do. 4,276 4,421 4,344 4,725 4,700 P2O5 content do. 1,510 1,561 1,543 1,687 1,700Pigments, mineral, other, crude e/ 2,000 2,000 2,000 2,000 2,000Potassium (KCl) 466,984 544,200 580,380 586,140 597,860 3/Potash, marketable (K2O) 280,164 326,489 348,231 351,681 352,000Precious and semiprecious stones except diamond, crude and worked: e/ Agate 3,000 3,000 3,000 3,000 3,000 Amethyst 1,000 1,000 1,000 1,000 1,000 Aquamarine 20 20 20 20 20 Citrine 100 100 100 100 100 Emerald 90 90 90 90 90 Opal 500 500 500 500 500 Ruby value $10,000 $10,000 $10,000 $10,000 $10,000 Sapphire do. $15,000 $15,000 $15,000 $15,000 $15,000 Topaz 50 50 50 50 50 Tourmaline 80 80 80 80 80 Other 500 500 500 500 500Quartz crystal, all grades 2,169 1,594 1,470 3,651 3,700Salt: Marine thousand tons 5,064 5,353 4,528 4,626 4,600 Rock do. 1,452 1,484 1,430 1,448 1,400Silica (silex) e/ do. 1,600 1,600 1,600 1,600 1,600Sodium compounds: e/ Caustic soda 1,050,000 1,050,000 1,050,000 1,050,000 1,050,000 Soda ash, manufactured (barilla) 200,000 200,000 200,000 200,000 200,000Stone, sand and gravel: e/ Dimension stone: Marble, rough-cut cubic meters 200,000 200,000 200,000 200,000 200,000 Slate 50,000 50,000 50,000 50,000 50,000 Crushed and broken stone: Basalt cubic meters 1,200,000 1,200,000 1,200,000 1,200,000 1,200,000 Calcareous shells 450,000 450,000 450,000 450,000 450,000 Dolomite thousand tons 3,500 3,500 3,500 3,500 3,500 Gneiss cubic meters 1,100,000 1,100,000 1,100,000 1,100,000 1,100,000 Granite thousand cubic meters 60,000 60,000 60,000 60,000 60,000 Limestone thousand tons 60,000 60,000 60,000 60,000 60,000 Quartz 10/ 250,000 250,000 250,000 250,000 250,000See footnotes at end of table.
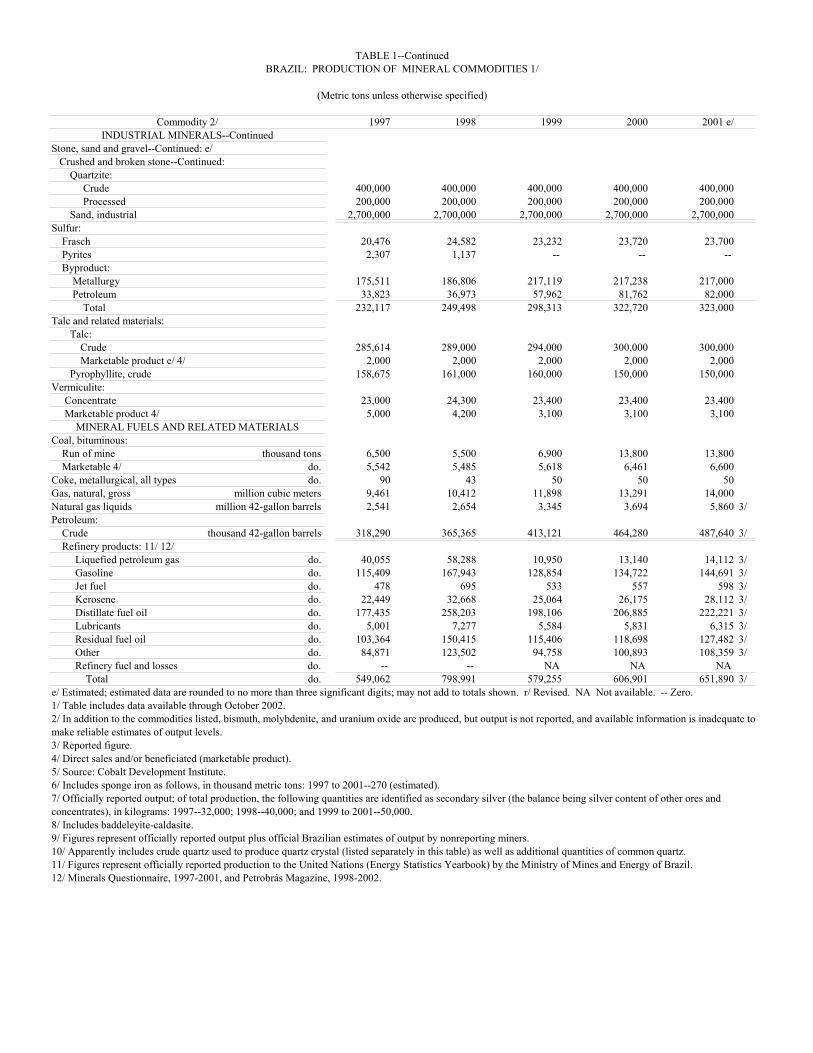
TABLE 1--ContinuedBRAZIL: PRODUCTION OF MINERAL COMMODITIES 1/
(Metric tons unless otherwise specified)
Commodity 2/ 1997 1998 1999 2000 2001 e/INDUSTRIAL MINERALS--Continued
Stone, sand and gravel--Continued: e/ Crushed and broken stone--Continued: Quartzite: Crude 400,000 400,000 400,000 400,000 400,000 Processed 200,000 200,000 200,000 200,000 200,000 Sand, industrial 2,700,000 2,700,000 2,700,000 2,700,000 2,700,000Sulfur: Frasch 20,476 24,582 23,232 23,720 23,700 Pyrites 2,307 1,137 -- -- -- Byproduct: Metallurgy 175,511 186,806 217,119 217,238 217,000 Petroleum 33,823 36,973 57,962 81,762 82,000 Total 232,117 249,498 298,313 322,720 323,000Talc and related materials: Talc: Crude 285,614 289,000 294,000 300,000 300,000 Marketable product e/ 4/ 2,000 2,000 2,000 2,000 2,000 Pyrophyllite, crude 158,675 161,000 160,000 150,000 150,000Vermiculite: Concentrate 23,000 24,300 23,400 23,400 23,400 Marketable product 4/ 5,000 4,200 3,100 3,100 3,100
MINERAL FUELS AND RELATED MATERIALSCoal, bituminous: Run of mine thousand tons 6,500 5,500 6,900 13,800 13,800 Marketable 4/ do. 5,542 5,485 5,618 6,461 6,600Coke, metallurgical, all types do. 90 43 50 50 50Gas, natural, gross million cubic meters 9,461 10,412 11,898 13,291 14,000Natural gas liquids million 42-gallon barrels 2,541 2,654 3,345 3,694 5,860 3/Petroleum: Crude thousand 42-gallon barrels 318,290 365,365 413,121 464,280 487,640 3/ Refinery products: 11/ 12/ Liquefied petroleum gas do. 40,055 58,288 10,950 13,140 14,112 3/ Gasoline do. 115,409 167,943 128,854 134,722 144,691 3/ Jet fuel do. 478 695 533 557 598 3/ Kerosene do. 22,449 32,668 25,064 26,175 28,112 3/ Distillate fuel oil do. 177,435 258,203 198,106 206,885 222,221 3/ Lubricants do. 5,001 7,277 5,584 5,831 6,315 3/ Residual fuel oil do. 103,364 150,415 115,406 118,698 127,482 3/ Other do. 84,871 123,502 94,758 100,893 108,359 3/ Refinery fuel and losses do. -- -- NA NA NA Total do. 549,062 798,991 579,255 606,901 651,890 3/e/ Estimated; estimated data are rounded to no more than three significant digits; may not add to totals shown. r/ Revised. NA Not available. -- Zero.1/ Table includes data available through October 2002.2/ In addition to the commodities listed, bismuth, molybdenite, and uranium oxide are produced, but output is not reported, and available information is inadequate tomake reliable estimates of output levels.3/ Reported figure.4/ Direct sales and/or beneficiated (marketable product).5/ Source: Cobalt Development Institute.6/ Includes sponge iron as follows, in thousand metric tons: 1997 to 2001--270 (estimated).7/ Officially reported output; of total production, the following quantities are identified as secondary silver (the balance being silver content of other ores andconcentrates), in kilograms: 1997--32,000; 1998--40,000; and 1999 to 2001--50,000.8/ Includes baddeleyite-caldasite.9/ Figures represent officially reported output plus official Brazilian estimates of output by nonreporting miners.10/ Apparently includes crude quartz used to produce quartz crystal (listed separately in this table) as well as additional quantities of common quartz.11/ Figures represent officially reported production to the United Nations (Energy Statistics Yearbook) by the Ministry of Mines and Energy of Brazil.12/ Minerals Questionnaire, 1997-2001, and Petrobrás Magazine, 1998-2002.
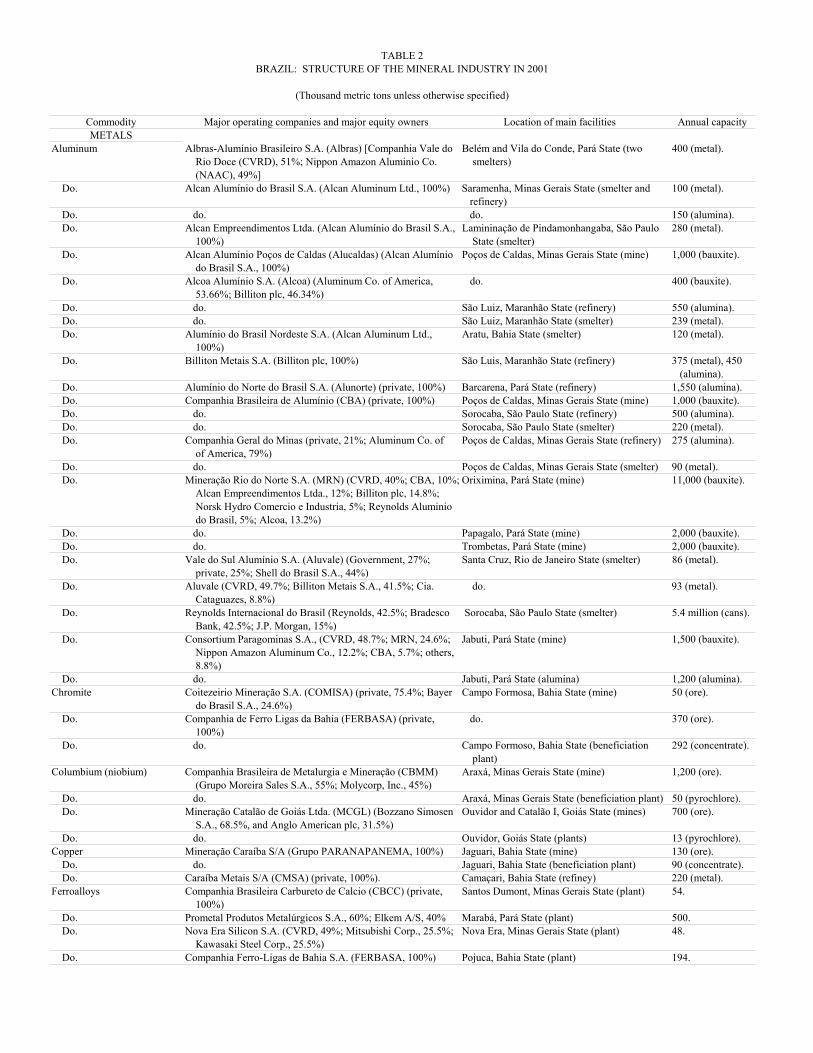
TABLE 2BRAZIL: STRUCTURE OF THE MINERAL INDUSTRY IN 2001
(Thousand metric tons unless otherwise specified)
Commodity Major operating companies and major equity owners Location of main facilities Annual capacityMETALS
Aluminum Albras-Alumínio Brasileiro S.A. (Albras) [Companhia Vale do Belém and Vila do Conde, Pará State (two 400 (metal). Rio Doce (CVRD), 51%; Nippon Amazon Aluminio Co. smelters) (NAAC), 49%]
Do. Alcan Alumínio do Brasil S.A. (Alcan Aluminum Ltd., 100%) Saramenha, Minas Gerais State (smelter and 100 (metal). refinery)
Do. do. do. 150 (alumina). Do. Alcan Empreendimentos Ltda. (Alcan Alumínio do Brasil S.A., Lamininação de Pindamonhangaba, São Paulo 280 (metal).
100%) State (smelter) Do. Alcan Alumínio Poços de Caldas (Alucaldas) (Alcan Alumínio Poços de Caldas, Minas Gerais State (mine) 1,000 (bauxite).
do Brasil S.A., 100%) Do. Alcoa Alumínio S.A. (Alcoa) (Aluminum Co. of America, do. 400 (bauxite).
53.66%; Billiton plc, 46.34%) Do. do. São Luiz, Maranhão State (refinery) 550 (alumina). Do. do. São Luiz, Maranhão State (smelter) 239 (metal). Do. Alumínio do Brasil Nordeste S.A. (Alcan Aluminum Ltd., Aratu, Bahia State (smelter) 120 (metal).
100%) Do. Billiton Metais S.A. (Billiton plc, 100%) São Luis, Maranhão State (refinery) 375 (metal), 450
(alumina). Do. Alumínio do Norte do Brasil S.A. (Alunorte) (private, 100%) Barcarena, Pará State (refinery) 1,550 (alumina). Do. Companhia Brasileira de Alumínio (CBA) (private, 100%) Poços de Caldas, Minas Gerais State (mine) 1,000 (bauxite). Do. do. Sorocaba, São Paulo State (refinery) 500 (alumina). Do. do. Sorocaba, São Paulo State (smelter) 220 (metal). Do. Companhia Geral do Minas (private, 21%; Aluminum Co. of Poços de Caldas, Minas Gerais State (refinery) 275 (alumina).
of America, 79%) Do. do. Poços de Caldas, Minas Gerais State (smelter) 90 (metal). Do. Mineração Rio do Norte S.A. (MRN) (CVRD, 40%; CBA, 10%; Oriximina, Pará State (mine) 11,000 (bauxite).
Alcan Empreendimentos Ltda., 12%; Billiton plc, 14.8%; Norsk Hydro Comercio e Industria, 5%; Reynolds Aluminio
do Brasil, 5%; Alcoa, 13.2%) Do. do. Papagalo, Pará State (mine) 2,000 (bauxite). Do. do. Trombetas, Pará State (mine) 2,000 (bauxite). Do. Vale do Sul Alumínio S.A. (Aluvale) (Government, 27%; Santa Cruz, Rio de Janeiro State (smelter) 86 (metal).
private, 25%; Shell do Brasil S.A., 44%) Do. Aluvale (CVRD, 49.7%; Billiton Metais S.A., 41.5%; Cia. do. 93 (metal).
Cataguazes, 8.8%) Do. Reynolds Internacional do Brasil (Reynolds, 42.5%; Bradesco Sorocaba, São Paulo State (smelter) 5.4 million (cans).
Bank, 42.5%; J.P. Morgan, 15%) Do. Consortium Paragominas S.A., (CVRD, 48.7%; MRN, 24.6%; Jabuti, Pará State (mine) 1,500 (bauxite).
Nippon Amazon Aluminum Co., 12.2%; CBA, 5.7%; others, 8.8%)
Do. do. Jabuti, Pará State (alumina) 1,200 (alumina).Chromite Coitezeirio Mineração S.A. (COMISA) (private, 75.4%; Bayer Campo Formosa, Bahia State (mine) 50 (ore).
do Brasil S.A., 24.6%) Do. Companhia de Ferro Ligas da Bahia (FERBASA) (private, do. 370 (ore).
100%) Do. do. Campo Formoso, Bahia State (beneficiation 292 (concentrate).
plant)Columbium (niobium) Companhia Brasileira de Metalurgia e Mineração (CBMM) Araxá, Minas Gerais State (mine) 1,200 (ore).
(Grupo Moreira Sales S.A., 55%; Molycorp, Inc., 45%) Do. do. Araxá, Minas Gerais State (beneficiation plant) 50 (pyrochlore). Do. Mineração Catalão de Goiás Ltda. (MCGL) (Bozzano Simosen Ouvidor and Catalão I, Goiás State (mines) 700 (ore).
S.A., 68.5%, and Anglo American plc, 31.5%) Do. do. Ouvidor, Goiás State (plants) 13 (pyrochlore).Copper Mineração Caraíba S/A (Grupo PARANAPANEMA, 100%) Jaguari, Bahia State (mine) 130 (ore). Do. do. Jaguari, Bahia State (beneficiation plant) 90 (concentrate). Do. Caraíba Metais S/A (CMSA) (private, 100%). Camaçari, Bahia State (refiney) 220 (metal).Ferroalloys Companhia Brasileira Carbureto de Calcio (CBCC) (private, Santos Dumont, Minas Gerais State (plant) 54.
100%) Do. Prometal Produtos Metalúrgicos S.A., 60%; Elkem A/S, 40% Marabá, Pará State (plant) 500. Do. Nova Era Silicon S.A. (CVRD, 49%; Mitsubishi Corp., 25.5%; Nova Era, Minas Gerais State (plant) 48.
Kawasaki Steel Corp., 25.5%) Do. Companhia Ferro-Ligas de Bahia S.A. (FERBASA, 100%) Pojuca, Bahia State (plant) 194.
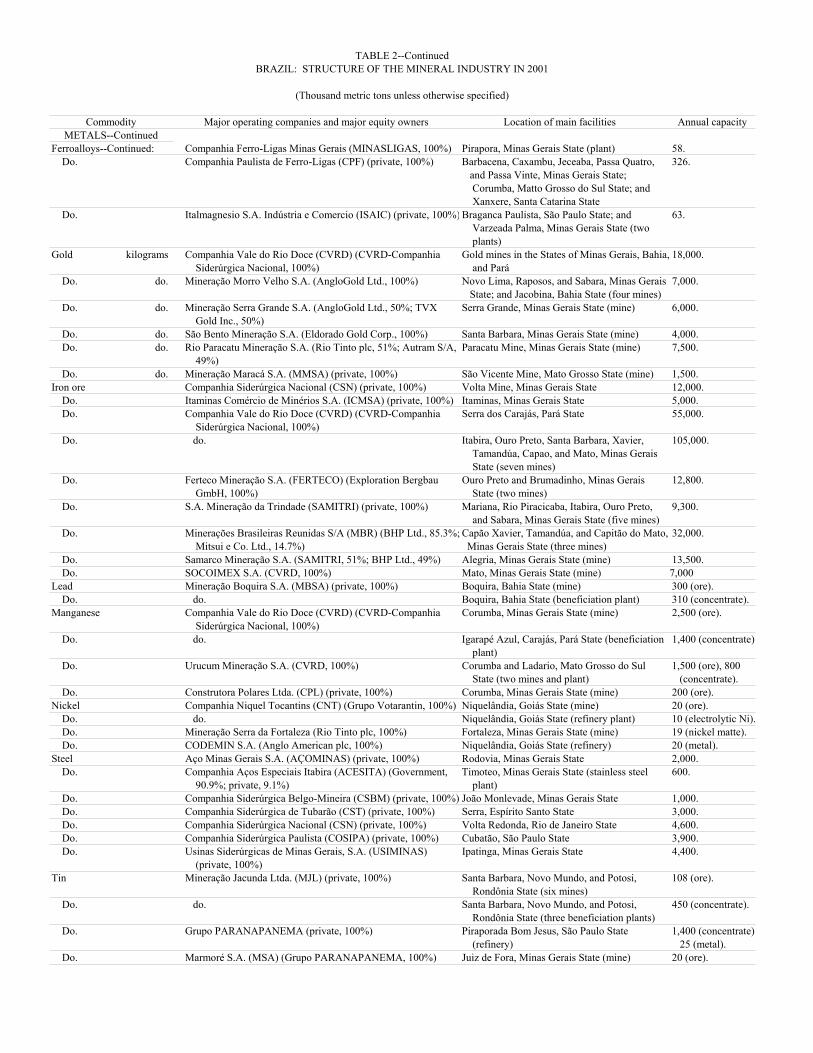
TABLE 2--ContinuedBRAZIL: STRUCTURE OF THE MINERAL INDUSTRY IN 2001
(Thousand metric tons unless otherwise specified)
Commodity Major operating companies and major equity owners Location of main facilities Annual capacityMETALS--Continued
Ferroalloys--Continued: Companhia Ferro-Ligas Minas Gerais (MINASLIGAS, 100%) Pirapora, Minas Gerais State (plant) 58. Do. Companhia Paulista de Ferro-Ligas (CPF) (private, 100%) Barbacena, Caxambu, Jeceaba, Passa Quatro, 326.
and Passa Vinte, Minas Gerais State; Corumba, Matto Grosso do Sul State; and Xanxere, Santa Catarina State
Do. Italmagnesio S.A. Indústria e Comercio (ISAIC) (private, 100%) Braganca Paulista, São Paulo State; and 63. Varzeada Palma, Minas Gerais State (two plants)
Gold kilograms Companhia Vale do Rio Doce (CVRD) (CVRD-Companhia Gold mines in the States of Minas Gerais, Bahia, 18,000. Siderúrgica Nacional, 100%) and Pará
Do. do. Mineração Morro Velho S.A. (AngloGold Ltd., 100%) Novo Lima, Raposos, and Sabara, Minas Gerais 7,000. State; and Jacobina, Bahia State (four mines)
Do. do. Mineração Serra Grande S.A. (AngloGold Ltd., 50%; TVX Serra Grande, Minas Gerais State (mine) 6,000. Gold Inc., 50%)
Do. do. São Bento Mineração S.A. (Eldorado Gold Corp., 100%) Santa Barbara, Minas Gerais State (mine) 4,000. Do. do. Rio Paracatu Mineração S.A. (Rio Tinto plc, 51%; Autram S/A, Paracatu Mine, Minas Gerais State (mine) 7,500.
49%) Do. do. Mineração Maracá S.A. (MMSA) (private, 100%) São Vicente Mine, Mato Grosso State (mine) 1,500.Iron ore Companhia Siderúrgica Nacional (CSN) (private, 100%) Volta Mine, Minas Gerais State 12,000. Do. Itaminas Comércio de Minérios S.A. (ICMSA) (private, 100%) Itaminas, Minas Gerais State 5,000. Do. Companhia Vale do Rio Doce (CVRD) (CVRD-Companhia Serra dos Carajás, Pará State 55,000.
Siderúrgica Nacional, 100%) Do. do. Itabira, Ouro Preto, Santa Barbara, Xavier, 105,000.
Tamandúa, Capao, and Mato, Minas Gerais State (seven mines)
Do. Ferteco Mineração S.A. (FERTECO) (Exploration Bergbau Ouro Preto and Brumadinho, Minas Gerais 12,800. GmbH, 100%) State (two mines)
Do. S.A. Mineração da Trindade (SAMITRI) (private, 100%) Mariana, Rio Piracicaba, Itabira, Ouro Preto, 9,300. and Sabara, Minas Gerais State (five mines)
Do. Minerações Brasileiras Reunidas S/A (MBR) (BHP Ltd., 85.3%; Capão Xavier, Tamandúa, and Capitão do Mato, 32,000. Mitsui e Co. Ltd., 14.7%) Minas Gerais State (three mines)
Do. Samarco Mineração S.A. (SAMITRI, 51%; BHP Ltd., 49%) Alegria, Minas Gerais State (mine) 13,500. Do. SOCOIMEX S.A. (CVRD, 100%) Mato, Minas Gerais State (mine) 7,000Lead Mineração Boquira S.A. (MBSA) (private, 100%) Boquira, Bahia State (mine) 300 (ore). Do. do. Boquira, Bahia State (beneficiation plant) 310 (concentrate).Manganese Companhia Vale do Rio Doce (CVRD) (CVRD-Companhia Corumba, Minas Gerais State (mine) 2,500 (ore).
Siderúrgica Nacional, 100%) Do. do. Igarapé Azul, Carajás, Pará State (beneficiation 1,400 (concentrate).
plant) Do. Urucum Mineração S.A. (CVRD, 100%) Corumba and Ladario, Mato Grosso do Sul 1,500 (ore), 800
State (two mines and plant) (concentrate). Do. Construtora Polares Ltda. (CPL) (private, 100%) Corumba, Minas Gerais State (mine) 200 (ore).Nickel Companhia Niquel Tocantins (CNT) (Grupo Votarantin, 100%) Niquelândia, Goiás State (mine) 20 (ore). Do. do. Niquelândia, Goiás State (refinery plant) 10 (electrolytic Ni). Do. Mineração Serra da Fortaleza (Rio Tinto plc, 100%) Fortaleza, Minas Gerais State (mine) 19 (nickel matte). Do. CODEMIN S.A. (Anglo American plc, 100%) Niquelândia, Goiás State (refinery) 20 (metal).Steel Aço Minas Gerais S.A. (AÇOMINAS) (private, 100%) Rodovia, Minas Gerais State 2,000. Do. Companhia Aços Especiais Itabira (ACESITA) (Government, Timoteo, Minas Gerais State (stainless steel 600.
90.9%; private, 9.1%) plant) Do. Companhia Siderúrgica Belgo-Mineira (CSBM) (private, 100%) João Monlevade, Minas Gerais State 1,000. Do. Companhia Siderúrgica de Tubarão (CST) (private, 100%) Serra, Espírito Santo State 3,000. Do. Companhia Siderúrgica Nacional (CSN) (private, 100%) Volta Redonda, Rio de Janeiro State 4,600. Do. Companhia Siderúrgica Paulista (COSIPA) (private, 100%) Cubatão, São Paulo State 3,900. Do. Usinas Siderúrgicas de Minas Gerais, S.A. (USIMINAS) Ipatinga, Minas Gerais State 4,400.
(private, 100%)Tin Mineração Jacunda Ltda. (MJL) (private, 100%) Santa Barbara, Novo Mundo, and Potosi, 108 (ore).
Rondônia State (six mines) Do. do. Santa Barbara, Novo Mundo, and Potosi, 450 (concentrate).
Rondônia State (three beneficiation plants) Do. Grupo PARANAPANEMA (private, 100%) Piraporada Bom Jesus, São Paulo State 1,400 (concentrate),
(refinery) 25 (metal). Do. Marmoré S.A. (MSA) (Grupo PARANAPANEMA, 100%) Juiz de Fora, Minas Gerais State (mine) 20 (ore).

TABLE 2--ContinuedBRAZIL: STRUCTURE OF THE MINERAL INDUSTRY IN 2001
(Thousand metric tons unless otherwise specified)
Commodity Major operating companies and major equity owners Location of main facilities Annual capacityMETALS--Continued
Tin--Continued: Grupo PARANAPANEMA (private, 100%) Aripuana, Mato Grosso State; Ariquemes, 5,420 (ore). Rondônia State; Novo Aripuana, Pitinga, and Presidente Figueiredo, Amazonas State; and São Felix do Xingu, Pará State (five mines and two plants)
Titanium Rutilo e Ilmenita do Brasil S.A. (RIBSA, 100%) Mataraca, Paraiba State (mine) 4,200 (ore). Do. do. Mataraca, Paraiba State (two beneficiation 120 (concentrate).
plants)Zinc Companhia Mineira de Metais S.A (CMM) (Grupo Votarantin, Vazante, Minas Gerais State (mine) 800 (ore).
100%) Do. do. Vazante, Minas Gerais State (beneficiation 48 (concentrate).
plant) Do. do. Três Marias, Minas Gerais State (refinery) 165 (metal). Do. Companhia Paraibuna de Metais S.A (CPM) (Grupo Juiz de Fora, Minas Gerais State (mine) 100 (ore).
PARANAPANEMA, 100%)Zirconium Nuclemon Minero-Química Ltda. (Government, 100%) São João da Barra, Rio de Janeiro State (mine) 660 (ore). Do. do. Itapemirim, Espírito Santo State (mine) 90 (ore). Do. do. Prado, Bahia State (mine) 90 (ore). Do. do. Prado, Bahia State (three beneficiation plants) 123 (concentrate). Do. do. Prado, Bahia State (three separation plants) 90 (concentrate).INDUSTRIAL MINERALSAsbestos Sociedade Anônima Mineração de Amianto (SAMA) (private, Cana Brava and Minaçu, Goiás State (mines) 9,000 (ore).
100%) Do. do. Cana Brava and Minaçu, Goiás State 230 (concentrate).
(beneficiation plant)Cement Cimento Santa Rita S.A. (CSSA) (CSSA, 50%; Holder Cimento Itapevi and Salto de Pirapora, São Paulo State 2,200.
S.A., 50%) (two plants) Do. Companhia Cimento Portland Itau (CCPI) (Grupo Votarantin, Itau de Minas, Minas Gerais State (three plants) 2,400.
100%) Do. Companhia de Cimento Portland Paraiso (CCPP) (CCPP, 50%; States of Espirito Santo, Goiás, Minas Gerais, 4,000.
Lafarge Group, 50%) and Rio de Janeiro (five plants) Do. Companhia de Cimento Portland Rio Branco (Grupo Votarantin, Rio Branco do Sul, Paraná State (two plants) 5,000.
100%) Do. Camargo Correia Cimentos S.A. (CCSA) (private, 100%) Ijací, Minas Gerais State (plant) 1,600.Diamond Mineração Tejucana S.A. (MTSA, 100%) Diamantina, Minas Gerais State (mine) 100.Fluorspar Mineração Nossa Senhora do Carmo Ltda. (MNSCL) (private, Cerro Azul, Paraná State (two mines) 180 (ore).
100%) Do. Mineração Santa Catarina Ltda. (MSCL) (private, 100%) Morro da Fumaça, Santa Rosa de Lima, Rio 100 (ore), 120
Fortuna, Santa Catarina State; and Tangúa, (concentrate). Rio de Janeiro State (three mines and beneficiation plant)
Graphite Nacional de Grafite Ltda. (NGL) (private, 100%) Itapecerica, Pedra Azul, Salto da Divisa, Minas 80 (ore). Gerais State (three mines)
Do. do. Itapecerica, Pedra Azul, Salto da Divisa, Minas 60 (concentrate). Gerais State (three beneficiation plants)
Do. Grafita MG Ltda. (GML) (private, 100%) Mateus Leme, Zerra Azul, Minas Gerais State 20 (ore). (two mines)
Do. Marmoré Mineração e Metalurgia Ltda. (MML) (Grupo Maiquinique, Bahía State (mine) 10 (ore). PARANAPANEMA, 100%)
Gypsum Companhia Brasileira de Equipamento (CBE) (private, 100%) Codo, Maranhão State, and Ipubi, Pernambuco 100. State (two mines)
Do. Companhia de Cimento Portland Paraiso (CCPP) (private, Ipubi, Pernambuco State (mine) 50. 100%)
Kaolin Caulim da Amazônia S.A. (CADAM) (private, 100%) Mazagão, Amapá State (mine) 720 (ore). Do. do. Mazagão, Amapá State (beneficiation plant) 360 (concentrate). Do. do. Adam Mine, Rio Jarí, Amazonas State 660 (concentrate). Do. Pará Pigmentos S.A. (PPSA) (private, 100%) Pará Mine, Pará State 500 (concentrate). Do. Ymerys Rio Capim Caulim S.A. (RCCSA) (private, 100%) Rio Capim Mine, Pará State 500 (concentrate). Do. Empresa de Mineração Horii Ltda. (EMHL) (private, 100%) Biritiba and Mogi das Cruzes, São Paulo State 200 (ore).
(two mines) Do. do. Biritiba and Mogi das Cruzes, São Paulo State 180 (concentrate).
(two beneficiation plants)

TABLE 2--ContinuedBRAZIL: STRUCTURE OF THE MINERAL INDUSTRY IN 2001
(Thousand metric tons unless otherwise specified)
Commodity Major operating companies and major equity owners Location of main facilities Annual capacityINDUSTRIAL MINERALS--
ContinuedLimestone Companhia de Cimento Portland Paraiso (CCPP) (private, States of Goiãs, Minas Gerais, and Rio de 2,000.
100%) Janeiro (five mines) Do. Companhia de Cimento Portland Rio Branco (CCPRB, 100%) Rio Branco do Sul, Paraná State (three mines) 5,500. Do. S.A. Industrias Votorantim (SAIV) (private, 100%) States of Rio de Janeiro and São Paulo (four 1,000.
mines)Magnesite Magnesita S.A. (MSA) (private, 100%) Brumado, Bahia State (one major mine and 1,000 (ore).
numerous small mines) Do. do. Brumado, Bahia State (two beneficiation plants) 280 (concentrate).Phosphate rock Fertililizantes Serrana S.A. (Bunge International Group, 100%) Araxá, Minas Gerais State (mine) 5,000. Do. Copebras S.A.(Copebras) (Anglo American plc, 100%) Ouvidor, Goiás State (mine) 4,400. Do. Fosfértil S.A. (Grupo Fertifós, 79%; CVRD, 11%; public, 10%) Tapira, Minas Gerais State (two mines) 10,500. Do. Ultrafértil S.A. (Grupo Fertifós, 79%; CVRD, 11%; public, Araxá, Minas Gerais State (mine) 5,000.
10%)Quartz Telequartzo Exportação S.A. (TESA) (private, 100%) Cristal, Minas Gerais State (mine) 6.0.Salt, rock Frota Oceânica Brasileira S.A. (FOBSA) (private, 100%) Jacupiranga, São Paulo State (mine) 6,000. Do. Dow Química do Nordeste Ltd. (DQNL) (Dow Chemical Co., Vera Cruz, Bahía State (mine) 1,000.
100%) Do. Cia. Nacional de Alcalis S.A. (CNA) (private, 100%) Alcalis Grupo, Rio Grande do Norte State 1,500. Do. Salgema Mineração e Química S.A. (SMQ) (private, 100%) Salgema, Maceió, Alagoas State (mine) 1,000.
MINERAL FUELSCoal Carbonífera Circiúma S.A. (CCSA) (private, 100%) Circiúma and Sideropolis, Santa Catarina State 1,600.
(two mines) Do. Companhia Carbonífera Metropolitana S.A. (CCM) (private, Circiúma, Sideropolis, and Urussanga, Santa 1,200.
100%) Catarina State (three mines) Do. Copelmi Mineração Ltda. (COPELMI) (private, 100%) Arroio dos Ratos, Butia, and Charqueadas, Rio 4,600.
Grande do Sul State (four mines) Do. Companhia Riograndense de Mineração S.A. (CRM) (private, Circiúma and Urussanga, Santa Catarina State 2,600.
100%) (two mines)Petroleum thousand Petróleo Brasileiro S.A. (Petrobrás) (Government, 81.4%; Fields in the States of Alagoas, Amazonas, 220,000.
42-gallon barrels private, 11.8%; public, 6.8%) Bahia, Ceará, Espírito Santo, Rio de Janeiro, Rio Grande do Norte, Pará, Maranhão, and Sergipe (99)
Petroleum products do. Refineries in the States of Amazonas, Bahia, 503,000. Ceará, Minas Gerais, Paraná, Rio de Janeiro, Rio Grande do Sul, and São Paulo
Do. Refinaria de Petróleo Ipiranga S.A. (RPISA) (private, 100%) Ipiranga, Rio Grande do Sul 3,400. Do. Refinaria de Petróleos de Manguinhos S.A. (RPMSA) (private, Manquinhos, Rio de Janeiro State 3,650.
100%)
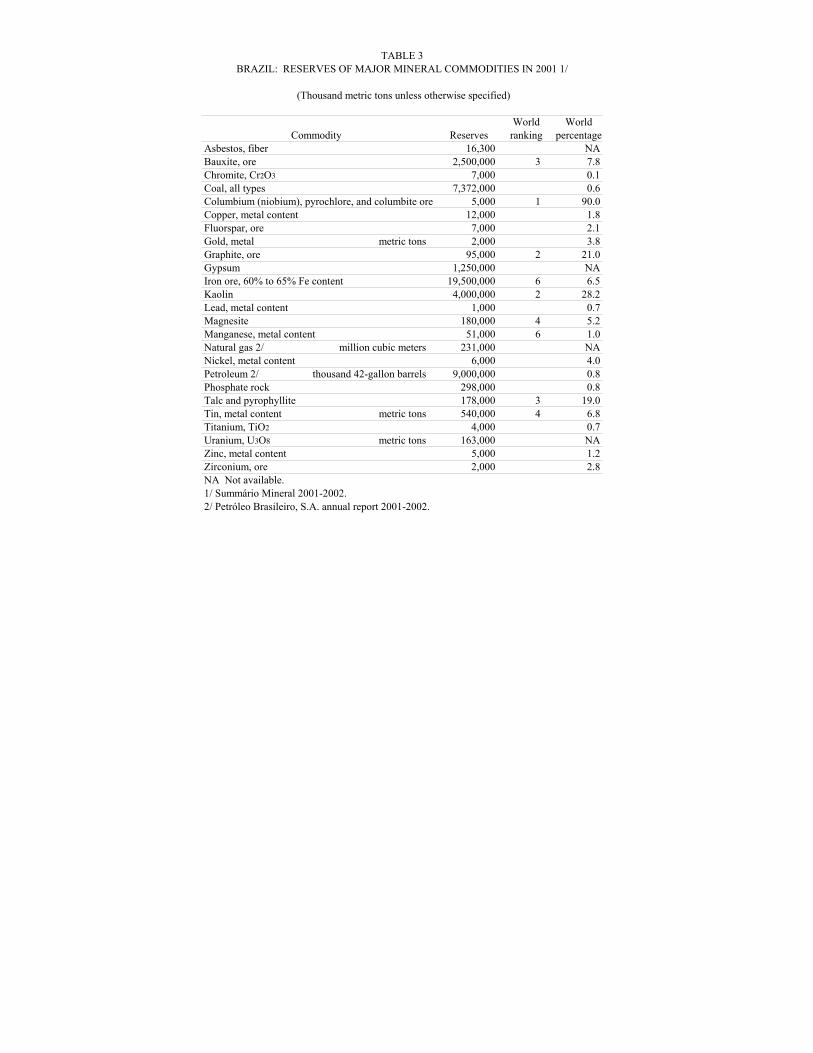
TABLE 3BRAZIL: RESERVES OF MAJOR MINERAL COMMODITIES IN 2001 1/
(Thousand metric tons unless otherwise specified)
World WorldCommodity Reserves ranking percentage
Asbestos, fiber 16,300 NABauxite, ore 2,500,000 3 7.8Chromite, Cr2O3 7,000 0.1Coal, all types 7,372,000 0.6Columbium (niobium), pyrochlore, and columbite ore 5,000 1 90.0Copper, metal content 12,000 1.8Fluorspar, ore 7,000 2.1Gold, metal metric tons 2,000 3.8Graphite, ore 95,000 2 21.0Gypsum 1,250,000 NAIron ore, 60% to 65% Fe content 19,500,000 6 6.5Kaolin 4,000,000 2 28.2Lead, metal content 1,000 0.7Magnesite 180,000 4 5.2Manganese, metal content 51,000 6 1.0Natural gas 2/ million cubic meters 231,000 NANickel, metal content 6,000 4.0Petroleum 2/ thousand 42-gallon barrels 9,000,000 0.8Phosphate rock 298,000 0.8Talc and pyrophyllite 178,000 3 19.0Tin, metal content metric tons 540,000 4 6.8Titanium, TiO2 4,000 0.7Uranium, U3O8 metric tons 163,000 NAZinc, metal content 5,000 1.2Zirconium, ore 2,000 2.8NA Not available.1/ Summário Mineral 2001-2002.2/ Petróleo Brasileiro, S.A. annual report 2001-2002.


