By Alexandra Permar GIS ANALYSIS TO UNDERSTAND LANDSCAPE FUNCTIONAL CHANGES IN THE RIO SALADO...
36
by Alexandra Permar GIS ANALYSIS TO UNDERSTAND LANDSCAPE FUNCTIONAL CHANGES IN THE RIO SALADO SUBBASIN, NM
-
Upload
colin-kelly -
Category
Documents
-
view
214 -
download
0
Transcript of By Alexandra Permar GIS ANALYSIS TO UNDERSTAND LANDSCAPE FUNCTIONAL CHANGES IN THE RIO SALADO...

by Alexandra Permar
GIS ANALYSIS TO UNDERSTAND LANDSCAPE FUNCTIONAL CHANGES IN THE RIO SALADO SUBBASIN, NM
Project Motivations
•Overarching Interests:• Understand landscape-scale changes through time• Natural evolution & redistribution of vegetative communities• Changes in hydrological parameters through time• Changes in geomorphological parameters through time• Contextualize trajectories of change in ecological parameters with respect to ecosystem function
•Understand how Rio Salado subbasin & La Jencia watershed have changed through time

Research Questions
•Questions driving my current research interests include:•What ecological parameters are useful for characterizing the function of an ecosystem?
•Do GIS-, satellite remotely sensed, and field-based integrity assessment data properly inform conservation- and restoration site selection?• Do the various data sources provide insight as to the current
condition of ecological parameters?• Do the data sources sufficiently inform assessment of
ecological parameters at varying spatial- and temporal resolutions?
Thesis Research Methods•Methods to address a portion of thesis objectives:•Understand changes in ecological parameters through time • Characterize landscape change through time using historical and contemporary data sets in two United States case studies (one in the Western U.S., another in the East).• Derive and compare water budgets for case studies, addressing variables such as precipitation, evapotranspiration, consumptive water use, runoff, infiltration, and stored water.• Analyze changes in vegetative community patterns through time (abundance, distribution, types, species). • Evaluate changes in amounts- and types of urbanized infrastructure in case studies, and evaluate urbanization data in context of other data sets being used.
Thesis Research Methods
•Methods to address a portion of thesis objectives:•Understand changes in ecological parameters through time • Where possible, contextualize case study changes with respect to natural landscape disturbances (including drought, fire, flooding) to ascertain what types and impacts disturbance have upon ecosystem function.• Evaluate relative impacts of anthropogenic land use (grazing, recreation, restructuralization of water resources) on ecosystem function.
• Contextualize understanding of landscape changes through time with relevance to restoration site selection.•Monitor restoration projects through time to observe how they enable the landscape to withstand disturbance.
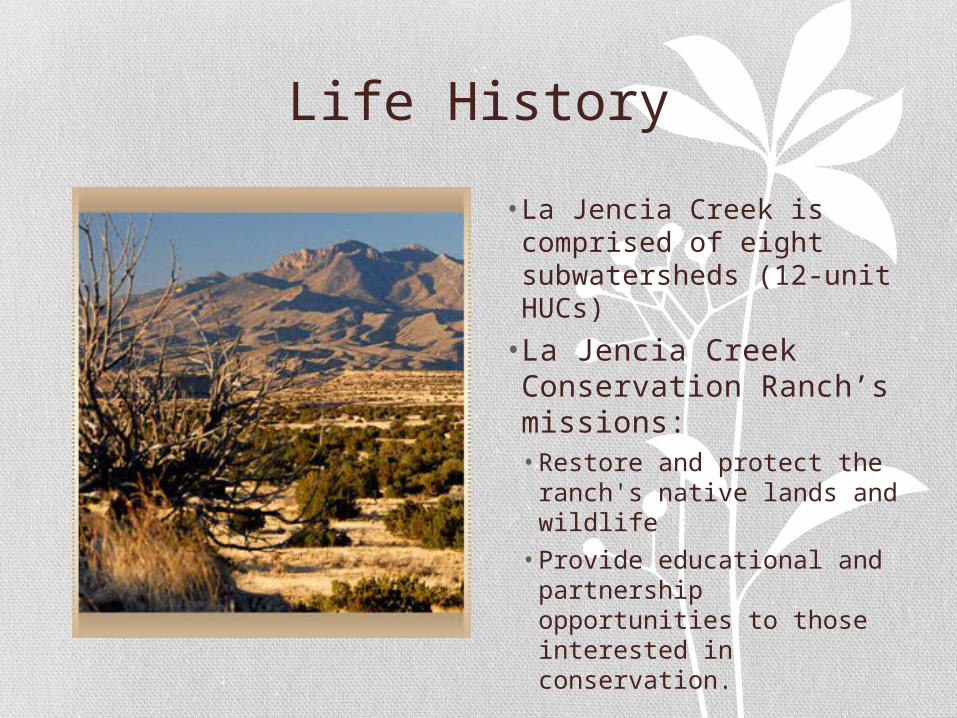
Life History
• La Jencia Creek is comprised of eight subwatersheds (12-unit HUCs)
• La Jencia Creek Conservation Ranch’s missions:• Restore and protect the
ranch's native lands and wildlife • Provide educational and
partnership opportunities to those interested in conservation.
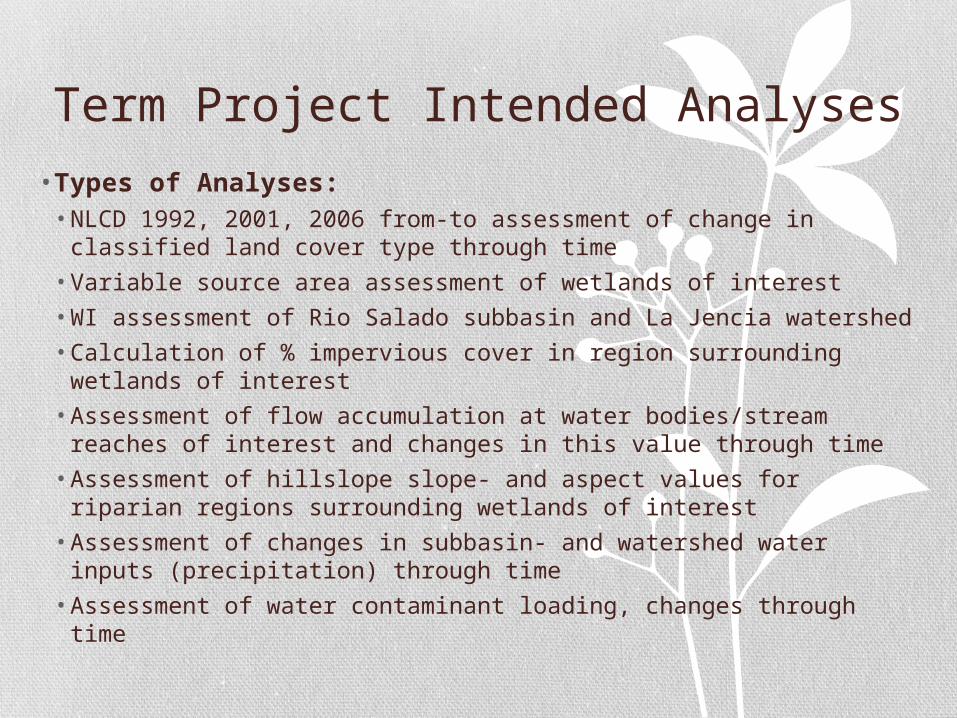
Term Project Intended Analyses• Types of Analyses:• NLCD 1992, 2001, 2006 from-to assessment of change in
classified land cover type through time • Variable source area assessment of wetlands of interest • WI assessment of Rio Salado subbasin and La Jencia watershed• Calculation of % impervious cover in region surrounding wetlands
of interest • Assessment of flow accumulation at water bodies/stream reaches
of interest and changes in this value through time • Assessment of hillslope slope- and aspect values for riparian
regions surrounding wetlands of interest • Assessment of changes in subbasin- and watershed water inputs
(precipitation) through time • Assessment of water contaminant loading, changes through time
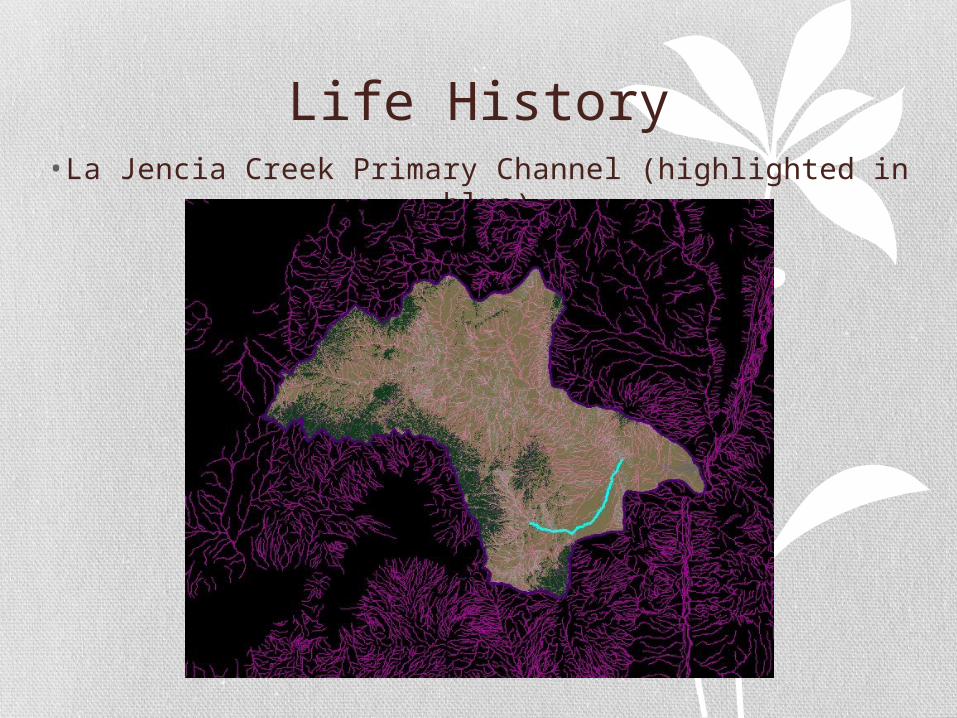
Life History• La Jencia Creek Primary Channel (highlighted in blue)
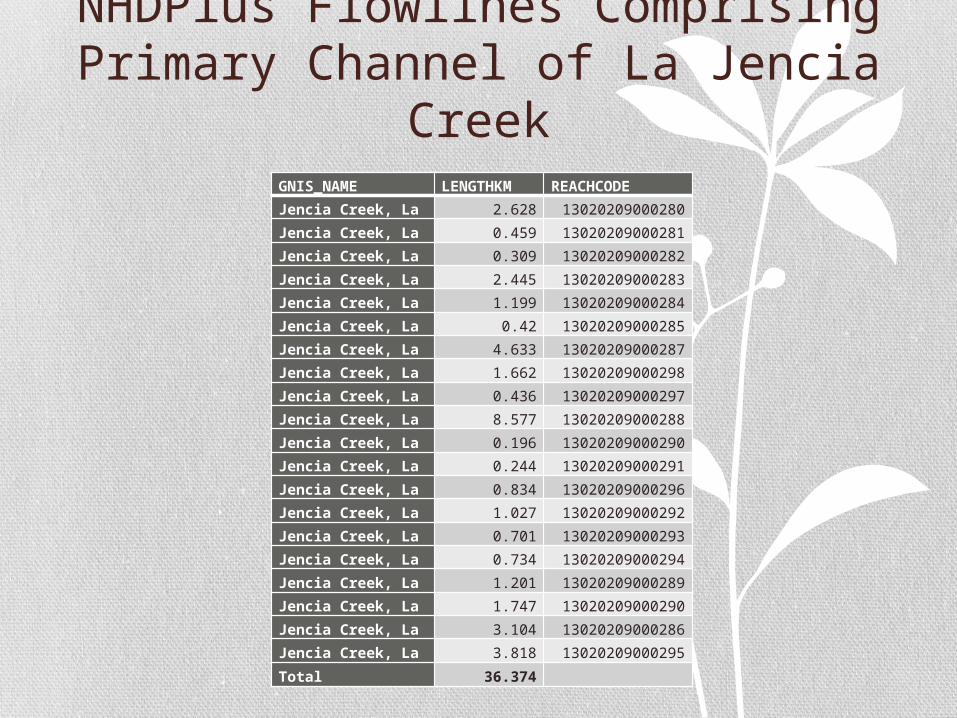
NHDPlus Flowlines Comprising Primary Channel of La Jencia Creek
GNIS_NAME LENGTHKM REACHCODE
Jencia Creek, La 2.628 13020209000280
Jencia Creek, La 0.459 13020209000281
Jencia Creek, La 0.309 13020209000282
Jencia Creek, La 2.445 13020209000283
Jencia Creek, La 1.199 13020209000284
Jencia Creek, La 0.42 13020209000285
Jencia Creek, La 4.633 13020209000287
Jencia Creek, La 1.662 13020209000298
Jencia Creek, La 0.436 13020209000297
Jencia Creek, La 8.577 13020209000288
Jencia Creek, La 0.196 13020209000290
Jencia Creek, La 0.244 13020209000291
Jencia Creek, La 0.834 13020209000296
Jencia Creek, La 1.027 13020209000292
Jencia Creek, La 0.701 13020209000293
Jencia Creek, La 0.734 13020209000294
Jencia Creek, La 1.201 13020209000289
Jencia Creek, La 1.747 13020209000290
Jencia Creek, La 3.104 13020209000286
Jencia Creek, La 3.818 13020209000295
Total 36.374
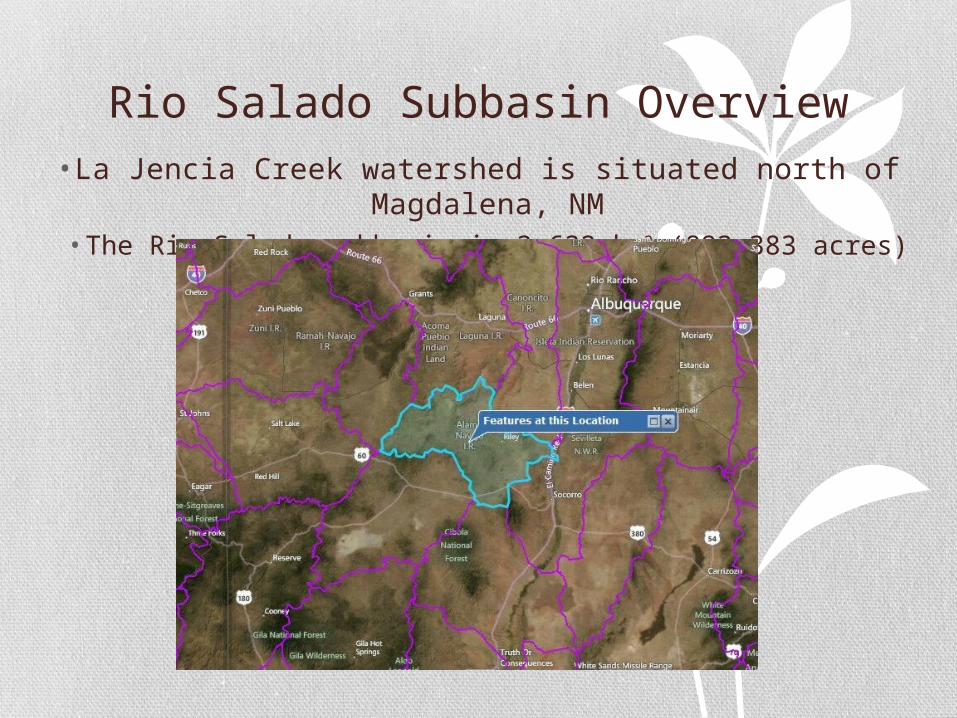
Rio Salado Subbasin Overview• La Jencia Creek watershed is situated north of
Magdalena, NM• The Rio Salado subbasin is 3,632 km2 (893,383 acres) in area
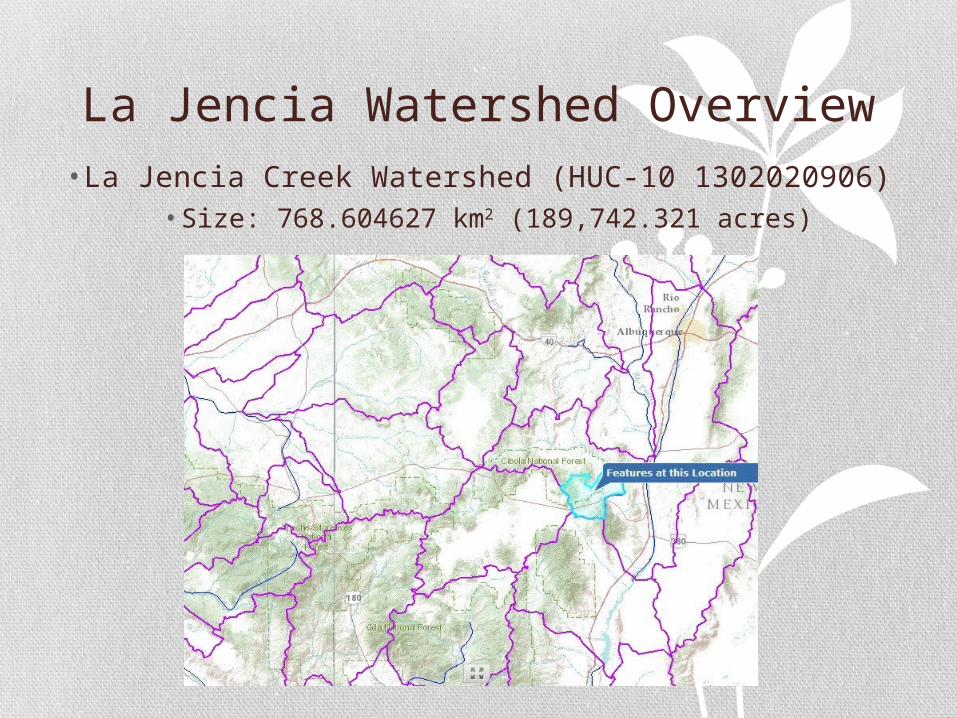
La Jencia Watershed Overview• La Jencia Creek Watershed (HUC-10 1302020906)
• Size: 768.604627 km2 (189,742.321 acres)
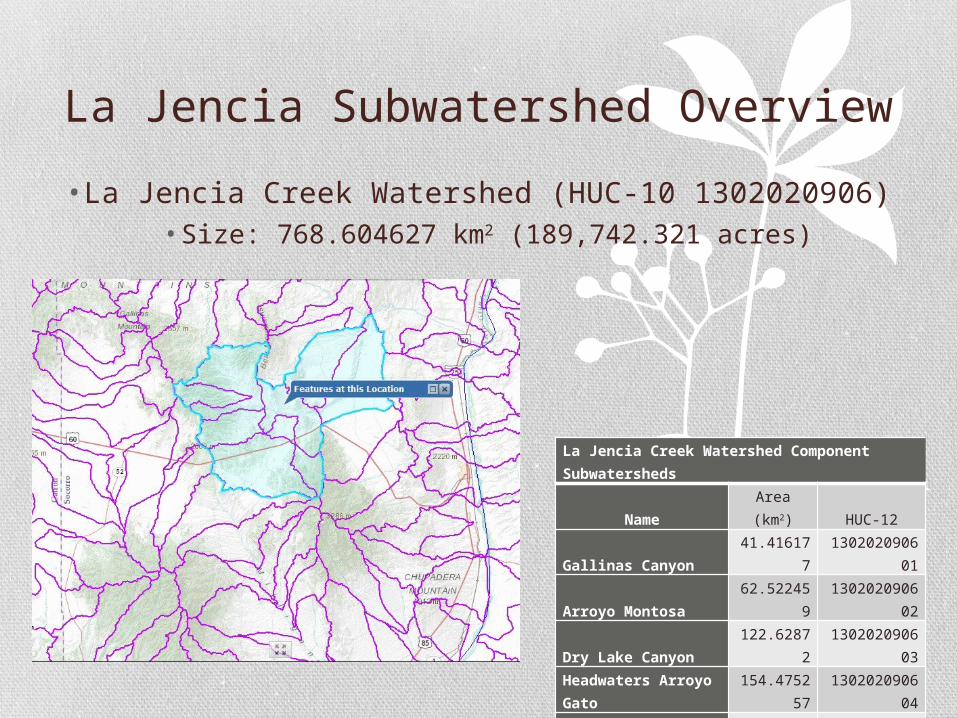
La Jencia Subwatershed Overview
• La Jencia Creek Watershed (HUC-10 1302020906)• Size: 768.604627 km2 (189,742.321 acres)
La Jencia Creek Watershed Component Subwatersheds
NameArea (km2) HUC-12
Gallinas Canyon41.41617
7130202090
601
Arroyo Montosa62.52245
9130202090
602
Dry Lake Canyon122.6287
2130202090
603Headwaters Arroyo Gato
154.475257
130202090604
Outlet Arroyo Gato51.84276
6130202090
605Headwaters La Jencia
83.807294
130202090606
Goat Spring Watershed
107.616287
130202090607
Outlet La Jencia143.5778
07130202090
608
Total767.886
767
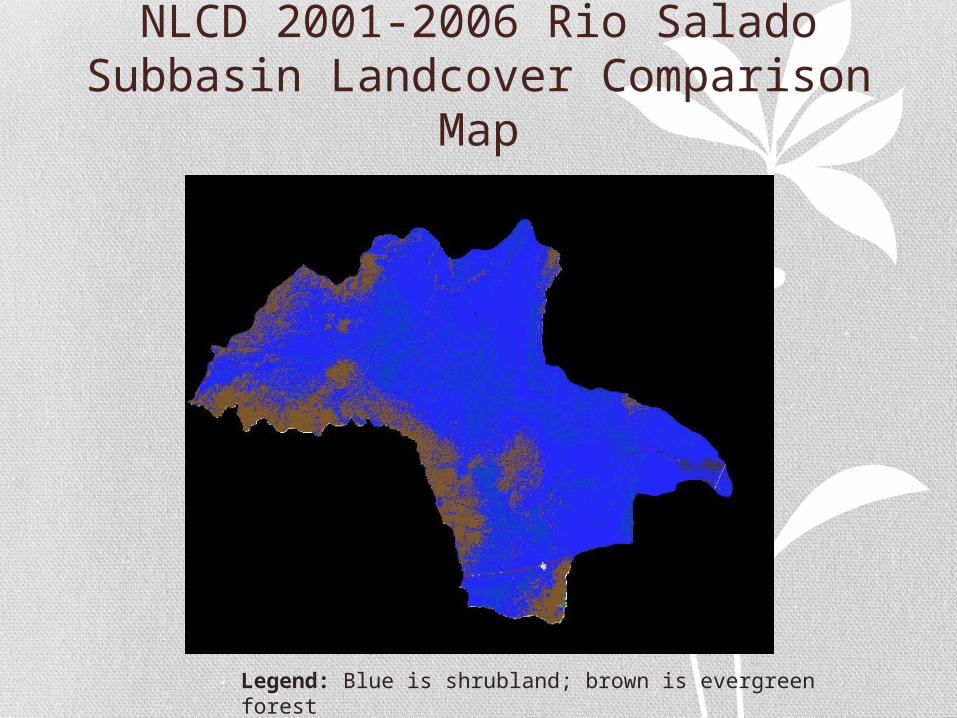
NLCD 2001-2006 Rio Salado Subbasin Landcover Comparison Map
Legend: Blue is shrubland; brown is evergreen forest
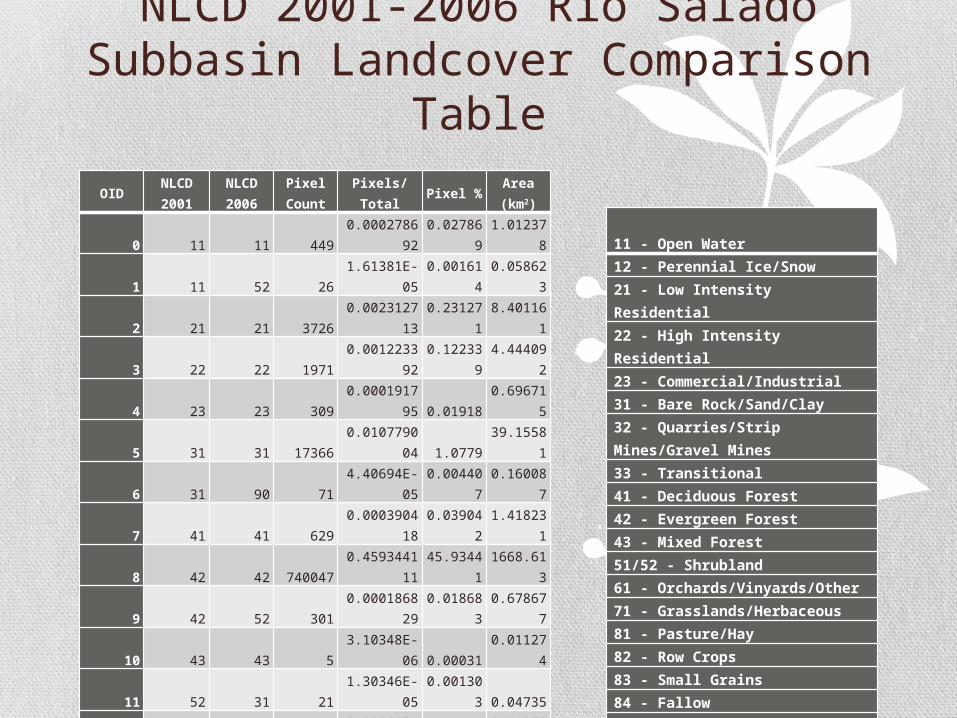
NLCD 2001-2006 Rio Salado Subbasin Landcover Comparison Table
OIDNLCD 2001
NLCD 2006
Pixel Count
Pixels/Total
Pixel %Area (km2)
0 11 11 4490.0002786
920.02786
91.01237
8
1 11 52 261.61381E-
050.00161
40.05862
3
2 21 21 37260.0023127
130.23127
18.40116
1
3 22 22 19710.0012233
920.12233
94.44409
2
4 23 23 3090.0001917
95 0.019180.69671
5
5 31 31 173660.0107790
04 1.077939.1558
1
6 31 90 714.40694E-
050.00440
70.16008
7
7 41 41 6290.0003904
180.03904
21.41823
1
8 42 42 7400470.4593441
1145.9344
11668.61
3
9 42 52 3010.0001868
290.01868
30.67867
7
10 43 43 53.10348E-
06 0.000310.01127
4
11 52 31 211.30346E-
050.00130
3 0.04735
12 52 42 533.28969E-
05 0.003290.11950
1
13 52 52 2698090.1674693
316.7469
3608.349
1
14 52 90 53.10348E-
06 0.000310.01127
4
15 71 52 106.20696E-
060.00062
10.02254
7
16 71 71 5740880.3563340
46 35.63341294.41
9
17 81 52 342.11037E-
05 0.002110.07666
1
18 81 71 95.58626E-
060.00055
90.02029
3
19 81 81 6390.0003966
250.03966
21.44077
9
20 82 82 1740.0001080
01 0.01080.39232
5
21 90 90 13530.0008398
02 0.083983.05066
3
Total161109
5 1 100 3632.6
11 - Open Water12 - Perennial Ice/Snow21 - Low Intensity Residential22 - High Intensity Residential23 - Commercial/Industrial31 - Bare Rock/Sand/Clay32 - Quarries/Strip Mines/Gravel Mines33 - Transitional41 - Deciduous Forest42 - Evergreen Forest43 - Mixed Forest51/52 - Shrubland61 - Orchards/Vinyards/Other71 - Grasslands/Herbaceous81 - Pasture/Hay82 - Row Crops83 - Small Grains84 - Fallow85 - Urban/Recreational Grasses90/91 - Woody Wetlands92 - Emergent Herbaceous Wetlands
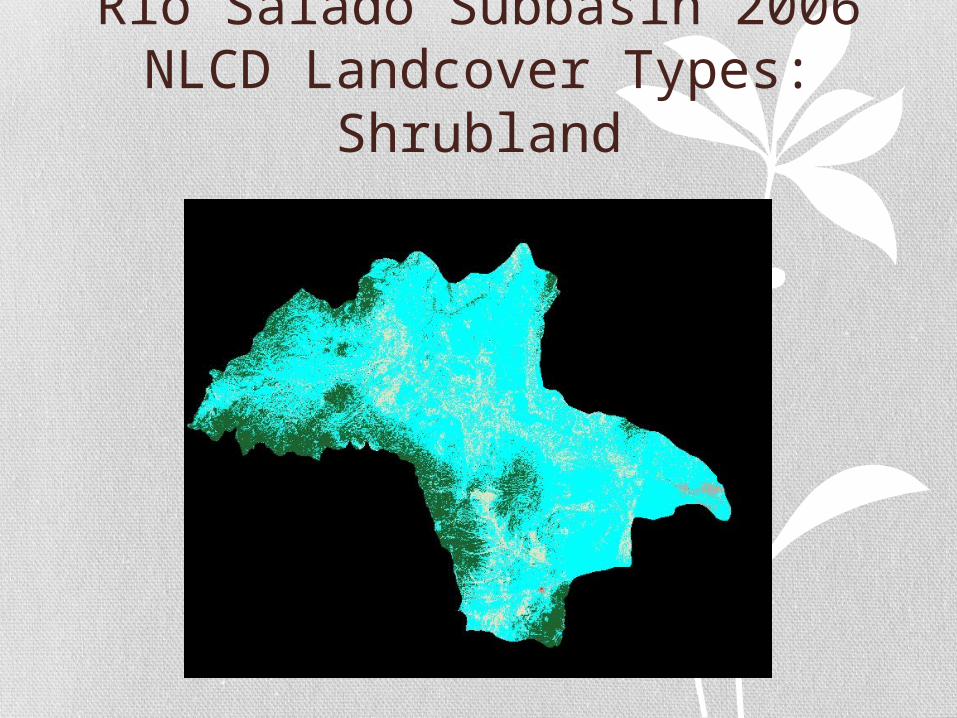
Rio Salado Subbasin 2006 NLCD Landcover Types: Shrubland
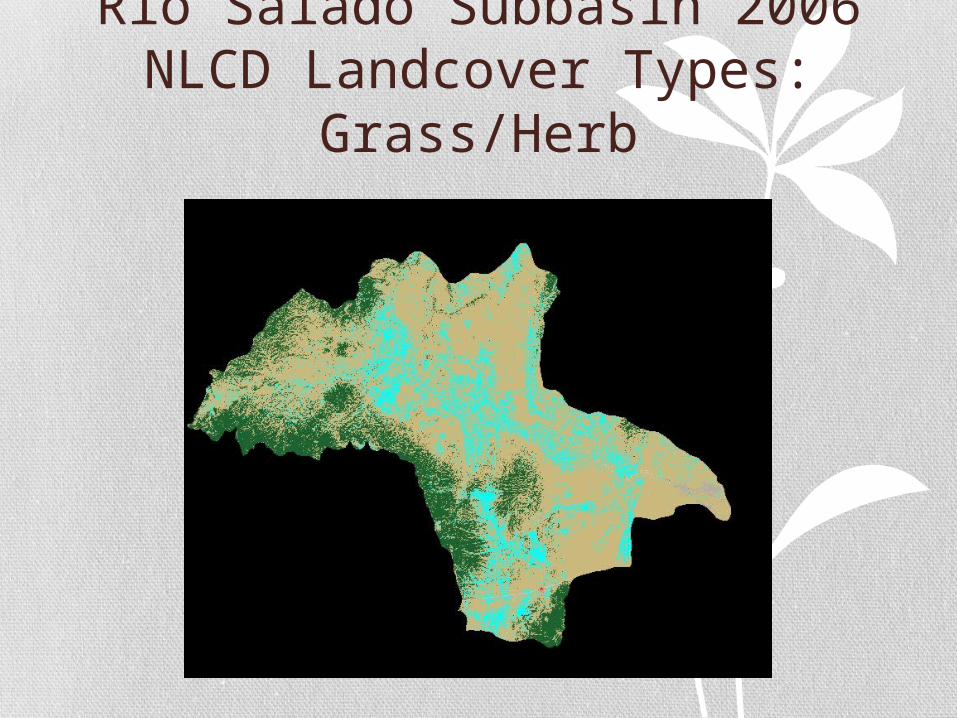
Rio Salado Subbasin 2006 NLCD Landcover Types: Grass/Herb
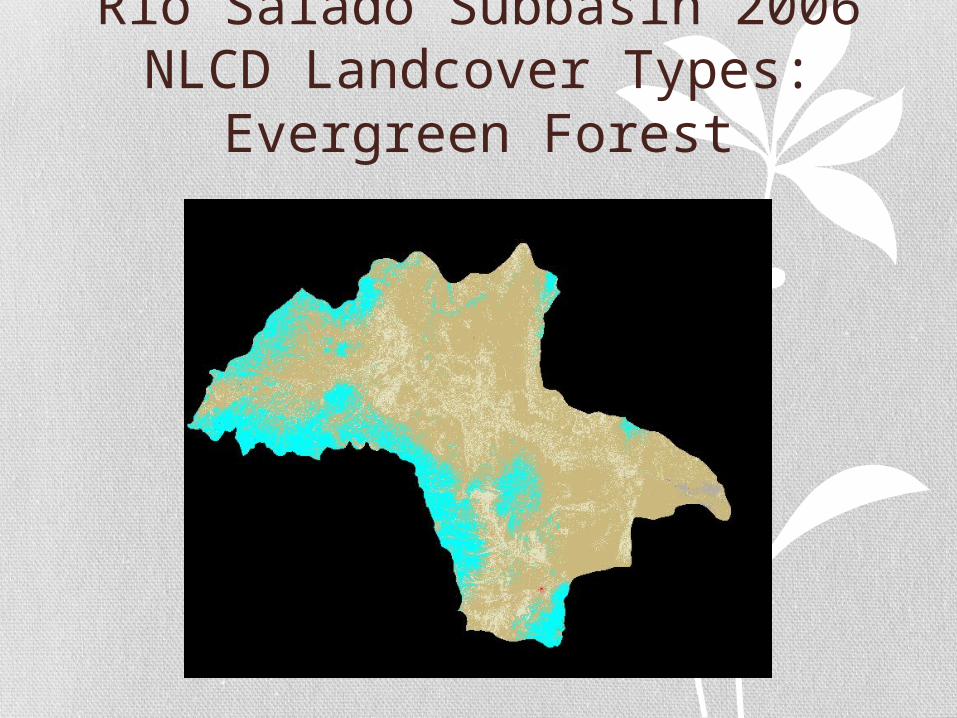
Rio Salado Subbasin 2006 NLCD Landcover Types: Evergreen
Forest
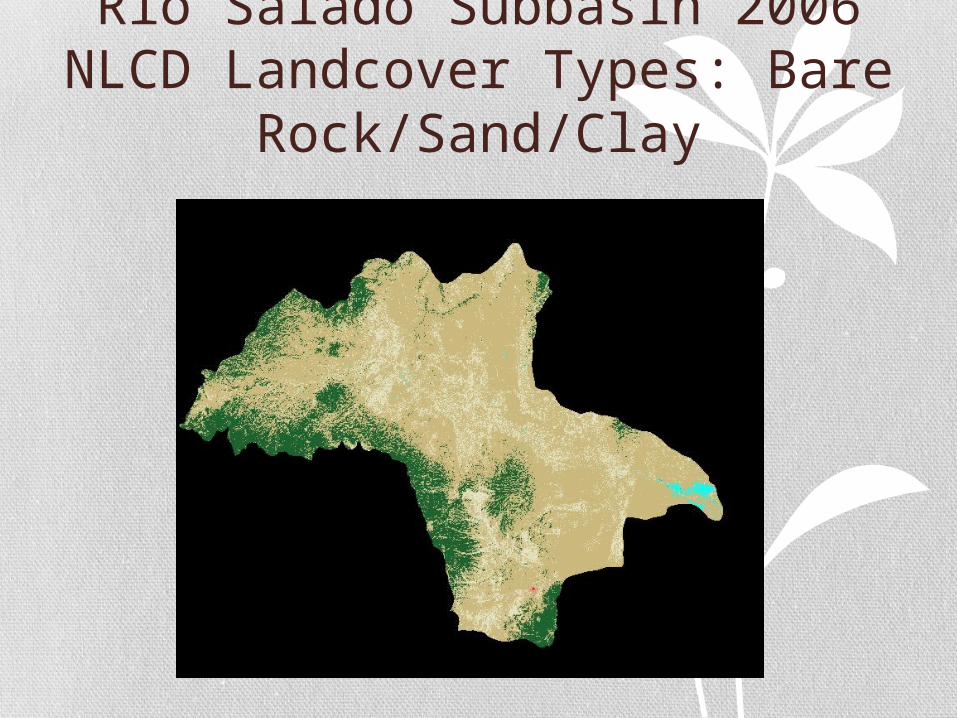
Rio Salado Subbasin 2006 NLCD Landcover Types: Bare
Rock/Sand/Clay
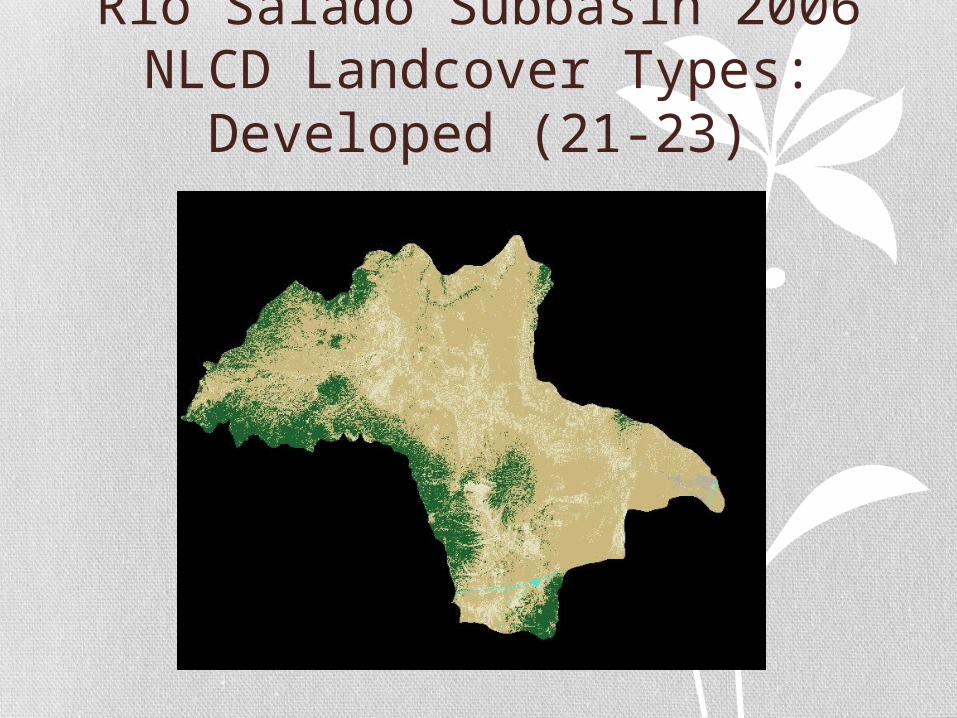
Rio Salado Subbasin 2006 NLCD Landcover Types: Developed
(21-23)
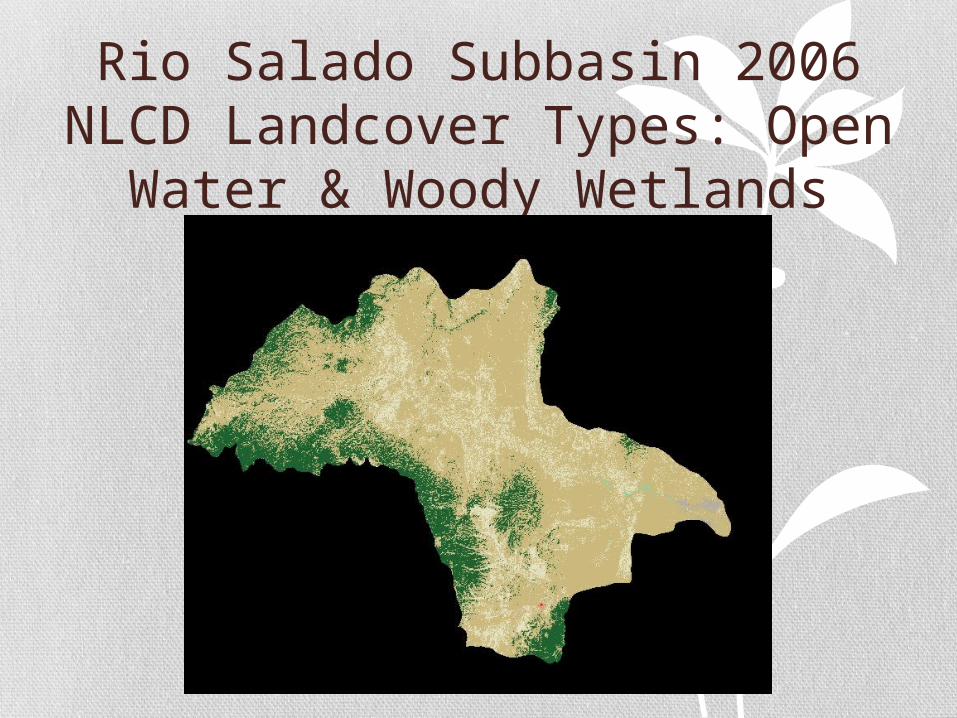
Rio Salado Subbasin 2006 NLCD Landcover Types: Open Water &
Woody Wetlands
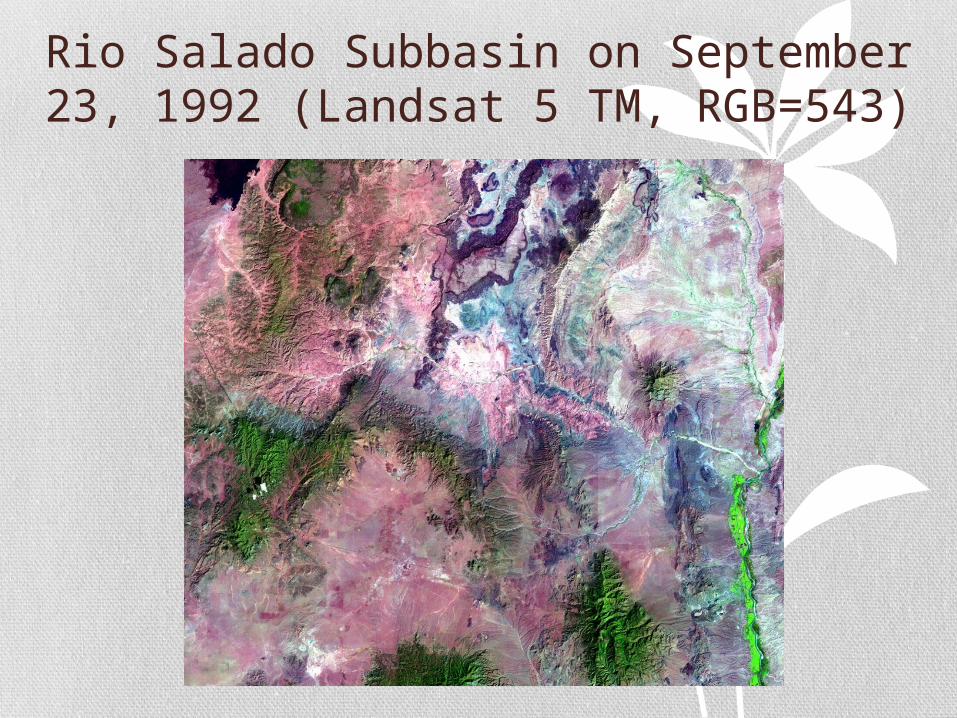
Rio Salado Subbasin on September 23, 1992 (Landsat 5 TM, RGB=543)
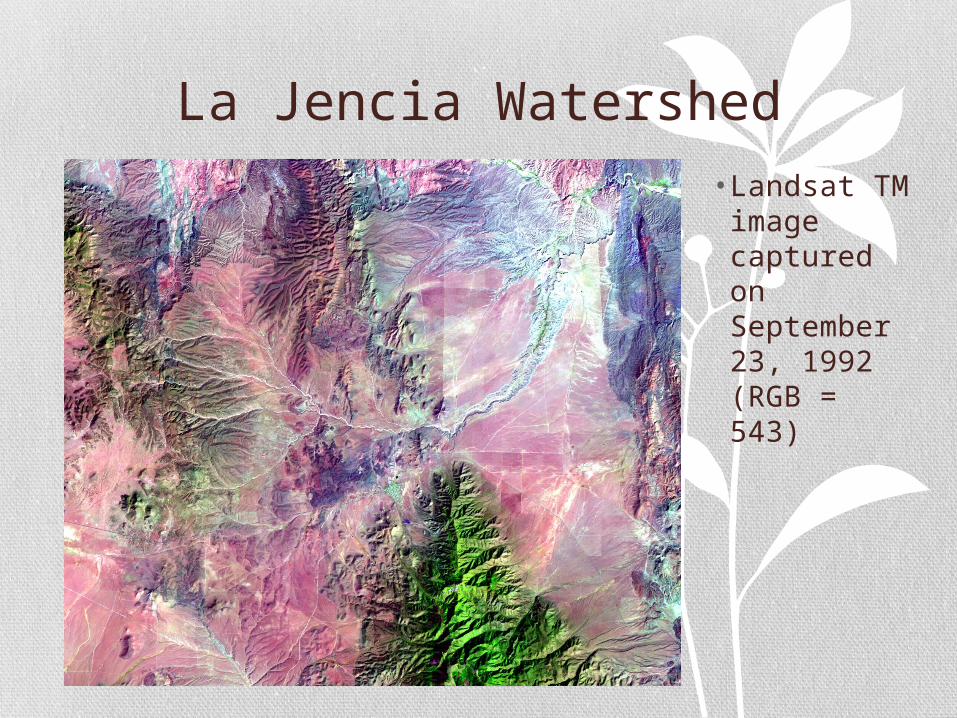
La Jencia Watershed• Landsat TM image captured on September 23, 1992 (RGB = 543)
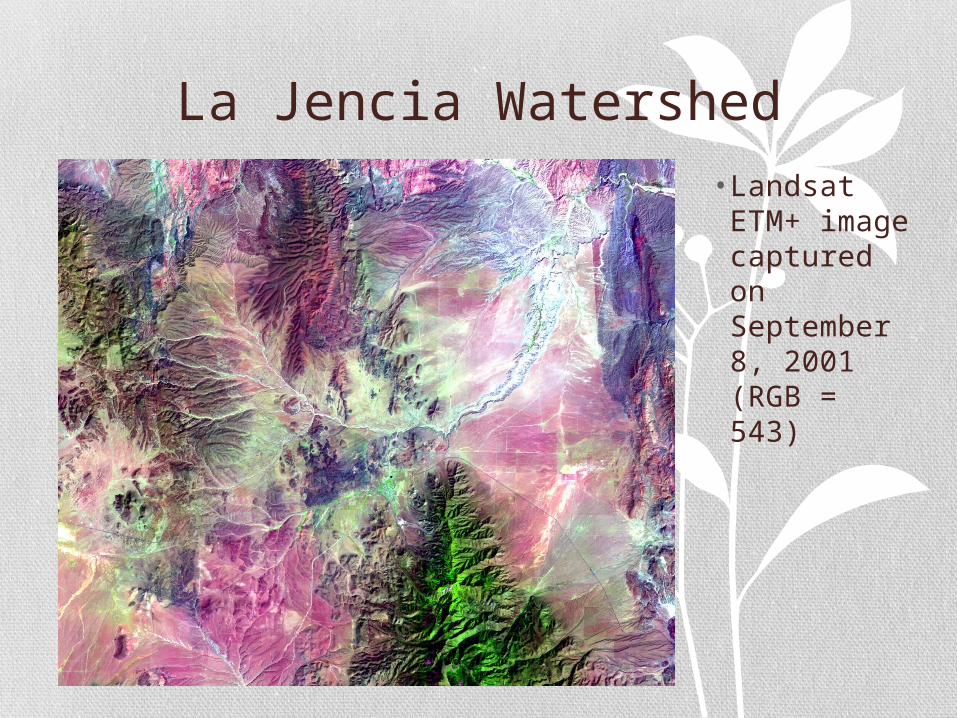
La Jencia Watershed• Landsat ETM+ image captured on September 8, 2001 (RGB = 543)
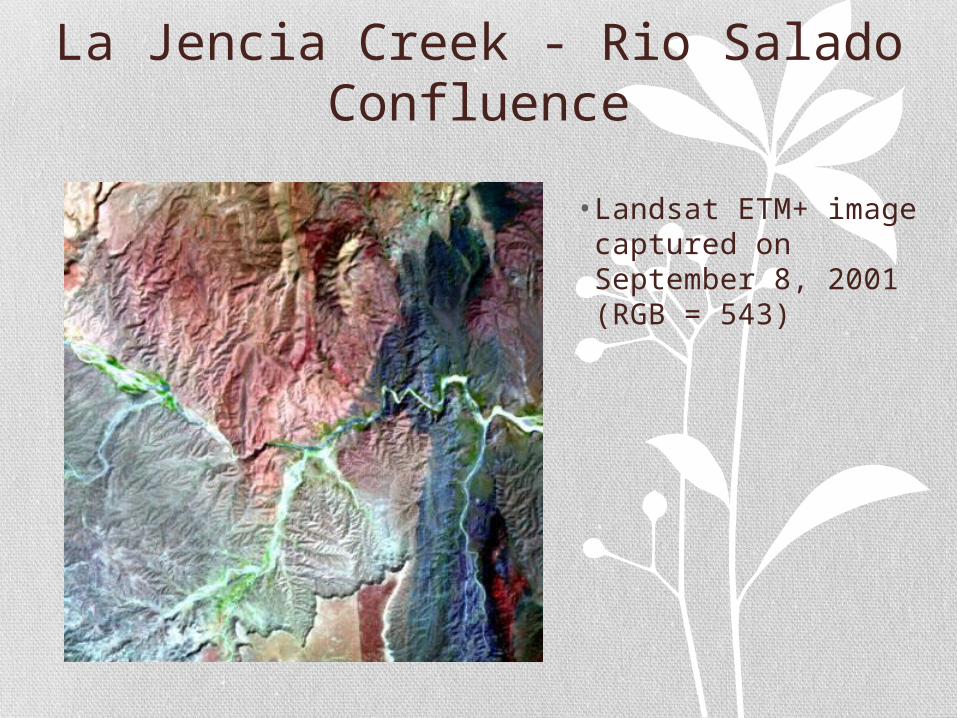
La Jencia Creek - Rio Salado Confluence
• Landsat ETM+ image captured on September 8, 2001 (RGB = 543)
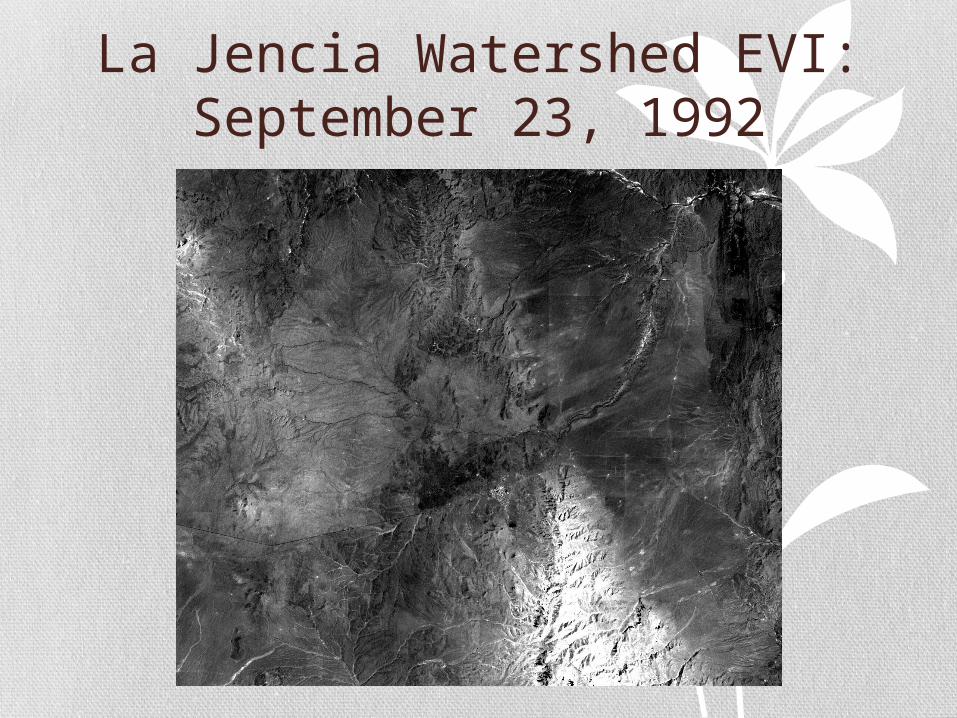
La Jencia Watershed EVI:September 23, 1992
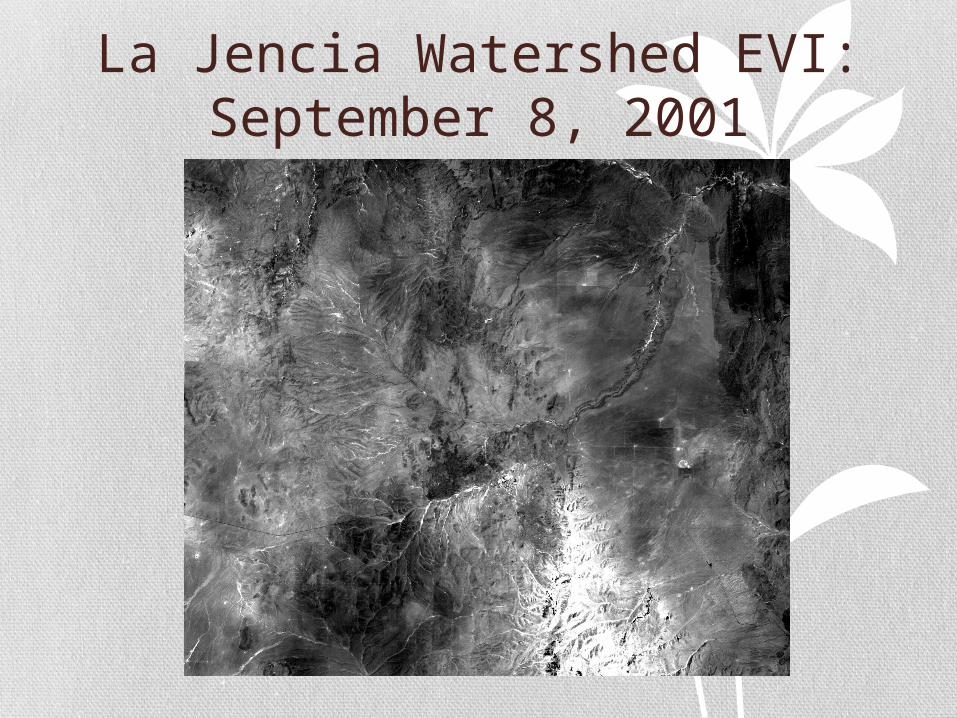
La Jencia Watershed EVI:September 8, 2001
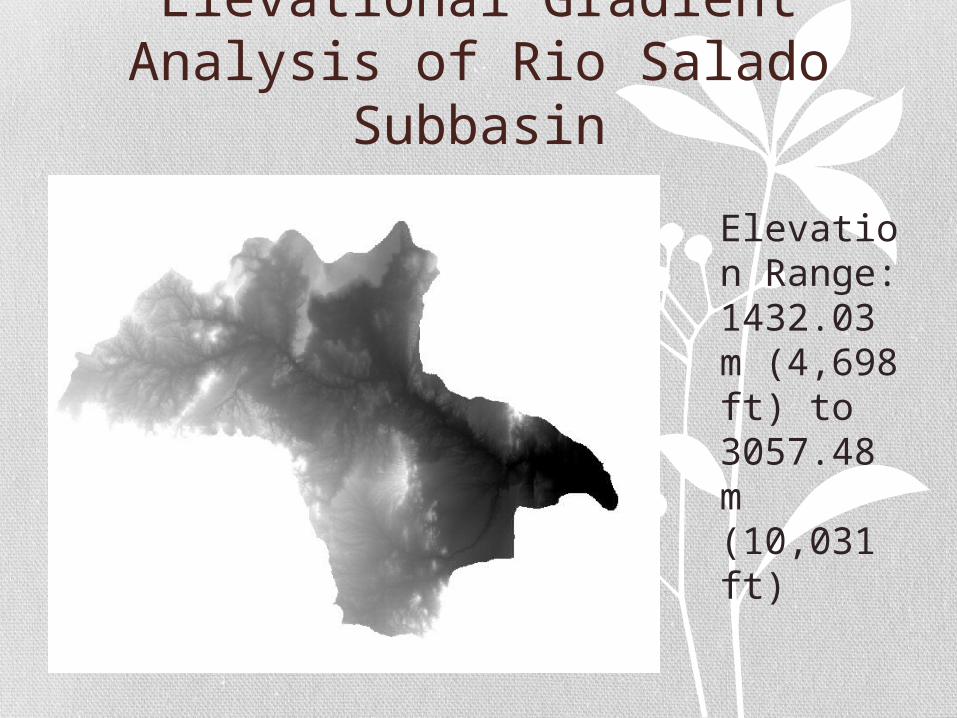
Elevational Gradient Analysis of Rio Salado Subbasin
Elevation Range: 1432.03 m (4,698 ft) to 3057.48 m (10,031 ft)
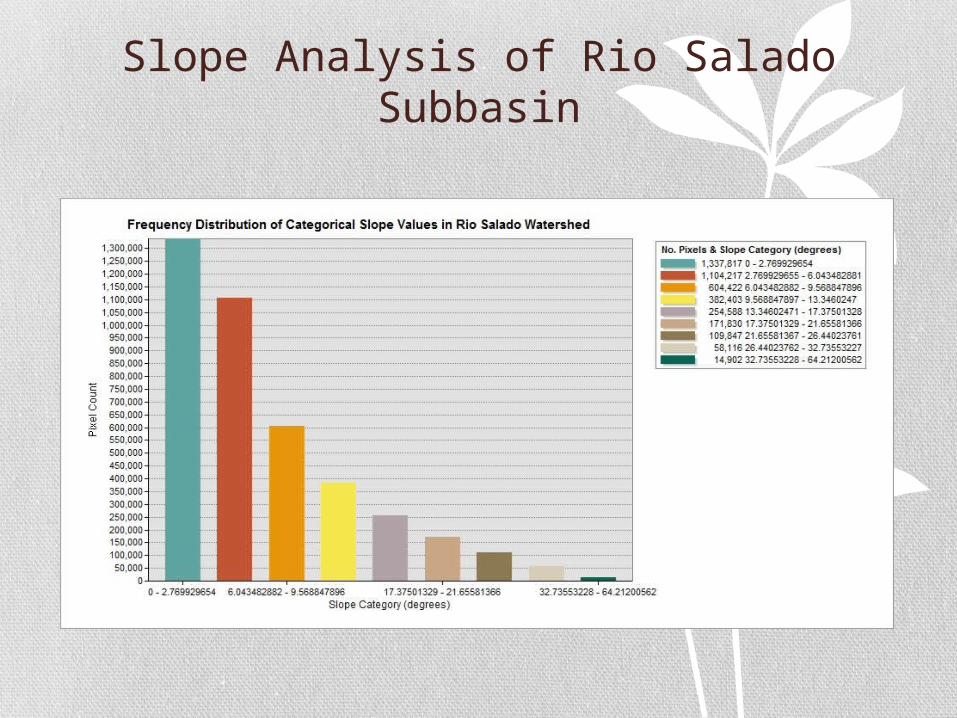
Slope Analysis of Rio Salado Subbasin
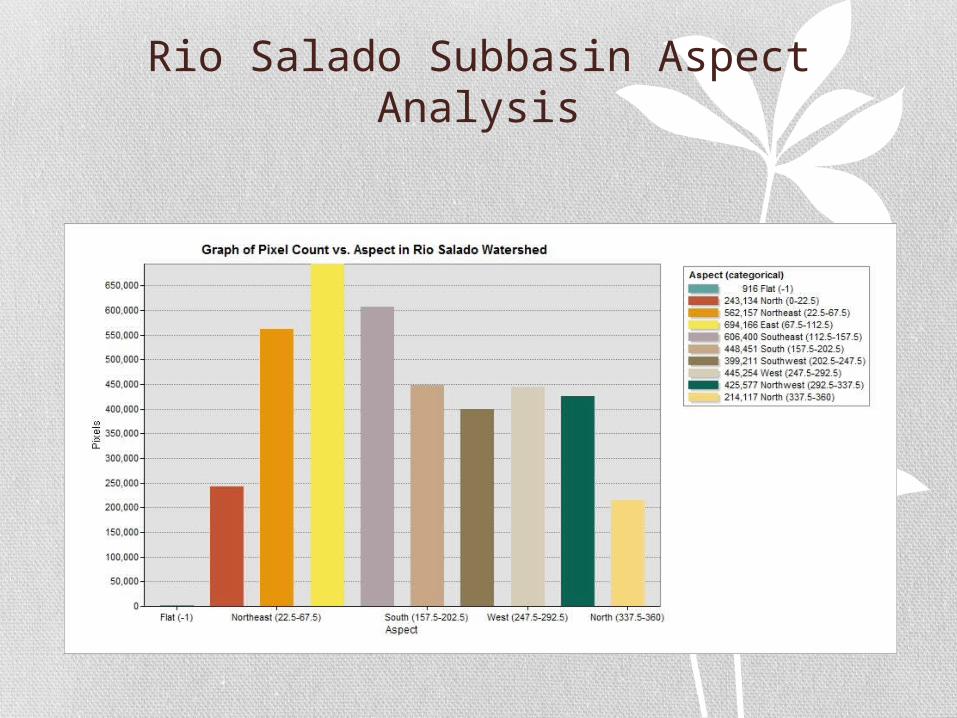
Rio Salado Subbasin Aspect Analysis
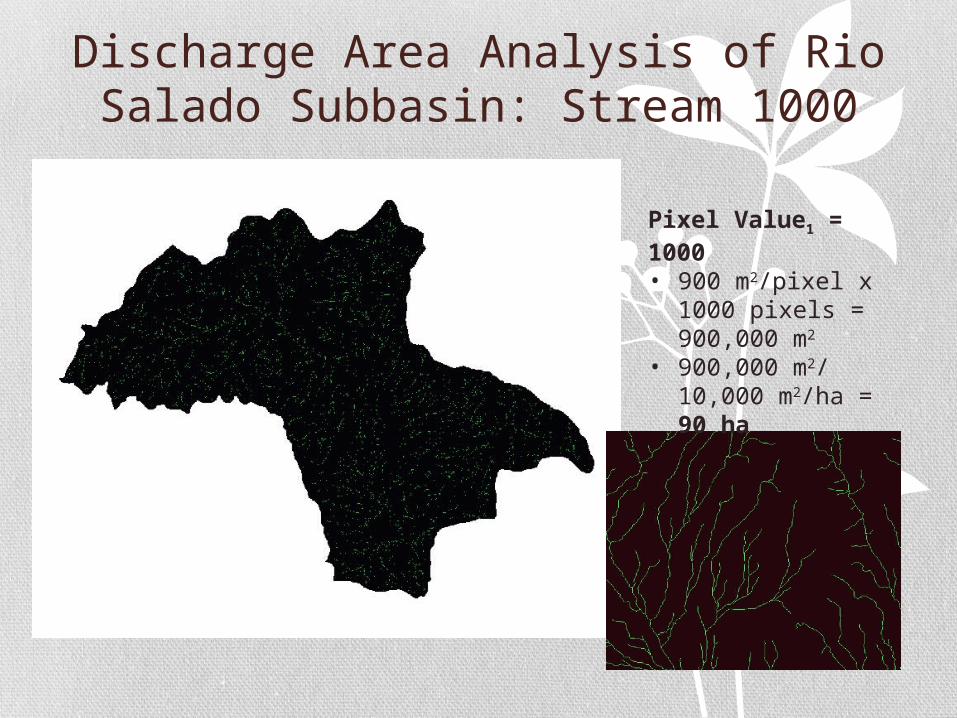
Discharge Area Analysis of Rio Salado Subbasin: Stream 1000
Pixel Value1 = 1000• 900 m2/pixel x
1000 pixels = 900,000 m2
• 900,000 m2/ 10,000 m2/ha = 90 ha
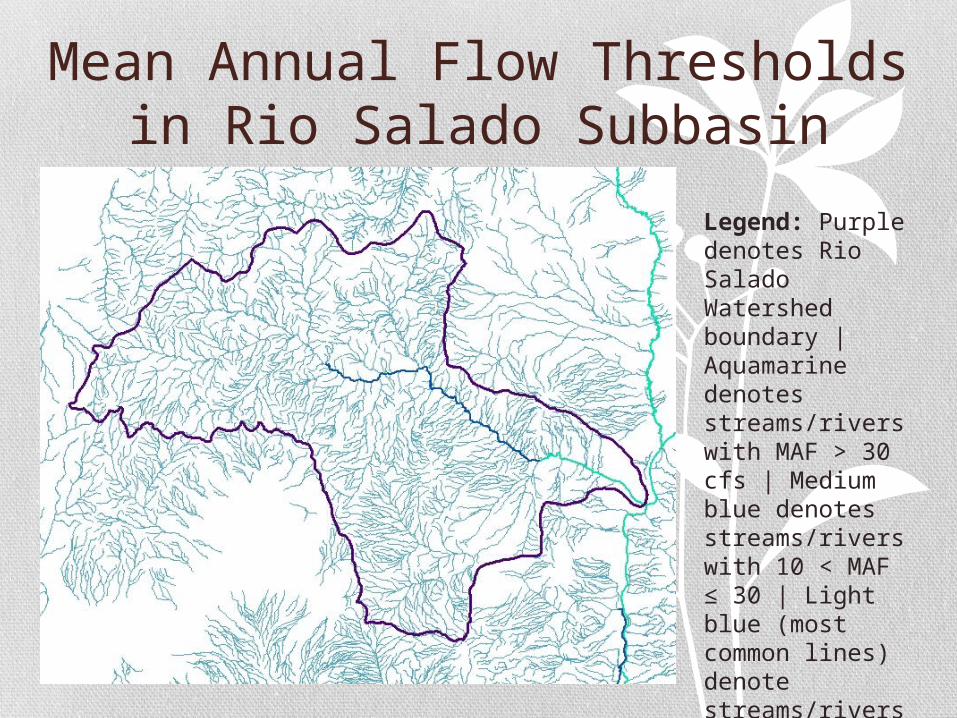
Mean Annual Flow Thresholds in Rio Salado Subbasin
Legend: Purple denotes Rio Salado Watershed boundary | Aquamarine denotes streams/rivers with MAF > 30 cfs | Medium blue denotes streams/rivers with 10 < MAF ≤ 30 | Light blue (most common lines) denote streams/rivers with MAF ≤ 10
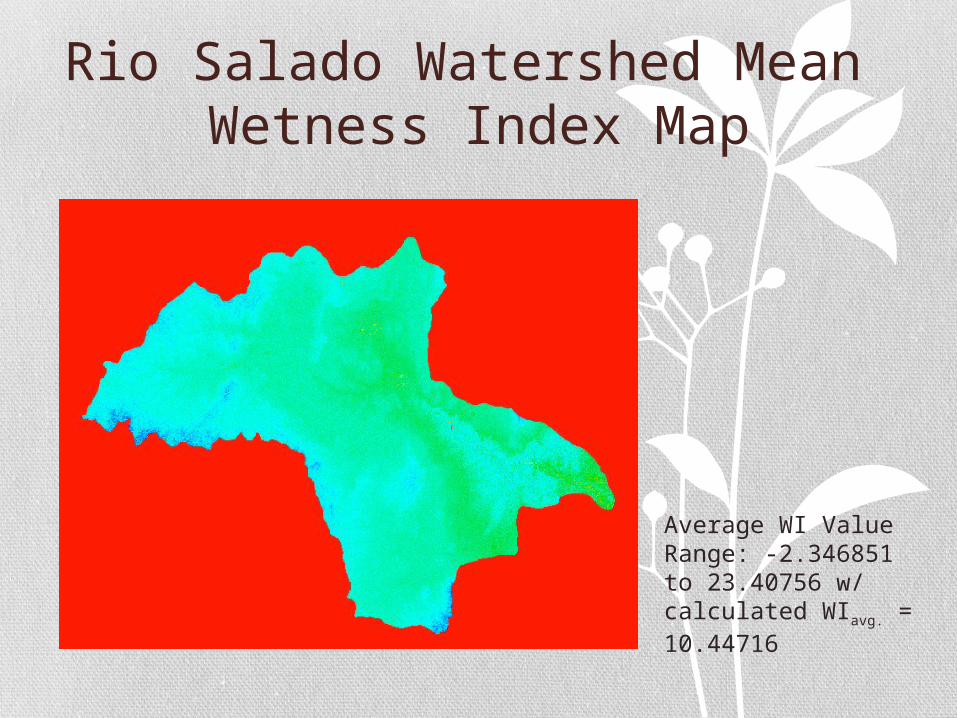
Rio Salado Watershed Mean Wetness Index Map
Average WI Value Range: -2.346851 to 23.40756 w/ calculated WIavg. = 10.44716
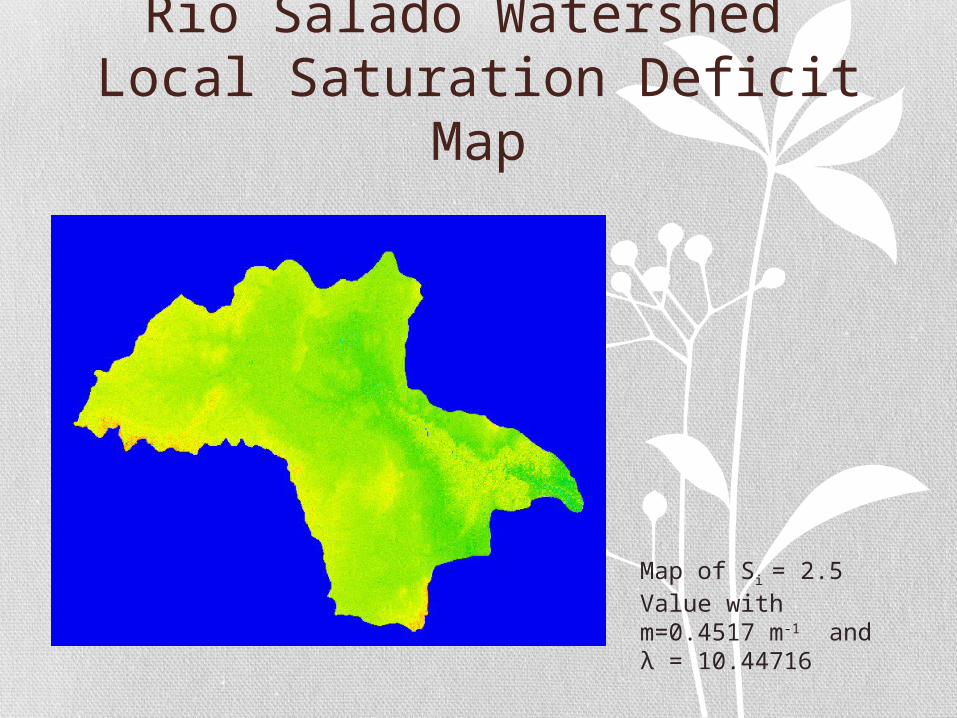
Rio Salado Watershed Local Saturation Deficit Map
Map of Si = 2.5 Value with m=0.4517 m-1 and λ = 10.44716
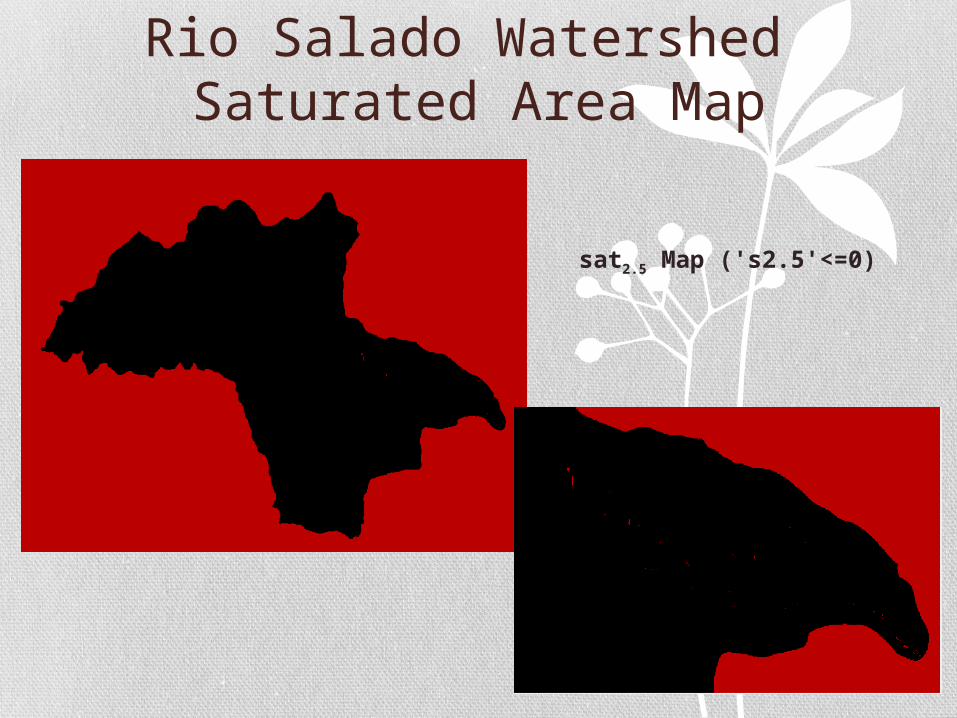
Rio Salado Watershed Saturated Area Map
sat2.5 Map ('s2.5'<=0)
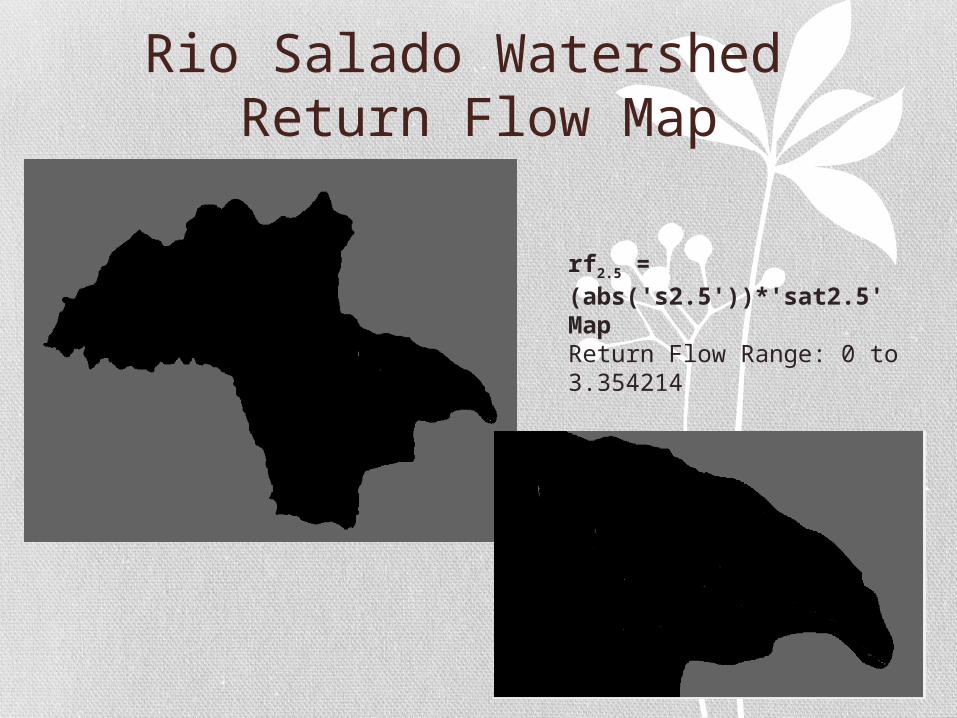
Rio Salado Watershed Return Flow Map
rf2.5 = (abs('s2.5'))*'sat2.5' MapReturn Flow Range: 0 to 3.354214
Thank You!!