Buying Influence: Development Aid between the Cold … · Buying Influence: Development Aid between...
35
Buying Influence: Development Aid between the Cold War and the War on Terror The breathing space between the end of the Cold War and September 11, 2001 provides a unique opportunity to assess the effects of economic aid during a period of low international tensions. Theory suggests that the effects of aid should depend on the donor’s reasons for providing it and on the level of institutional capacity in the recipient country. Quantitative analysis of the aid policies of the United States, France, Britain, Germany, Japan and the EU from 1990-2001 reveals that the donors have different objectives, and Heckman models demonstrate that the effects of aid differ markedly across donors. Aid effectiveness is correlated with donor motivations, and aid sometimes promotes and sometimes retards growth. The strongest growth effects occur when aid is motivated by security externalities and recipients have high institutional capacity. January 2010 Randall W. Stone University of Rochester [email protected]
Transcript of Buying Influence: Development Aid between the Cold … · Buying Influence: Development Aid between...

Buying Influence: Development Aid between the Cold War and the War on Terror
The breathing space between the end of the Cold War and September 11, 2001 provides a unique opportunity to assess the effects of economic aid during a period of low international tensions. Theory suggests that the effects of aid should depend on the donor’s reasons for providing it and on the level of institutional capacity in the recipient country. Quantitative analysis of the aid policies of the United States, France, Britain, Germany, Japan and the EU from 1990-2001 reveals that the donors have different objectives, and Heckman models demonstrate that the effects of aid differ markedly across donors. Aid effectiveness is correlated with donor motivations, and aid sometimes promotes and sometimes retards growth. The strongest growth effects occur when aid is motivated by security externalities and recipients have high institutional capacity.
January 2010
Randall W. Stone University of Rochester

1
Development aid had its origins in the Cold War and was designed to check the
spread of Communism, and in the aftermath of September 11, 2001, development has
once again been subordinated to the priorities of security strategy. During the brief
window between the Cold War and the War on Terror, however, there was an opportunity
for a development agenda to reassert itself. For poor countries, development aid is a
significant feature of the international economy, providing more than 10% of GDP on
average in sub-Saharan Africa. Yet the empirical record is unclear as to whether
development assistance has in fact improved the lot of the global poor; it may not
contribute to economic growth, and may even undermine governance and the rule of law
(e.g. Boone 1996; Alesina and Dollar 2000; Burnside and Dollar 2000; Dalgard and
Hansen 2000; Knack 2001; Svensson 2003). This essay argues that variations in aid
strategies among the major donors during the breathing space of the 1990s provide
leverage to explain why aid is not more effective.
Development assistance produces three kinds of benefits for donors: public
goods, private goods, and security externalities. Economic development is a significant
motivation for development assistance, both because it promotes trade and investment
and because it alleviates human suffering, but these benefits are shared diffusely by
donors, so purely development-motivated assistance is underprovided. The loose
development aid regime—centered on the OECD Development Assistance Committee
and donors conferences sponsored by the UN and the World Bank—promotes norms and
best practices to target aid where it is most needed, but the regime is not very effective,
and its existence is a symptom of the underlying problem. On the other hand, private
benefits of development assistance accrue to narrow commercial and financial interests in

2
the donor countries, and as we have come to expect of foreign economic policies in
democracies, a substantial share of aid is captured by such lobbies (Grossman and
Helpman 1994, Milner and Tingley forthcoming). Foreign aid would be more severely
underprovided if it did not benefit narrow private sector interests, but lobbying distorts
aid allocation and creates credibility problems that undermine the effectiveness of aid at
promoting development. Finally, numerous studies have found that aid is heavily
influenced by the geopolitical interests and foreign policy preferences of the donors (e.g.
Maizels and Nissanke 1984; Boone 1996; Cashel-Cordo and Craig 1997; Schraeder,
Hook and Taylor 1998; Alesina and Dollar 2000; Alesina and Weder 2002). Although
the weight given to particular security concerns varies across donors, security
externalities are widely shared in the donor community, so aid for these purposes again
tends to be underprovided. Security-linked aid is provided largely by the United States,
because the United States plays a sufficiently dominant role in security affairs that other
states can safely free-ride (Stone, Slantchev and London 2008).
Donor motivations are critical, because development aid relies on credible
conditionality to give governments incentives to reform their economic policies and
remove obstacles to growth (Azam and Laffont 2003). When aid distribution follows
objectives other than development, those other objectives will be accomplished instead
(Pietrobelli and Scarpa 1992; Rodrik 1995; Martens et al. 2001).1 Aid that is not tied to
enforceable conditions will expand government consumption, but may not promote
investment, and governments that represent narrow elites will use the extra resources to
1 This interpretation of aid is suggested by studies that found that aid was correlated with lax enforcement of IMF program conditions (Stone 2002, 2004). Similarly, studies of EU environmental aid to Eastern Europe have found that lobbyists from donor countries were able to influence aid flows in ways that were profitable but often ineffective (Connolly and List 1996, Darst 2001).

3
benefit their supporters (Boone 1996, Bueno de Mesquita and Smith 2007). To the extent
that aid is effective in promoting particular goals, it is effective because the conditionality
contract is credible. Pro-development conditionality is weak when donors have concrete
commercial or financial incentives to provide aid to particular countries.
Security externalities provide a mixed set of incentives. On one hand, the United
States has compelling incentives to use its aid to promote economic development in
countries with friendly regimes that are important to long-term U.S. strategies. For
example, U.S. foreign aid to Afghanistan is broadly targeted to promote economic
development, and three-quarters is distributed through NGOs rather than through the
central government. The survival of a viable allied state in Afghanistan is regarded as a
key U.S. security interest, which in turn depends on creating a sufficient level of
economic prosperity. On the other hand, the existence of security externalities creates
credibility problems. Afghanistan again provides examples: the flow of U.S. aid has
fueled hyper-corruption, and the Karzai regime engaged in blatant election fraud in 2009
under the noses of UN observers. The problem is that in very fragile polities, aid donors
face a “compellence dilemma” (Carter 2009): conditionality cannot be enforced because
withdrawing aid would threaten the survival of the regime, and is therefore not a credible
threat. This logic implies that the development effects of security-motivated aid are
conditional on state capacity: aid is beneficial only in countries from which it can
credibly be withheld. Consequently, the empirical tests presented below will use an
interaction term between aid and institutional capacity. There is some evidence, although
the findings are controversial, that aid flows are most effective in political environments
that are receptive to economic reform (Burnside and Dollar 2000, Bräutigam and Knack

4
2005). 2 Furthermore, if the reason for the different effects of aid in different
institutional settings is the credibility of the donor, these interactive effects should be
strongest when strategic externalities are important.
Studies of aid effectiveness generally aggregate aid by recipient without
distinguishing the source, because they are concerned with testing hypotheses about
direct effects of aid on development in the form of resource flows. If development
depends primarily on policies rather than resources, however, the hypothesis should be
that aid affects development by inducing leaders to carry out reforms. Therefore, the
research design should look for independent effects of aid from particular donors.
Studies of the aid allocations of multiple donors find that the reasons for giving aid vary
enormously (Svensson 1999, Alesina and Dollar 2000, Alesina and Weder 2002,
Neumayer 2003). If different donors give aid for different reasons, we can expect the
conditions they apply to differ as well, so a differentiated empirical design can shed light
on aid effectiveness. U.S. aid, which comes with one set of incentives, may have
different effects than German or British aid, which are attached to different conditions
and priorities. This also suggests a methodological reason to disaggregate aid by donor.
The first generation of studies of aid effectiveness failed to account for selection
effects—e.g., aid may appear to be harmful, or less beneficial than it really is, because it
is not distributed to the countries with the best growth prospects, and subsequent studies
have responded to this concern. If the motives of donors vary, however, the selection
corrections that apply to their aid should vary as well.
2 While the methods, data and results in the Burnside and Dollar study have been controversial, the conclusion that institutions mediate the effectiveness of aid is widely accepted. See Easterly, Levine and Roodman 2004, Doucouliagos and Paldam, 2008.

5
The hypothesis to be tested is that the effectiveness of foreign aid is compromised
by the political objectives that motivate donors to provide it, because the donors’ political
agendas undermine the enforcement of conditionality. The research design exploits the
fact that multiple donors give aid with a variety of motivations. Throughout, the analyses
are run separately on aid from six donors—the United States, France, Britain, Germany,
Japan, and the European Union—for the period 1990-2001, using data for all countries
that were not aid donors. In the first stage of the analysis I develop a picture of donors’
motivations, using a probit model to analyze the selection of aid recipients, and OLS to
analyze the amount of aid disbursed, conditional on receiving aid. The results confirm
that motivations vary substantially across donors. In the second stage of the analysis I
test for effects of foreign aid on growth rates, using a FIML Heckman model to control
for selection effects, and compare the results across aid donors.
I find that the effects of foreign aid vary substantially across donors, which
suggests that the motivations of the donor play a critical role in determining the effect of
the aid. In particular, donors that are strongly motivated by commercial and financial
interests are ineffective at promoting growth, and it is notable in this respect that the
European Union is no more effective at promoting growth than its member states.
Strikingly, the most effective form of aid at promoting development appears to be aid
designed to create security externalities. However, this effect depends upon the capacity
of the aid recipient. The United States and France, which are most strongly motivated by
security concerns, are most effective in promoting growth in high-capacity countries, but
French aid is ineffective in low-capacity countries, and U.S. aid significantly retards
6
growth in those cases. This suggests that it will be difficult to achieve U.S. objectives in
countries such as Afghanistan, Pakistan and Iraq.
Distribution of aid
I take advantage of the substantial empirical literature that has accumulated on the
distribution and effects of foreign aid. We have learned that the selection of aid
recipients and the distribution of aid budgets among recipients are driven by distinct
priorities. This calls for attention both to the selection of recipients and to the distribution
of aid among the recipients. A wide range of studies has provided a rich set of
hypotheses, in addition to a few novel ones that I introduce, so the models do a good job
of explaiing the distribution of aid.
Tables A1 and A2 in the appendix present the full results of models of the
selection of aid recipients using probit, and of the distribution of aid dollars conditional
on receiving aid using OLS, respectively. These models are based upon a substantial
literature that has found that the distribution of aid is biased in various ways: towards
small countries, towards countries with congruent political perspectives, towards
countries in particular regions of the world, towards former colonies, and towards trading
partners. Indeed, if there is a single finding on which the foreign aid literature speaks
unanimously, it is that foreign aid is not distributed impartially. Need-based criteria are
important, as are broad political objectives such as promoting democracy, but the
commercial and geopolitical agendas of the donors are critical and shift aid away from
need-based allocations (Boone 1996; Alesina and Dollar 2000; Collier and Dollar 2002).
The results broadly support these findings. In the following, I combine the results of the

7
probit and OLS analyses to highlight the effects of three clusters of variables of interest:
humanitarian variables, economic concerns, and strategic interests, which represent
public goods, private goods, and security externalities, respectively.
The first set of variables that explain the distribution of foreign aid represent the
formal eligibility criteria based upon economic need, and these have effects that are
consistent across donors. Table 1 displays the effects of four variables (in columns)
across regressions using data for different donors (in rows). Under each variable, the first
column represents the predicted substantive effect on the probability of receiving aid,
with its associated standard error and p-value, and the third represents the OLS
coefficient for the amount of aid disbursed. The most significant effects are for pure
relief aid. I use aid from the UN High Commissioner for Refugees (UNHCR) as a
measure of extreme humanitarian need, and find that across the board, donors are
significantly more likely to aid countries that are receiving aid from UNHCR. UNHCR
aid did not significantly affect the levels of aid provided by France and Germany, but did
increase aid levels provided by the United States, Britain, Japan and the EU: one dollar
of UNHCR aid was matched by an additional $1.06 from the United States, $0.24 from
Britain, $0.69 from Japan, and $0.94 from the EU.

8
Table 1: Effects of Humanitarian Variables (Public Goods)Aid receipt (probit) and aid amounts (OLS)
Amount
dF/dx p Coef. p dF/dx p Coef. p dF/dx p Coef. p dF/dx p Coef. pStd. Err. Std. Err. Std. Err. Std. Err. Std. Err. Std. Err. Std. Err. Std. Err.
U.S. 3.8% 0.00 1.06 0.02 -0.0025% 0.00 -0.0028 0.07 0.006% 0.54 -0.011 0.74 0.002% 0.60 -0.0009 0.780.6% 0.46 0.0004% 0.0015 0.010% 0.034 0.003% 0.0032
France 2.7% 0.00 0.02 0.85 -0.0005% 0.00 -0.0005 0.01 0.001% 0.78 -0.011 0.09 0.001% 0.64 0.0001 0.850.3% 0.10 0.0001% 0.0002 0.005% 0.007 0.001% 0.0007
UK 4.0% 0.00 0.24 0.00 -0.0007% 0.00 -0.0006 0.00 -0.001% 0.83 0.021 0.00 0.001% 0.58 0.0000 0.990.3% 0.05 0.0002% 0.0001 0.005% 0.004 0.002% 0.0004
Germany 1.4% 0.00 0.28 0.43 -0.0001% 0.00 -0.0007 0.25 0.000% 0.99 -0.031 0.16 6.8E-07 0.69 0.0002 0.950.6% 0.35 0.0000% 0.0006 0.001% 0.022 1.7E-06 0.0025
Japan 1.3% 0.00 0.69 0.00 -0.0006% 0.00 -0.0007 0.10 -0.015% 0.02 0.011 0.47 0.001% 0.66 -0.0005 0.740.3% 0.22 0.0002% 0.0004 0.006% 0.015 0.002% 0.0016
EU 0.9% 0.00 0.94 0.00 -0.0001% 0.00 -0.0019 0.00 0.000% 0.86 -0.008 0.42 4.2E-07 0.68 -0.0003 0.780.7% 0.16 0.0001% 0.0004 0.000% 0.010 1.1E-06 0.0011
Pr(Aid) Amount Pr(Aid)Population (millions)GDP per capita Debt/GDPUNHCR
Pr(Aid) AmountPr(Aid) Amount
Income also has an effect that is statistically significant and robust, but the effects
are very small. Across the board, poorer countries are more likely to receive aid than
wealthier countries, and are expected to receive more from each donor. Thus, countries
with per capita GDP under the international poverty line of $1 per day were 4% more
likely to receive U.S. aid than the average country that was not an aid donor ($8.76 per
day). Of the forty-two countries—most small African countries—that met this criterion
for part or all of the time series, twenty-five received U.S. foreign aid. Those countries
that are aid recipients receive more aid if they are poor, but again the effects are modest.
Countries with per capita GDP of $1 per day received an average of $7.9 million more
than the average country from the United States, $1.4 million more than the average
country from France, $1.8 million from the United Kingdom, and $5.9 million from the
European Union. On a per capita basis, of course, these magnitudes are very small: the
total effect of poverty on aid from the United States, the United Kingdom, France and the
EU amounts to $0.49 per person per year for the average country of 35 million. Indeed,
had we not controlled for the fixed effects for Israel and Egypt, U.S. aid would exhibit
the opposite trend, being distributed disproportionally to wealthier countries rather than

9
to poorer ones. In short, foreign aid generally responds in a symbolic and half-hearted
way to international poverty.
A third humanitarian variable of interest is population. Aid distribution is biased
against large countries, which receive substantially less aid than smaller countries in per
capita terms. Only British aid allocations increase with population even in absolute
terms, and British aid, too, declines in per capita terms. French aid actually decreases in
absolute terms as a function of population. This suggests non-humanitarian motivations,
since the scale of need is related to population. A likely explanation is that the leaders of
large countries are less susceptible to being influenced by foreign aid because their tax
bases are so much larger. If aid is intended to buy influence, its marginal productivity is
highest in small countries.
Finally, bilateral development aid does not appear to respond in any systematic
way to international indebtedness as a proportion of GDP. The results for aid eligibility
are mixed, some negative and some insignificant, but indicate that countries are
indifferent or less inclined to extend aid when countries become highly indebted.
Similarly, there are no significant relationships between debt levels and levels of aid.
This may be related to the risk of becoming involved in an expensive debt bailout, or a
high level of debt may be regarded as a symptom of poor governance. In any case, it is
clear that donors are not eager to rush in to help countries that become highly indebted.
There was widespread concern at the outset of the 1990s that sovereign debt had mired
developing countries in a low-development trap, and numerous initiatives sought to link
debt relief to environmental progress. Nevertheless, during the 1990s, debt did not make
10
countries more likely to receive development aid or likely to receive more of it.3 In
summary, humanitarian concerns, while clearly a part of the calculus of development aid,
constitute only a small part of the motivations for bilateral aid flows.
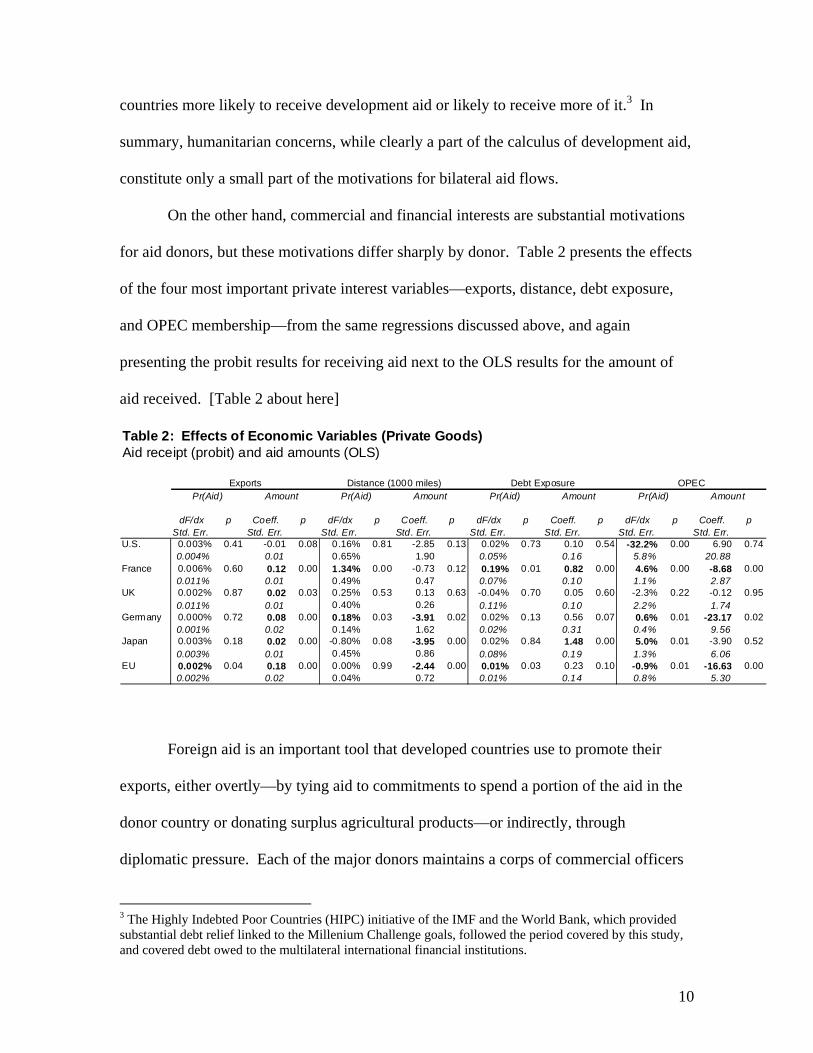
On the other hand, commercial and financial interests are substantial motivations
for aid donors, but these motivations differ sharply by donor. Table 2 presents the effects
of the four most important private interest variables—exports, distance, debt exposure,
and OPEC membership—from the same regressions discussed above, and again
presenting the probit results for receiving aid next to the OLS results for the amount of
aid received. [Table 2 about here]
Table 2: Effects of Economic Variables (Private Goods)Aid receipt (probit) and aid amounts (OLS)
dF/dx p Coeff. p dF/dx p Coeff. p dF/dx p Coeff. p dF/dx p Coeff. pStd. Err. Std. Err. Std. Err. Std. Err. Std. Err. Std. Err. Std. Err. Std. Err.
U.S. 0.003% 0.41 -0.01 0.08 0.16% 0.81 -2.85 0.13 0.02% 0.73 0.10 0.54 -32.2% 0.00 6.90 0.740.004% 0.01 0.65% 1.90 0.05% 0.16 5.8% 20.88
France 0.006% 0.60 0.12 0.00 1.34% 0.00 -0.73 0.12 0.19% 0.01 0.82 0.00 4.6% 0.00 -8.68 0.000.011% 0.01 0.49% 0.47 0.07% 0.10 1.1% 2.87
UK 0.002% 0.87 0.02 0.03 0.25% 0.53 0.13 0.63 -0.04% 0.70 0.05 0.60 -2.3% 0.22 -0.12 0.950.011% 0.01 0.40% 0.26 0.11% 0.10 2.2% 1.74
Germany 0.000% 0.72 0.08 0.00 0.18% 0.03 -3.91 0.02 0.02% 0.13 0.56 0.07 0.6% 0.01 -23.17 0.020.001% 0.02 0.14% 1.62 0.02% 0.31 0.4% 9.56
Japan 0.003% 0.18 0.02 0.00 -0.80% 0.08 -3.95 0.00 0.02% 0.84 1.48 0.00 5.0% 0.01 -3.90 0.520.003% 0.01 0.45% 0.86 0.08% 0.19 1.3% 6.06
EU 0.002% 0.04 0.18 0.00 0.00% 0.99 -2.44 0.00 0.01% 0.03 0.23 0.10 -0.9% 0.01 -16.63 0.000.002% 0.02 0.04% 0.72 0.01% 0.14 0.8% 5.30
Pr(Aid) Amount Pr(Aid) Amount Pr(Aid) Amount Pr(Aid) AmountExports Distance (1000 miles) Debt Exposure OPEC
Foreign aid is an important tool that developed countries use to promote their
exports, either overtly—by tying aid to commitments to spend a portion of the aid in the
donor country or donating surplus agricultural products—or indirectly, through
diplomatic pressure. Each of the major donors maintains a corps of commercial officers
3 The Highly Indebted Poor Countries (HIPC) initiative of the IMF and the World Bank, which provided substantial debt relief linked to the Millenium Challenge goals, followed the period covered by this study, and covered debt owed to the multilateral international financial institutions.

11
in recipient countries dedicated to promoting their respective exports. In addition, aid
allocations take place in the shadow of negotiations over bilateral trade and investment
treaties, and negotiations that take place in the WTO or in regional forums about trade
restrictions and trade preferences. Aid is a potent bargaining chip to use with many small
countries, and the effects of trade prospects on aid distribution are substantial. Exports
are associated with only a slightly higher probability of receiving aid, and the effects are
significant only for the EU. Trade has substantial effects on aid volumes, however. One
million dollars of export trade is translated into $120,000 of French aid, $20,000 of
British aid, $85,000 of German aid, $20,000 of Japanese aid, and $180,000 of EU aid. In
spite of legal linkages between U.S. aid and exports, the United States is the only country
that does not allocate more aid to countries that absorb its exports when controlling for
other influences. A result of the linkage between trade and aid is that aid is shifted to
countries that are able to absorb developed-country exports, and away from the countries
that are least able to afford them.
Previous studies have generally found that aid declines with distance, and this is
generally the case in terms of aid receipts here, as well.4 There is no consistent pattern
with respect to the selection of aid recipients, and France and Germany are slightly more
likely to provide aid to distant countries. On the other hand, distance is clearly associated
with lower amounts of aid, reflecting weaker interest in more distant countries. The
effect is significant for Germany, Japan and the EU, and marginally significant for the
United States and France. Distance is an important factor in international trade, which is
reflected in gravity models of trade flows based on distance, but it remains significant
4 Distance is measured in miles between the recipient’s capital and Washington for U.S. aid, Tokyo for Japanese aid, and Paris for European donors.

12
when controlling for trade because it captures a variety of other motivations, such as
concerns about immigration and refugees. In the case of the EU, the regional focus
reflects the emphasis on expansion into Eastern Europe and the former Soviet Union after
the end of the Cold War, which was pioneered by the PHARE and TACIS aid programs
that transformed EU aid policy during the 1990s (see Table A2 for the full table of
results).
Another important donor interest is assuring the timely repayment of developing-
country debt, and aid is diverted for this purpose as well, but the effects differ markedly
across donors.5 Most aid recipients are highly indebted countries, and the aid donors
represent the creditors that attempt to enforce repayment or finance debt restructuring
when this becomes necessary. Once a country becomes involved in the debt rescheduling
process, other forms of private financing evaporate, and official aid becomes a much
more important incentive to keep debtor countries repaying their debts. As noted above,
aggregate debt levels do not motivate donors to increase aid, and the results in Table A2
indicate that the same is true of debt arrears. In contrast to these public benefits of
avoiding default, private incentives are compelling. Debt exposure captures the degree to
which a donor country stands to lose from a developing country’s default, measured as
the percentage of the country’s foreign debt denominated in the donor country’s
currency. The results indicate substantial variation in the degree to which donors are
motivated by this concern when they contribute to working out debt crises. For France
and the EU (where debt exposure is measured as the fraction of debt in French francs),
higher levels of exposure lead to higher probabilities of extending aid. For France, Japan,
5 Tomz (2007) demonstrates that trade sanctions and military intervention have not been used systematically to facilitate debt collection, arguing that the evidence points to a reputational model of debt repayment. He does not investigate the role of aid flows, however.

13
Germany (p=.07) and the EU (p=.1), higher exposure leads to greater amounts of aid, as
well. The effects are starker when translated into dollars: 10% exposure in francs leads
to $8.2 million in annual French aid and $2.3 million in EU aid, 10% exposure in DM is
associated with $5.6 million in German aid, and 10% exposure in yen leads to $14.8
million in Japanese aid. France, Germany and Japan have the most concentrated patterns
of bank lending, and consequently have the strongest interests in sustaining repayment
and make the most substantial contributions. Other donors’ aid policies appear to be
much less substantially motivated by debt collection.
The politics of oil weighs heavily in the distribution of aid. While the United
States and the European Union are less likely to give aid to members of OPEC than to
non-members, France, Germany and Japan are more likely to give aid to OPEC members.
The only OPEC members to receive aid from the United States during this period were
Nigeria and Venezuela, while France, Germany and Japan also aided Kuwait, Libya,
Qatar, Saudi Arabia, and the United Arab Emirates. These additional recipients did not
qualify for development assistance based on economic criteria, nor are they models of
good governance or respect for human rights, so political calculations appear to be at
work. The smaller European powers and Japan are disproportionately dependent upon
Middle Eastern oil, and they may be seeking insurance against a renewed oil embargo,
but it seems unlikely that they are paying for access to oil, which is available at the
prevailing world price on the global market. More likely, they are paying for preferred
treatment of national oil companies. The amounts of aid that OPEC countries receive are
not substantial. France, Germany and the European Union give less aid to OPEC

14
members than to non-members in absolute terms—on average 32 percent, 77 percent, and
49 percent less, respectively—and those figures would be lower as shares of GDP.
The third cluster of significant variables captures public goods with security
externalities: alliances, voting in the United Nations, colonial ties and membership in
post-colonial international organizations. These results are presented in Table 3. [Table
3 about here.] These strategic ties play an important role in determining the distribution
Table 3: Effects of Strategic Variables (Security Externalities)Aid receipt (probit) and aid amounts (OLS)
dF/dx p Coeff. p dF/dx p Coeff. p dF/dx p Coeff. p dF/dx p Coeff. pStd. Err. Std. Err. Std. Err. Std. Err. Std. Err. Std. Err. Std. Err. Std. Err.
U.S. -68.3% 0.00 -11.50 0.64 27.6% 0.00 -40.45 0.03 5.6% 0.07 -16.79 0.07 1.7% 0.57 -5.67 0.519.7% 24.28 5.5% 18.76 2.9% 9.37 2.9% 8.61
France -9.8% 0.01 -2.42 0.60 11.3% 0.00 -10.78 0.04 -1.6% 0.35 7.28 0.00 -3.6% 0.02 -1.81 0.304.0% 4.65 3.7% 5.17 1.9% 2.27 1.7% 1.76
UK 2.6% 0.49 -5.54 0.03 1.5% 0.62 1.00 0.71 -0.1% 0.93 -1.07 0.33 5.5% 0.00 6.13 0.003.7% 2.51 3.0% 2.64 1.2% 1.09 1.5% 1.10
Germany -1.6% 0.02 -28.91 0.06 0.4% 0.59 72.47 0.00 0.0% 0.92 -10.57 0.12 0.0% 0.99 0.99 0.871.2% 15.44 0.8% 17.92 0.3% 6.86 0.3% 5.88
Japan -2.7% 0.60 10.67 0.28 7.5% 0.13 -20.98 0.11 2.6% 0.14 6.82 0.13 6.2% 0.00 -4.36 0.225.0% 9.90 4.9% 13.13 1.6% 4.48 1.4% 3.55
EU 1.1% 0.00 8.24 0.24 0.7% 0.03 8.77 0.28 0.3% 0.01 -3.23 0.35 0.4% 0.00 2.16 0.431.0% 7.08 0.7% 8.05 0.3% 3.44 0.4% 2.76
Alignment UN voting French Colony CommonwealthPr(Aid) Amount Pr(Aid) AmountPr(Aid) Amount Pr(Aid) Amount
of aid, but the pattern of effects varies across donors. Alliances are measured by the S-
score capturing the similarity of two profiles of alliance memberships, ranging from –1
(opposite alignment) to 1 (perfectly congruent alignment). In a series of specifications
that are not reported, I found that the only alignment that affects the aid given by any
donor is that with the United States. French aid is unaffected by the degree to which the
recipient is aligned with France, for example, and British aid is unaffected by the degree
of the recipient’s alignment with Britain. However, the United States appears to
condition its aid on how closely the recipient is aligned with the United States, and so do
Britain, France, Germany and the EU. This is an interesting commentary on the post-

15
Cold War international system, in which only one strategic alignment has any real
significance. The countries that are most likely to receive aid and that receive the most
are those that are least closely aligned with the United States. This supports the
interpretation that aid is used by buy influence, rather than simply to reward close friends.
Influence need not be bought from close allies, and aid is allocated strategically to
influence those least likely to be cooperative. The EU is the only donor that appears to
favor U.S. allies when choosing aid recipients. For most donors, alignment affects
eligibility for aid rather than its volume, but a one-standard deviation shift in alignment
towards the United States is associated with a decrease of about 1 million dollars in
British aid and about 5.5 million dollars in German aid.
The second strategic variable of interest is voting in the UN General Assembly,
which is captured by an S-score measuring the affinity between the donor’s and the
recipient’s voting patterns. Several studies have found associations between UN voting
and aid from various donors and international institutions (Alesina and Dollar 2000,
Barro and Lee 2002, Oatley and Yackee 2000, Thacker 1999, Stone 2004). Examining
the selection of recipients and the distribution of aid separately, however, reveals an
interesting pattern. When selecting aid recipients, donors uniformly prefer to support
governments with similar policies. Although the United States and its close allies tend to
vote similarly in the UN, the votes cast by each donor are the strongest predictor of which
countries it selects as aid recipients. When determining the distribution of aid among
recipients, however, donors diverge sharply: the United States and France distribute
substantially more aid to recipients that are unsupportive of their positions in the UN,
while Germany distributes more of its aid to recipients that are supportive.

16
Positive associations between UN voting and aid could reflect vote buying, and it
is likely that this occurs on some important votes; since most UN votes are relatively
unimportant to donors, however, these S-scores capture the overall similarities in foreign
policy perspectives between donors and aid recipients. The strong negative associations
between aid and voting similarity with the United States and France, on the other hand,
cannot be explained by vote buying, but are consistent with the strategic logic of
alignment. The United States and France have extensive international commitments, and
they use their aid to purchase acquiescence on a variety of issues that are unrelated to
voting in the United Nations. Countries whose preferences are most divergent demand
the most aid in return for altering their policies, and those that habitually vote in
opposition to the United States or France, respectively, are the ones with the most
divergent preferences. In this view, the difference between U.S. and French aid policies,
on one hand, and German policies, on the other, is the difference between strategic and
sincere aid allocations, which is analogous to the distinction between strategic and
sincere voting. The former donors provide aid to countries when it will be pivotal in
getting them to support their far-flung strategic commitments; the latter have no such
commitments, and give their aid to the regimes that they sincerely regard as most
sympathetic.
The effects of UN voting are net of the effects of alignment, and the different
effects suggest that the two variables are capturing differing aspects of international
politics.6 Alignment captures a crisp political commitment along a single security
dimension, while UN voting captures a more diffuse foreign policy posture on a
constantly shifting agenda. Whereas alliances, once made, constrain both actors and 6 The correlation of the two measures among aid recipients is .16
17
reduce the incentives to reward compliance, UN voting is a less predictable form of soft
cooperation that better measures the similarity in countries’ foreign policy preferences.
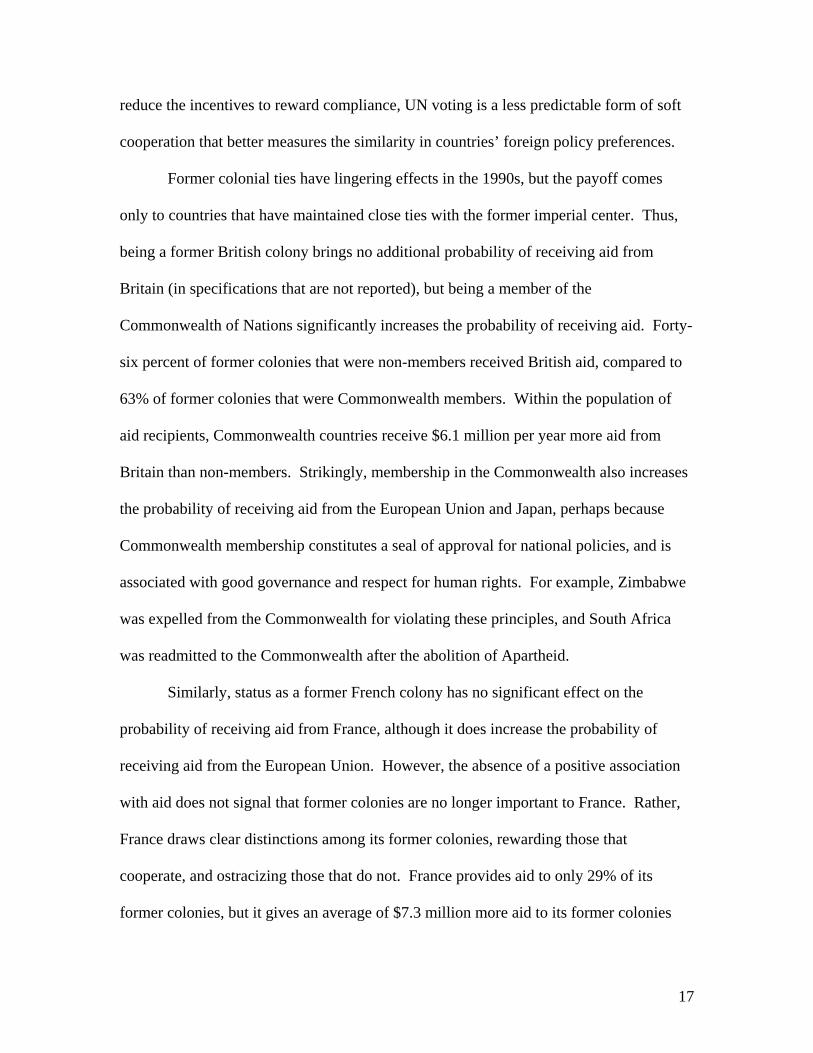
Former colonial ties have lingering effects in the 1990s, but the payoff comes
only to countries that have maintained close ties with the former imperial center. Thus,
being a former British colony brings no additional probability of receiving aid from
Britain (in specifications that are not reported), but being a member of the
Commonwealth of Nations significantly increases the probability of receiving aid. Forty-
six percent of former colonies that were non-members received British aid, compared to
63% of former colonies that were Commonwealth members. Within the population of
aid recipients, Commonwealth countries receive $6.1 million per year more aid from
Britain than non-members. Strikingly, membership in the Commonwealth also increases
the probability of receiving aid from the European Union and Japan, perhaps because
Commonwealth membership constitutes a seal of approval for national policies, and is
associated with good governance and respect for human rights. For example, Zimbabwe
was expelled from the Commonwealth for violating these principles, and South Africa
was readmitted to the Commonwealth after the abolition of Apartheid.
Similarly, status as a former French colony has no significant effect on the
probability of receiving aid from France, although it does increase the probability of
receiving aid from the European Union. However, the absence of a positive association
with aid does not signal that former colonies are no longer important to France. Rather,
France draws clear distinctions among its former colonies, rewarding those that
cooperate, and ostracizing those that do not. France provides aid to only 29% of its
former colonies, but it gives an average of $7.3 million more aid to its former colonies

18
than to other countries, if it chooses to grant them aid. The European Union follows the
French lead on whether to grant aid to former French colonies. Indeed, within the set of
former French colonies, receiving aid from France appears to be necessary and sufficient
in order to receive aid from the European Union.
In summary, aid is motivated by humanitarian, economic and strategic interests,
but the humanitarian impulse is the weakest. The reasons for providing aid to particular
countries vary substantially depending upon the donor. The continental European and
Japanese aid strategies emphasize commercial and financial interests, while U.S. and
French aid emphasize geopolitical concerns. These conclusions may lead to pessimistic
expectations about the effectiveness of aid, but they suggest that using the differences
among the donors to gain explanatory leverage is a promising strategy.
Effects of foreign aid
In order for foreign aid to promote economic development, it must create
incentives for governments to pursue growth-friendly public policies. Every leader faces
a trade-off between providing public goods, such as fair and efficient administration,
infrastructure, public health and education, and providing private goods for his or her
elite allies and personal consumption. Particularly in authoritarian systems, the
incentives to divert public funds from socially beneficial uses may be intense (Bueno de
Mesquita et al. 2003). Consequently, in the absence of strong incentives created by the
donor, foreign aid money should not be expected to promote development. Furthermore,
there are reasons to expect foreign aid to have negative consequences for growth. By
expanding the distributive functions of the state, aid creates new and enhanced incentives

19
for rent seeking, and promotes corruption (Knack 2001). By making the state a more
valuable prize, aid increases the incentives for military officers to attempt coups, and for
guerrilla leaders to launch rebellions. By strengthening the position of the incumbent, it
prevents bad policies from leading to leadership turnover, which would otherwise lead to
improved policies. If aid fails to actively promote growth because it is not connected
with credible incentives to pursue growth-friendly policies, there is reason to expect it to
be counterproductive rather than neutral.
The previous section demonstrated that aid is allocated primarily to meet the
donors’ economic and strategic priorities rather than the recipients’ development needs,
so we expect conditionality to be weak. The reasons for allocating aid differ sharply
among donors, however, so aid from different donors may have different effects. In
particular, the aid provided by two donors, the United States and France, is significantly
motivated by security externalities, which suggests that in some cases these donors may
have long term interests in promoting development. I hypothesize that whether a donor’s
security interests translate into a credible commitment to development depends upon the
capacity of the recipient government. Very weak governments are at risk of collapse, so
aid cannot credibly be withheld to sanction non-compliance, and the incentives for
recipients to carry out politically risky reforms are weak. High-capacity governments, on
the other hand, can be credibly threatened, and have stronger incentives to comply. The
development effects of aid should interact with institutional capacity, and the interaction
should be most important when the donor has a long-term strategic interest in the client
state.

20
A problem with all commonly used measures of administrative capacity is that
they are systematically missing for the countries with the lowest capacity. Consequently,
the measure of administrative capacity used here is derived from missing data: it
captures the degree to which countries collect and report financial data (Stone 2008).7
This variable is derived from the pattern of missing data in the information reported to
the IMF and published in International Financial Statistics. For each of eighteen key
variables, I coded a dummy variable to take the value 1 if data were missing in a given
month and 0 otherwise.8 Principal components analysis was used to extract the common
factor associated with failure to report data, and the result was normalized to [0,1], where
high values represent high capacity. This capacity measure was interacted with aid in the
regressions presented below.
Estimation results
There is an extensive literature on the determinants of economic growth. Without
attempting to survey this literature here, I build a model that incorporates several strands.
Growth is assumed to depend upon domestic investment and foreign direct investment, to
have historical dynamics (hence a lagged dependent variable and its square), and to
7 Alternatively, this could be regarded as a measure of the degree to which governments deliberately hide information in order to evade accountability (Bueno de Mesquita et al., 2003). Two considerations argue against this interpretation. First, reporting data of this sort is a significant administrative task, which represents a difficult hurdle for many developing countries. Second, if leaders are determined to hide their corrupt behavior, it would be preferable to falsify the data that they report than to fail to collect them. The data are an important administrative resource, and while international agencies generate incentives to report data, they do not enforce accurate reporting. The IMF does not attempt to verify the data submitted by member governments except when they represent performance criteria under IMF programs, and in those cases failing to report data is not an attractive option. 8 The eighteen variables were: imports, exports, current account, the interest rate on treasury bills, the change in the money supply (M1), the exchange rate, international reserves, inflation, aggregate domestic credit, claims on the central government, central bank claims on the central government, central bank foreign liabilities, budget balance, net domestic borrowing, net foreign borrowing, foreign debt, commercial bank foreign liabilities and commercial bank reserves.

21
depend upon openness to the international economy (trade/GDP). Following recent
papers, I allow growth to depend upon inflation and foreign debt. In addition, growth is
assumed to depend upon international and civil conflict and democracy (Przeworski et al.
2000). I include a fixed effect for sub-Saharan Africa, and since the data cover the
1990s, another for the East Asian crisis. Each of these factors helps to explain growth in
more limited specifications, but not all are significant in the composite model. Finally, I
expect that growth should depend upon the institutional capacity of the state to perform
administrative tasks and provide public goods (Easterly 2001, Stiglitz 2002), and that the
effectiveness of international aid flows depends upon institutional capacity, so I include
an interaction term between aid and missing data.
Table 4 presents the results of Heckman selection models regressing growth on a
common set of control variables, aid as a proportion of GDP from each of six donors,
missing data, and an interaction between missing data and aid [Table 4 about here]. The
interpretation of the effect of aid is not straightforward because of the interaction with
capacity, and this is discussed below, but the table reveals several conclusions. The
results show that missing data are a strong predictor of (poor) economic growth. The
effects of foreign aid depend critically upon the institutional capacity of the recipient, and
those interaction effects vary substantially across the six donors.
The tests of significance reported in Table 4 for the effects of aid flows are valid
only in the case where capacity takes a value of zero, so Table 5 presents the
corresponding tests while allowing the interaction term to vary and explores the
substantive effects of aid at various levels of capacity. [Table 5 about here.] Reading
down the rows of the table, one finds the results of linear Wald tests of the hypothesis

22
that the effect of aid/GDP from a particular donor plus the interaction term with missing
data is indistinguishable from zero when capacity measured in terms of missing data is at
its mean, one standard deviation below its mean, and one standard deviation above its
mean.
Table 5: Substantive Effects of Aid on Growth U.S. France UK Germany Japan EU Coef. p Coef. p Coef. p Coef. p Coef. p Coef. p Capacity:
Low -1.86 0.01 3.45 0.10 -0.35 0.88 -3.17 0.11 6.19 0.80 -0.53 0.43 0.65 2.12 2.31 2.00 24.00 0.66
Mean -0.75 0.01 4.08 0.01 0.14 0.97 -1.83 0.25 2.97 0.78 -0.66 0.29 0.30 1.67 4.26 1.61 10.71 0.62
High 0.30 0.01 4.67 0.01 0.62 0.93 -0.56 0.75 -0.09 0.96 -0.79 0.34 0.11 1.89 6.55 1.72 1.98 0.83 Note: Effect of aid/GDP (%) on change in GDP (%), conditional on capacity, standard errors in italics. "Low" and "High" indicate one standard deviation below and above the mean, respectively.
U.S. foreign aid has significant effects, but the benefits are strictly limited to
countries that are well governed; the effect of U.S. aid on low-capacity countries is to
retard growth. When the degree of missing data is distinctly below average, U.S. foreign
aid has significant positive effects on growth. Foreign aid worth one percent of GDP
produces 0.3 percentage points of growth. An increase in aid of one standard deviation
(3.4% of GDP) increases growth by 1% per year. This effect drops off as governance
deteriorates, and by the time the level of missing data reaches the mean, the effect has
switched signs: U.S. foreign aid has a highly significant effect that retards growth. At
average levels of capacity, aid worth 1% of GDP reduces growth by 0.75% of GDP, and
at one standard deviation below the mean, the same aid volume reduces growth by almost
2% of GDP. This indicates that U.S. foreign aid—unlike that of the Europeans—is

23
unsuccessful at overcoming governance problems, building institutional capacity, and
promoting reform. When it falls on fertile soil, U.S. aid can promote economic growth,
albeit very inefficiently; when it falls into hands that lack the capacity or the will to
provide public goods, it exacerbates these governance problems and restrains growth.
This is consistent with the interpretation that countries that routinely receive large
amounts of U.S. aid are unfettered by credible conditionality—their leaders know that aid
is tied to their foreign policies rather than their domestic ones—so aid fails to promote
growth-oriented reform. To the contrary, when leaders know that they are too important
to U.S. policies for the United States to allow them to fail, aid creates moral hazard
problems and perpetuates the rule of corrupt regimes.
French aid exhibits the same interactive effect, producing the most growth in
high-capacity countries, but its effect on growth is positive even at mean levels of
capacity, and French aid has insignificant effects on growth rather than negative ones at
low levels of capacity. This is consistent with the observation that French aid policy, at
least since France dismantled its colonies, has been less apt to become captured by
corrupt regimes. As noted above, France draws sharp distinctions among its former
colonies, rewarding some for their cooperation and ostracizing others. Nevertheless,
France has pursued a long-term strategy of state building and influence expansion in sub-
Saharan Africa. This policy has gone so far as to create and subsidize common currency
areas, and France plays a special role as mediator between these countries and the
international financial institutions, the World Bank and the IMF. French aid has
markedly higher productivity than U.S. aid: one percentage point of GDP in French aid
is associated with over four percentage points of growth at average and high levels of

24
capacity. This presumably reflects the extreme poverty of the African countries that are
the major recipients of French aid, where small amounts of foreign financing have
substantial buying power. However, it is not the case that French aid has a larger impact
on development than U.S. aid in the aggregate when capacity is high. French aid
averages less than 0.04 percent of GDP in recipient countries, with a standard deviation
of 0.55 percent, compared to U.S. aid that averages 0.16 percent of recipient GDP, with a
standard deviation of 3.4 percent. The uncertainty of the point estimate of the substantive
effect of French aid, combined with the larger scale of U.S. aid, ensures that the 95
percent confidence intervals of the effect of French and U.S. aid overlap. In other words,
the results cannot reject the hypothesis that U.S. aid plays at least as large a role in
promoting development as French aid in high-capacity countries, although it takes more
U.S. aid to produce the same effects.
Aid from the other donors has no statistically significant effects on growth. This
suggests that aid from these countries is not accompanied by substantial conditionality.
Recall that Germany and Japan were the two countries that focused their aid most single-
mindedly on promoting domestic economic interests. Both provide significantly more
aid to countries that have substantial debt exposure in their currencies, and Germany is
more likely to provide aid to countries in that case. Both provide substantially more aid
to countries that are in arrears on their debts in order to encourage repayment. Both
provide substantially more aid to countries that import their products, and Japan is more
likely to provide aid to countries that represent import markets. On the other hand, both
countries are significantly less likely to provide aid to democracies than to non-
democracies. Both provide aid to relatively wealthy members of OPEC. The effects of

25
geography, again, seem to follow economic interests. Both countries channel aid
disproportionately to future EU accession states, which are important export markets and
investment sites, but not to the less lucrative former Soviet republics (aside from Russia,
in the German case). Recipients of German and Japanese aid apparently recognize that
their good fortune relies on geography, trade and financial ties rather than on carrying out
economic reform, and they behave accordingly.9
To summarize, the results of growth equations lead to three main conclusions.
First, foreign aid can benefit development, but aid can also be highly counterproductive.
Second, the effects of foreign aid depend critically upon institutional capacity. When the
recipient’s institutional capacity is low, foreign aid can aggravate domestic governance
problems, with negative effects upon growth. Third, the effects of a dollar of foreign aid
differ substantially depending upon the donor, indicating that the reasons for giving aid
may be more important to development than the quantity of aid. U.S. and French aid,
which were motivated by long-term security externalities, were most effective at
stimulating growth. However, these were also the cases where institutional capacity
played the greatest role: low institutional capacity rendered aid ineffective in the French
case and counterproductive in the U.S. case. Aid effectiveness is correlated with the
politics of aid distribution, which directs attention to the credibility of the conditionality
contract.
9 Given the importance of Russia as a recipient of German aid and Russia’s lackluster economic performance in the 1990s, one might suspect that Germany’s poor record of promoting development is due to Russia. Dropping Russia from the sample did not change the qualitative effects of German aid on growth, however.

26
Conclusions
Although the evidence presented here diverges from much of the aid literature in
finding positive effects of development aid on growth, it nevertheless confirms important
features of that literature’s pessimistic consensus. I find that aid can promote economic
development, but its effectiveness depends critically on the institutional capacity of the
recipient country and the motivations of the donor. Development aid is generally less
effective when government capacity is low, and it can become counterproductive.
Indeed, the mechanism that leads aid to be ineffective for development appears to be that
aid from most donors exacerbates the governance problems in poor countries, magnifying
the development-retarding impact of weak state capacity.
The selection of aid recipients and the distribution of aid among them provides
evidence that aid is not intended primarily as an instrument to promote economic
development. Aid is highly politicized. It is directed to client states, to countries that are
judged to be susceptible to foreign influence, to countries that represent important export
markets, and to countries that owe substantial amounts of debt to domestic financial
institutions. There is evidence of humanitarian motivations for providing aid, but such
public good-motivated aid is generally underprovided, and the evidence is that it accounts
for a small fraction of development aid. The story of foreign aid distribution is
overwhelmingly a story of donors promoting their own national interests, and this surely
limits the effectiveness of foreign aid. The reasons for giving aid are quite diverse.
Some donors, such as Britain and the European Union, are highly concerned with
humanitarian crises and the alleviation of poverty; Germany, France and Japan pursue
commercial and financial interests; France and Britain direct aid to subsets of their

27
former colonies that continue to cooperate with their policies and objectives. The United
States has so skewed its aid distribution to reflect foreign policy priorities that it gives
more money to wealthier countries than to poor ones.
The development effects of foreign aid are correspondingly diverse. British,
German, Japanese and EU aid have no significant effects; French aid has significant
growth-promoting effects, but these effects decline and eventually become insignificant
as capacity falls; U.S. aid has significant positive effects only at above-average levels of
capacity, and becomes counterproductive when administrative capacity is average or low.
These differences appear to be consistent with the differing agendas that lead different
donors to distribute development assistance. The donors that are most successful at
promoting development, the United States and France, are those that are most strongly
motivated by security externalities. These security externalities provide incentives for
donors to take a long-term view of aid relationships and use their aid to create incentives
for real development. However, these security concerns also hold aid policies hostage to
short-term concerns about the survivability of favored regimes in low-capacity countries,
which renders the effort to create incentives for economic reform incredible. Low
capacity undermines the effectiveness of aid in the presence of security externalities, and
in extreme cases makes aid highly counterproductive, promoting corruption and ensuring
the survival of predatory regimes. Aid effectiveness is correlated with the politics of aid
distribution.
This study focused on the interregnum between the Cold War and the War on
Terror because this was the period in which geopolitical influences were weakest. For
example, the United States cut aid to the corrupt and repressive government of Zaire

28
when it was no longer needed as a Cold War ally, and had not yet begun to funnel aid to
the failed states of Afghanistan and Iraq. This should make the 1990s the decade in
which it is hardest to find evidence that aid policies are shaped by foreign policy
objectives, but the evidence is nevertheless clear that these agendas were active. On the
other hand, if the distraction of security concerns were the major obstacle to effective
development assistance, the 1990s should have been a good decade for aid effectiveness.
The weak and insignificant effects of aid flows from Britain, Germany, Japan and the EU
suggest that this is not the case. A pessimistic conclusion of this analysis is that donors
appear to require a strong security motivation to make their aid effective at promoting
development, but an optimistic result is that they are able to promote development when
the incentive is strong. Unfortunately, security externalities appear to lead to successful
aid policies only when the recipients have high-capacity governments, where donors can
credibly threaten to withhold the aid. When aid recipients can credibly threaten to
collapse when aid is withdrawn, and security concerns are binding, aid has
counterproductive effects for development. These conclusions suggest that expectations
for development aid should be very modest as long as U.S. foreign policy remains
focused on rebuilding failed states in the Middle East.

29
References
Alesina, Alberto, and David Dollar. 2000. “Who Gives Aid to Whom and Why?” Journal of Economic Growth 5 (March): 33-63. Alesina, Alberto, and Beatrice Weder. 2002. “Do Corrupt Governments Receive Less Foreign Aid?” The American Economic Review 92 (4): 1126-38. Azam, Jean-Paul and Jean-Jacques Laffont. 2003. “Contracting for Aid.” Journal of Development Economics 70 (1): 25-58. Barro, Robert J., and Lee, Jong-Wha. 2002. IMF Programs:Who Is Chosen and What Are the Effects? NBER WP 8951. Boone, Peter. 1996. “Politics and the Effectiveness of Foreign Aid.” European Economic Review 40 (2): 289-329. Bräutigam, Deborah A., and Stephen Knack. 2004. Foreign Aid, Institutions, and Governance in Sub-Saharan Africa. Economic Development and Cultural Change 52: 255-285. Burnside, Craig and David Dollar. 2000. “Aid, Policies and Growth.” American Economic Review 90 (September): 847-68. Cashel-Cordo, Peter and Steven Craig. 1997. Donor Preferences and Recipient Fiscal Behavior: A Simultaneous Analysis of Foreign Aid. Economic Inquiry 35: 653-671. Collier, Paul and David Dollar. 2002. “Aid Allocation and Poverty Reduction.” European Economic Review 46 (8) (September): 1475-1500. Connolly, Barbara, and Martin List. “Nuclear Safety in Eastern Europe and the Former Soviet Union,” in Keohane, Robert O. and Marc A. Levy. Institutions for Environmental Aid: Pitfalls and Promise. Cambridge: MIT Press, 1996. Dalgard, Carl-Johan, and Henrik Hansen. 2000. “On Aid, Growth, and Good Policies. The Journal of Development Studies 37 (6) (August): 17-42. Darst, Robert G. 2001. Smokestack Diplomacy: Cooperation and Conflict in East-West Environmental Politics. Cambridge, Mass.: MIT Press, 2001. Doucouliagos, H. and Paldam, M. 2008. Aid Effectiveness on Growth: A Meta Study. European Journal of Political Economy 24 (1) (March): 1-24. Easterly, William. 2001. The Elusive Quest for Growth: Economists’Adventures and Misadventures in the Tropics. Cambridge, MA: MIT Press.

30
Easterly, William, Ross Levine, and David Roodman. 2004. “Aid, Policies, and Growth: Comment.” American Economic Review 94 (3) (June): 774-80. Goldsmith, Arthur A. 2001. “Foreign Aid and Statehood in Africa.” International Organization 55 (1) (Winter): 123-48. Grossman, Gene M., and Elhanan Helpman. “Protection for Sale.” The American Economic Review, 84 (4) (Sept., 1994): 833-850. Keohane, Robert O. and Marc A. Levy. 1996. Institutions for Environmental Aid: Pitfalls and Promise. Cambridge: MIT Press. Knack, Stephen. 2001. Aid Dependence and the Quality of Governance: A Cross-Country Empirical Analysis. World Bank Working Paper. Maizels, Alfred, and Machiko K. Nissanke. 1984. Motivations for Aid to Developing Countries. World Development 12 (9) (September): 879-900. Martens, Bertin, Uwe Mummert, Peter Murrell, and Paul Seabright. 2001. The Institutional Economics of Foreign Aid. Cambridge: Cambridge University Press. Neumayer, Eric. 2003. Do Human Rights Matter in Bilateral Aid Allocation: A Quantitative Analysis of 21 Donor Countries. Social Science Quarterly 84 (3) (September): 650-66. Oatley, Thomas, and Jason Yackee. 2004. American Interests and IMF Lending. International Politics 41 (September): 415-429. Pietrobelli, C. and C. Scarpa 1992. Inducing Efficiency in the Use of Foreign Aid—the Case for Incentive Mechanisms. Journal of Development Studies 29 (1): 72-92. Przeworski, Adam, Michael E. Alvarez, Jose Antonio Cheibub, and Fernando Limongi. 2000. Democracy and Development: Political Institutions and Well-Being in the World, 1950–1990. Cambridge: Cambridge University Press. Rodrik, Dani. 1995. Why is There Multilateral Lending? In Boris Pleskovic and Michael Bruno, Eds., Annual World Bank Conference on Development Economics 1995. Washington, DC: World Bank. Morgenthau, Hans. A Political Theory of Foreign Aid. American Political Science Review 56 (2) (June 1962): 301-09. Schraeder, Peter J., Steven W. Hook and Bruce Taylor. 1998. Clarifying the Foreign Aid Puzzle: A Comparison of American, Japanese, French and Swedish Aid Flows. World Politics 50 (2) (January): 294-323.
31
Stiglitz, Joseph E. 2002. Globalization and Its Discontents. NewYork: W. W. Norton. Stone, Randall W. Lending Credibility: The International Monetary Fund and the Post-Communist Transition (Princeton: Princeton Univ. Press, 2002). Stone, Randall W. 2004. The Political Economy of IMF Lending in Africa. American Political Science Review 98:577-591. Svensson, Jakob. 1999. Aid, Growth and Democracy. Economics and Politics 11 (3) (November): 275-97. Svensson, Jakob. 2003. Why Conditional Aid Does Not Work and What Can Be Done About It? Journal of Development Economics 70 (2): 381-402. Thacker, Strom C. 1999. The High Politics of IMF Lending. World Politics 52 (October): 38-75. Tomz, Michael. 2007. Reputation, Debt, and International Cooperation: Sovereign Debt Across Three Centuries. Princeton: Princeton University Press.

32
Table 4: Effects of Foreign Aid on GrowthFIML Heckman Selection Model Estimates
U.S. France UK Germany Japan EU
Coef. p Coef. p Coef. p Coef. p Coef. p Coef. pStd. Err. Std. Err. Std. Err. Std. Err. Std. Err. Std. Err.
Growth(t-1) 0.30 0.00 0.30 0.00 0.34 0.00 0.29 0.00 0.27 0.00 0.29 0.00
0.03 0.02 0.03 0.02 0.02 0.02Growth2
(t-1) 0.0045 0.00 0.0038 0.00 0.0085 0.00 0.0040 0.00 0.0044 0.00 0.0038 0.000.0008 0.0008 0.0011 0.0008 0.0008 0.0008
GDP per cap -0.0004 0.00 -0.0002 0.01 -0.0004 0.00 -0.0002 0.04 -0.0001 0.10 -0.0003 0.020.0001 0.0001 0.0001 0.0001 0.0001 0.0001
Trade (% GDP) -0.0088 0.12 -0.0112 0.02 -0.0079 0.09 -0.0093 0.05 -0.0077 0.09 -0.0113 0.020.0056 0.0048 0.0046 0.0046 0.0046 0.0047
FDI (% GDP) 0.07 0.15 0.08 0.01 0.06 0.04 0.07 0.01 0.07 0.01 0.08 0.000.04 0.03 0.03 0.03 0.03 0.03
Investment 0.03 0.24 0.07 0.00 0.09 0.00 0.07 0.00 0.08 0.00 0.07 0.00(%GDP) 0.02 0.02 0.02 0.02 0.02 0.02
Inflation -0.0010 0.00 -0.0012 0.00 -0.0011 0.00 -0.0010 0.00 -0.0013 0.00 -0.0010 0.00(annual CPI) 0.0003 0.0003 0.0003 0.0003 0.0003 0.0003
Short-term debt 0.06 0.00 0.05 0.00 0.04 0.00 0.03 0.01 0.03 0.01 0.05 0.00(%) 0.02 0.01 0.01 0.01 0.01 0.01
For. debt/GDP -0.0006 0.15 -0.0036 0.01 -0.0001 0.89 0.0009 0.68 -0.0006 0.28 0.0004 0.440.0004 0.0014 0.0006 0.0021 0.0005 0.0006
War -0.22 0.85 -0.24 0.83 -0.30 0.78 -0.33 0.76 0.07 0.95 -0.52 0.631.18 1.11 1.07 1.08 1.11 1.08
Civil War -2.26 0.00 -2.48 0.00 -1.96 0.00 -1.98 0.00 -2.08 0.00 -2.29 0.000.61 0.58 0.56 0.57 0.55 0.57
Polity 0.00 0.96 -0.03 0.23 0.01 0.67 -0.04 0.17 -0.03 0.27 -0.03 0.230.03 0.03 0.03 0.03 0.03 0.03
Sub-Sah. Africa 0.05 0.90 0.00 1.00 0.13 0.71 0.02 0.95 0.00 1.00 0.02 0.950.39 0.37 0.36 0.35 0.35 0.35
Aid/GDP -2.74 0.00 2.96 0.29 -0.75 0.74 -4.24 0.10 8.76 0.80 -0.42 0.630.94 2.78 2.23 2.54 34.60 0.87
Aid x Capacity 3.04 0.00 1.71 0.59 1.37 0.85 3.68 0.16 -8.85 0.81 -0.37 0.760.99 3.13 7.17 2.64 36.54 1.22
Capacity 5.25 0.00 7.06 0.00 5.59 0.00 5.76 0.00 7.02 0.00 5.67 0.001.04 0.98 1.00 0.98 1.09 1.00
E. Asian Crisis -0.70 0.22 -0.93 0.09 -0.33 0.53 -1.13 0.03 -1.09 0.04 -0.99 0.060.57 0.55 0.52 0.53 0.52 0.53
Constant -3.50 0.00 -5.54 0.00 -5.38 0.00 -4.15 0.00 -5.53 0.00 -4.13 0.001.12 1.02 1.04 1.02 1.10 1.04
Number of obs 1672 1521 1584 1508 1503 1567Censored 520 208 322 178 188 245Uncensored 1152 1313 1262 1330 1315 1322Pr(indep eqns) 0.004 0.004 0.00 0.02 0.09 0.06

33
Appendix: Additional Tables
Table A1: Selection of Aid RecipientsProbit estimates
U.S. UK France Germany Japan EU
dF/dx p dF/dx p dF/dx p dF/dx p dF/dx p dF/dx pStd. Err. Std. Err. Std. Err. Std. Err. Std. Err. Std. Err.
Land area, mln m2 -1.2E-04 0.26 6.8E-05 0.22 -3.6E-05 0.46 -4.3E-06 0.63 5.1E-05 0.40 -1.6E-06 0.721.1E-04 5.7E-05 4.9E-05 9.4E-06 6.1E-05 4.6E-06
Population, mln 6.4E-05 0.54 -1.1E-05 0.83 1.3E-05 0.78 -1.1E-07 0.99 -1.5E-04 0.02 -7.7E-07 0.861.0E-04 5.3E-05 4.7E-05 8.4E-06 6.4E-05 4.5E-06
Arrears, mln 9.2E-07 0.91 4.8E-06 0.21 1.5E-06 0.73 -2.3E-07 0.76 7.0E-07 0.89 -7.3E-08 0.847.7E-06 3.9E-06 4.1E-06 7.6E-07 5.2E-06 3.7E-07
Debt/GDP 1.6E-05 0.60 8.8E-06 0.58 5.8E-06 0.64 6.8E-07 0.69 6.7E-06 0.66 4.2E-07 0.683.0E-05 1.6E-05 1.2E-05 1.7E-06 1.5E-05 1.1E-06
GDP per capita -2.5E-05 0.00 -6.9E-06 0.00 -4.6E-06 0.00 -6.6E-07 0.00 -5.9E-06 0.00 -8.3E-07 0.003.5E-06 1.8E-06 1.2E-06 4.5E-07 1.5E-06 7.6E-07
Civil war 0.03 0.43 0.02 0.20 -0.01 0.44 -0.01 0.04 -0.04 0.05 0.00 0.690.03 0.01 0.02 0.01 0.02 0.00
Interstate war 0.09 0.15 0.03 0.10 0.03 0.21 0.01 0.17 0.04 0.24 0.00 0.220.05 0.01 0.02 0.00 0.02 0.00
Alignment -0.68 0.00 0.03 0.49 -0.10 0.01 -0.02 0.02 -0.03 0.60 0.01 0.000.10 0.04 0.04 0.01 0.05 0.01
Exports 3.2E-05 0.41 1.8E-05 0.87 5.8E-05 0.60 3.4E-06 0.72 3.5E-05 0.18 2.0E-05 0.043.8E-05 1.1E-04 1.1E-04 9.8E-06 2.6E-05 1.9E-05
Distance 1.6E-06 0.81 2.5E-06 0.53 1.3E-05 0.00 1.8E-06 0.03 -8.0E-06 0.08 -5.2E-09 0.996.5E-06 4.0E-06 4.9E-06 1.4E-06 4.5E-06 4.3E-07
Polity 7.9E-03 0.00 8.3E-04 0.33 1.1E-05 0.99 -1.2E-05 0.94 -3.0E-03 0.01 9.2E-05 0.302.2E-03 8.7E-04 9.2E-04 1.7E-04 1.2E-03 1.2E-04
UN voting 0.28 0.00 0.01 0.62 0.11 0.00 0.00 0.59 0.07 0.13 0.01 0.030.05 0.03 0.04 0.01 0.05 0.01
UNHCR 0.04 0.00 0.04 0.00 0.03 0.00 0.01 0.00 0.01 0.00 0.01 0.000.01 0.00 0.00 0.01 0.00 0.01
Debt Exposure 1.7E-04 0.73 -4.3E-04 0.70 1.9E-03 0.01 2.1E-04 0.13 1.6E-04 0.84 1.3E-04 0.034.9E-04 1.1E-03 7.3E-04 1.8E-04 8.2E-04 1.3E-04
French Colony 5.6E-02 0.07 -1.1E-03 0.93 -1.6E-02 0.35 2.7E-04 0.92 2.6E-02 0.14 2.9E-03 0.012.9E-02 1.2E-02 1.9E-02 2.6E-03 1.6E-02 2.8E-03
Commonwealth 0.02 0.57 0.05 0.00 -0.04 0.02 3.1E-05 0.99 0.06 0.00 3.8E-03 0.000.03 0.02 0.02 2.6E-03 0.01 3.7E-03
EU accession -0.07 0.15 0.04 0.01 0.03 0.10 4.2E-03 0.17 0.04 0.03 3.2E-03 0.010.05 0.01 0.01 3.7E-03 0.02 3.1E-03
OPEC -0.32 0.00 -0.02 0.22 0.05 0.00 6.2E-03 0.01 0.05 0.01 -8.8E-03 0.010.06 0.02 0.01 4.3E-03 0.01 7.8E-03
Capacity 0.18 0.00 0.04 0.03 0.01 0.69 3.7E-03 0.35 0.10 0.00 -9.3E-04 0.630.05 0.02 0.02 4.7E-03 0.03 2.0E-03
Correctly Predicted 0.80 0.83 0.89 0.91 0.91 0.90Number of obs 1914 1890 1889 1901 1892 1889Pseudo R2 0.25 0.21 0.13 0.13 0.11 0.27

34
Table A2: Correlates of AidOLS estimates, conditional on receiving aid
U.S. Aid French Aid UK Aid German Aid Japanese Aid EU Aid
Coef. P>t Coef. P>t Coef. P>t Coef. P>t Coef. P>t Coef. P>tStd. Err. Std. Err. Std. Err. Std. Err. Std. Err. Std. Err.
Aidt-1 0.37 0.00 0.71 0.00 0.77 0.00 0.36 0.00 0.74 0.00 0.63 0.000.03 0.02 0.02 0.02 0.02 0.02
Land area, mln m2 0.135 0.00 -0.008 0.13 -0.002 0.59 0.111 0.00 -0.018 0.11 -0.010 0.230.024 0.005 0.003 0.019 0.011 0.008
Population, mln -0.011 0.74 -0.011 0.09 0.021 0.00 -0.031 0.16 0.011 0.47 -0.008 0.420.034 0.007 0.004 0.022 0.015 0.010
Arrears, mln US$ 0.001 0.69 1.4E-04 0.77 9.3E-05 0.70 0.004 0.01 0.002 0.06 0.001 0.420.002 4.6E-04 2.4E-04 0.002 0.001 0.001
Debt/GDP -8.7E-04 0.78 1.4E-04 0.85 6.0E-06 0.99 1.6E-04 0.95 -5.2E-04 0.74 -3.3E-04 0.783.2E-03 7.3E-04 3.7E-04 2.5E-03 1.6E-03 1.1E-03
GDP per capita -2.8E-03 0.07 -5.0E-04 0.01 -6.2E-04 0.00 -7.3E-04 0.25 -7.3E-04 0.10 -1.9E-03 0.001.5E-03 1.9E-04 1.3E-04 6.4E-04 4.4E-04 3.7E-04
Civil war 8.83 0.41 -0.16 0.95 0.58 0.63 -9.55 0.23 7.15 0.16 0.72 0.8410.73 2.32 1.22 8.00 5.10 3.65
Interstate war 7.58 0.73 -6.48 0.15 0.57 0.81 -15.47 0.31 -14.58 0.15 -5.06 0.4821.64 4.47 2.38 15.21 10.22 7.13
Alignment -11.50 0.64 -2.42 0.60 -5.54 0.03 -28.91 0.06 10.67 0.28 8.24 0.2424.28 4.65 2.51 15.44 9.90 7.08
Exports -0.01 0.08 0.12 0.00 0.02 0.03 0.08 0.00 0.02 0.00 0.18 0.000.01 0.01 0.01 0.02 0.01 0.02
Distance -2.9E-03 0.13 -7.3E-04 0.12 1.3E-04 0.63 -3.9E-03 0.02 -4.0E-03 0.00 -2.4E-03 0.001.9E-03 4.7E-04 2.6E-04 1.6E-03 8.6E-04 7.2E-04
Polity 1.35 0.04 -0.14 0.30 0.14 0.06 0.67 0.14 0.55 0.07 0.26 0.230.66 0.14 0.07 0.46 0.30 0.22
UN voting -40.45 0.03 -10.78 0.04 1.00 0.71 72.47 0.00 -20.98 0.11 8.77 0.2818.76 5.17 2.64 17.92 13.13 8.05
UNHCR 1.06 0.02 0.02 0.85 0.24 0.00 0.28 0.43 0.69 0.00 0.94 0.000.46 0.10 0.05 0.35 0.22 0.16
Debt Exposure 0.10 0.54 0.82 0.00 0.05 0.60 0.56 0.07 1.48 0.00 0.23 0.100.16 0.10 0.10 0.31 0.19 0.14
French Colony -16.79 0.07 7.28 0.00 -1.07 0.33 -10.57 0.12 6.82 0.13 -3.23 0.359.37 2.27 1.09 6.86 4.48 3.44
Commonwealth -5.67 0.51 -1.81 0.30 6.13 0.00 0.99 0.87 -4.36 0.22 2.16 0.438.61 1.76 1.10 5.88 3.55 2.76
EU accession 13.23 0.39 3.58 0.29 -0.79 0.66 -33.05 0.00 -12.68 0.06 27.49 0.0015.28 3.41 1.77 11.47 6.70 5.31
OPEC 6.90 0.74 -8.68 0.00 -0.12 0.95 -23.17 0.02 -3.90 0.52 -16.63 0.0020.88 2.87 1.74 9.56 6.06 5.30
Capacity -5.68 0.73 5.46 0.10 -1.03 0.57 -7.92 0.48 14.91 0.05 -11.17 0.04 16.56 3.35 1.80 11.14 7.70 5.39Constant 39.63 0.11 6.07 0.14 3.90 0.07 28.28 0.02 23.25 0.02 22.14 0.00
24.93 4.08 2.13 12.39 10.03 6.39
Number of obs 1315 1590 1472 1624 1606 1551R-squared 0.68 0.75 0.73 0.35 0.77 0.56